Embed Size (px)
Citation preview
Investor PresentationInvestor Presentation
2
Our Company Our Business Our Industry Growth
Our Financials BEE Our Listing Rationale
Presentation Summary
2
Our CompanyExecutive Summary
• We design and manufacture antennas• Established for 17 years• Revenue CAGR of 50% since 2001• Projected exports > 50%• World class R&D capability• Supported by strong growth in wireless data
markets• Raising of R20m on company value of between
R90m and R110m (Fwd PE of 4.7 and 5.8)
3
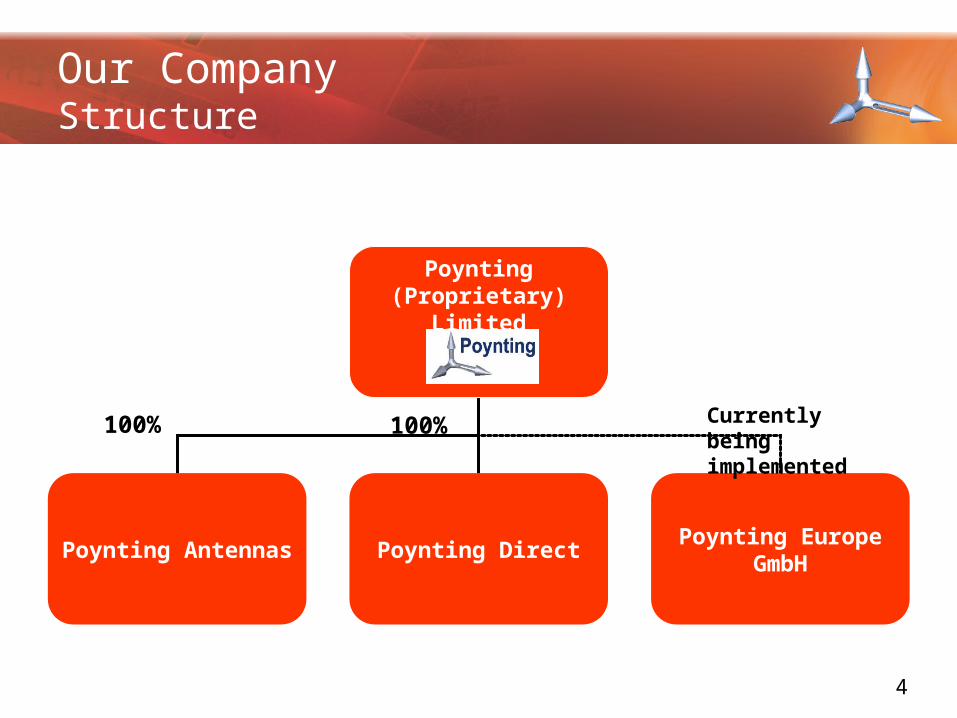
Poynting (Proprietary) Limited
Poynting Antennas Poynting DirectPoynting Europe
GmbH
100%100% Currently being implemented
Our CompanyStructure
4
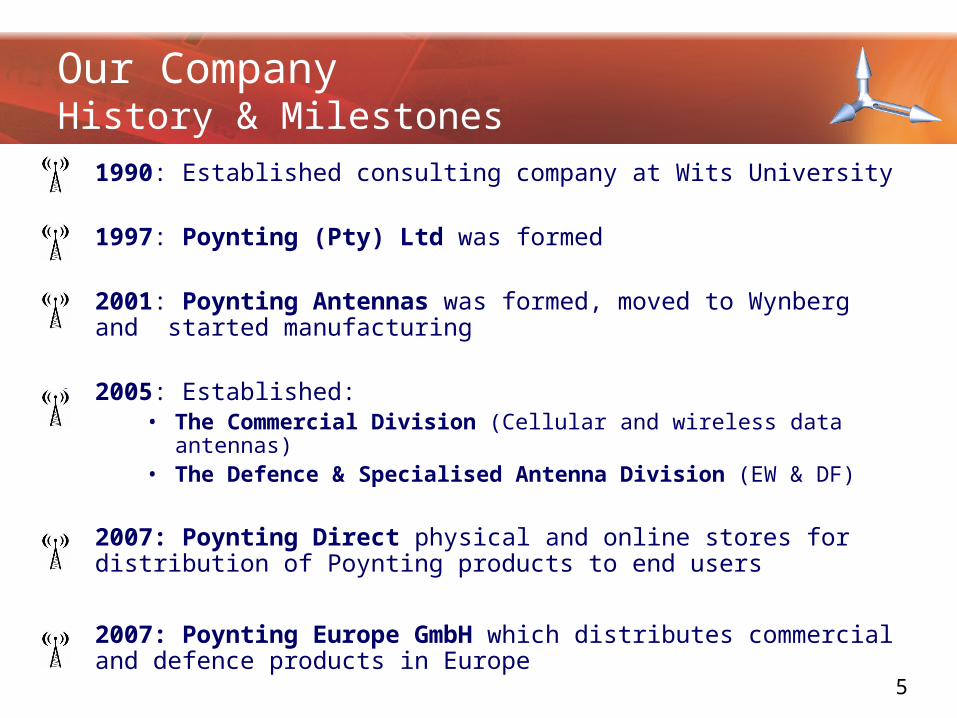
• 1990: Established consulting company at Wits University
• 1997: Poynting (Pty) Ltd was formed
• 2001: Poynting Antennas was formed, moved to Wynberg and started manufacturing
• 2005: Established:• The Commercial Division (Cellular and wireless data antennas)• The Defence & Specialised Antenna Division (EW & DF)
• 2007: Poynting Direct physical and online stores for distribution of Poynting products to end users
• 2007: Poynting Europe GmbH which distributes commercial and defence products in Europe
Our CompanyHistory & Milestones
5
‘Making Wireless Happen’
Our CompanyVision
6
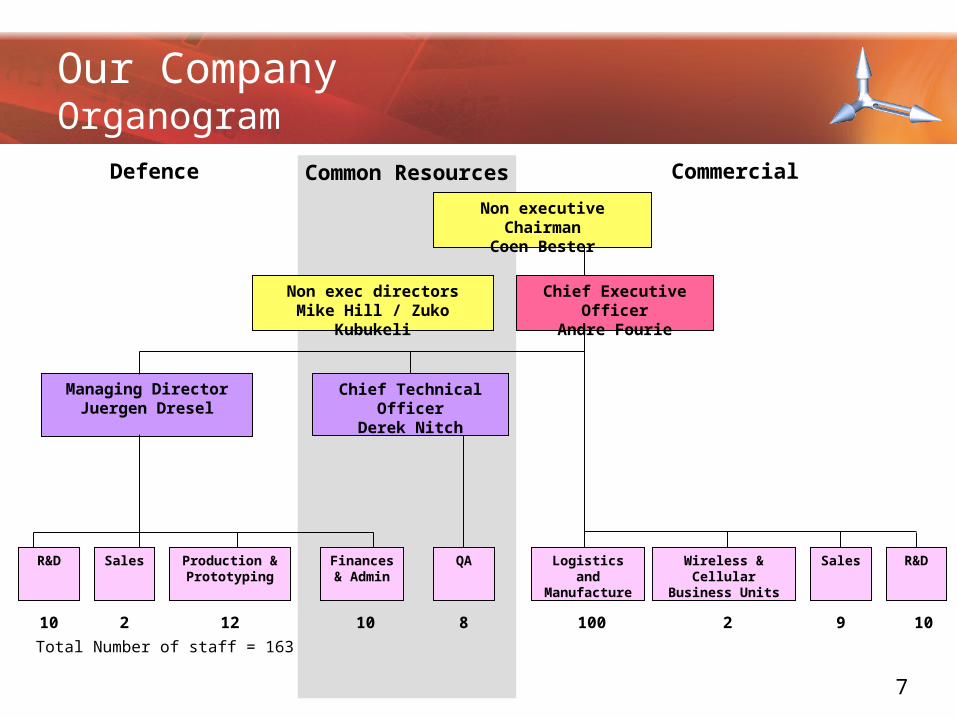
Our CompanyOrganogram
Production & Prototyping
Chief Executive OfficerAndre Fourie
Managing DirectorJuergen Dresel
R&D Wireless & Cellular Business Units
Sales R&D
Non executive ChairmanCoen Bester
Non exec directorsMike Hill / Zuko Kubukeli
Sales Finances & Admin
QA Logistics and Manufacture
Chief Technical OfficerDerek Nitch
1010 12 8 100 92 10
Total Number of staff = 163
2
Defence Common Resources Commercial
7
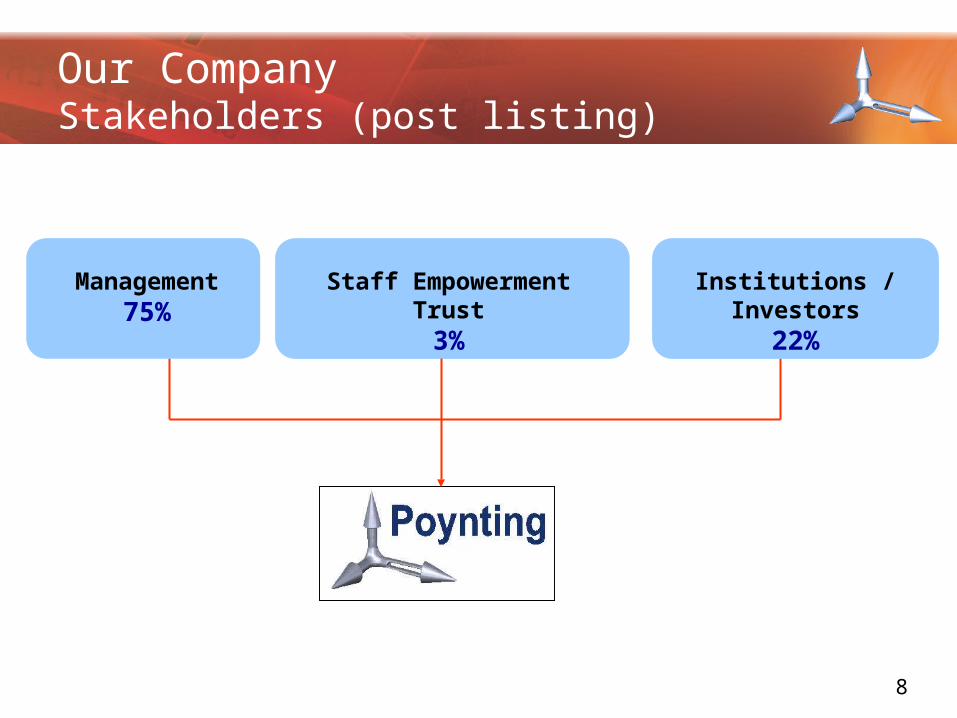
Our CompanyStakeholders (post listing)
Institutions / Investors22%
Staff Empowerment Trust3%
Management75%
8
OUR BUSINESS
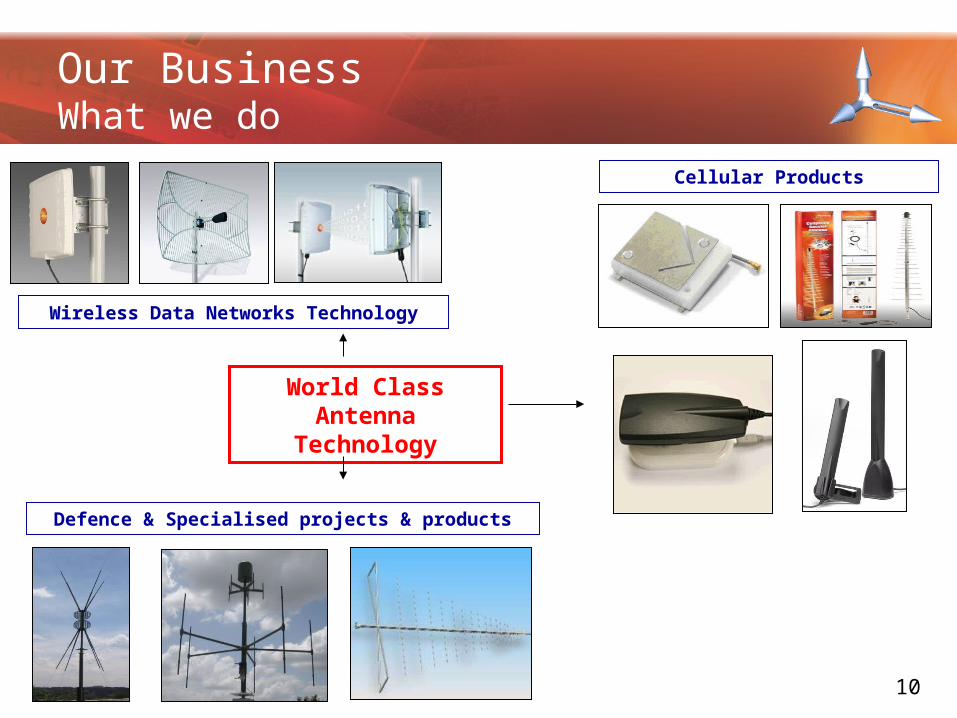
World Class Antenna Technology
Wireless Data Networks Technology
Cellular Products
Defence & Specialised projects & products
Our BusinessWhat we do
10
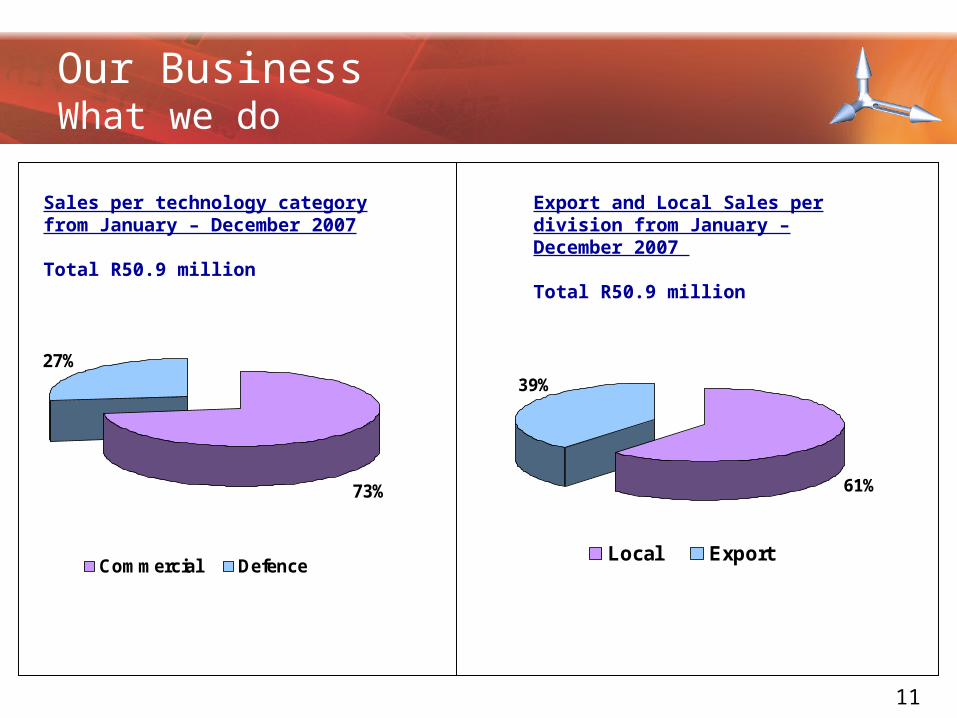
73%
27%
Commercial Defence
Sales per technology category from January – December 2007
Total R50.9 million
61%
39%
Local Export
Export and Local Sales per division from January – December 2007
Total R50.9 million
Our BusinessWhat we do
11
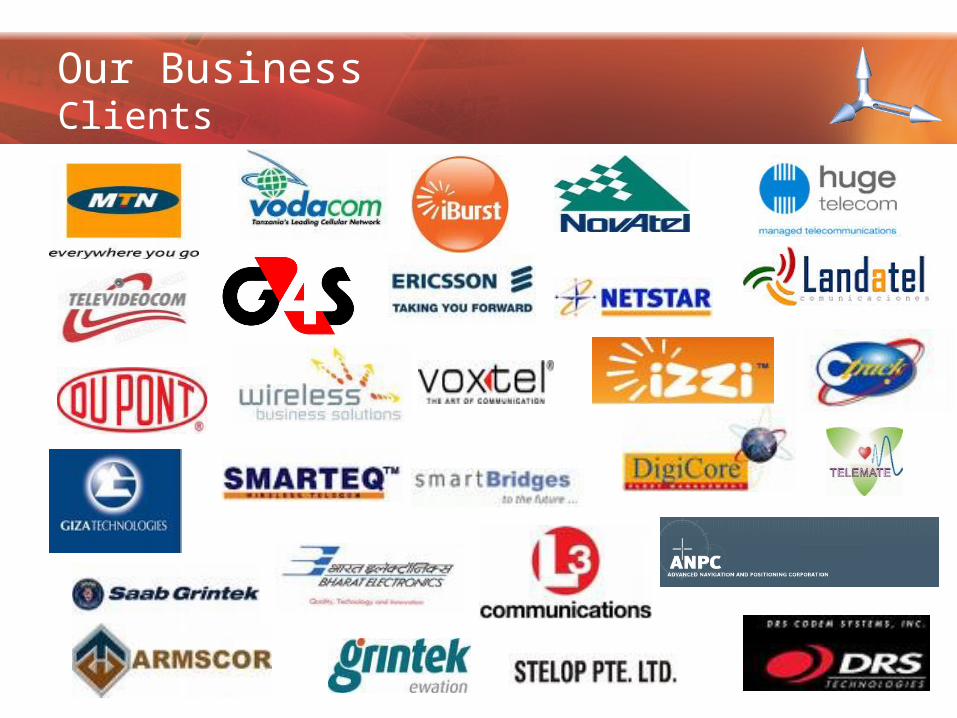
Our BusinessClients
• International recognition of manufacturing technologies
• Well developed sales and distribution channels– Network Operators– OEM’s (Original Equipment Manufacturers)– Direct distribution
• The Poynting brand
• Innovative niche products
• Continuous development of new products & range
• Price and performance competitiveness– Unique patented manufacturing technologies– Low labour component (15% of COS)– Chinese relationships– ‘Technology agnostic’ nature of products
Our BusinessCompetitive Advantages
13
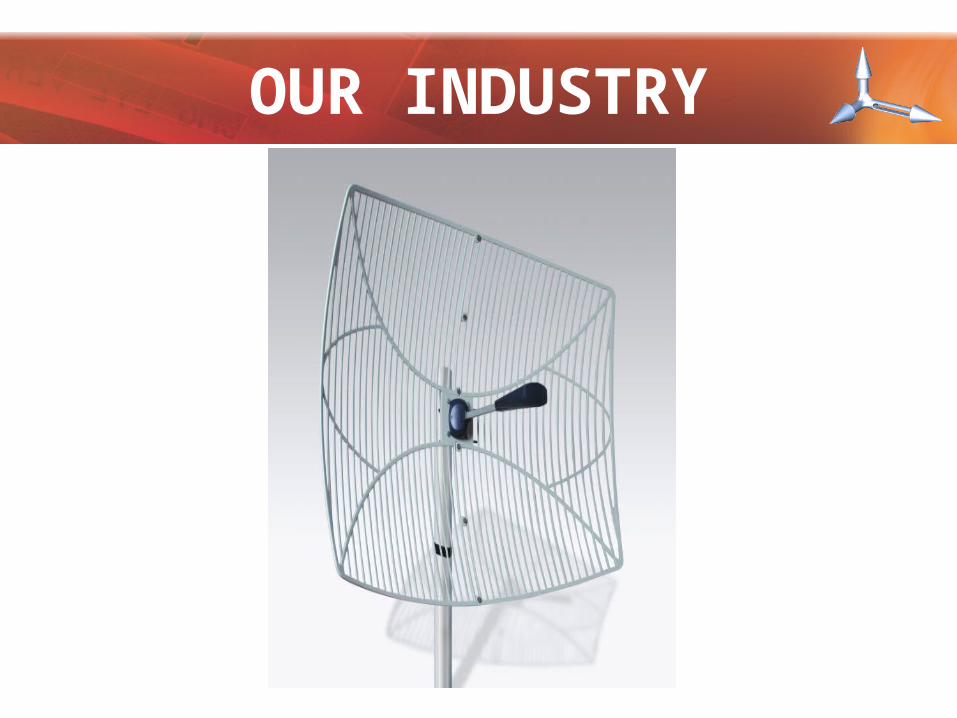
OUR INDUSTRY
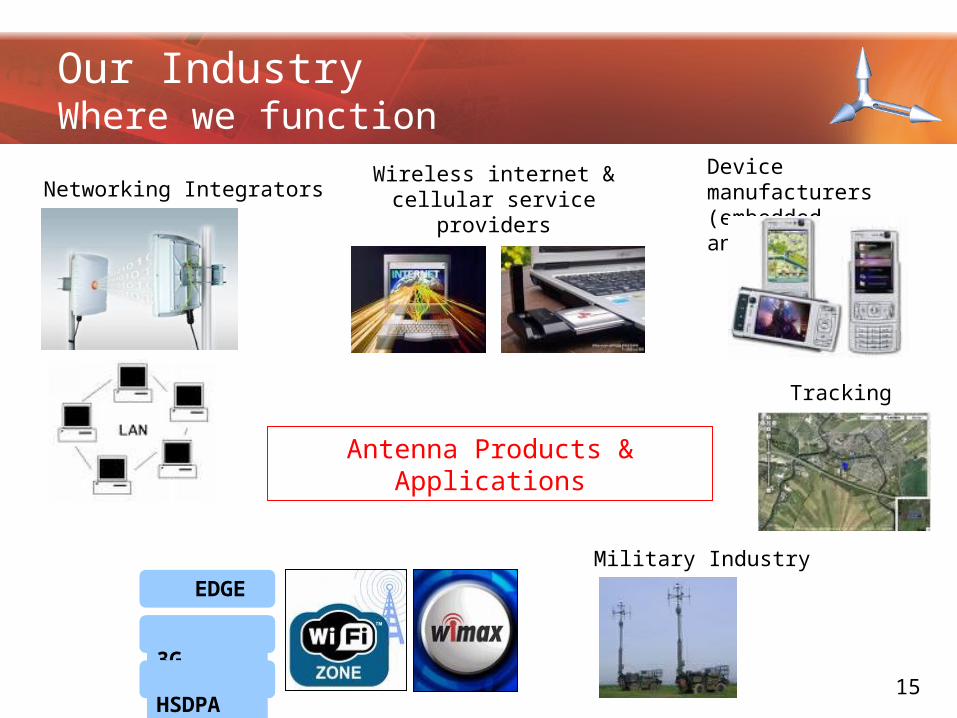
Networking IntegratorsDevice manufacturers (embedded antennas)
Tracking
Military Industry
Wireless internet & cellular service providers
Antenna Products & Applications
Our IndustryWhere we function
EDGE
3G
HSDPA 15
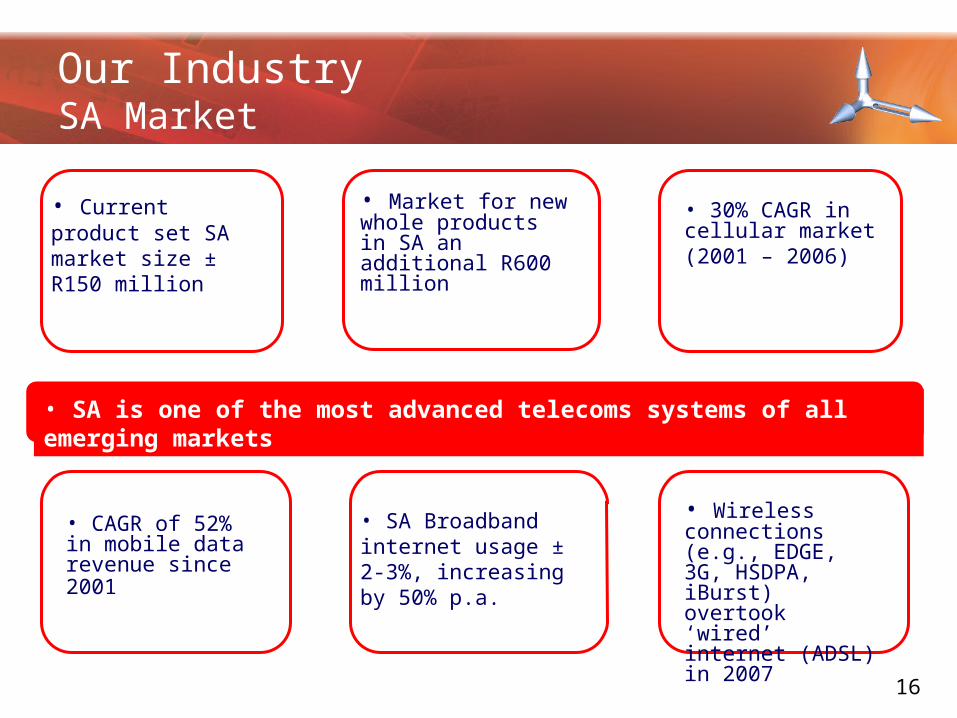
• SA is one of the most advanced telecoms systems of all emerging markets
• Current product set SA market size ± R150 million
• Market for new whole products in SA an additional R600 million
• 30% CAGR in cellular market (2001 – 2006)
• CAGR of 52% in mobile data revenue since 2001
• SA Broadband internet usage ± 2-3%, increasing by 50% p.a.
• Wireless connections (e.g., EDGE, 3G, HSDPA, iBurst) overtook ‘wired’ internet (ADSL) in 2007
Our IndustrySA Market
16
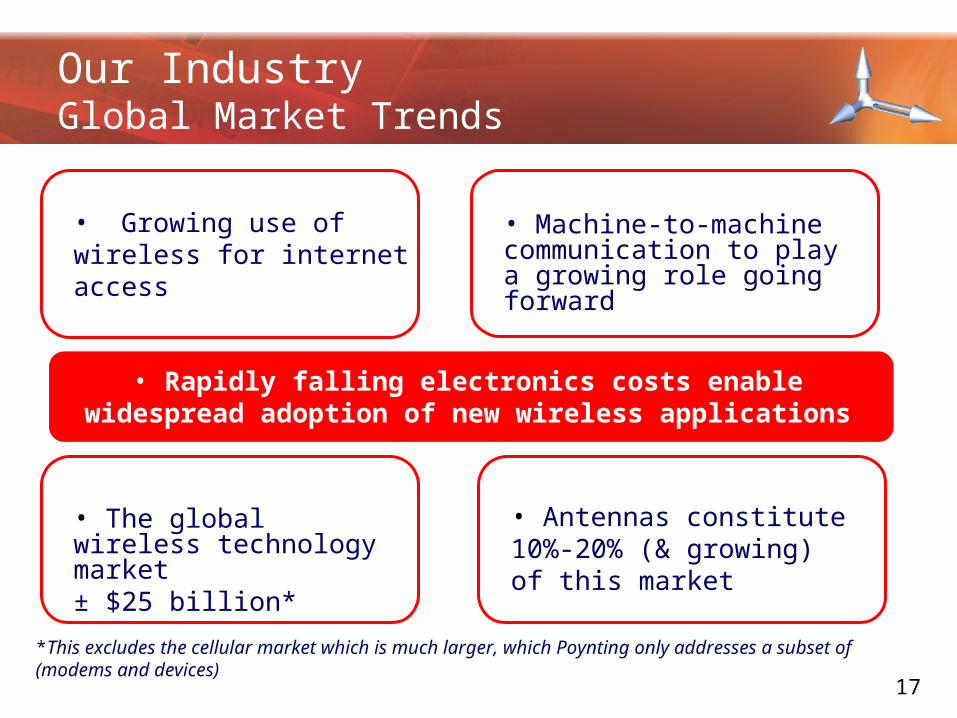
Our IndustryGlobal Market Trends
• Rapidly falling electronics costs enable widespread adoption of new wireless applications
• Growing use of wireless for internet access
• Machine-to-machine communication to play a growing role going forward
• The global wireless technology market ± $25 billion*
• Antennas constitute 10%-20% (& growing) of this market
*This excludes the cellular market which is much larger, which Poynting only addresses a subset of (modems and devices)
17
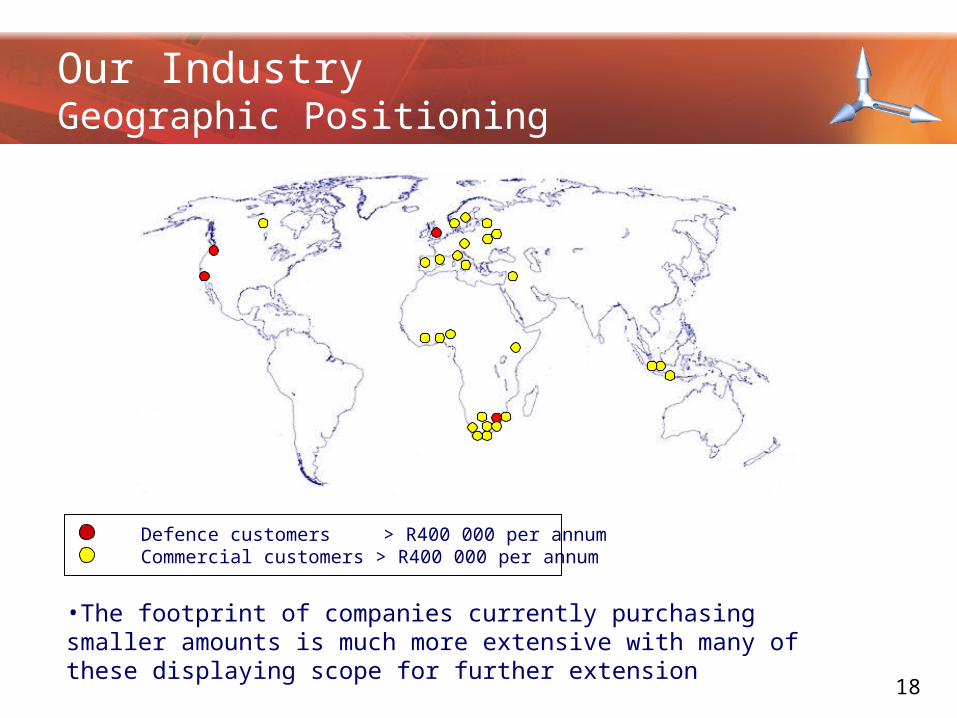
•The footprint of companies currently purchasing smaller amounts is much more extensive with many of these displaying scope for further extension
Defence customers > R400 000 per annum Commercial customers > R400 000 per annum
Our IndustryGeographic Positioning
18
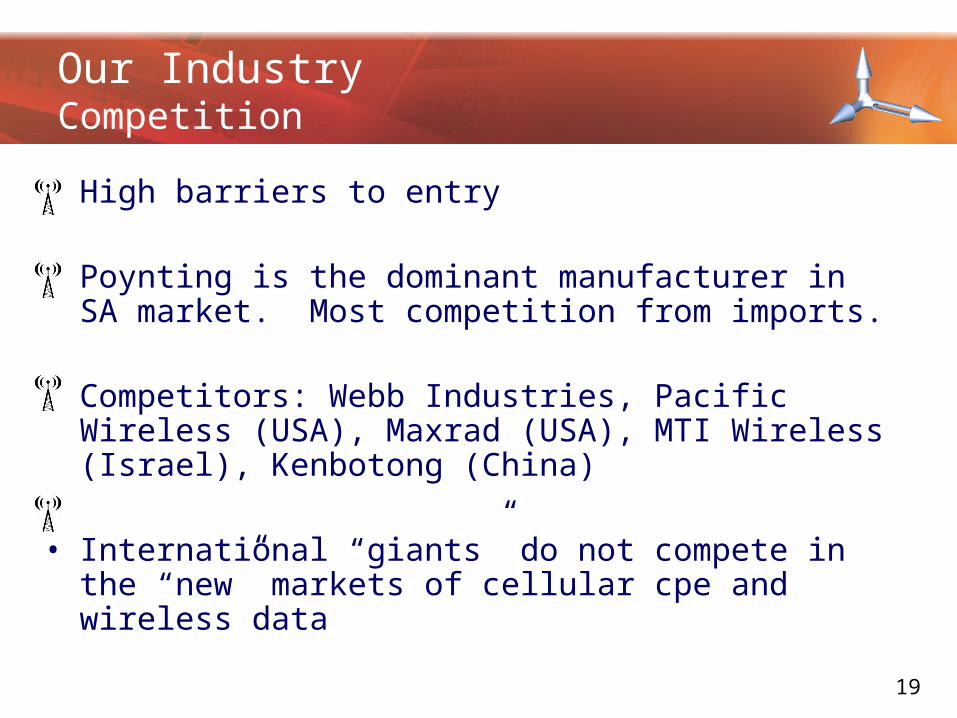
• High barriers to entry
• Poynting is the dominant manufacturer in SA market. Most competition from imports.
• Competitors: Webb Industries, Pacific Wireless (USA), Maxrad (USA), MTI Wireless (Israel), Kenbotong (China)
• International “giants” do not compete in the “new” markets of cellular cpe and wireless data
Our IndustryCompetition
19
GROWTH
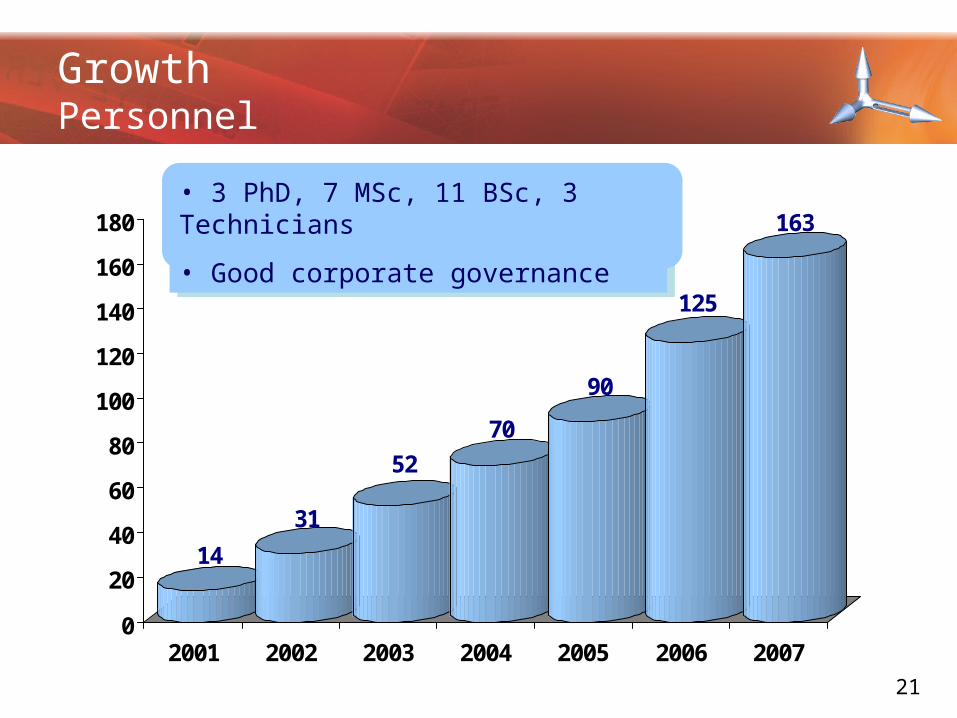
GrowthPersonnel
14
31
52
70
90
125
163
0
20
40
60
80
100
120
140
160
180
2001 2002 2003 2004 2005 2006 2007
• 3 PhD, 4 MSc, 11 BSc, 3 Technicians
• 3 PhD, 7 MSc, 11 BSc, 3 Technicians
• Good corporate governance
21
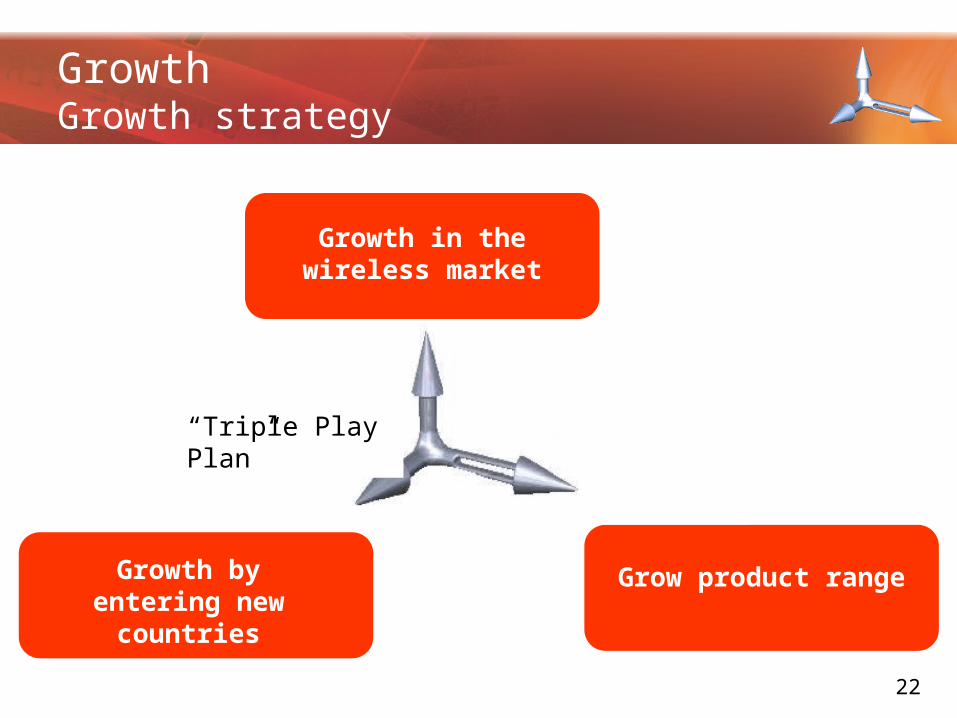
GrowthGrowth strategy
Growth in the wireless market
Growth by entering new countries
Grow product range
“Triple Play Plan”
22
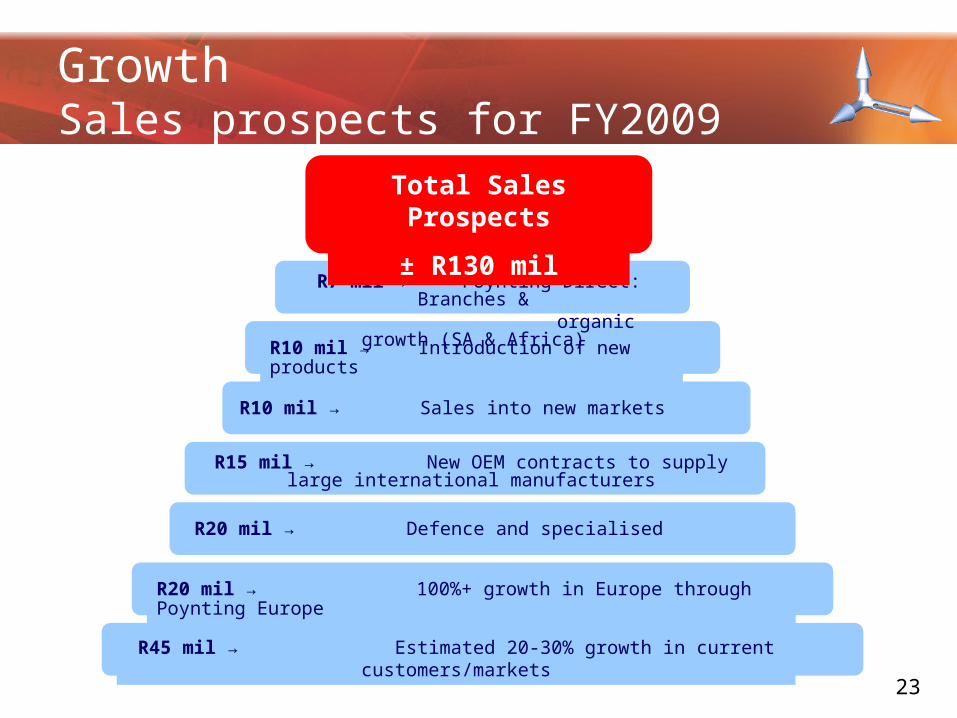
R45 mil → Estimated 20-30% growth in current customers/markets
R20 mil → 100%+ growth in Europe through Poynting Europe
R20 mil → Defence and specialised
R10 mil → Sales into new markets
R10 mil → Introduction of new products
R7 mil → Poynting Direct: Branches & organic growth (SA & Africa)
Total Sales Prospects
± R130 mil
R15 mil → New OEM contracts to supply large international manufacturers
GrowthSales prospects for FY2009
23
OUR FINANCIALS
0
20
40
60
80
100
120
140
Mil
lio
ns
(R
an
ds
)
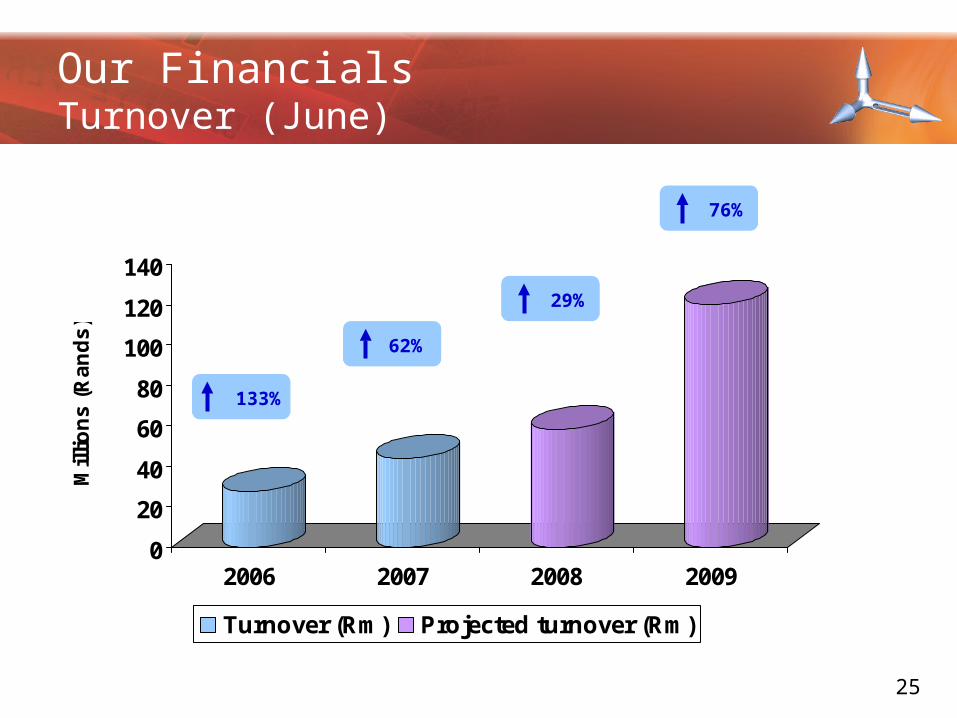
2006 2007 2008 2009
Turnover (Rm) Projected turnover (Rm)
Our FinancialsTurnover (June)
133%
62%
29%
76%
25
0
5
10
15
20
Mil
lio
ns
(R
an
ds
)
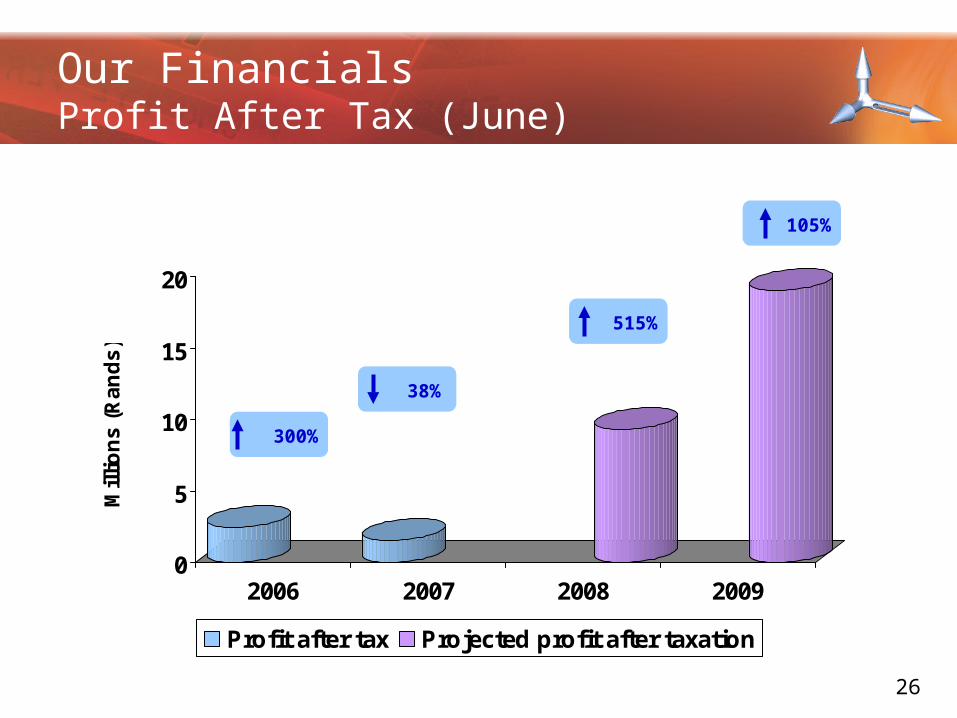
2006 2007 2008 2009
Profit after tax Projected profit after taxation
Our FinancialsProfit After Tax (June)
38%
515%
105%
300%
26
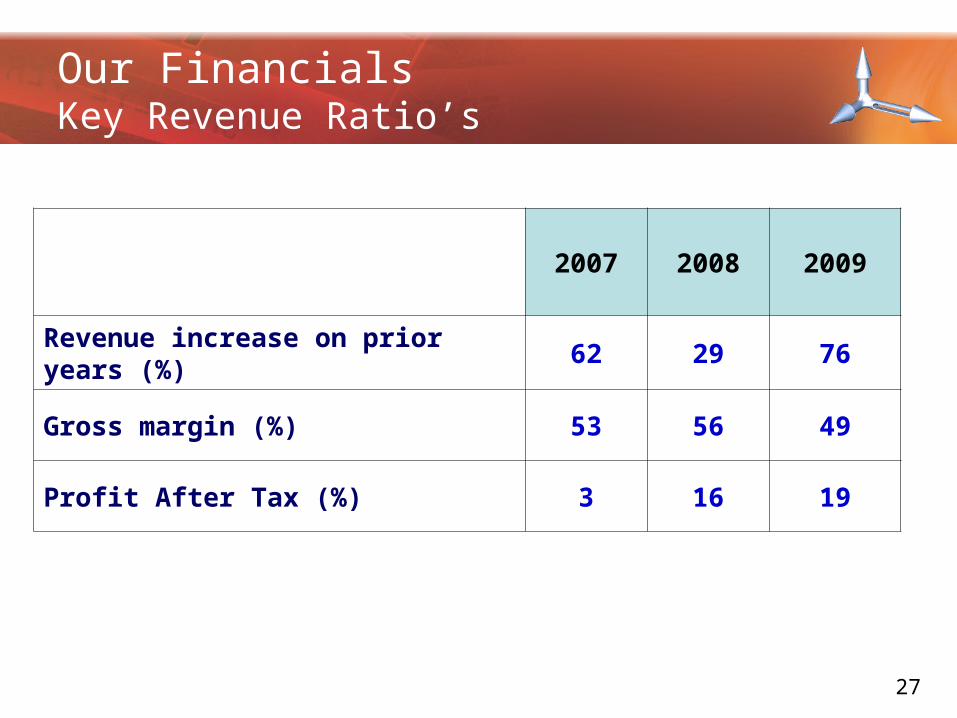
2007 2008 2009
Revenue increase on prior years (%) 62 29 76
Gross margin (%) 53 56 49
Profit After Tax (%) 3 16 19
Our FinancialsKey Revenue Ratio’s
27
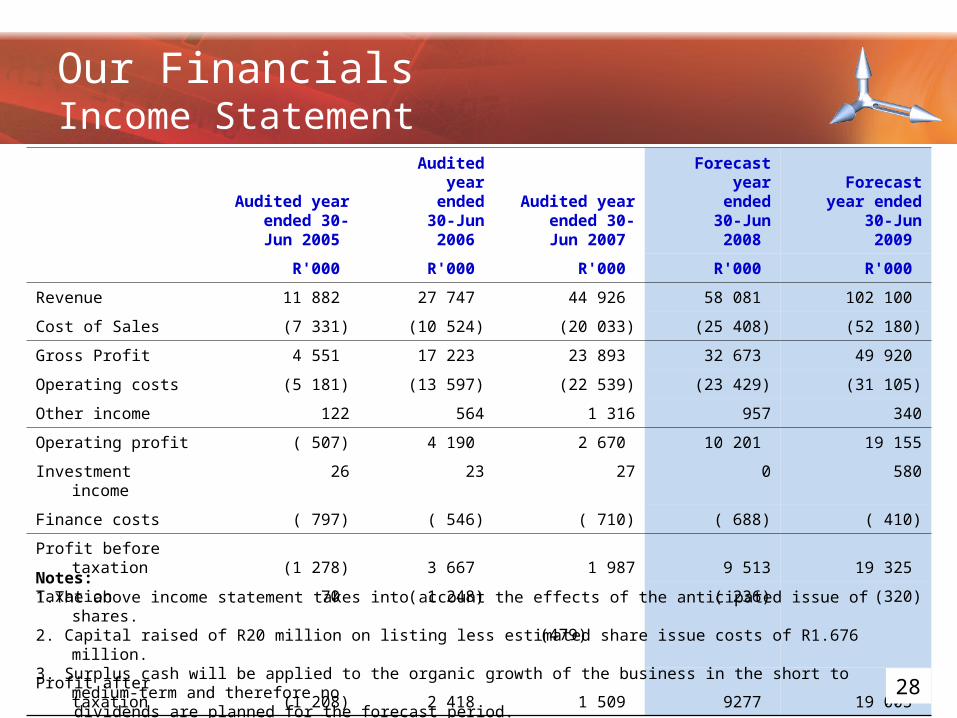
Our FinancialsIncome Statement
Audited year ended 30-Jun 2005
Audited year ended 30-Jun 2006
Audited year ended 30-Jun 2007
Forecast year ended 30-Jun 2008
Forecast year ended 30-Jun 2009
R'000 R'000 R'000 R'000 R'000
Revenue 11 882 27 747 44 926 58 081 102 100
Cost of Sales (7 331) (10 524) (20 033) (25 408) (52 180)
Gross Profit 4 551 17 223 23 893 32 673 49 920
Operating costs (5 181) (13 597) (22 539) (23 429) (31 105)
Other income 122 564 1 316 957 340
Operating profit ( 507) 4 190 2 670 10 201 19 155
Investment income 26 23 27 0 580
Finance costs ( 797) ( 546) ( 710) ( 688) ( 410)
Profit before taxation (1 278) 3 667 1 987 9 513 19 325
Taxation 70 ( 1 248) (479)
( 236) (320)
Profit after taxation (1 208) 2 418 1 509 9277 19 005 Notes:1.The above income statement takes into account the effects of the anticipated issue of shares.2. Capital raised of R20 million on listing less estimated share issue costs of R1.676 million.3. Surplus cash will be applied to the organic growth of the business in the short to medium-term and therefore no dividends are planned for the forecast period.4. Poynting takes advantage of research and development allowances in their tax computations, resulting in a reduced tax charge and a lower effective tax rate. 28
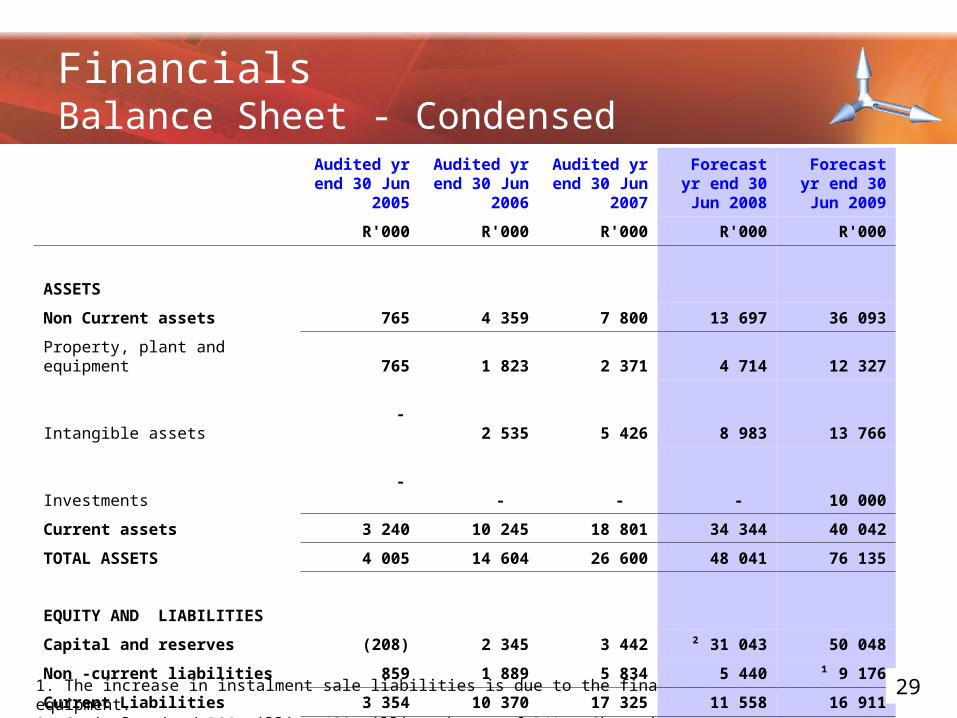
FinancialsBalance Sheet - Condensed
1. The increase in instalment sale liabilities is due to the financing of property plant and equipment.2. Capital raised R20 million (20 million shares of R1). Share issue costs of 1.676 million deducted from share premium.
Audited yr end 30 Jun
2005
Audited yr end 30 Jun
2006
Audited yr end 30 Jun
2007
Forecast yr end 30 Jun
2008
Forecast yr end 30 Jun
2009
R'000 R'000 R'000 R'000 R'000
ASSETS
Non Current assets 765 4 359 7 800 13 697 36 093
Property, plant and equipment 765 1 823 2 371 4 714 12 327
Intangible assets - 2 535 5 426 8 983 13 766
Investments - - - - 10 000
Current assets 3 240 10 245 18 801 34 344 40 042
TOTAL ASSETS 4 005 14 604 26 600 48 041 76 135
EQUITY AND LIABILITIES
Capital and reserves (208) 2 345 3 442 ² 31 043 50 048
Non -current liabilities 859 1 889 5 834 5 440 ¹ 9 176
Current Liabilities 3 354 10 370 17 325 11 558 16 911
TOTAL EQUITY AND LIABILITIES 4 005 14 604 26 600 48 041 76 135
29
BLACK ECONOMIC EMPOWERMENT
• Keen to enhance our BBBEE rating
• Establishing an Employee Empowerment Trust - will own 3% equity of the company
• Seeking genuine participation by an empowerment partner which will add value to the business
• Employment Equity Plan has been submitted
Black Economic Empowerment
31
OUR LISTING RATIONALE
Rationale for listing
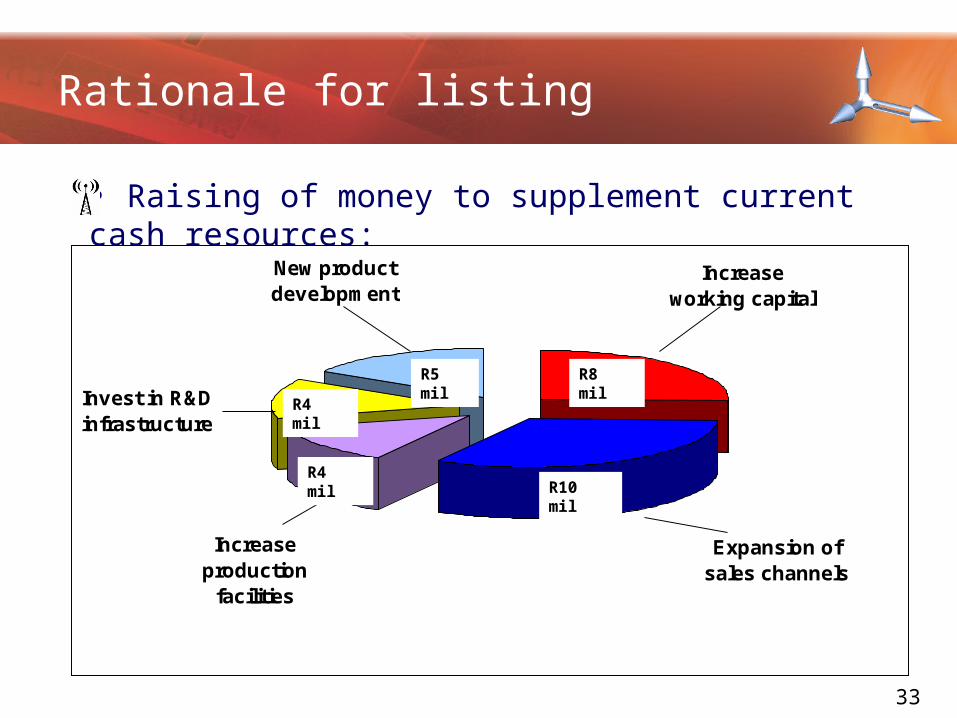
• Raising of money to supplement current cash resources:
Increase working capital
Expansion of sales channels
Increase production
facilities
Invest in R&D infrastructure
New product development
R10 mil
R5 mil
R4 mil
R4 mil
R8 mil
33
34
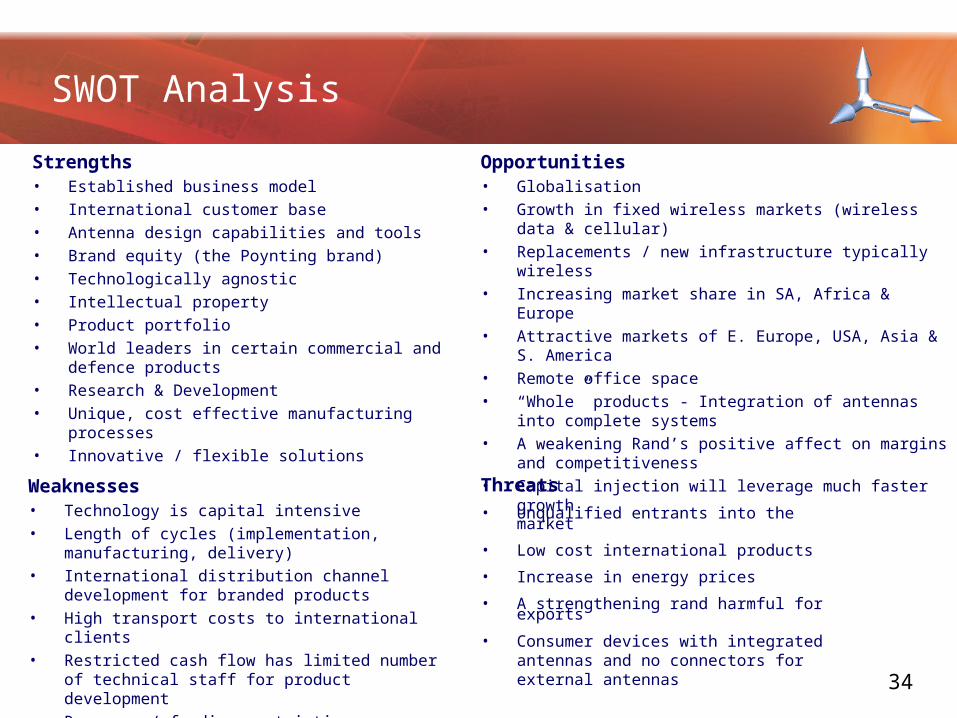
Threats
• Unqualified entrants into the market
• Low cost international products
• Increase in energy prices
• A strengthening rand harmful for exports
• Consumer devices with integrated antennas and no connectors for external antennas
Weaknesses• Technology is capital intensive• Length of cycles (implementation, manufacturing,
delivery)• International distribution channel development for
branded products• High transport costs to international clients• Restricted cash flow has limited number of technical
staff for product development• Resource / funding restrictions constrain registering of
patents and designs
Opportunities• Globalisation • Growth in fixed wireless markets (wireless data & cellular)• Replacements / new infrastructure typically wireless• Increasing market share in SA, Africa & Europe• Attractive markets of E. Europe, USA, Asia & S. America• Remote office space• “Whole” products - Integration of antennas into complete
systems• A weakening Rand’s positive affect on margins and
competitiveness• Capital injection will leverage much faster growth
Strengths• Established business model• International customer base• Antenna design capabilities and tools• Brand equity (the Poynting brand)• Technologically agnostic• Intellectual property• Product portfolio• World leaders in certain commercial and defence
products• Research & Development• Unique, cost effective manufacturing processes• Innovative / flexible solutions
SWOT Analysis
34
• Excellent international growth prospects
• Strong, experienced management
• Highly qualified and experienced R&D team is the company core strength
• Innovative product range
• Very high historical company growth with strong future prospects
• Seeks to list in June 2008
• Intends to raise R20 million through private placement
Summary
35
Thank You&
Questions36