Embed Size (px)
Citation preview

2019 AT&T EARNINGSQ1
Investor Briefing
No. 304 | APRIL 24, 2019
INVESTOR BRIEFING2019 AT&T EARNINGSQ1
3 Communications Mobility Entertainment Group Business Wireline
7 WarnerMedia Turner Home Box Office Warner Bros.
10 Latin America Mexico Vrio
11 Xandr
13 Financial and Operational Information
26 Discussion and Reconciliation of Non-GAAP Measures
Contents
3CONTENTS
INVESTOR BRIEFING2019 AT&T EARNINGSQ1
Communications
MOBILITY
Communications Revenues & EBITDA Margin
I N B I L L I O N S
1Q18 2Q18 3Q18 4Q18 1Q19
Revenues EBITDA EBITDA Margin
$12.6
$35.5
35.5%
$13.1
$35.4
36.9%
$12.8
$36.2
35.3%
$12.2
$37.5
32.7%
$12.6
$35.4
35.7%
3Q18 4Q18 1Q19
Mobility Revenues & EBITDA Service Margin
I N B I L L I O N S
1Q18 2Q18
Revenues EBITDA EBITDA Service Margin
$7.3
54.1% 55.7%
$17.3$17.4
$7.6
54.9%
$17.9
$7.7
54.3% 53.6%
$18.8 $17.6
$7.5 $7.4
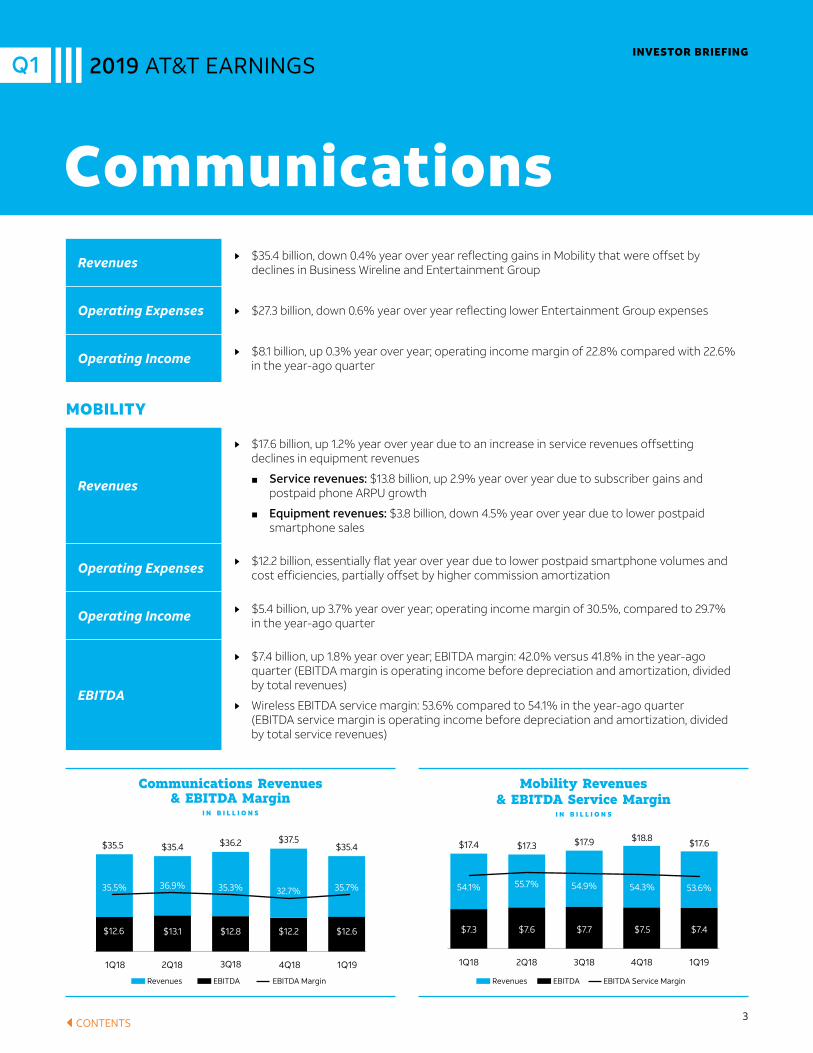
Revenues Nj $35.4 billion, down 0.4% year over year reflecting gains in Mobility that were offset by declines in Business Wireline and Entertainment Group
Operating Expenses Nj $27.3 billion, down 0.6% year over year reflecting lower Entertainment Group expenses
Operating Income Nj $8.1 billion, up 0.3% year over year; operating income margin of 22.8% compared with 22.6% in the year-ago quarter
Revenues
Nj $17.6 billion, up 1.2% year over year due to an increase in service revenues offsetting declines in equipment revenues
■ Service revenues: $13.8 billion, up 2.9% year over year due to subscriber gains and postpaid phone ARPU growth
■ Equipment revenues: $3.8 billion, down 4.5% year over year due to lower postpaid smartphone sales
Operating Expenses Nj $12.2 billion, essentially flat year over year due to lower postpaid smartphone volumes and cost efficiencies, partially offset by higher commission amortization
Operating Income Nj $5.4 billion, up 3.7% year over year; operating income margin of 30.5%, compared to 29.7% in the year-ago quarter
EBITDA
Nj $7.4 billion, up 1.8% year over year; EBITDA margin: 42.0% versus 41.8% in the year-ago quarter (EBITDA margin is operating income before depreciation and amortization, divided by total revenues)
Nj Wireless EBITDA service margin: 53.6% compared to 54.1% in the year-ago quarter (EBITDA service margin is operating income before depreciation and amortization, divided by total service revenues)
4CONTENTS
COMMUNICATIONS
INVESTOR BRIEFING2019 AT&T EARNINGSQ1
ARPU
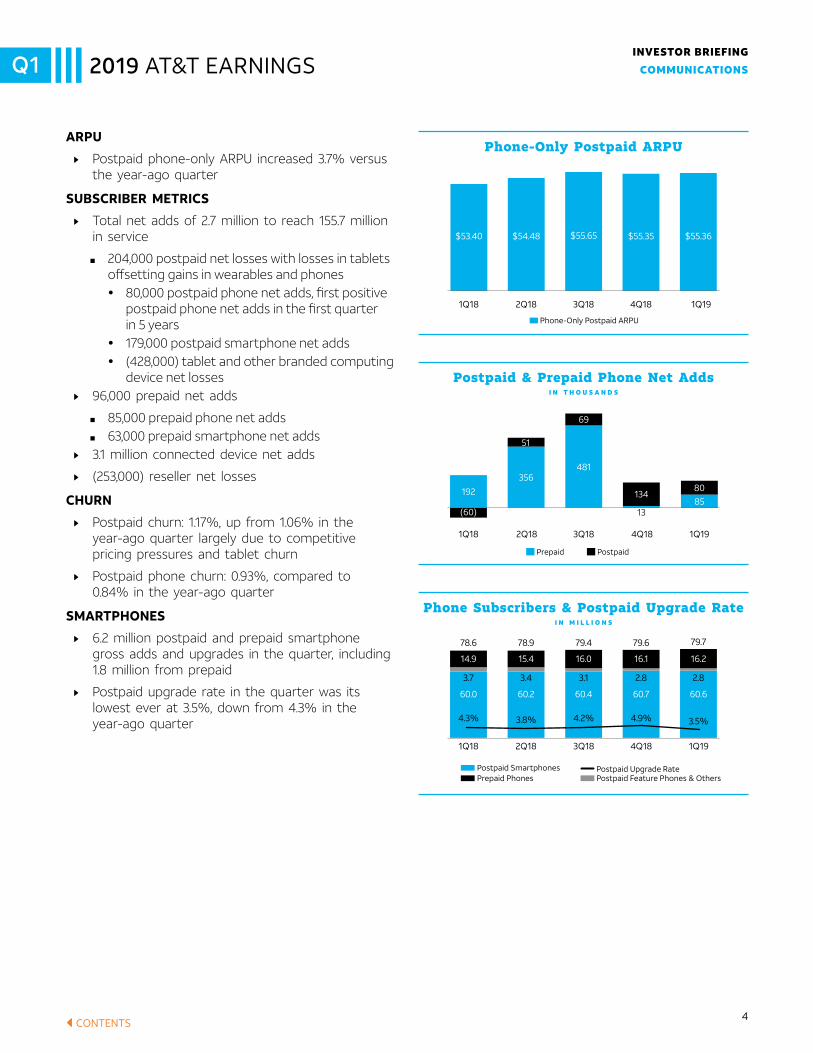
Nj Postpaid phone-only ARPU increased 3.7% versus the year-ago quarter
SUBSCRIBER METRICS
Nj Total net adds of 2.7 million to reach 155.7 million in service
■ 204,000 postpaid net losses with losses in tablets offsetting gains in wearables and phones � 80,000 postpaid phone net adds, first positive
postpaid phone net adds in the first quarter in 5 years
� 179,000 postpaid smartphone net adds � (428,000) tablet and other branded computing
device net losses Nj 96,000 prepaid net adds
■ 85,000 prepaid phone net adds ■ 63,000 prepaid smartphone net adds
Nj 3.1 million connected device net adds
Nj (253,000) reseller net losses
CHURN
Nj Postpaid churn: 1.17%, up from 1.06% in the year-ago quarter largely due to competitive pricing pressures and tablet churn
Nj Postpaid phone churn: 0.93%, compared to 0.84% in the year-ago quarter
SMARTPHONES
Nj 6.2 million postpaid and prepaid smartphone gross adds and upgrades in the quarter, including 1.8 million from prepaid
Nj Postpaid upgrade rate in the quarter was its lowest ever at 3.5%, down from 4.3% in the year-ago quarter
69
Postpaid & Prepaid Phone Net Adds I N T H O U S A N D S
Prepaid Postpaid
(60)
51
2Q181Q18
356481
3Q18
13480
1385
4Q18 1Q19
192
Phone-Only Postpaid ARPU
Phone-Only Postpaid ARPU
1Q18
$53.40 $54.48
2Q18
$55.65
3Q18
$55.35 $55.36
4Q18 1Q19
Phone Subscribers & Postpaid Upgrade Rate I N M I L L I O N S
Postpaid Upgrade RatePostpaid SmartphonesPrepaid Phones Postpaid Feature Phones & Others
1Q18
78.6
4.3%
60.0
3.7
14.9
60.2
3.4
15.4
60.4
3.1
16.0
60.7
2.8
16.1
60.6
2.8
16.2
78.9
2Q18
3.8%
79.4
3Q18
4.2%
79.6 79.7
4Q18 1Q19
4.9% 3.5%
5CONTENTS
COMMUNICATIONS
INVESTOR BRIEFING2019 AT&T EARNINGSQ1
ENTERTAINMENT GROUP
SUBSCRIBER METRICS
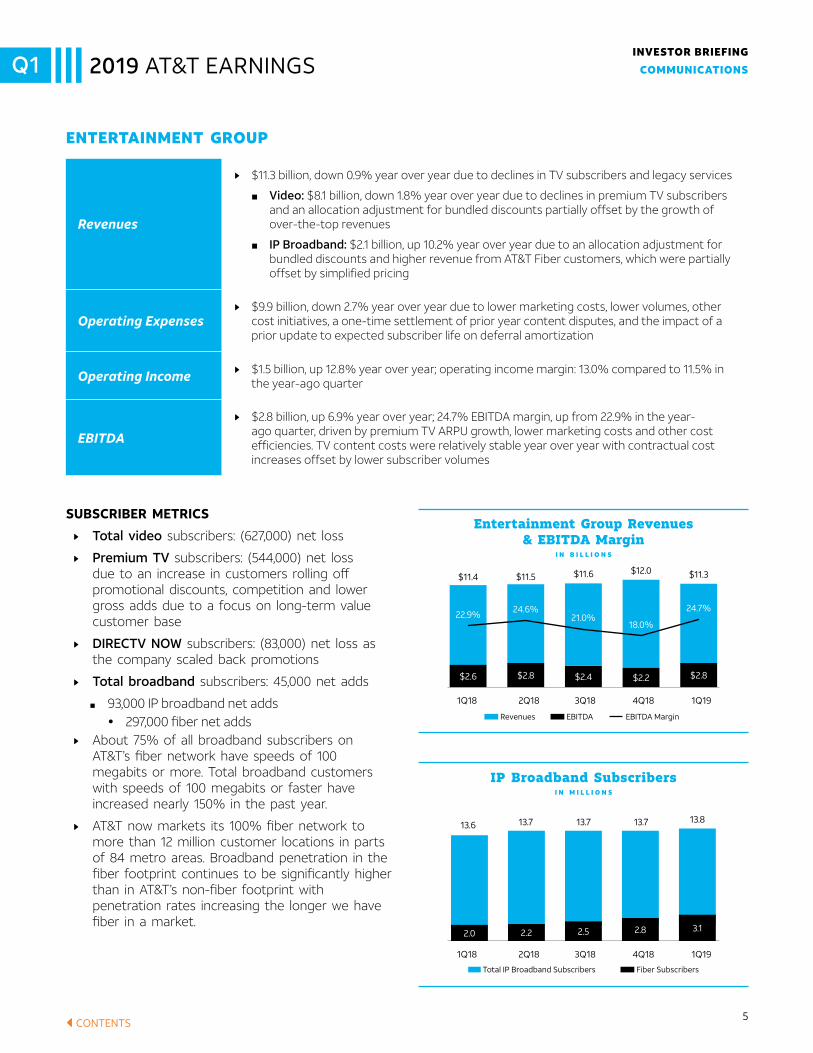
Nj Total video subscribers: (627,000) net loss
Nj Premium TV subscribers: (544,000) net loss due to an increase in customers rolling off promotional discounts, competition and lower gross adds due to a focus on long-term value customer base
Nj DIRECTV NOW subscribers: (83,000) net loss as the company scaled back promotions
Nj Total broadband subscribers: 45,000 net adds
■ 93,000 IP broadband net adds � 297,000 fiber net adds
Nj About 75% of all broadband subscribers on AT&T’s fiber network have speeds of 100 megabits or more. Total broadband customers with speeds of 100 megabits or faster have increased nearly 150% in the past year.
Nj AT&T now markets its 100% fiber network to more than 12 million customer locations in parts of 84 metro areas. Broadband penetration in the fiber footprint continues to be significantly higher than in AT&T’s non-fiber footprint with penetration rates increasing the longer we have fiber in a market.
Entertainment Group Revenues & EBITDA Margin
I N B I L L I O N S
$2.6
1Q18 2Q18
$2.8
3Q18
$11.5$11.4
$2.4
4Q18 1Q19
$11.6
22.9% 24.6%21.0%
Revenues EBITDA EBITDA Margin
$2.2 $2.8
$12.0 $11.3
18.0%
24.7%
IP Broadband Subscribers I N M I L L I O N S
2.0
1Q18 2Q18
2.2
3Q18
13.713.6
2.5
4Q18 1Q19
13.7
2.8 3.1
13.7 13.8
Fiber SubscribersTotal IP Broadband Subscribers
Revenues
Nj $11.3 billion, down 0.9% year over year due to declines in TV subscribers and legacy services
■ Video: $8.1 billion, down 1.8% year over year due to declines in premium TV subscribers and an allocation adjustment for bundled discounts partially offset by the growth of over-the-top revenues
■ IP Broadband: $2.1 billion, up 10.2% year over year due to an allocation adjustment for bundled discounts and higher revenue from AT&T Fiber customers, which were partially offset by simplified pricing
Operating Expenses Nj $9.9 billion, down 2.7% year over year due to lower marketing costs, lower volumes, other
cost initiatives, a one-time settlement of prior year content disputes, and the impact of a prior update to expected subscriber life on deferral amortization
Operating Income Nj $1.5 billion, up 12.8% year over year; operating income margin: 13.0% compared to 11.5% in the year-ago quarter
EBITDA
Nj $2.8 billion, up 6.9% year over year; 24.7% EBITDA margin, up from 22.9% in the year-ago quarter, driven by premium TV ARPU growth, lower marketing costs and other cost efficiencies. TV content costs were relatively stable year over year with contractual cost increases offset by lower subscriber volumes
6CONTENTS
COMMUNICATIONS
INVESTOR BRIEFING2019 AT&T EARNINGSQ1
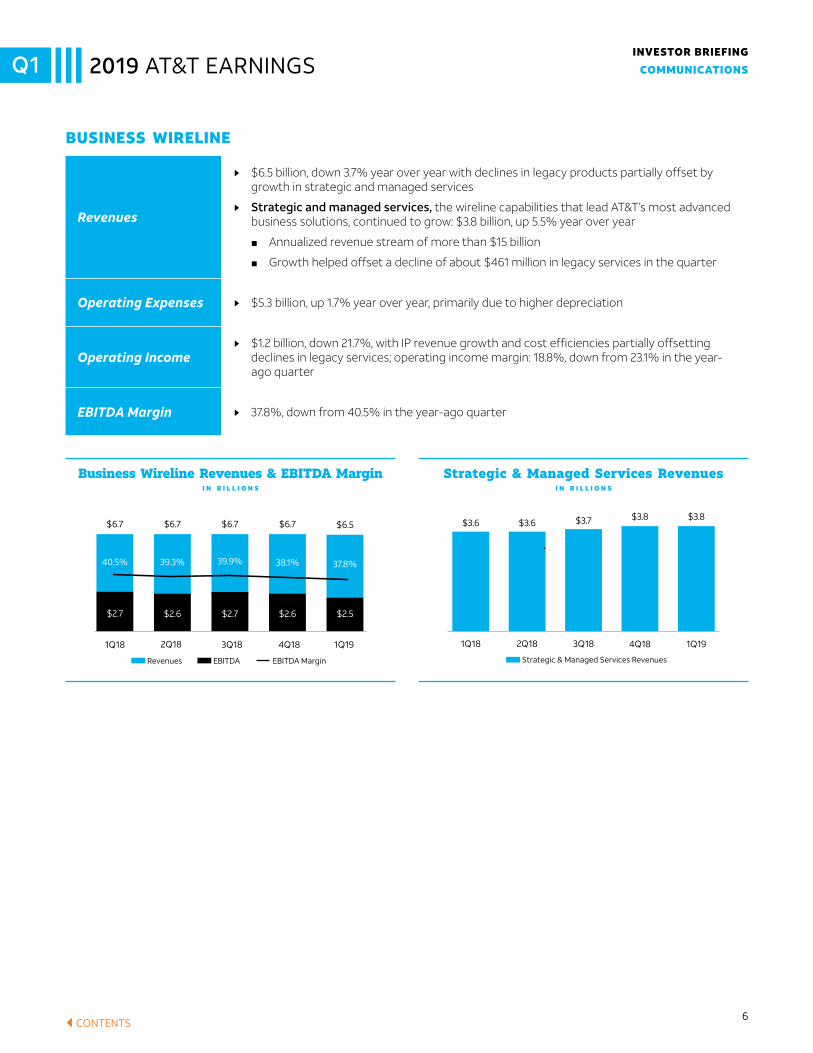
Business Wireline Revenues & EBITDA Margin I N B I L L I O N S
$2.7
1Q18 2Q18
$2.6
3Q18
$6.7$6.7
$2.7
4Q18 1Q19
$6.7
40.5% 39.3% 39.9%
Revenues EBITDA EBITDA Margin
$2.6 $2.5
$6.7 $6.5
38.1% 37.8%
BUSINESS WIRELINE
Revenues
Nj $6.5 billion, down 3.7% year over year with declines in legacy products partially offset by growth in strategic and managed services
Nj Strategic and managed services, the wireline capabilities that lead AT&T’s most advanced business solutions, continued to grow: $3.8 billion, up 5.5% year over year
■ Annualized revenue stream of more than $15 billion
■ Growth helped offset a decline of about $461 million in legacy services in the quarter
Operating Expenses Nj $5.3 billion, up 1.7% year over year, primarily due to higher depreciation
Operating Income Nj $1.2 billion, down 21.7%, with IP revenue growth and cost efficiencies partially offsetting
declines in legacy services; operating income margin: 18.8%, down from 23.1% in the year-ago quarter
EBITDA Margin Nj 37.8%, down from 40.5% in the year-ago quarter
Strategic & Managed Services Revenues I N B I L L I O N S
Strategic & Managed Services Revenues
1Q18 2Q18 3Q18 4Q18
$3.6 $3.6 $3.7
1Q19
$3.8$3.8

7CONTENTS
INVESTOR BRIEFING2019 AT&T EARNINGSQ1
FINANCIAL HIGHLIGHTS(This material conforms to historical presentation to aid in comparability. Historical comparisons reflect historical Time Warner adjusted results and also include RSNs as recast in the WarnerMedia segment. Financial results of Otter Media are included in WarnerMedia consolidated results following AT&T’s Aug. 7, 2018 acquisition of the remaining interest in Otter Media and the transfer of the ownership of Otter Media to WarnerMedia. Prior to this date, Otter Media was included as an equity-method investment of AT&T.)
WarnerMedia
Revenues Nj $8.4 billion, up 3.3% year over year primarily driven by higher Warner Bros. revenues, consolidation of Otter Media and higher affiliate subscription revenues at Turner
Operating Expenses
Nj $6.1 billion, up 0.6% year over year primarily due to higher film and television production costs at Warner Bros. and the consolidation of Otter Media, partially offset by lower programming expenses at Home Box Office and Turner
Nj Includes $3.6 billion of programming and production costs, up 3.0% year over year
Operating Income Nj $2.2 billion, up 11.6% year over year with gains at all three business units; operating income margin of 26.8% compared with 24.8% in year-ago quarter
WarnerMedia Revenues & Operating Income Margin
I N B I L L I O N S
1Q18 2Q18 3Q18 4Q18 1Q19
Revenues Operating Income Operating Income Margin
$7.9$8.1 $8.2$9.2
$8.4
24.8%22.6%
31.3% 28.4% 26.8%
$2.0 $1.8 $2.6 $2.6 $2.2
1Q19
$3.4
36.2%
$1.2
Turner Revenues & Operating Income Margin
I N B I L L I O N S
1Q18 2Q18 3Q18 4Q18
Revenues Operating Income Operating Income Margin
$3.3$3.5$3.0
$3.2
33.7% 30.0%
48.3% 40.2%
$1.2 $1.0 $1.4 $1.3
Home Box Office Revenues & Operating Income Margin
I N B I L L I O N S
1Q18 2Q18 3Q18 4Q18 1Q19
Revenues Operating Income Operating Income Margin
$1.7$1.6 $1.6 $1.7$1.5
33.0% 34.1% 38.2% 37.2% 37.5%
$0.5 $0.6 $0.6 $0.6 $0.6
Warner Bros. Revenues & Operating Income Margin
I N B I L L I O N S
1Q18 2Q18 3Q18 4Q18 1Q19
Revenues Operating Income Operating Income Margin
$3.3$3.2$3.7
$4.5
$3.5
11.8% 10.2%15.5%
18.1%15.5%
$0.4 $0.3 $0.6 $0.8 $0.5

8CONTENTS
WARNERMEDIA
INVESTOR BRIEFING2019 AT&T EARNINGSQ1
TURNER
HOME BOX OFFICE
WARNER BROS.
Revenues
Nj $1.5 billion, down 6.7% year over year primarily due to lower domestic linear subscribers and a decrease in content and other revenues, partially offset by higher domestic rates and digital and international growth
Nj Subscription: revenues and subscribers were unfavorably impacted by the carriage dispute with DISH, which began in November 2018, but revenues benefited from higher domestic rates and digital and international growth
Operating Expenses Nj $943 million, down 13.0% year over year due to lower programming and distribution costs
Operating Income Nj $567 million, up 6.0% year over year; operating income margin of 37.5% compared with 33.0% in the year-ago quarter
Revenues
Nj $3.4 billion, down 0.4% year over year due to a 5.9% decline in advertising revenues, partially offset by a 4.1% increase in subscription revenues
Nj Subscription: benefited from higher domestic affiliate rates and growth at Turner’s international networks; revenues were impacted by unfavorable foreign exchange rates
Nj Advertising: decreased due to the shift of the NCAA Final Four games and lower audience delivery at Turner’s domestic entertainment networks; international advertising revenues declined and were impacted by unfavorable foreign exchange rates
Operating Expenses Nj $2.2 billion, down 4.1% year over year, primarily due to lower programming expenses
reflecting the shift of the NCAA Final Four games and lower original programming and marketing costs
Operating Income Nj $1.2 billion, up 7.0% year over year; operating income margin of 36.2% compared with 33.7% in the year-ago quarter
Revenues
Nj $3.5 billion, up 8.6% year over year due to 12.7% growth in theatrical product revenues and 7.7% growth in television product revenues
Nj Theatrical product: increased primarily due to theatrical carryover revenues driven by Aquaman (released 4Q18)
Nj Television product: increased primarily due to higher initial telecast revenues, partially offset by lower licensing revenues
Operating Expenses Nj $3.0 billion, up 4.1% year over year primarily due to higher film and television production costs, partially offset by lower print and advertising expenses
Operating Income Nj $547 million, up 42.8% year over year; operating income margin of 15.5% compared with 11.8% in the year-ago quarter
9CONTENTS
WARNERMEDIA
INVESTOR BRIEFING2019 AT&T EARNINGSQ1
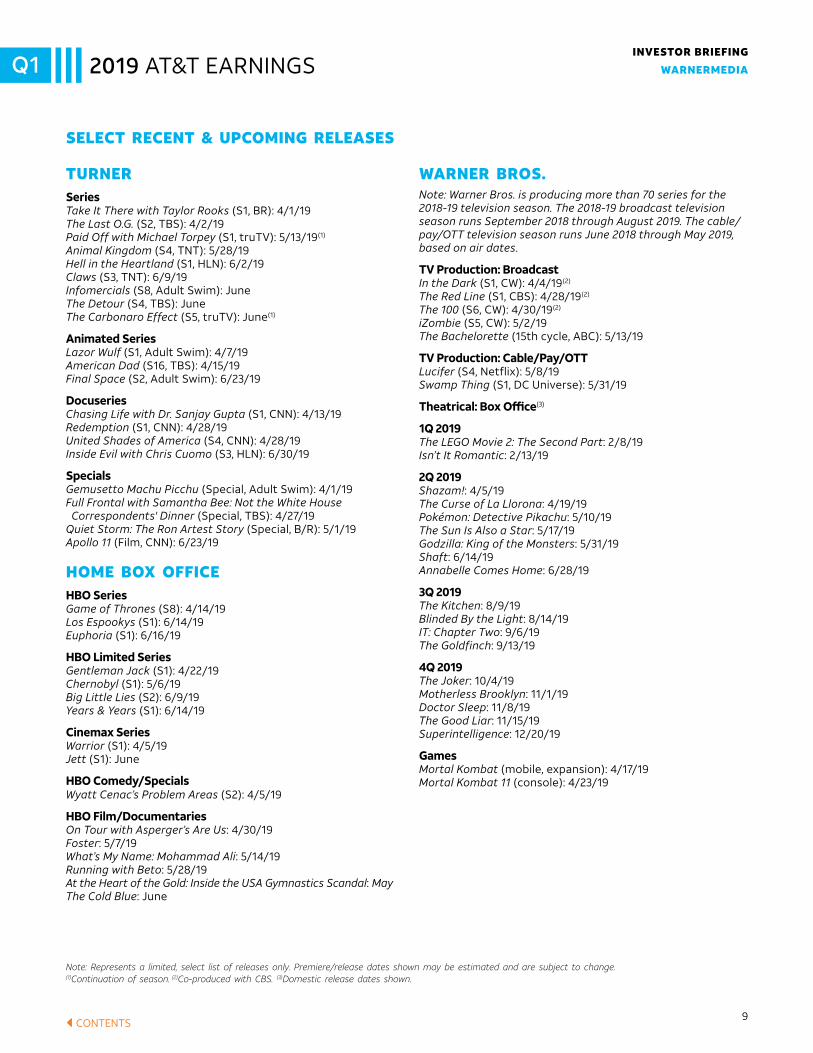
WARNER BROS.Note: Warner Bros. is producing more than 70 series for the 2018-19 television season. The 2018-19 broadcast television season runs September 2018 through August 2019. The cable/pay/OTT television season runs June 2018 through May 2019, based on air dates.
TV Production: BroadcastIn the Dark (S1, CW): 4/4/19(2)
The Red Line (S1, CBS): 4/28/19(2)
The 100 (S6, CW): 4/30/19(2)
iZombie (S5, CW): 5/2/19The Bachelorette (15th cycle, ABC): 5/13/19
TV Production: Cable/Pay/OTTLucifer (S4, Netflix): 5/8/19Swamp Thing (S1, DC Universe): 5/31/19
Theatrical: Box Office(3)
1Q 2019The LEGO Movie 2: The Second Part: 2/8/19Isn’t It Romantic: 2/13/19
2Q 2019Shazam!: 4/5/19The Curse of La Llorona: 4/19/19Pokémon: Detective Pikachu: 5/10/19The Sun Is Also a Star: 5/17/19Godzilla: King of the Monsters: 5/31/19Shaft: 6/14/19Annabelle Comes Home: 6/28/19
3Q 2019The Kitchen: 8/9/19Blinded By the Light: 8/14/19IT: Chapter Two: 9/6/19The Goldfinch: 9/13/19
4Q 2019The Joker: 10/4/19Motherless Brooklyn: 11/1/19Doctor Sleep: 11/8/19The Good Liar: 11/15/19Superintelligence: 12/20/19
Games Mortal Kombat (mobile, expansion): 4/17/19Mortal Kombat 11 (console): 4/23/19
TURNERSeriesTake It There with Taylor Rooks (S1, BR): 4/1/19The Last O.G. (S2, TBS): 4/2/19Paid Off with Michael Torpey (S1, truTV): 5/13/19(1)
Animal Kingdom (S4, TNT): 5/28/19Hell in the Heartland (S1, HLN): 6/2/19Claws (S3, TNT): 6/9/19Infomercials (S8, Adult Swim): JuneThe Detour (S4, TBS): JuneThe Carbonaro Effect (S5, truTV): June(1)
Animated SeriesLazor Wulf (S1, Adult Swim): 4/7/19American Dad (S16, TBS): 4/15/19Final Space (S2, Adult Swim): 6/23/19
Docuseries Chasing Life with Dr. Sanjay Gupta (S1, CNN): 4/13/19Redemption (S1, CNN): 4/28/19United Shades of America (S4, CNN): 4/28/19Inside Evil with Chris Cuomo (S3, HLN): 6/30/19
SpecialsGemusetto Machu Picchu (Special, Adult Swim): 4/1/19Full Frontal with Samantha Bee: Not the White House Correspondents' Dinner (Special, TBS): 4/27/19Quiet Storm: The Ron Artest Story (Special, B/R): 5/1/19Apollo 11 (Film, CNN): 6/23/19
HOME BOX OFFICEHBO SeriesGame of Thrones (S8): 4/14/19Los Espookys (S1): 6/14/19Euphoria (S1): 6/16/19
HBO Limited Series Gentleman Jack (S1): 4/22/19Chernobyl (S1): 5/6/19Big Little Lies (S2): 6/9/19Years & Years (S1): 6/14/19
Cinemax Series Warrior (S1): 4/5/19Jett (S1): June
HBO Comedy/SpecialsWyatt Cenac’s Problem Areas (S2): 4/5/19
HBO Film/DocumentariesOn Tour with Asperger’s Are Us: 4/30/19Foster: 5/7/19What’s My Name: Mohammad Ali: 5/14/19Running with Beto: 5/28/19At the Heart of the Gold: Inside the USA Gymnastics Scandal: MayThe Cold Blue: June
SELECT RECENT & UPCOMING RELEASES
Note: Represents a limited, select list of releases only. Premiere/release dates shown may be estimated and are subject to change. (1)Continuation of season. (2)Co-produced with CBS. (3)Domestic release dates shown.
10CONTENTS
INVESTOR BRIEFING2019 AT&T EARNINGSQ1
Latin America
MEXICO
VRIO
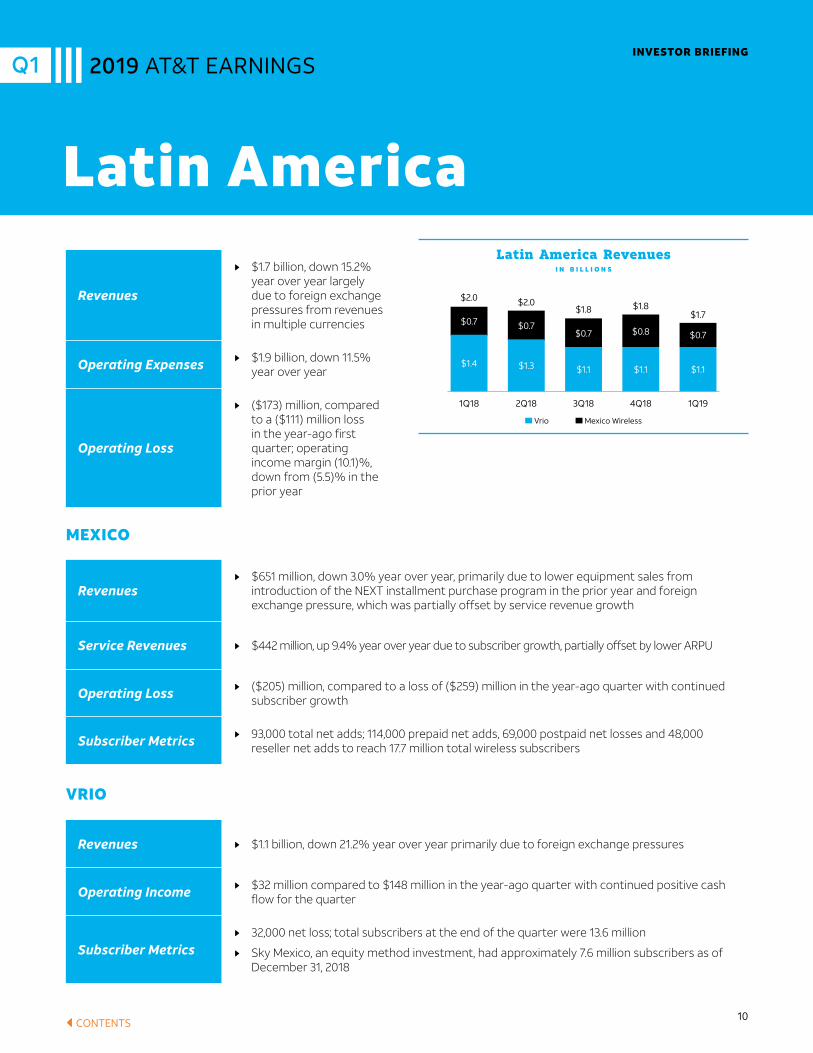
Vrio Mexico Wireless
$1.4
$0.7
1Q18
$1.3
$0.7
2Q18
$2.0$2.0
Latin America Revenues I N B I L L I O N S
$1.1
$0.7
3Q18
$1.8
$1.1 $1.1
$0.8 $0.7
4Q18 1Q19
$1.8$1.7
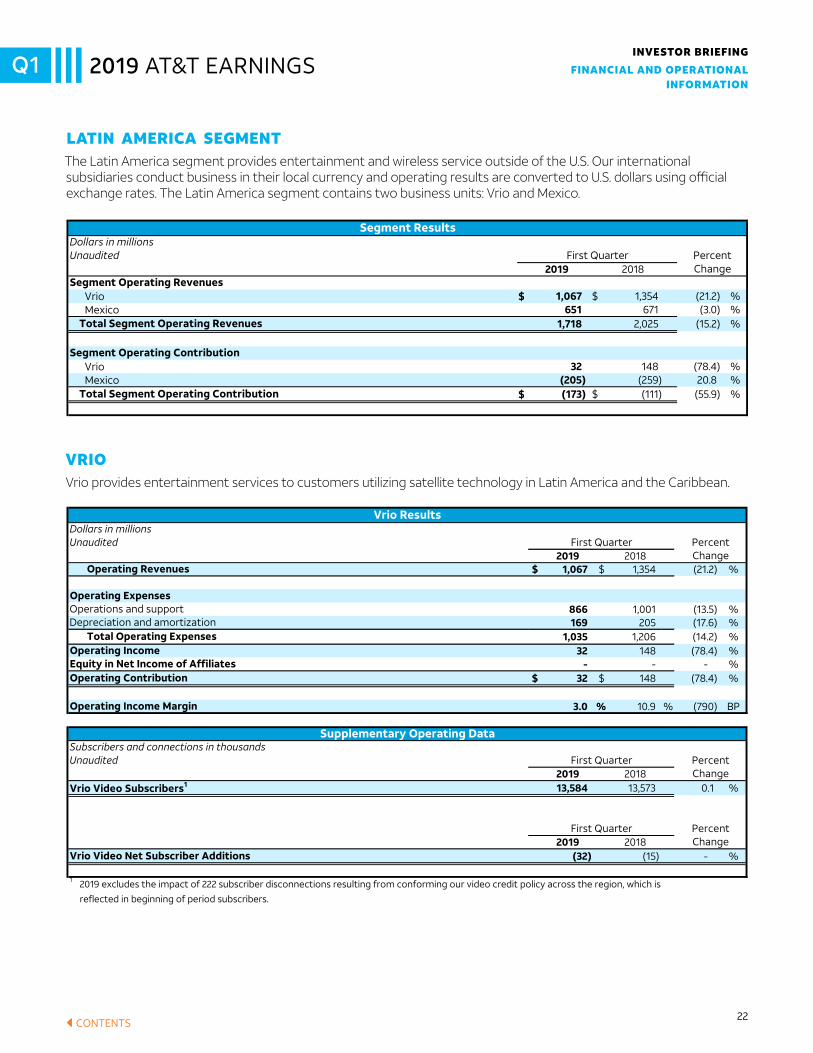
Revenues
Nj $1.7 billion, down 15.2% year over year largely due to foreign exchange pressures from revenues in multiple currencies
Operating Expenses Nj $1.9 billion, down 11.5% year over year
Operating Loss
Nj ($173) million, compared to a ($111) million loss in the year-ago first quarter; operating income margin (10.1)%, down from (5.5)% in the prior year
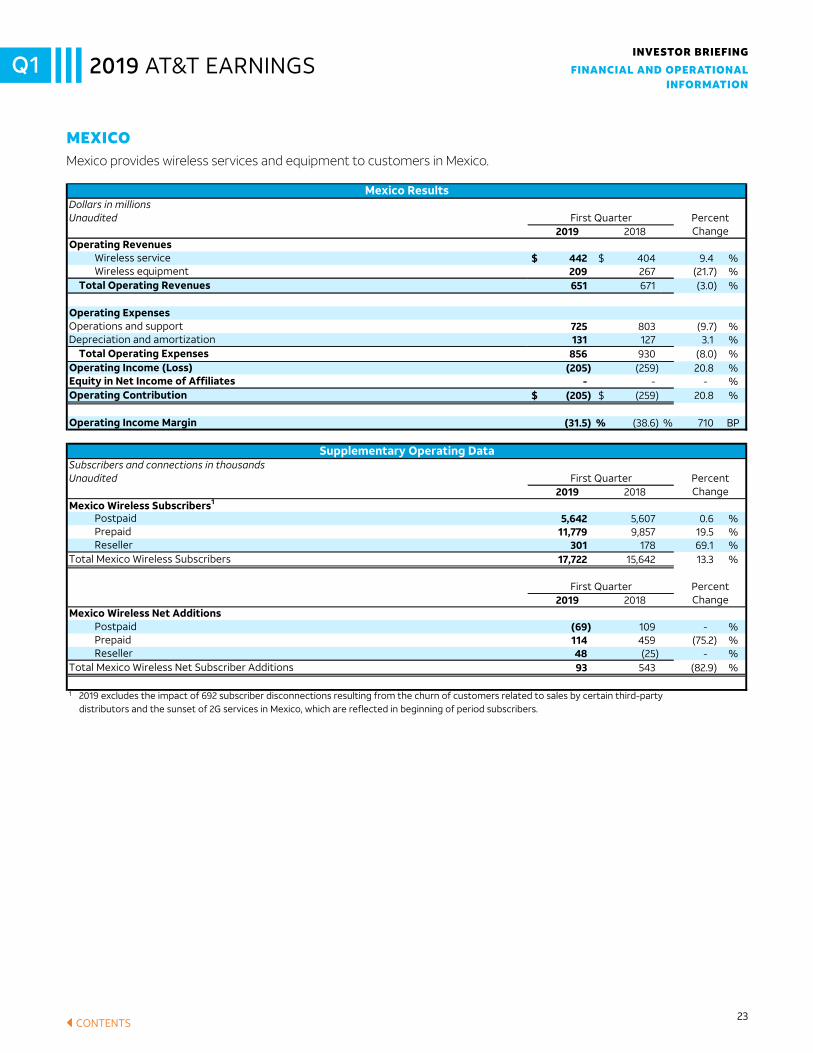
Revenues Nj $651 million, down 3.0% year over year, primarily due to lower equipment sales from
introduction of the NEXT installment purchase program in the prior year and foreign exchange pressure, which was partially offset by service revenue growth
Service Revenues Nj $442 million, up 9.4% year over year due to subscriber growth, partially offset by lower ARPU
Operating Loss Nj ($205) million, compared to a loss of ($259) million in the year-ago quarter with continued subscriber growth
Subscriber Metrics Nj 93,000 total net adds; 114,000 prepaid net adds, 69,000 postpaid net losses and 48,000 reseller net adds to reach 17.7 million total wireless subscribers
Revenues Nj $1.1 billion, down 21.2% year over year primarily due to foreign exchange pressures
Operating Income Nj $32 million compared to $148 million in the year-ago quarter with continued positive cash flow for the quarter
Subscriber Metrics Nj 32,000 net loss; total subscribers at the end of the quarter were 13.6 million
Nj Sky Mexico, an equity method investment, had approximately 7.6 million subscribers as of December 31, 2018
11CONTENTS
INVESTOR BRIEFING2019 AT&T EARNINGSQ1
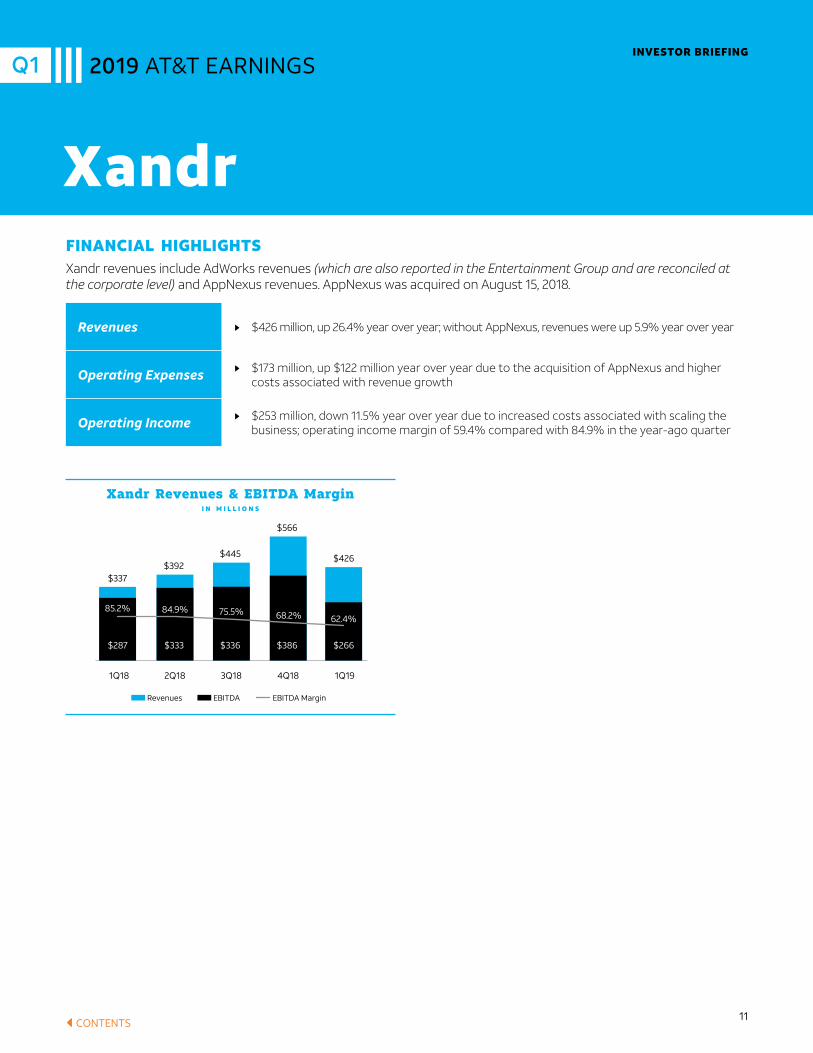
XandrFINANCIAL HIGHLIGHTSXandr revenues include AdWorks revenues (which are also reported in the Entertainment Group and are reconciled at the corporate level) and AppNexus revenues. AppNexus was acquired on August 15, 2018.
Xandr Revenues & EBITDA Margin I N M I L L I O N S
1Q18 2Q18 3Q18 4Q18 1Q19
Revenues EBITDA EBITDA Margin
$392$337
$445
$566
$426
85.2% 84.9% 75.5% 68.2% 62.4%
$287 $333 $336 $386 $266
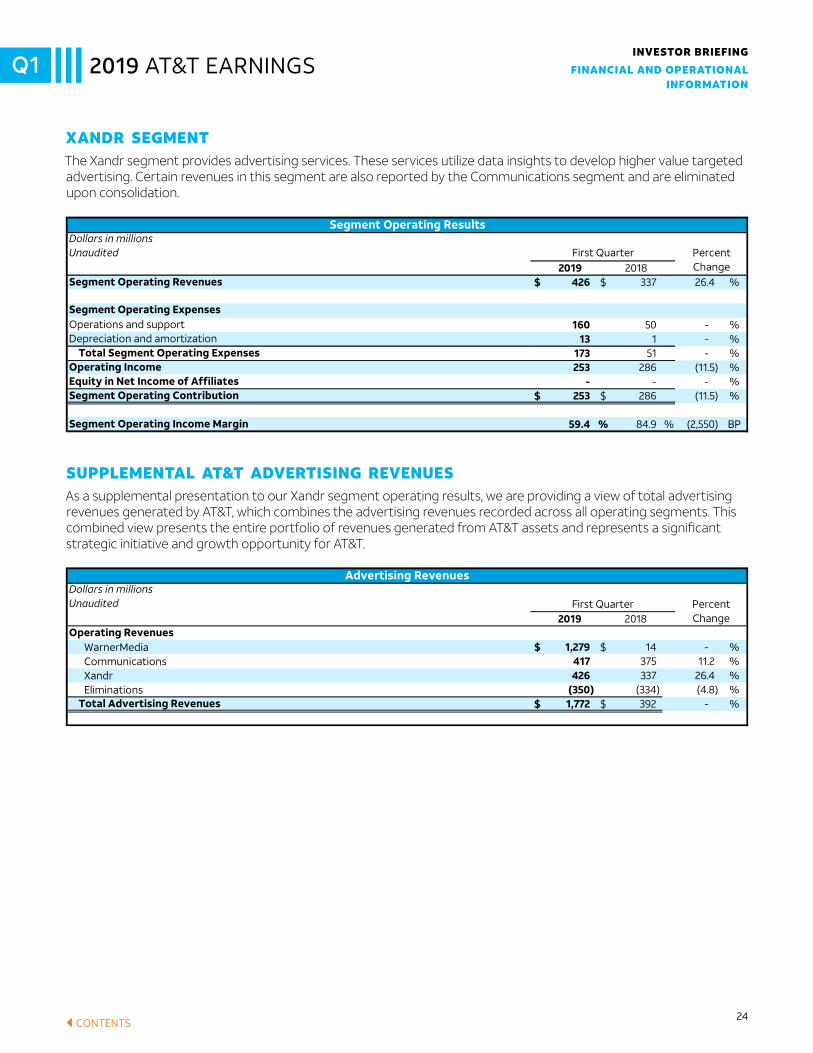
Revenues Nj $426 million, up 26.4% year over year; without AppNexus, revenues were up 5.9% year over year
Operating Expenses Nj $173 million, up $122 million year over year due to the acquisition of AppNexus and higher costs associated with revenue growth
Operating Income Nj $253 million, down 11.5% year over year due to increased costs associated with scaling the business; operating income margin of 59.4% compared with 84.9% in the year-ago quarter

12CONTENTS
INVESTOR BRIEFING2019 AT&T EARNINGSQ1
SECOND-QUARTER 2019 EARNINGS DATE: JULY 24, 2019AT&T will release second-quarter 2019 earnings on July 24, 2019 before the market opens.
The company’s Investor Briefing and related earnings materials will be available on the AT&T website at https://investors.att.com by 7:30 a.m. Eastern time.
AT&T will also host a conference call to discuss the results at 8:30 a.m. Eastern time the same day. Dial-in and replay information will be announced on First Call approximately 8 weeks before the call, which will also be broadcast live and will be available for replay over the internet at https://investors.att.com.
CAUTIONARY LANGUAGE CONCERNING FORWARD-LOOKING STATEMENTSInformation set forth in this Investor Briefing contains financial estimates and other forward-looking statements that are subject to risks and uncertainties, and actual results may differ materially. A discussion of factors that may affect future results is contained in AT&T’s filings with the Securities and Exchange Commission. AT&T disclaims any obligation to update or revise statements contained in this Investor Briefing based on new information or otherwise.
This Investor Briefing may contain certain non-GAAP financial measures. Reconciliations between the non-GAAP financial measures and the GAAP financial measures are included in the exhibits to the Investor Briefing and are available on the company’s website at https://investors.att.com.
The “quiet period” for FCC Spectrum Auctions 101/102 (28Ghz and 24Ghz) is now in effect. During the quiet period, auction applicants are required to avoid discussions of bids, bidding strategy and post-auction market structure with other auction applicants.
AT&T INVESTOR BRIEFINGThe AT&T Investor Briefing is published by the Investor Relations staff of AT&T Inc. Requests for further information may be directed to one of the Investor Relations managers by phone at 210-351-3327.
Correspondence should be sent to: Investor Relations AT&T Inc. 208 S. Akard Street Dallas, TX 75202
Email address: [email protected]
Senior Vice President-Investor Relations Mike Viola
Investor Relations Staff Jamie Anderson Tim Bever Michael Black Jeston Dumas Kent Evans Matt GallaherJulie KimNate MelihercikMartin Sheehan Chris Womack
13CONTENTS
INVESTOR BRIEFING2019 AT&T EARNINGSQ1
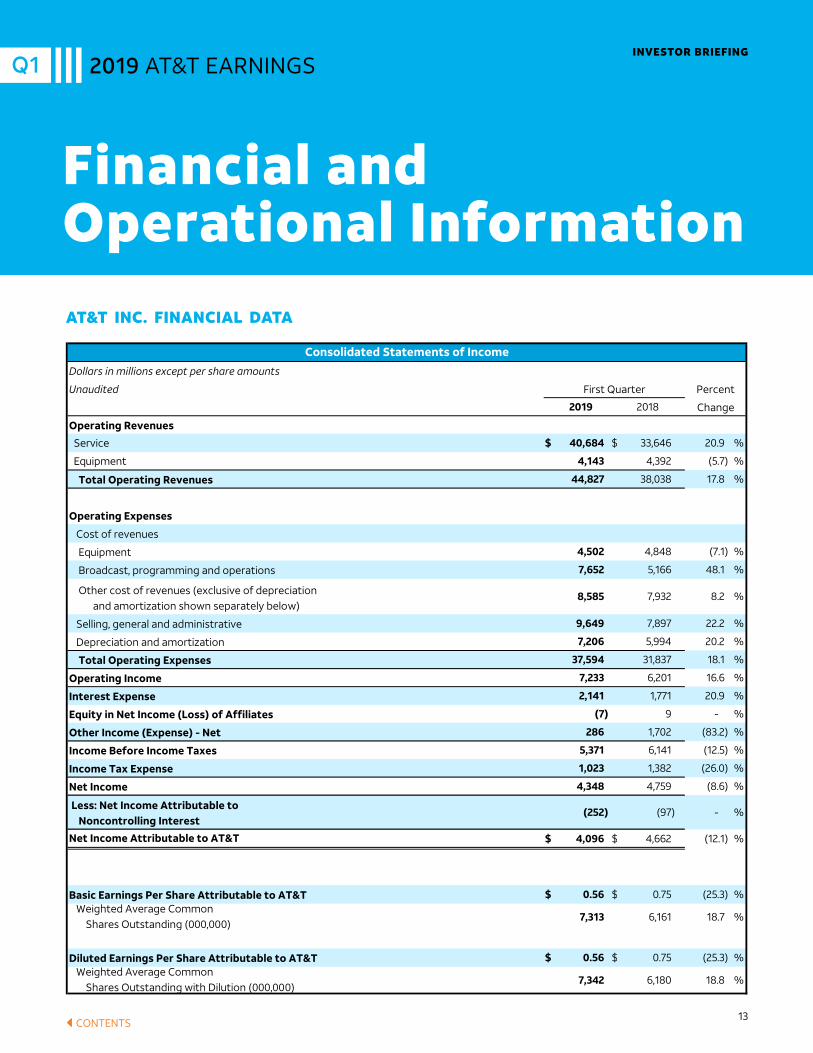
Financial and Operational InformationAT&T INC. FINANCIAL DATA
2019 2018
Service $ 40,684 $ 33,646 20.9 %
Equipment 4,143 4,392 (5.7) %
44,827 38,038 17.8 %
4,502 4,848 (7.1) %
7,652 5,166 48.1 %
8,585 7,932 8.2 %
9,649 7,897 22.2 %
7,206 5,994 20.2 %
37,594 31,837 18.1 %
7,233 6,201 16.6 %
2,141 1,771 20.9 %
(7) 9 - %
286 1,702 (83.2) %
5,371 6,141 (12.5) %
1,023 1,382 (26.0) %
4,348 4,759 (8.6) %
(252) (97) - %
$ 4,096 $ 4,662 (12.1) %
$ 0.56 $ 0.75 (25.3) %
7,313 6,161 18.7 %
$ 0.56 $ 0.75 (25.3) %
7,342 6,180 18.8 %
Diluted Earnings Per Share Attributable to AT&T Weighted Average Common Shares Outstanding with Dilution (000,000)
Net Income
Less: Net Income Attributable to Noncontrolling Interest
Net Income Attributable to AT&T
Basic Earnings Per Share Attributable to AT&T Weighted Average Common Shares Outstanding (000,000)
Interest Expense
Equity in Net Income (Loss) of Affiliates
Other Income (Expense) - Net
Income Before Income Taxes
Income Tax Expense
Other cost of revenues (exclusive of depreciation and amortization shown separately below)
Selling, general and administrative
Depreciation and amortization
Total Operating Expenses
Operating Income
Total Operating Revenues
Operating Expenses
Cost of revenues
Equipment
Broadcast, programming and operations
Unaudited First Quarter Percent
Change
Operating Revenues
AT&T Inc.Financial Data
Consolidated Statements of IncomeDollars in millions except per share amounts
1
14CONTENTS
FINANCIAL AND OPERATIONAL INFORMATION
INVESTOR BRIEFING2019 AT&T EARNINGSQ1
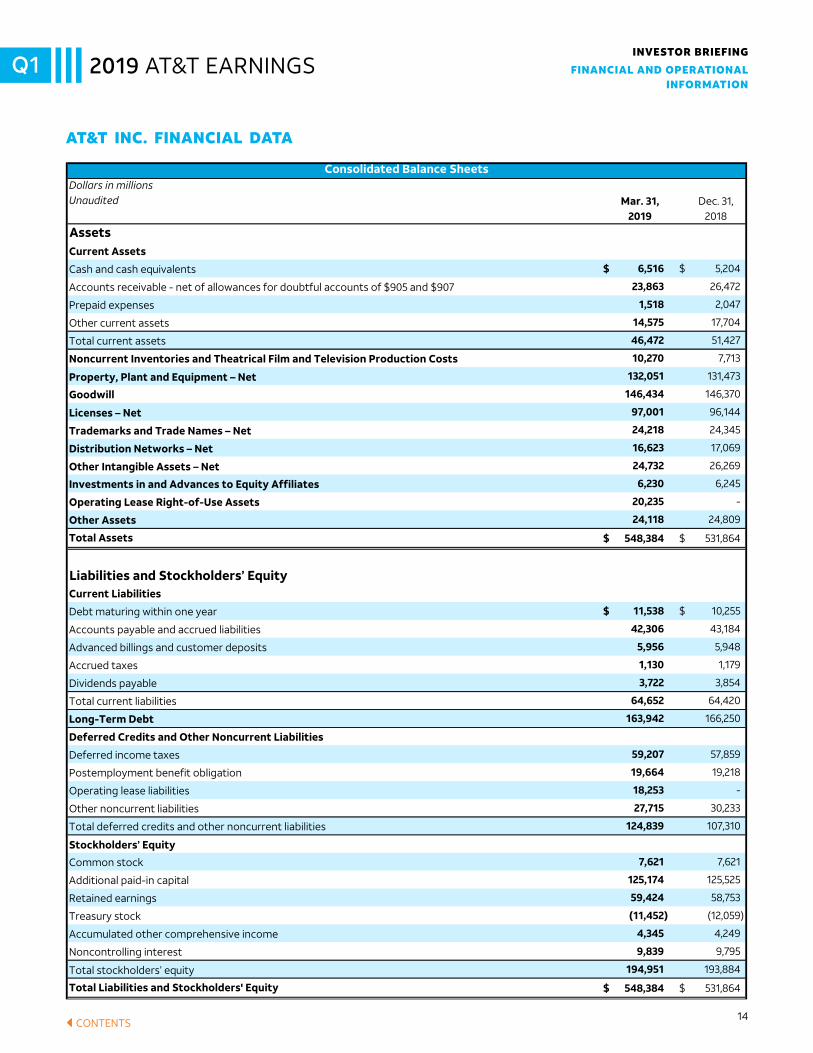
Mar. 31, Dec. 31,2019 2018
$ 6,516 $ 5,204
23,863 26,472
1,518 2,047
14,575 17,704
46,472 51,427
10,270 7,713
132,051 131,473
146,434 146,370
97,001 96,144
24,218 24,345
16,623 17,069
24,732 26,269
6,230 6,245
20,235 -
24,118 24,809
$ 548,384 $ 531,864
$ 11,538 $ 10,255
42,306 43,184
5,956 5,948
1,130 1,179
3,722 3,854
64,652 64,420
163,942 166,250
59,207 57,859
19,664 19,218
18,253 -
27,715 30,233
124,839 107,310
7,621 7,621
125,174 125,525
59,424 58,753
(11,452) (12,059)
4,345 4,249
9,839 9,795
194,951 193,884
$ 548,384 $ 531,864
Noncontrolling interest
Total stockholders’ equity
Total Liabilities and Stockholders' Equity
Common stock
Additional paid-in capital
Retained earnings
Treasury stock
Accumulated other comprehensive income
Postemployment benefit obligation
Operating lease liabilities
Other noncurrent liabilities
Total deferred credits and other noncurrent liabilities
Stockholders’ Equity
Dividends payable
Total current liabilities
Long-Term Debt
Deferred Credits and Other Noncurrent Liabilities
Deferred income taxes
Current Liabilities
Debt maturing within one year
Accounts payable and accrued liabilities
Advanced billings and customer deposits
Accrued taxes
Investments in and Advances to Equity Affiliates
Operating Lease Right-of-Use Assets
Other Assets
Total Assets
Liabilities and Stockholders’ Equity
Goodwill
Licenses – Net
Trademarks and Trade Names – Net
Distribution Networks – Net
Other Intangible Assets – Net
Prepaid expenses
Other current assets
Total current assets
Noncurrent Inventories and Theatrical Film and Television Production Costs
Property, Plant and Equipment – Net
Unaudited
AssetsCurrent Assets
Cash and cash equivalents
Accounts receivable - net of allowances for doubtful accounts of $905 and $907
AT&T Inc.Financial Data
Consolidated Balance SheetsDollars in millions
2
AT&T INC. FINANCIAL DATA

15CONTENTS
FINANCIAL AND OPERATIONAL INFORMATION
INVESTOR BRIEFING2019 AT&T EARNINGSQ1
2019 2018
$ 4,348 $ 4,759
Depreciation and amortization 7,206 5,994 Amortization of film and television costs 2,497 - Undistributed earnings from investments in equity affiliates 112 (2) Provision for uncollectible accounts 592 438 Deferred income tax expense (benefit) 1,069 1,222 Net (gain) loss from investments, net of impairments (175) 2 Actuarial (gain) loss on pension and postretirement benefits 432 (930)
Accounts receivable 1,894 (439) Other current assets, inventories and theatrical film and television production costs (2,510) 614 Accounts payable and other accrued liabilities (3,686) (1,962) Equipment installment receivables and related sales 652 505 Deferred customer contract acquisition and fulfillment costs (375) (826)
- (140) (1,004) (288) 6,704 4,188
11,052 8,947
Purchase of property and equipment (5,121) (5,957) Interest during construction (61) (161)
(213) (234) 10 56 (1) (116)
(15) (1,007) - 267
(5,401) (7,152)
(256) - 296 -
(176) - 9,182 2,565
(9,840) (4,911) (189) (145)
167 11 (3,714) (3,070)
109 2,048 (4,421) (3,502)
1,230 (1,707) 5,400 50,932
$ 6,630 $ 49,225
Net Cash Used in Financing ActivitiesNet increase (decrease) in cash and cash equivalents and restricted cashCash and cash equivalents and restricted cash beginning of yearCash and Cash Equivalents and Restricted Cash End of Period
Repayment of long-term debtPurchase of treasury stockIssuance of treasury stockDividends paidOther
Financing ActivitiesNet change in short-term borrowings with original maturities of three months or lessIssuance of other short-term borrowingsRepayment of other short-term borrowingsIssuance of long-term debt
(Purchases) sales of securities, netAdvances to and investments in equity affiliates, netCash collections of deferred purchase priceNet Cash Used in Investing Activities
Investing ActivitiesCapital expenditures:
Acquisitions, net of cash acquiredDispositions
Changes in operating assets and liabilities:
Retirement benefit fundingOther - netTotal adjustmentsNet Cash Provided by Operating Activities
Unaudited First Quarter
Operating ActivitiesNet incomeAdjustments to reconcile net income to net cash provided by operating activities:
AT&T Inc.Financial Data
Consolidated Statements of Cash FlowsDollars in millions
3
AT&T INC. FINANCIAL DATA
16CONTENTS
FINANCIAL AND OPERATIONAL INFORMATION
INVESTOR BRIEFING2019 AT&T EARNINGSQ1
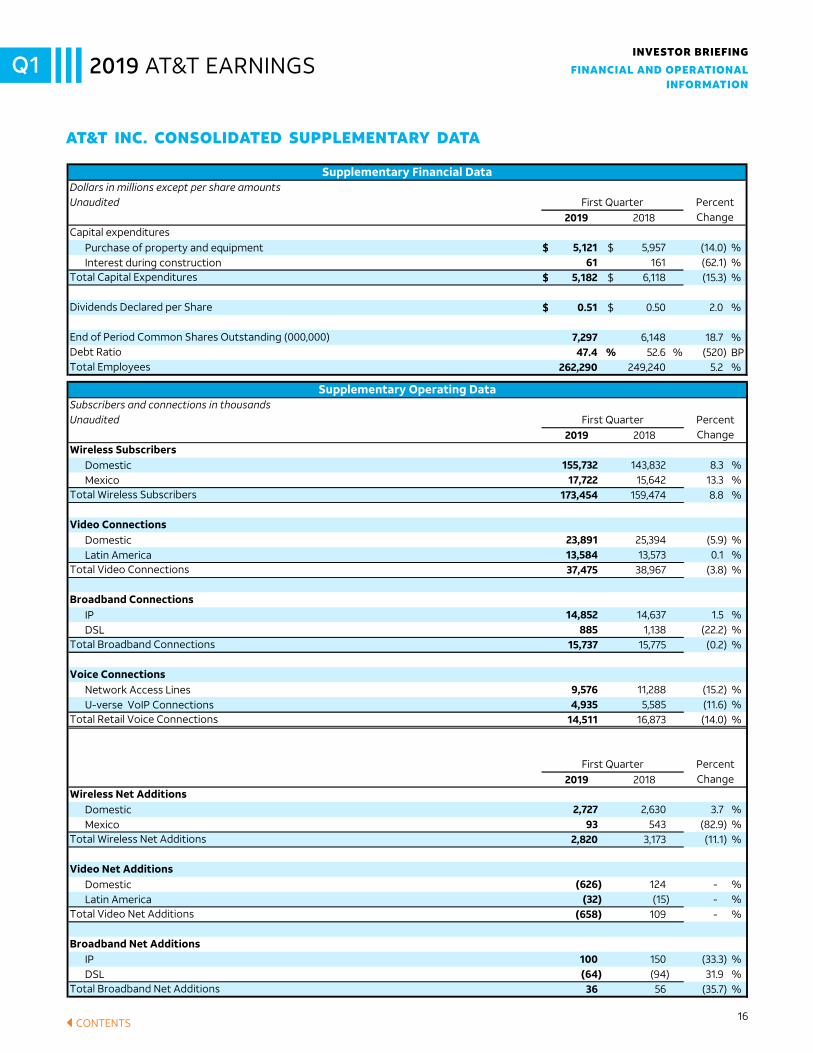
AT&T INC. CONSOLIDATED SUPPLEMENTARY DATA
2019 2018
Purchase of property and equipment $ 5,121 $ 5,957 (14.0) %Interest during construction 61 161 (62.1) %
$ 5,182 $ 6,118 (15.3) %
$ 0.51 $ 0.50 2.0 %
7,297 6,148 18.7 %47.4 % 52.6 % (520) BP
262,290 249,240 5.2 %
2019 2018
Domestic 155,732 143,832 8.3 %Mexico 17,722 15,642 13.3 %
173,454 159,474 8.8 %
Domestic 23,891 25,394 (5.9) %Latin America 13,584 13,573 0.1 %
37,475 38,967 (3.8) %
IP 14,852 14,637 1.5 %DSL 885 1,138 (22.2) %
15,737 15,775 (0.2) %
Network Access Lines 9,576 11,288 (15.2) %U-verse VoIP Connections 4,935 5,585 (11.6) %
14,511 16,873 (14.0) %
2019 2018
Domestic 2,727 2,630 3.7 %Mexico 93 543 (82.9) %
2,820 3,173 (11.1) %
Domestic (626) 124 - %Latin America (32) (15) - %
(658) 109 - %
IP 100 150 (33.3) %DSL (64) (94) 31.9 %
36 56 (35.7) %
Total Video Net Additions
Broadband Net Additions
Total Broadband Net Additions
PercentChange
Wireless Net Additions
Total Wireless Net Additions
Video Net Additions
Broadband Connections
Total Broadband Connections
Voice Connections
Total Retail Voice Connections
First Quarter
ChangeWireless Subscribers
Total Wireless Subscribers
Video Connections
Total Video Connections
Supplementary Operating DataSubscribers and connections in thousandsUnaudited First Quarter Percent
Total Capital Expenditures
Dividends Declared per Share
End of Period Common Shares Outstanding (000,000)Debt RatioTotal Employees
Unaudited First Quarter PercentChange
Capital expenditures
AT&T Inc.Consolidated Supplementary Data
Supplementary Financial DataDollars in millions except per share amounts
4
2019 2018
Purchase of property and equipment $ 5,121 $ 5,957 (14.0) %Interest during construction 61 161 (62.1) %
$ 5,182 $ 6,118 (15.3) %
$ 0.51 $ 0.50 2.0 %
7,297 6,148 18.7 %47.4 % 52.6 % (520) BP
262,290 249,240 5.2 %
2019 2018
Domestic 155,732 143,832 8.3 %Mexico 17,722 15,642 13.3 %
173,454 159,474 8.8 %
Domestic 23,891 25,394 (5.9) %Latin America 13,584 13,573 0.1 %
37,475 38,967 (3.8) %
IP 14,852 14,637 1.5 %DSL 885 1,138 (22.2) %
15,737 15,775 (0.2) %
Network Access Lines 9,576 11,288 (15.2) %U-verse VoIP Connections 4,935 5,585 (11.6) %
14,511 16,873 (14.0) %
2019 2018
Domestic 2,727 2,630 3.7 %Mexico 93 543 (82.9) %
2,820 3,173 (11.1) %
Domestic (626) 124 - %Latin America (32) (15) - %
(658) 109 - %
IP 100 150 (33.3) %DSL (64) (94) 31.9 %
36 56 (35.7) %
Total Video Net Additions
Broadband Net Additions
Total Broadband Net Additions
PercentChange
Wireless Net Additions
Total Wireless Net Additions
Video Net Additions
Broadband Connections
Total Broadband Connections
Voice Connections
Total Retail Voice Connections
First Quarter
ChangeWireless Subscribers
Total Wireless Subscribers
Video Connections
Total Video Connections
Supplementary Operating DataSubscribers and connections in thousandsUnaudited First Quarter Percent
Total Capital Expenditures
Dividends Declared per Share
End of Period Common Shares Outstanding (000,000)Debt RatioTotal Employees
Unaudited First Quarter PercentChange
Capital expenditures
AT&T Inc.Consolidated Supplementary Data
Supplementary Financial DataDollars in millions except per share amounts
4
17CONTENTS
FINANCIAL AND OPERATIONAL INFORMATION
INVESTOR BRIEFING2019 AT&T EARNINGSQ1
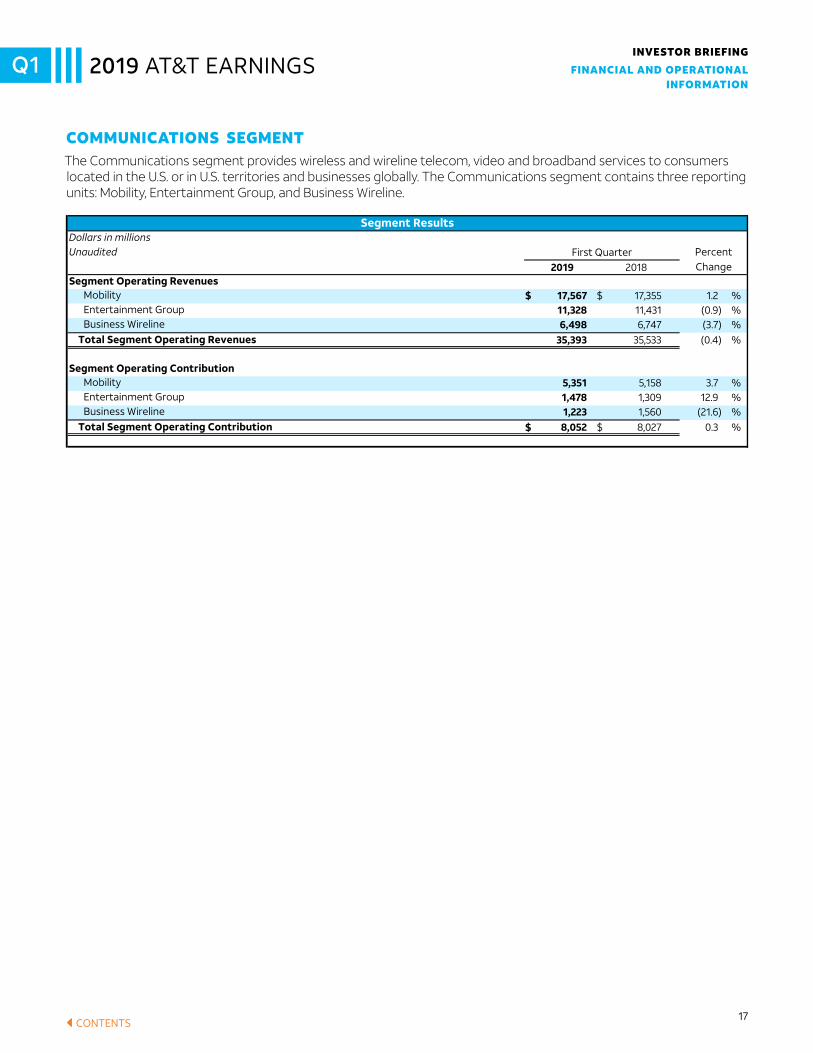
COMMUNICATIONS SEGMENTThe Communications segment provides wireless and wireline telecom, video and broadband services to consumers located in the U.S. or in U.S. territories and businesses globally. The Communications segment contains three reporting units: Mobility, Entertainment Group, and Business Wireline.
2019 2018
Mobility $ 17,567 $ 17,355 1.2 % Entertainment Group 11,328 11,431 (0.9) %Business Wireline 6,498 6,747 (3.7) %
35,393 35,533 (0.4) %
Mobility 5,351 5,158 3.7 % Entertainment Group 1,478 1,309 12.9 %Business Wireline 1,223 1,560 (21.6) %
$ 8,052 $ 8,027 0.3 %
2019 2018
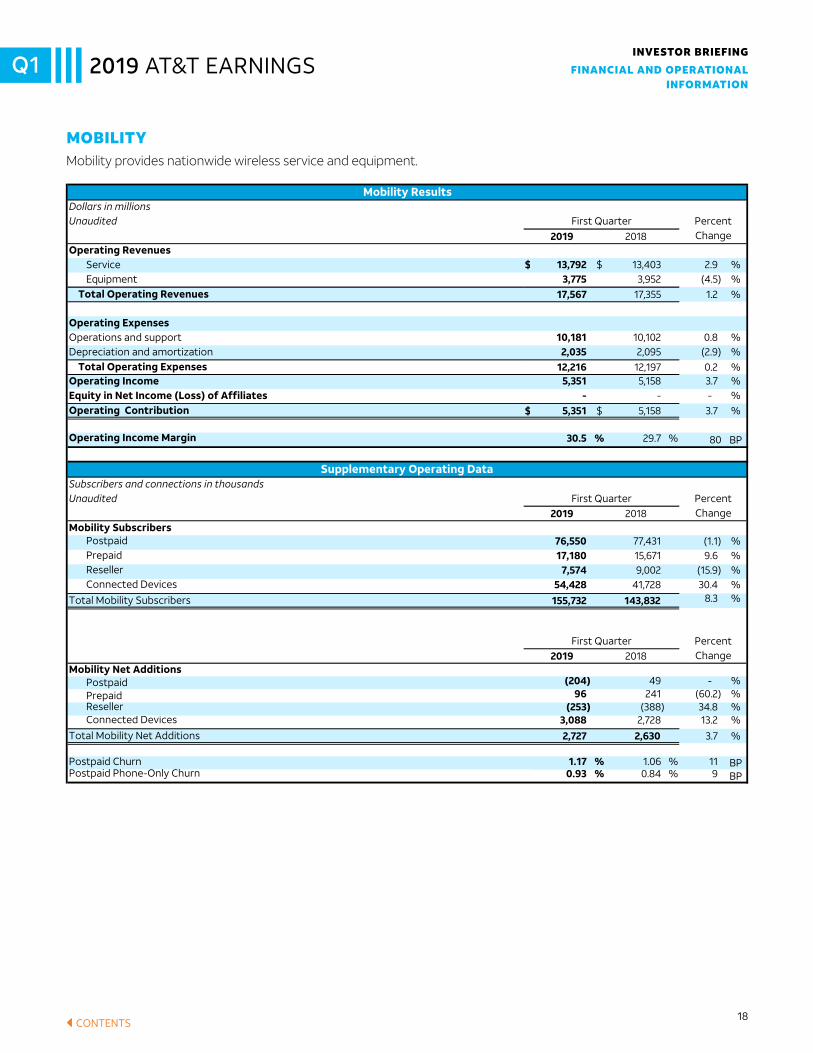
$ 13,792 $ 13,403 2.9 % 3,775 3,952 (4.5) %
17,567 17,355 1.2 %
10,181 10,102 0.8 %2,035 2,095 (2.9) %
12,216 12,197 0.2 %5,351 5,158 3.7 %
- - - %$ 5,351 $ 5,158 3.7 %
30.5 % 29.7 % 80 BP
2019 2018
76,550 77,431 (1.1) %17,180 15,671 9.6 %
7,574 9,002 (15.9) %54,428 41,728 30.4 %
155,732 143,832 8.3 %
2019 2018
(204) 49 - %96 241 (60.2) %
(253) (388) 34.8 %3,088 2,728 13.2 %
2,727 2,630 3.7 %
1.17 % 1.06 % 11 BP0.93 % 0.84 % 9 BP
Mobility
Mobility provides nationwide wireless service and equipment.
Mobility ResultsDollars in millionsUnaudited First Quarter Percent
ChangeOperating Revenues
Total Operating ExpensesOperating IncomeEquity in Net Income (Loss) of AffiliatesOperating Contribution
ServiceEquipment
Total Operating Revenues
Operating ExpensesOperations and support
First Quarter Percent
ChangeMobility Subscribers
PostpaidPrepaidReseller
Postpaid ChurnPostpaid Phone-Only Churn
ChangeMobility Net Additions
PostpaidPrepaidReseller
Total Segment Operating Revenues
Segment Operating Contribution
Total Segment Operating Contribution
Connected Devices
Total Mobility Net Additions
Connected Devices
Total Mobility Subscribers
Operating Income Margin
Supplementary Operating DataSubscribers and connections in thousandsUnaudited First Quarter Percent
Depreciation and amortization
Unaudited First Quarter PercentChange
Segment Operating Revenues
COMMUNICATIONS SEGMENT
The Communications segment provides wireless and wireline telecom, video and broadband services to consumers located in the U.S. or in U.S. territories and businesses globally. The Communications segment contains three reporting units: Mobility, Entertainment Group, and Business Wireline.
Segment ResultsDollars in millions
5
18CONTENTS
FINANCIAL AND OPERATIONAL INFORMATION
INVESTOR BRIEFING2019 AT&T EARNINGSQ1
MOBILITYMobility provides nationwide wireless service and equipment.
2019 2018
Mobility $ 17,567 $ 17,355 1.2 % Entertainment Group 11,328 11,431 (0.9) %Business Wireline 6,498 6,747 (3.7) %
35,393 35,533 (0.4) %
Mobility 5,351 5,158 3.7 % Entertainment Group 1,478 1,309 12.9 %Business Wireline 1,223 1,560 (21.6) %
$ 8,052 $ 8,027 0.3 %
2019 2018
$ 13,792 $ 13,403 2.9 % 3,775 3,952 (4.5) %
17,567 17,355 1.2 %
10,181 10,102 0.8 %2,035 2,095 (2.9) %
12,216 12,197 0.2 %5,351 5,158 3.7 %
- - - %$ 5,351 $ 5,158 3.7 %
30.5 % 29.7 % 80 BP
2019 2018
76,550 77,431 (1.1) %17,180 15,671 9.6 %
7,574 9,002 (15.9) %54,428 41,728 30.4 %
155,732 143,832 8.3 %
2019 2018
(204) 49 - %96 241 (60.2) %
(253) (388) 34.8 %3,088 2,728 13.2 %
2,727 2,630 3.7 %
1.17 % 1.06 % 11 BP0.93 % 0.84 % 9 BP
Mobility
Mobility provides nationwide wireless service and equipment.
Mobility ResultsDollars in millionsUnaudited First Quarter Percent
ChangeOperating Revenues
Total Operating ExpensesOperating IncomeEquity in Net Income (Loss) of AffiliatesOperating Contribution
ServiceEquipment
Total Operating Revenues
Operating ExpensesOperations and support
First Quarter Percent
ChangeMobility Subscribers
PostpaidPrepaidReseller
Postpaid ChurnPostpaid Phone-Only Churn
ChangeMobility Net Additions
PostpaidPrepaidReseller
Total Segment Operating Revenues
Segment Operating Contribution
Total Segment Operating Contribution
Connected Devices
Total Mobility Net Additions
Connected Devices
Total Mobility Subscribers
Operating Income Margin
Supplementary Operating DataSubscribers and connections in thousandsUnaudited First Quarter Percent
Depreciation and amortization
Unaudited First Quarter PercentChange
Segment Operating Revenues
COMMUNICATIONS SEGMENT
The Communications segment provides wireless and wireline telecom, video and broadband services to consumers located in the U.S. or in U.S. territories and businesses globally. The Communications segment contains three reporting units: Mobility, Entertainment Group, and Business Wireline.
Segment ResultsDollars in millions
5
19CONTENTS
FINANCIAL AND OPERATIONAL INFORMATION
INVESTOR BRIEFING2019 AT&T EARNINGSQ1
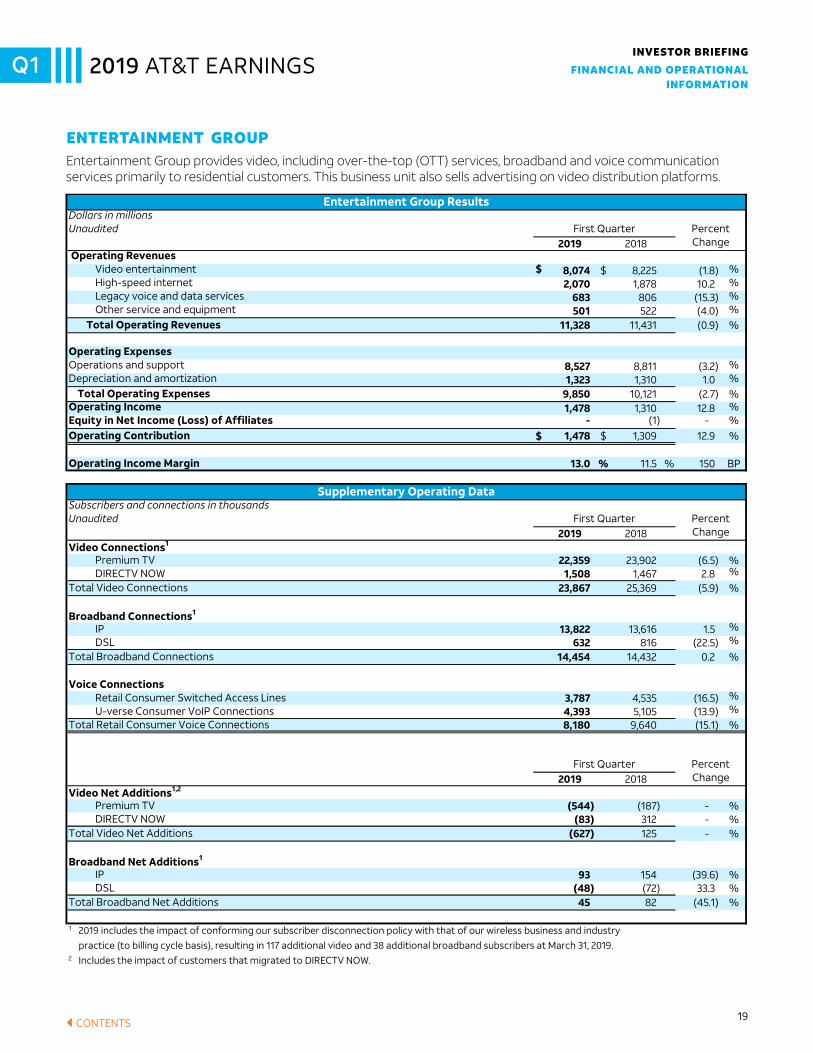
ENTERTAINMENT GROUPEntertainment Group provides video, including over-the-top (OTT) services, broadband and voice communication services primarily to residential customers. This business unit also sells advertising on video distribution platforms.
2019 2018
$ 8,074 $ 8,225 (1.8) % 2,070 1,878 10.2 %
683 806 (15.3) % 501 522 (4.0) %
11,328 11,431 (0.9) %
8,527 8,811 (3.2) %1,323 1,310 1.0 %
9,850 10,121 (2.7) %1,478 1,310 12.8 %
- (1) - %$ 1,478 $ 1,309 12.9 %
13.0 % 11.5 % 150 BP
2019 2018
22,359 23,902 (6.5) %1,508 1,467 2.8 %
23,867 25,369 (5.9) %
13,822 13,616 1.5 %632 816 (22.5) %
14,454 14,432 0.2 %
3,787 4,535 (16.5) %4,393 5,105 (13.9) %8,180 9,640 (15.1) %
2019 2018
(544) (187) - %(83) 312 - %
(627) 125 - %
93 154 (39.6) %(48) (72) 33.3 %45 82 (45.1) %
1
2 Includes the impact of customers that migrated to DIRECTV NOW.
IPDSL
Total Broadband Net Additions
2019 includes the impact of conforming our subscriber disconnection policy with that of our wireless business and industry
practice (to billing cycle basis), resulting in 117 additional video and 38 additional broadband subscribers at March 31, 2019.
Video Net Additions1,2
Premium TVDIRECTV NOW
Total Video Net Additions
Broadband Net Additions1
Total Retail Consumer Voice Connections
First Quarter PercentChange
DSLTotal Broadband Connections
Voice ConnectionsRetail Consumer Switched Access LinesU-verse Consumer VoIP Connections
Premium TVDIRECTV NOW
Total Video Connections
Broadband Connections1
IP
Unaudited First Quarter PercentChange
Video Connections1
Equity in Net Income (Loss) of AffiliatesOperating Contribution
Operating Income Margin
Supplementary Operating DataSubscribers and connections in thousands
Operating ExpensesOperations and support Depreciation and amortization
Total Operating ExpensesOperating Income
Video entertainmentHigh-speed internetLegacy voice and data servicesOther service and equipment
Total Operating Revenues
Unaudited First Quarter PercentChange
Operating Revenues
Entertainment Group
Entertainment Group provides video, including over-the-top (OTT) services, broadband and voice communication services primarily to residential customers. This business unit also sells advertising on video distribution platforms.
Entertainment Group ResultsDollars in millions
6
20CONTENTS
FINANCIAL AND OPERATIONAL INFORMATION
INVESTOR BRIEFING2019 AT&T EARNINGSQ1
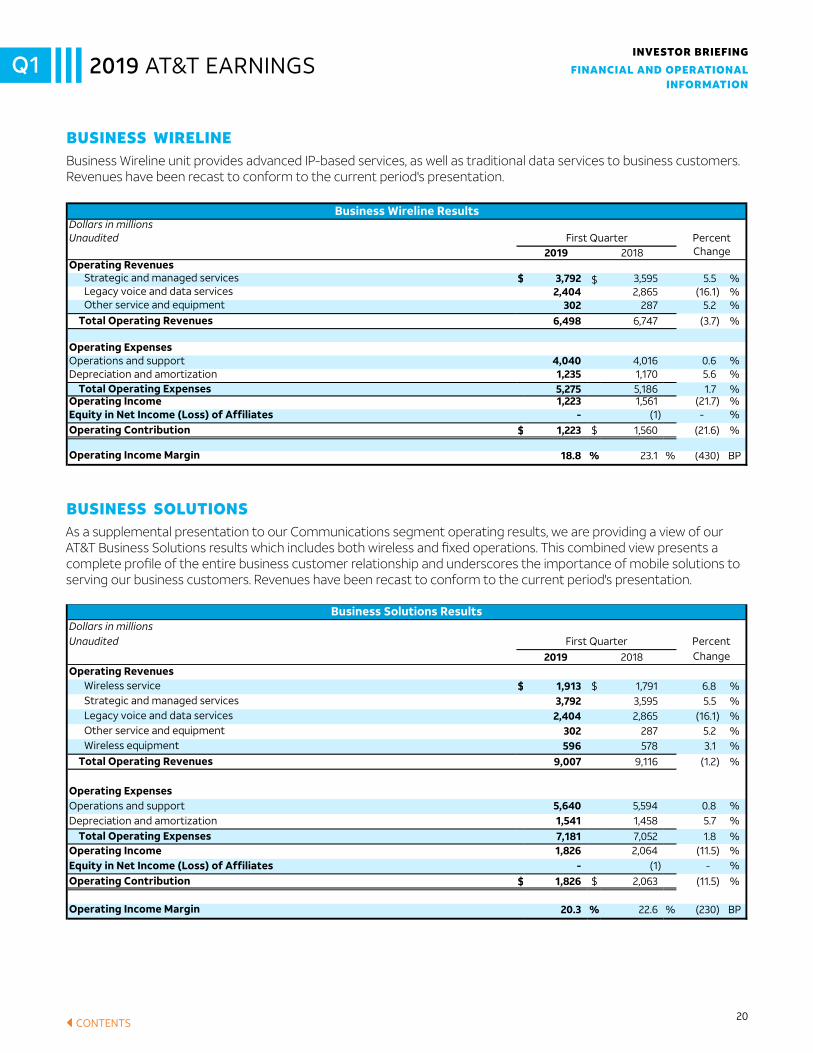
BUSINESS WIRELINEBusiness Wireline unit provides advanced IP-based services, as well as traditional data services to business customers. Revenues have been recast to conform to the current period's presentation.
BUSINESS SOLUTIONSAs a supplemental presentation to our Communications segment operating results, we are providing a view of our AT&T Business Solutions results which includes both wireless and fixed operations. This combined view presents a complete profile of the entire business customer relationship and underscores the importance of mobile solutions to serving our business customers. Revenues have been recast to conform to the current period's presentation.
2019 2018
Strategic and managed services $ 3,792 $ 3,595 5.5 % Legacy voice and data services 2,404 2,865 (16.1) %Other service and equipment 302 287 5.2 %
6,498 6,747 (3.7) %
4,040 4,016 0.6 % 1,235 1,170 5.6 %5,275 5,186 1.7 % 1,223 1,561 (21.7) %
- (1) - % $ 1,223 $ 1,560 (21.6) %
18.8 % 23.1 % (430) BP
2019 2018
Wireless service $ 1,913 $ 1,791 6.8 % Strategic and managed services 3,792 3,595 5.5 %Legacy voice and data services 2,404 2,865 (16.1) % Other service and equipment 302 287 5.2 %Wireless equipment 596 578 3.1 %
9,007 9,116 (1.2) %
5,640 5,594 0.8 % 1,541 1,458 5.7 %7,181 7,052 1.8 % 1,826 2,064 (11.5) %
- (1) - % $ 1,826 $ 2,063 (11.5) %
20.3 % 22.6 % (230) BP
First Quarter PercentChange
Business SolutionsAs a supplemental presentation to our Communications segment operating results, we are providing a view of our AT&T Business Solutions results which includes both wireless and fixed operations. This combined view presents a complete profile of the entire business customer relationship and underscores the importance of mobile solutions to serving our business customers. Revenues have been recast to conform to the current period's presentation.
Business Solutions ResultsDollars in millions
Operating Income Margin
Operating Income Margin
Depreciation and amortization Total Operating ExpensesOperating IncomeEquity in Net Income (Loss) of AffiliatesOperating Contribution
Operating Revenues
Total Operating Revenues
Operating ExpensesOperations and support
Unaudited
Depreciation and amortization Total Operating ExpensesOperating IncomeEquity in Net Income (Loss) of AffiliatesOperating Contribution
Operating Revenues
Total Operating Revenues
Operating ExpensesOperations and support
Unaudited First Quarter PercentChange
Business Wireline
Business Wireline unit provides advanced IP-based services, as well as traditional data services to business customers. Revenues have been recast to conform to the current period's presentation.
Business Wireline ResultsDollars in millions
7
2019 2018
Strategic and managed services $ 3,792 $ 3,595 5.5 % Legacy voice and data services 2,404 2,865 (16.1) %Other service and equipment 302 287 5.2 %
6,498 6,747 (3.7) %
4,040 4,016 0.6 % 1,235 1,170 5.6 %5,275 5,186 1.7 % 1,223 1,561 (21.7) %
- (1) - % $ 1,223 $ 1,560 (21.6) %
18.8 % 23.1 % (430) BP
2019 2018
Wireless service $ 1,913 $ 1,791 6.8 % Strategic and managed services 3,792 3,595 5.5 %Legacy voice and data services 2,404 2,865 (16.1) % Other service and equipment 302 287 5.2 %Wireless equipment 596 578 3.1 %
9,007 9,116 (1.2) %
5,640 5,594 0.8 % 1,541 1,458 5.7 %7,181 7,052 1.8 % 1,826 2,064 (11.5) %
- (1) - % $ 1,826 $ 2,063 (11.5) %
20.3 % 22.6 % (230) BP
First Quarter PercentChange
Business SolutionsAs a supplemental presentation to our Communications segment operating results, we are providing a view of our AT&T Business Solutions results which includes both wireless and fixed operations. This combined view presents a complete profile of the entire business customer relationship and underscores the importance of mobile solutions to serving our business customers. Revenues have been recast to conform to the current period's presentation.
Business Solutions ResultsDollars in millions
Operating Income Margin
Operating Income Margin
Depreciation and amortization Total Operating ExpensesOperating IncomeEquity in Net Income (Loss) of AffiliatesOperating Contribution
Operating Revenues
Total Operating Revenues
Operating ExpensesOperations and support
Unaudited
Depreciation and amortization Total Operating ExpensesOperating IncomeEquity in Net Income (Loss) of AffiliatesOperating Contribution
Operating Revenues
Total Operating Revenues
Operating ExpensesOperations and support
Unaudited First Quarter PercentChange
Business Wireline
Business Wireline unit provides advanced IP-based services, as well as traditional data services to business customers. Revenues have been recast to conform to the current period's presentation.
Business Wireline ResultsDollars in millions
7
21CONTENTS
FINANCIAL AND OPERATIONAL INFORMATION
INVESTOR BRIEFING2019 AT&T EARNINGSQ1
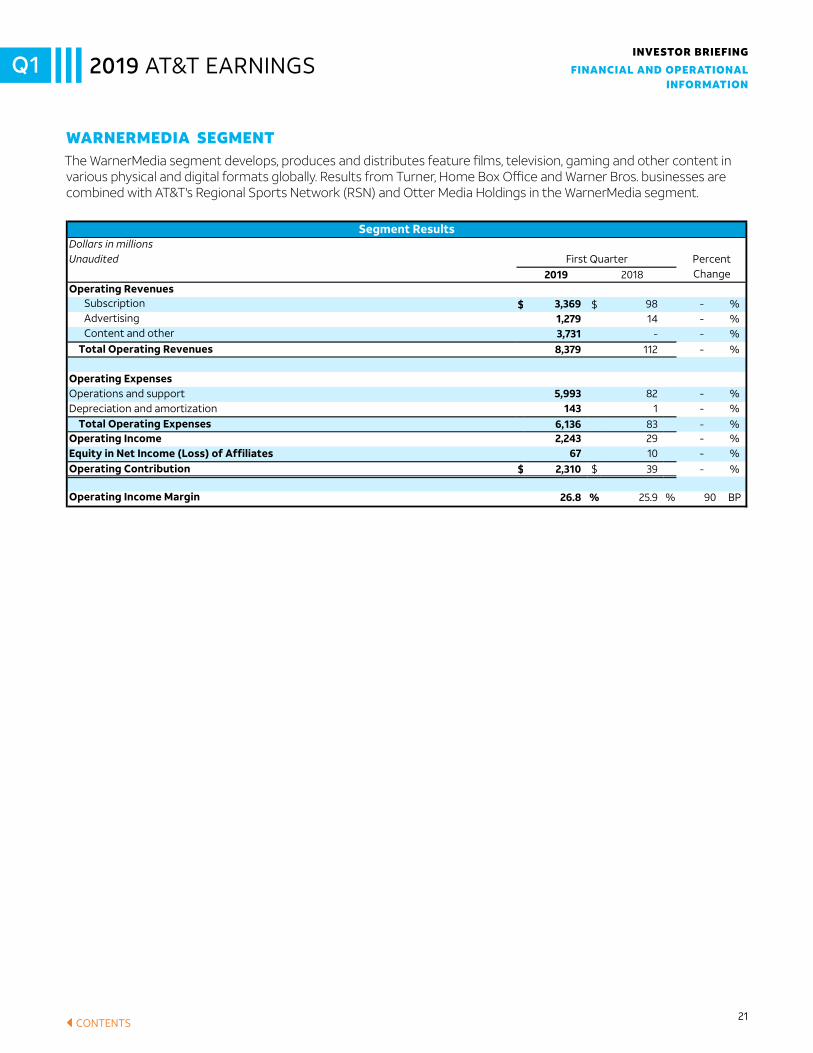
WARNERMEDIA SEGMENTThe WarnerMedia segment develops, produces and distributes feature films, television, gaming and other content in various physical and digital formats globally. Results from Turner, Home Box Office and Warner Bros. businesses are combined with AT&T's Regional Sports Network (RSN) and Otter Media Holdings in the WarnerMedia segment.
2019 2018
Subscription $ 3,369 $ 98 - % Advertising 1,279 14 - %Content and other 3,731 - - %
8,379 112 - %
5,993 82 - % 143 1 - %
6,136 83 - % 2,243 29 - %
67 10 - % $ 2,310 $ 39 - %
26.8 % 25.9 % 90 BP
2019 2018
Vrio $ 1,067 $ 1,354 (21.2) % Mexico 651 671 (3.0) %
1,718 2,025 (15.2) %
Vrio 32 148 (78.4) %Mexico (205) (259) 20.8 %
$ (173) $ (111) (55.9) % Total Segment Operating Contribution
ChangeSegment Operating Revenues
Total Segment Operating Revenues
Segment Operating Contribution
Segment ResultsDollars in millionsUnaudited First Quarter Percent
Operating Income Margin
LATIN AMERICA SEGMENT
The Latin America segment provides entertainment and wireless service outside of the U.S. Our international subsidiaries conduct businessin their local currency and operating results are converted to U.S. dollars using official exchange rates. The Latin America segment containstwo business units: Vrio and Mexico.
Depreciation and amortization Total Operating ExpensesOperating IncomeEquity in Net Income (Loss) of AffiliatesOperating Contribution
Operating Revenues
Total Operating Revenues
Operating ExpensesOperations and support
Unaudited First Quarter PercentChange
WARNERMEDIA SEGMENT
The WarnerMedia segment develops, produces and distributes feature films, television, gaming and other content in various physical and digital formats globally. Results from Turner, Home Box Office and Warner Bros. businesses are combined with AT&T's Regional Sports Network (RSN) and Otter Media Holdings in the WarnerMedia segment.
Segment ResultsDollars in millions
8
22CONTENTS
FINANCIAL AND OPERATIONAL INFORMATION
INVESTOR BRIEFING2019 AT&T EARNINGSQ1
VRIOVrio provides entertainment services to customers utilizing satellite technology in Latin America and the Caribbean.
LATIN AMERICA SEGMENTThe Latin America segment provides entertainment and wireless service outside of the U.S. Our international subsidiaries conduct business in their local currency and operating results are converted to U.S. dollars using official exchange rates. The Latin America segment contains two business units: Vrio and Mexico.
2019 2018$ 1,067 $ 1,354 (21.2) %
866 1,001 (13.5) %169 205 (17.6) %
1,035 1,206 (14.2) %32 148 (78.4) %
- - - %$ 32 $ 148 (78.4) %
3.0 % 10.9 % (790) BP
2019 201813,584 13,573 0.1 %
2019 2018(32) (15) - %
1
2019 2018
$ 442 $ 404 9.4 % 209 267 (21.7) %651 671 (3.0) %
725 803 (9.7) %131 127 3.1 %
856 930 (8.0) %(205) (259) 20.8 %
- - - %$ (205) $ (259) 20.8 %
(31.5) % (38.6) % 710 BP
2019 2018
5,642 5,607 0.6 % 11,779 9,857 19.5 %
301 178 69.1 % 17,722 15,642 13.3 %
2019 2018
(69) 109 - % 114 459 (75.2) %48 (25) - % 93 543 (82.9) %
1
PrepaidReseller
Total Mexico Wireless Net Subscriber Additions
2019 excludes the impact of 692 subscriber disconnections resulting from the churn of customers related to sales by certain third-partydistributors and the sunset of 2G services in Mexico, which are reflected in beginning of period subscribers.
PercentChange
Mexico Wireless Net AdditionsPostpaid
ResellerTotal Mexico Wireless Subscribers
First Quarter
ChangeMexico Wireless Subscribers1
PostpaidPrepaid
Operating Income Margin
Supplementary Operating DataSubscribers and connections in thousandsUnaudited First Quarter Percent
Total Operating ExpensesOperating Income (Loss)Equity in Net Income of AffiliatesOperating Contribution
Total Operating Revenues
Operating ExpensesOperations and supportDepreciation and amortization
ChangeOperating Revenues
Wireless serviceWireless equipment
Mexico ResultsDollars in millionsUnaudited First Quarter Percent
2019 excludes the impact of 222 subscriber disconnections resulting from conforming our video credit policy across the region, which is
reflected in beginning of period subscribers.
Mexico
Mexico provides wireless services and equipment to customers in Mexico.
First Quarter PercentChange
Vrio Video Net Subscriber Additions
Unaudited First Quarter PercentChange
Vrio Video Subscribers1
Equity in Net Income of AffiliatesOperating Contribution
Operating Income Margin
Supplementary Operating DataSubscribers and connections in thousands
Operating ExpensesOperations and supportDepreciation and amortization
Total Operating ExpensesOperating Income
Unaudited First Quarter PercentChange
Operating Revenues
Vrio
Vrio provides entertainment services to customers utilizing satellite technology in Latin America and the Caribbean.
Vrio ResultsDollars in millions
9
2019 2018
Subscription $ 3,369 $ 98 - % Advertising 1,279 14 - %Content and other 3,731 - - %
8,379 112 - %
5,993 82 - % 143 1 - %
6,136 83 - % 2,243 29 - %
67 10 - % $ 2,310 $ 39 - %
26.8 % 25.9 % 90 BP
2019 2018
Vrio $ 1,067 $ 1,354 (21.2) % Mexico 651 671 (3.0) %
1,718 2,025 (15.2) %
Vrio 32 148 (78.4) %Mexico (205) (259) 20.8 %
$ (173) $ (111) (55.9) % Total Segment Operating Contribution
ChangeSegment Operating Revenues
Total Segment Operating Revenues
Segment Operating Contribution
Segment ResultsDollars in millionsUnaudited First Quarter Percent
Operating Income Margin
LATIN AMERICA SEGMENT
The Latin America segment provides entertainment and wireless service outside of the U.S. Our international subsidiaries conduct businessin their local currency and operating results are converted to U.S. dollars using official exchange rates. The Latin America segment containstwo business units: Vrio and Mexico.
Depreciation and amortization Total Operating ExpensesOperating IncomeEquity in Net Income (Loss) of AffiliatesOperating Contribution
Operating Revenues
Total Operating Revenues
Operating ExpensesOperations and support
Unaudited First Quarter PercentChange
WARNERMEDIA SEGMENT
The WarnerMedia segment develops, produces and distributes feature films, television, gaming and other content in various physical and digital formats globally. Results from Turner, Home Box Office and Warner Bros. businesses are combined with AT&T's Regional Sports Network (RSN) and Otter Media Holdings in the WarnerMedia segment.
Segment ResultsDollars in millions
8
23CONTENTS
FINANCIAL AND OPERATIONAL INFORMATION
INVESTOR BRIEFING2019 AT&T EARNINGSQ1
MEXICOMexico provides wireless services and equipment to customers in Mexico.
2019 2018$ 1,067 $ 1,354 (21.2) %
866 1,001 (13.5) %169 205 (17.6) %
1,035 1,206 (14.2) %32 148 (78.4) %
- - - %$ 32 $ 148 (78.4) %
3.0 % 10.9 % (790) BP
2019 201813,584 13,573 0.1 %
2019 2018(32) (15) - %
1
2019 2018
$ 442 $ 404 9.4 % 209 267 (21.7) %651 671 (3.0) %
725 803 (9.7) %131 127 3.1 %
856 930 (8.0) %(205) (259) 20.8 %
- - - %$ (205) $ (259) 20.8 %
(31.5) % (38.6) % 710 BP
2019 2018
5,642 5,607 0.6 % 11,779 9,857 19.5 %
301 178 69.1 % 17,722 15,642 13.3 %
2019 2018
(69) 109 - % 114 459 (75.2) %48 (25) - % 93 543 (82.9) %
1
PrepaidReseller
Total Mexico Wireless Net Subscriber Additions
2019 excludes the impact of 692 subscriber disconnections resulting from the churn of customers related to sales by certain third-partydistributors and the sunset of 2G services in Mexico, which are reflected in beginning of period subscribers.
PercentChange
Mexico Wireless Net AdditionsPostpaid
ResellerTotal Mexico Wireless Subscribers
First Quarter
ChangeMexico Wireless Subscribers1
PostpaidPrepaid
Operating Income Margin
Supplementary Operating DataSubscribers and connections in thousandsUnaudited First Quarter Percent
Total Operating ExpensesOperating Income (Loss)Equity in Net Income of AffiliatesOperating Contribution
Total Operating Revenues
Operating ExpensesOperations and supportDepreciation and amortization
ChangeOperating Revenues
Wireless serviceWireless equipment
Mexico ResultsDollars in millionsUnaudited First Quarter Percent
2019 excludes the impact of 222 subscriber disconnections resulting from conforming our video credit policy across the region, which is
reflected in beginning of period subscribers.
Mexico
Mexico provides wireless services and equipment to customers in Mexico.
First Quarter PercentChange
Vrio Video Net Subscriber Additions
Unaudited First Quarter PercentChange
Vrio Video Subscribers1
Equity in Net Income of AffiliatesOperating Contribution
Operating Income Margin
Supplementary Operating DataSubscribers and connections in thousands
Operating ExpensesOperations and supportDepreciation and amortization
Total Operating ExpensesOperating Income
Unaudited First Quarter PercentChange
Operating Revenues
Vrio
Vrio provides entertainment services to customers utilizing satellite technology in Latin America and the Caribbean.
Vrio ResultsDollars in millions
9
24CONTENTS
FINANCIAL AND OPERATIONAL INFORMATION
INVESTOR BRIEFING2019 AT&T EARNINGSQ1
XANDR SEGMENTThe Xandr segment provides advertising services. These services utilize data insights to develop higher value targeted advertising. Certain revenues in this segment are also reported by the Communications segment and are eliminated upon consolidation.
SUPPLEMENTAL AT&T ADVERTISING REVENUESAs a supplemental presentation to our Xandr segment operating results, we are providing a view of total advertising revenues generated by AT&T, which combines the advertising revenues recorded across all operating segments. This combined view presents the entire portfolio of revenues generated from AT&T assets and represents a significant strategic initiative and growth opportunity for AT&T.
2019 2018$ 426 $ 337 26.4 %
160 50 - %13 1 - %
173 51 - %253 286 (11.5) %
- - - %$ 253 $ 286 (11.5) %
59.4 % 84.9 % (2,550) BP
2019 2018
WarnerMedia $ 1,279 $ 14 - % Communications 417 375 11.2 %Xandr 426 337 26.4 % Eliminations (350) (334) (4.8) %
$ 1,772 $ 392 - %
ChangeOperating Revenues
Total Advertising Revenues
Advertising RevenuesDollars in millionsUnaudited First Quarter Percent
Segment Operating Contribution
Segment Operating Income Margin
Supplemental AT&T Advertising Revenues
As a supplemental presentation to our Xandr segment operating results, we are providing a view of total advertising revenues generated byAT&T, which combines the advertising revenues recorded across all operating segments. This combined view presents the entire portfolioof revenues generated from AT&T assets and represents a significant strategic initiative and growth opportunity for AT&T.
Operations and supportDepreciation and amortization Total Segment Operating ExpensesOperating IncomeEquity in Net Income of Affiliates
ChangeSegment Operating Revenues
Segment Operating Expenses
Dollars in millionsUnaudited First Quarter Percent
XANDR SEGMENT
The Xandr segment provides advertising services. These services utilize data insights to develop higher value targeted advertising. Certainrevenues in this segment are also reported by the Communications segment and are eliminated upon consolidation.
Segment Operating Results
10
25CONTENTS
FINANCIAL AND OPERATIONAL INFORMATION
INVESTOR BRIEFING2019 AT&T EARNINGSQ1
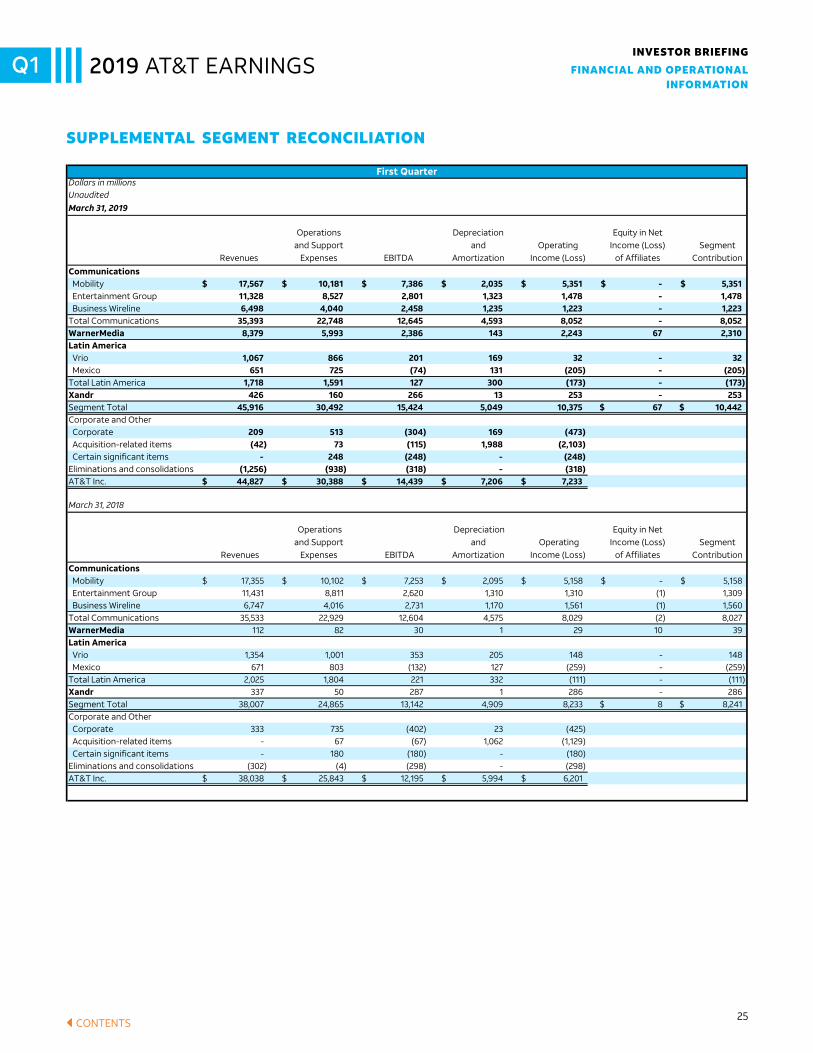
SUPPLEMENTAL SEGMENT RECONCILIATION
March 31, 2019
Revenues
Operations and Support
Expenses EBITDA
Depreciation and
AmortizationOperating
Income (Loss)
Equity in Net Income (Loss)
of AffiliatesSegment
Contribution
Communications Mobility $ 17,567 $ 10,181 $ 7,386 $ 2,035 $ 5,351 $ - $ 5,351 Entertainment Group 11,328 8,527 2,801 1,323 1,478 - 1,478 Business Wireline 6,498 4,040 2,458 1,235 1,223 - 1,223 Total Communications 35,393 22,748 12,645 4,593 8,052 - 8,052 WarnerMedia 8,379 5,993 2,386 143 2,243 67 2,310 Latin America Vrio 1,067 866 201 169 32 - 32 Mexico 651 725 (74) 131 (205) - (205) Total Latin America 1,718 1,591 127 300 (173) - (173) Xandr 426 160 266 13 253 - 253 Segment Total 45,916 30,492 15,424 5,049 10,375 $ 67 $ 10,442 Corporate and Other Corporate 209 513 (304) 169 (473) Acquisition-related items (42) 73 (115) 1,988 (2,103) Certain significant items - 248 (248) - (248) Eliminations and consolidations (1,256) (938) (318) - (318) AT&T Inc. $ 44,827 $ 30,388 $ 14,439 $ 7,206 $ 7,233
March 31, 2018
Revenues
Operations and Support
Expenses EBITDA
Depreciation and
Amortization Operating
Income (Loss)
Equity in Net Income (Loss)
of AffiliatesSegment
Contribution
Communications Mobility $ 17,355 $ 10,102 $ 7,253 $ 2,095 $ 5,158 $ - $ 5,158 Entertainment Group 11,431 8,811 2,620 1,310 1,310 (1) 1,309 Business Wireline 6,747 4,016 2,731 1,170 1,561 (1) 1,560 Total Communications 35,533 22,929 12,604 4,575 8,029 (2) 8,027 WarnerMedia 112 82 30 1 29 10 39 Latin America Vrio 1,354 1,001 353 205 148 - 148 Mexico 671 803 (132) 127 (259) - (259) Total Latin America 2,025 1,804 221 332 (111) - (111) Xandr 337 50 287 1 286 - 286 Segment Total 38,007 24,865 13,142 4,909 8,233 $ 8 $ 8,241 Corporate and Other Corporate 333 735 (402) 23 (425) Acquisition-related items - 67 (67) 1,062 (1,129) Certain significant items - 180 (180) - (180) Eliminations and consolidations (302) (4) (298) - (298) AT&T Inc. $ 38,038 $ 25,843 $ 12,195 $ 5,994 $ 6,201
SUPPLEMENTAL SEGMENT RECONCILIATION
First QuarterDollars in millionsUnaudited
11
26CONTENTS
INVESTOR BRIEFING2019 AT&T EARNINGSQ1
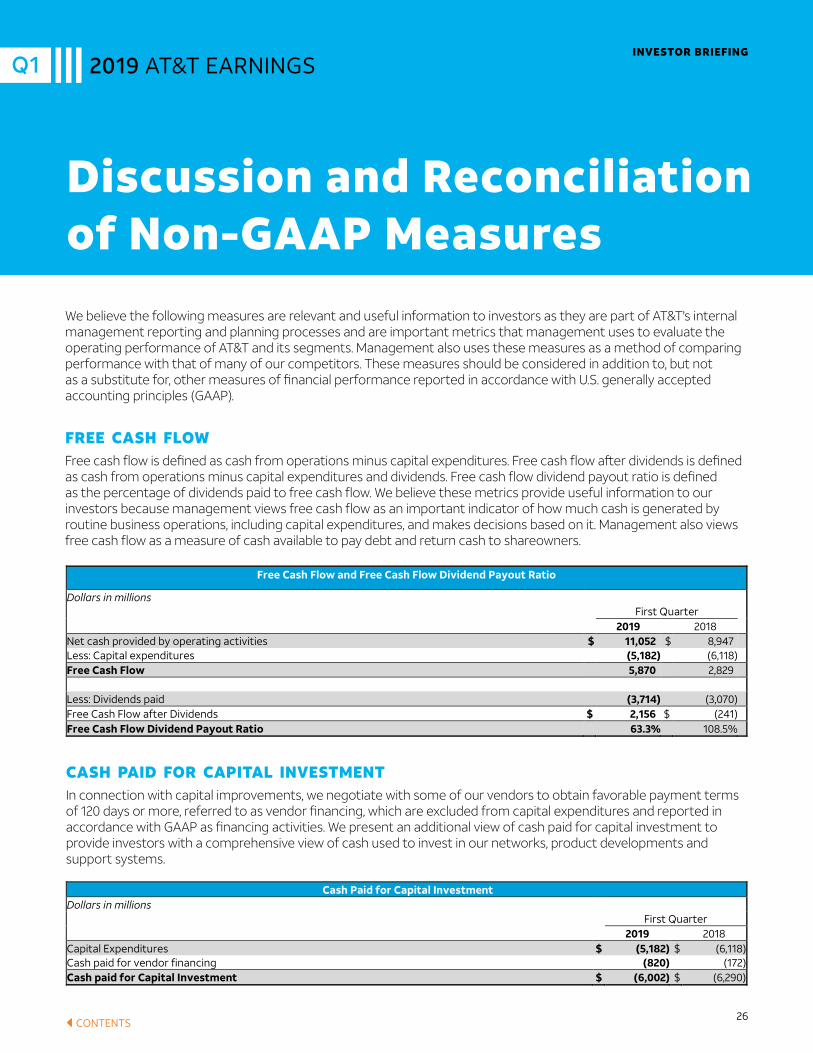
We believe the following measures are relevant and useful information to investors as they are part of AT&T's internal management reporting and planning processes and are important metrics that management uses to evaluate the operating performance of AT&T and its segments. Management also uses these measures as a method of comparing performance with that of many of our competitors. These measures should be considered in addition to, but not as a substitute for, other measures of financial performance reported in accordance with U.S. generally accepted accounting principles (GAAP).
FREE CASH FLOWFree cash flow is defined as cash from operations minus capital expenditures. Free cash flow after dividends is defined as cash from operations minus capital expenditures and dividends. Free cash flow dividend payout ratio is defined as the percentage of dividends paid to free cash flow. We believe these metrics provide useful information to our investors because management views free cash flow as an important indicator of how much cash is generated by routine business operations, including capital expenditures, and makes decisions based on it. Management also views free cash flow as a measure of cash available to pay debt and return cash to shareowners.
Discussion and Reconciliation of Non-GAAP Measures
CASH PAID FOR CAPITAL INVESTMENTIn connection with capital improvements, we negotiate with some of our vendors to obtain favorable payment terms of 120 days or more, referred to as vendor financing, which are excluded from capital expenditures and reported in accordance with GAAP as financing activities. We present an additional view of cash paid for capital investment to provide investors with a comprehensive view of cash used to invest in our networks, product developments and support systems.
Discussion and Reconciliation of Non-GAAP Measures
We believe the following measures are relevant and useful information to investors as they are part of AT&T's internal management reporting and planning processes and are important metrics that management uses to evaluate the operating performance of AT&T and its segments. Management also uses these measures as a method of comparing performance with that of many of our competitors. These measures should be considered in addition to, but not as a substitute for, other measures of financial performance reported in accordance with U.S. generally accepted accounting principles (GAAP).
Free Cash Flow
Free cash flow is defined as cash from operations minus capital expenditures. Free cash flow after dividends is defined as cash from operations minus capital expenditures and dividends. Free cash flow dividend payout ratio is defined as the percentage of dividends paid to free cash flow. We believe these metrics provide useful information to our investors because management views free cash flow as an important indicator of how much cash is generated by routine business operations, including capital expenditures, and makes decisions based on it. Management also views free cash flow as a measure of cash available to pay debt and return cash to shareowners.
Free Cash Flow and Free Cash Flow Dividend Payout Ratio
Dollars in millions First Quarter
2019 2018 Net cash provided by operating activities $ 11,052 $ 8,947 Less: Capital expenditures (5,182) (6,118) Free Cash Flow 5,870 2,829
Less: Dividends paid (3,714) (3,070) Free Cash Flow after Dividends $ 2,156 $ (241) Free Cash Flow Dividend Payout Ratio 63.3% 108.5%
Cash Paid for Capital Investment
In connection with capital improvements, we negotiate with some of our vendors to obtain favorable payment terms of 120 days or more, referred to as vendor financing, which are excluded from capital expenditures and reported in accordance with GAAP as financing activities. We present an additional view of cash paid for capital investment to provide investors with a comprehensive view of cash used to invest in our networks, product developments and support systems.
Cash Paid for Capital Investment Dollars in millions
First Quarter 2019 2018
Capital Expenditures $ (5,182) $ (6,118) Cash paid for vendor financing (820) (172) Cash paid for Capital Investment $ (6,002) $ (6,290)
1

27CONTENTS
DISCUSSION AND RECONCILIATIONOF NON-GAAP MEASURES
INVESTOR BRIEFING2019 AT&T EARNINGSQ1
EBITDAOur calculation of EBITDA, as presented, may differ from similarly titled measures reported by other companies. For AT&T, EBITDA excludes other income (expense) – net, and equity in net income (loss) of affiliates, as these do not reflect the operating results of our subscriber base or operations that are not under our control. Equity in net income (loss) of affiliates represents the proportionate share of the net income (loss) of affiliates in which we exercise significant influence, but do not control. Because we do not control these entities, management excludes these results when evaluating the performance of our primary operations. EBITDA also excludes interest expense and the provision for income taxes. Excluding these items eliminates the expenses associated with our capital and tax structures. Finally, EBITDA excludes depreciation and amortization in order to eliminate the impact of capital investments. EBITDA does not give effect to cash used for debt service requirements and thus does not reflect available funds for distributions, reinvestment or other discretionary uses. EBITDA is not presented as an alternative measure of operating results or cash flows from operations, as determined in accordance with U.S. generally accepted accounting principles (GAAP).
EBITDA service margin is calculated as EBITDA divided by service revenues.
When discussing our segment, business unit and supplemental results, EBITDA excludes equity in net income (loss) of affiliates, and depreciation and amortization from operating contribution.
These measures are used by management as a gauge of our success in acquiring, retaining and servicing subscribers because we believe these measures reflect AT&T's ability to generate and grow subscriber revenues while providing a high level of customer service in a cost-effective manner. Management also uses these measures as a method of comparing operating performance with that of many of its competitors. The financial and operating metrics which affect EBITDA include the key revenue and expense drivers for which management is responsible and upon which we evaluate performance.
We believe EBITDA Service Margin (EBITDA as a percentage of service revenues) to be a more relevant measure than EBITDA Margin (EBITDA as a percentage of total revenue) for our Mobility business unit operating margin. We also use wireless service revenues to calculate margin to facilitate comparison, both internally and externally with our wireless competitors, as they calculate their margins using wireless service revenues as well.
There are material limitations to using these non-GAAP financial measures. EBITDA, EBITDA margin and EBITDA service margin, as we have defined them, may not be comparable to similarly titled measures reported by other companies. Furthermore, these performance measures do not take into account certain significant items, including depreciation and amortization, interest expense, tax expense and equity in net income (loss) of affiliates. Management compensates for these limitations by carefully analyzing how its competitors present performance measures that are similar in nature to EBITDA as we present it, and considering the economic effect of the excluded expense items independently as well as in connection with its analysis of net income as calculated in accordance with GAAP. EBITDA, EBITDA margin and EBITDA service margin should be considered in addition to, but not as a substitute for, other measures of financial performance reported in accordance with GAAP.
EBITDA
Our calculation of EBITDA, as presented, may differ from similarly titled measures reported by other companies. For AT&T, EBITDA excludes other income (expense) – net, and equity in net income (loss) of affiliates, as these do not reflect the operating results of our subscriber base or operations that are not under our control. Equity in net income (loss) of affiliates represents the proportionate share of the net income (loss) of affiliates in which we exercise significant influence, but do not control. Because we do not control these entities, management excludes these results when evaluating the performance of our primary operations. EBITDA also excludes interest expense and the provision for income taxes. Excluding these items eliminates the expenses associated with our capital and tax structures. Finally, EBITDA excludes depreciation and amortization in order to eliminate the impact of capital investments. EBITDA does not give effect to cash used for debt service requirements and thus does not reflect available funds for distributions, reinvestment or other discretionary uses. EBITDA is not presented as an alternative measure of operating results or cash flows from operations, as determined in accordance with U.S. generally accepted accounting principles (GAAP). EBITDA service margin is calculated as EBITDA divided by service revenues. When discussing our segment, business unit and supplemental results, EBITDA excludes equity in net income (loss) of affiliates, and depreciation and amortization from operating contribution. These measures are used by management as a gauge of our success in acquiring, retaining and servicing subscribers because we believe these measures reflect AT&T's ability to generate and grow subscriber revenues while providing a high level of customer service in a cost-effective manner. Management also uses these measures as a method of comparing operating performance with that of many of its competitors. The financial and operating metrics which affect EBITDA include the key revenue and expense drivers for which management is responsible and upon which we evaluate performance. We believe EBITDA Service Margin (EBITDA as a percentage of service revenues) to be a more relevant measure than EBITDA Margin (EBITDA as a percentage of total revenue) for our Mobility business unit operating margin. We also use wireless service revenues to calculate margin to facilitate comparison, both internally and externally with our wireless competitors, as they calculate their margins using wireless service revenues as well. There are material limitations to using these non-GAAP financial measures. EBITDA, EBITDA margin and EBITDA service margin, as we have defined them, may not be comparable to similarly titled measures reported by other companies. Furthermore, these performance measures do not take into account certain significant items, including depreciation and amortization, interest expense, tax expense and equity in net income (loss) of affiliates. Management compensates for these limitations by carefully analyzing how its competitors present performance measures that are similar in nature to EBITDA as we present it, and considering the economic effect of the excluded expense items independently as well as in connection with its analysis of net income as calculated in accordance with GAAP. EBITDA, EBITDA margin and EBITDA service margin should be considered in addition to, but not as a substitute for, other measures of financial performance reported in accordance with GAAP.
EBITDA, EBITDA Margin and EBITDA Service Margin Dollars in millions First Quarter
2019 2018 Net Income $ 4,348 $ 4,759 Additions: Income Tax (Benefit) Expense 1,023 1,382 Interest Expense 2,141 1,771 Equity in Net (Income) Loss of Affiliates 7 (9) Other (Income) Expense - Net (286) (1,702) Depreciation and amortization 7,206 5,994 EBITDA 14,439 12,195 Total Operating Revenues 44,827 38,038 Service Revenues 40,684 33,646 EBITDA Margin 32.2% 32.1% EBITDA Service Margin 35.5% 36.2%
2
28CONTENTS
DISCUSSION AND RECONCILIATIONOF NON-GAAP MEASURES
INVESTOR BRIEFING2019 AT&T EARNINGSQ1
Segment and Business Unit EBITDA, EBITDA Margin and EBITDA Service Margin Dollars in millions First Quarter 2019 2018 WarnerMedia Segment Operating Contribution $ 2,310 $ 39 Additions: Equity in Net (Income) of Affiliates (67) (10) Depreciation and amortization 143 1 EBITDA 2,386 30 Total Operating Revenues 8,379 112 Operating Income Margin 26.8% 25.9% EBITDA Margin 28.5% 26.8%
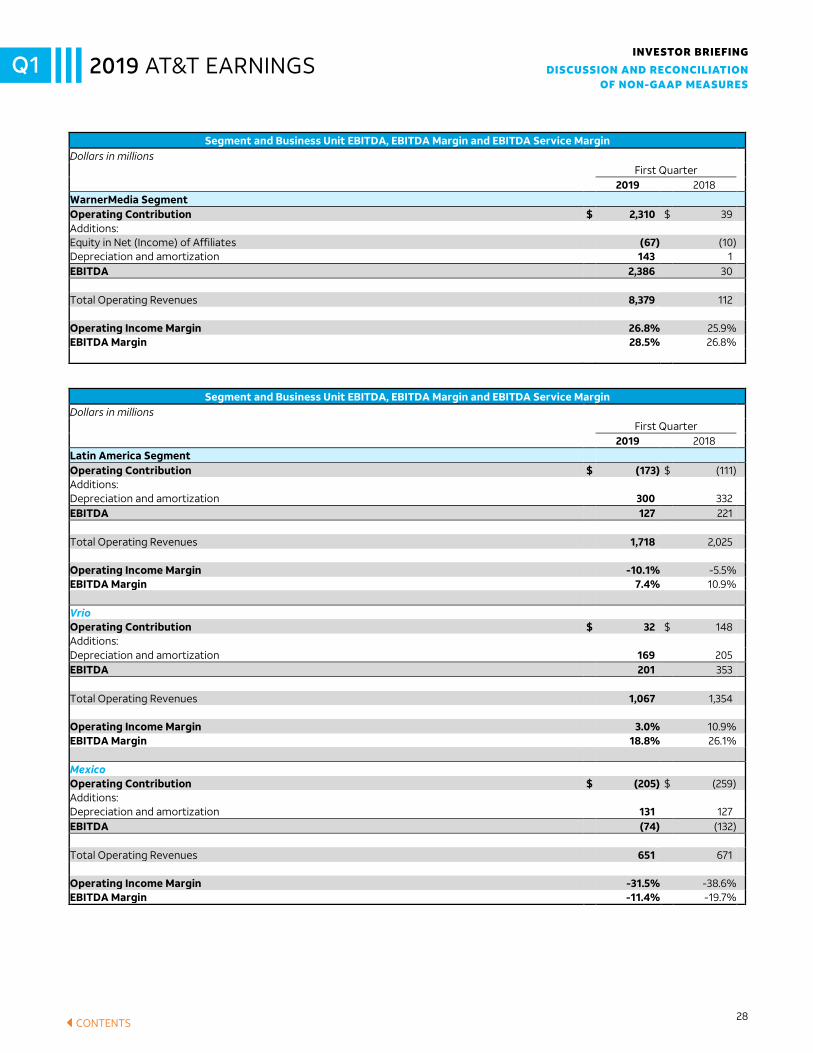
Segment and Business Unit EBITDA, EBITDA Margin and EBITDA Service Margin Dollars in millions First Quarter 2019 2018 Latin America Segment Operating Contribution $ (173) $ (111) Additions: Depreciation and amortization 300 332 EBITDA 127 221 Total Operating Revenues 1,718 2,025 Operating Income Margin -10.1% -5.5% EBITDA Margin 7.4% 10.9% Vrio Operating Contribution $ 32 $ 148 Additions: Depreciation and amortization 169 205 EBITDA 201 353 Total Operating Revenues 1,067 1,354 Operating Income Margin 3.0% 10.9% EBITDA Margin 18.8% 26.1% Mexico Operating Contribution $ (205) $ (259) Additions: Depreciation and amortization 131 127 EBITDA (74) (132) Total Operating Revenues 651 671 Operating Income Margin -31.5% -38.6% EBITDA Margin -11.4% -19.7%
4
29CONTENTS
DISCUSSION AND RECONCILIATIONOF NON-GAAP MEASURES
INVESTOR BRIEFING2019 AT&T EARNINGSQ1
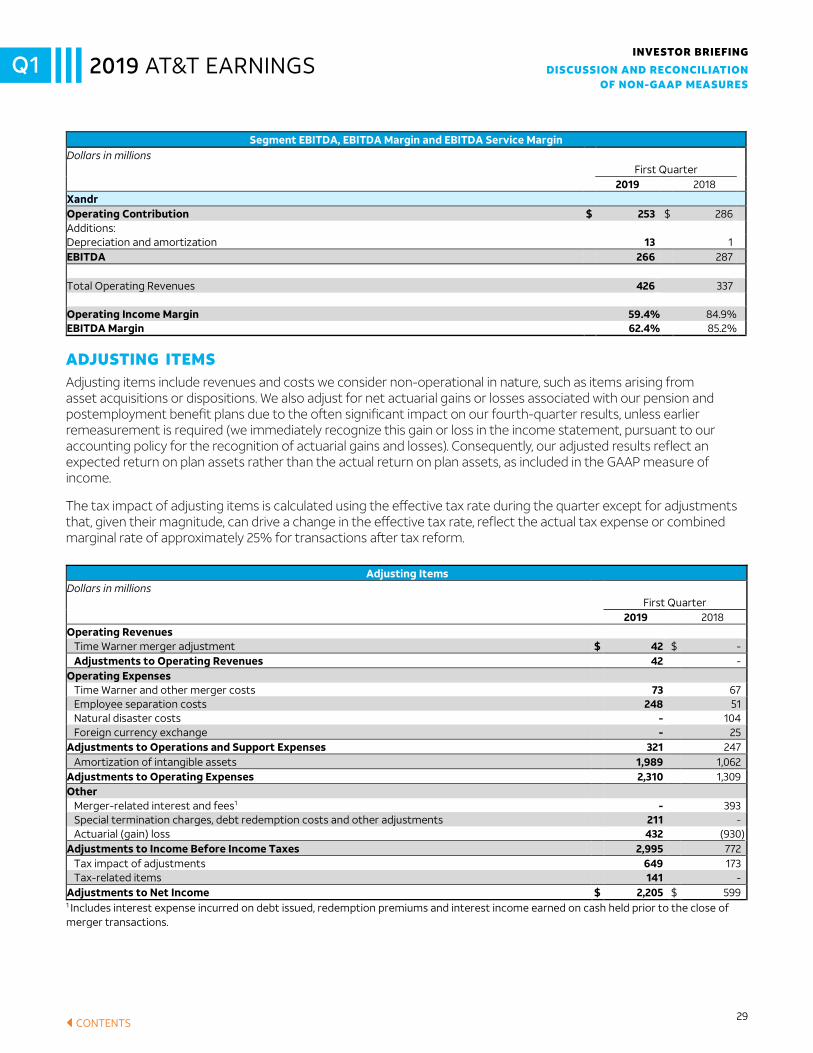
ADJUSTING ITEMSAdjusting items include revenues and costs we consider non-operational in nature, such as items arising from asset acquisitions or dispositions. We also adjust for net actuarial gains or losses associated with our pension and postemployment benefit plans due to the often significant impact on our fourth-quarter results, unless earlier remeasurement is required (we immediately recognize this gain or loss in the income statement, pursuant to our accounting policy for the recognition of actuarial gains and losses). Consequently, our adjusted results reflect an expected return on plan assets rather than the actual return on plan assets, as included in the GAAP measure of income.
The tax impact of adjusting items is calculated using the effective tax rate during the quarter except for adjustments that, given their magnitude, can drive a change in the effective tax rate, reflect the actual tax expense or combined marginal rate of approximately 25% for transactions after tax reform.
Segment EBITDA, EBITDA Margin and EBITDA Service Margin Dollars in millions First Quarter 2019 2018 Xandr Operating Contribution $ 253 $ 286 Additions: Depreciation and amortization 13 1 EBITDA 266 287 Total Operating Revenues 426 337 Operating Income Margin 59.4% 84.9% EBITDA Margin 62.4% 85.2% Adjusting Items
Adjusting items include revenues and costs we consider non-operational in nature, such as items arising from asset acquisitions or dispositions. We also adjust for net actuarial gains or losses associated with our pension and postemployment benefit plans due to the often significant impact on our fourth-quarter results, unless earlier remeasurement is required (we immediately recognize this gain or loss in the income statement, pursuant to our accounting policy for the recognition of actuarial gains and losses). Consequently, our adjusted results reflect an expected return on plan assets rather than the actual return on plan assets, as included in the GAAP measure of income.
The tax impact of adjusting items is calculated using the effective tax rate during the quarter except for adjustments that, given their magnitude, can drive a change in the effective tax rate, reflect the actual tax expense or combined marginal rate of approximately 25% for transactions after tax reform.
Adjusting Items Dollars in millions First Quarter 2019 2018 Operating Revenues Time Warner merger adjustment $ 42 $ - Adjustments to Operating Revenues 42 - Operating Expenses Time Warner and other merger costs 73 67 Employee separation costs 248 51 Natural disaster costs - 104 Foreign currency exchange - 25 Adjustments to Operations and Support Expenses 321 247 Amortization of intangible assets 1,989 1,062 Adjustments to Operating Expenses 2,310 1,309 Other Merger-related interest and fees1 - 393 Special termination charges, debt redemption costs and other adjustments 211 - Actuarial (gain) loss 432 (930) Adjustments to Income Before Income Taxes 2,995 772 Tax impact of adjustments 649 173 Tax-related items 141 - Adjustments to Net Income $ 2,205 $ 599 1 Includes interest expense incurred on debt issued, redemption premiums and interest income earned on cash held prior to the close of merger transactions.
Adjusted Operating Income, Adjusted Operating Income Margin, Adjusted EBITDA, Adjusted EBITDA margin, Adjusted EBITDA service margin and Adjusted diluted EPS are non-GAAP financial measures calculated by excluding from operating revenues, operating expenses and income tax expense certain significant items that are non-operational or non-recurring in nature, including dispositions and merger integration and transaction costs. Management believes that these measures provide relevant and useful information to investors and other users of our financial data in evaluating the effectiveness of our operations and underlying business trends.
5

30CONTENTS
DISCUSSION AND RECONCILIATIONOF NON-GAAP MEASURES
INVESTOR BRIEFING2019 AT&T EARNINGSQ1
Adjusted Operating Income, Adjusted Operating Income Margin, Adjusted EBITDA, Adjusted EBITDA margin, Adjusted EBITDA service margin and Adjusted diluted EPS are non-GAAP financial measures calculated by excluding from operating revenues, operating expenses and income tax expense certain significant items that are non-operational or non-recurring in nature, including dispositions and merger integration and transaction costs. Management believes that these measures provide relevant and useful information to investors and other users of our financial data in evaluating the effectiveness of our operations and underlying business trends.
Adjusted Operating Revenues, Adjusted Operating Income, Adjusted Operating Income Margin, Adjusted EBITDA, Adjusted EBITDA margin, Adjusted EBITDA service margin and Adjusted diluted EPS should be considered in addition to, but not as a substitute for, other measures of financial performance reported in accordance with GAAP. AT&T's calculation of Adjusted items, as presented, may differ from similarly titled measures reported by other companies.Adjusted Operating Revenues, Adjusted Operating Income, Adjusted Operating Income Margin, Adjusted EBITDA, Adjusted EBITDA margin, Adjusted EBITDA service margin and Adjusted diluted EPS should be considered in addition to, but not as a substitute for, other measures of financial performance reported in accordance with GAAP. AT&T's calculation of Adjusted items, as presented, may differ from similarly titled measures reported by other companies.
Adjusted Operating Income, Adjusted Operating Income Margin,
Adjusted EBITDA, Adjusted EBITDA Margin and Adjusted EBITDA Service Margin
Dollars in millions First Quarter 2019 2018 Operating Income $ 7,233 $ 6,201 Adjustments to Operating Revenues 42 - Adjustments to Operating Expenses 2,310 1,309 Adjusted Operating Income 9,585 7,510 EBITDA 14,439 12,195 Adjustments to Operating Revenues 42 - Adjustments to Operations and Support Expenses 321 247 Adjusted EBITDA 14,802 12,442 Total Operating Revenues 44,827 38,038 Adjustments to Operating Revenues 42 - Total Adusted Operating Revenue 44,869 38,038 Service Revenues 40,684 33,646 Adjustments to Service Revenues 42 - Adusted Service Revenue 40,726 33,646 Operating Income Margin 16.1% 16.3% Adjusted Operating Income Margin 21.4% 19.7% Adjusted EBITDA Margin 33.0% 32.7% Adjusted EBITDA Service Margin 36.3% 37.0%
Adjusted Diluted EPS First Quarter 2019 2018 Diluted Earnings Per Share (EPS) $ 0.56 $ 0.75 Amortization of intangible assets 0.21 0.13 Merger integration items1 0.01 0.06 (Gain) loss on sale of assets, impairments and other adjustments2
0.05 0.03
Actuarial (gain) loss3 0.05 (0.12) Tax-related items (0.02) - Adjusted EPS $ 0.86 $ 0.85 Year-over-year growth - Adjusted 1.2% Weighted Average Common Shares Outstanding with Dilution (000,000) 7,342 6,180 1Includes combined merger integration items and merger-related interest income and expense, and redemption premiums. 2Includes gains on transactions, natural disaster adjustments and charges, and employee-related and other costs. 3Includes adjustments for actuarial gains or losses ($432 million loss in the first quarter of 2019) associated with our pension benefit plan, which we immediately recognize in the income statement, pursuant to our accounting policy for the recognition of actuarial gains/losses. As a result, adjusted EPS reflects an expected return on plan assets of $816 million (based on an average expected return on plan assets of 7.00% for our pension trust), rather than the actual return on plan assets of $2.8 billion (actual return of 5.8% for the quarter), included in the GAAP measure of income.
6

31CONTENTS
DISCUSSION AND RECONCILIATIONOF NON-GAAP MEASURES
INVESTOR BRIEFING2019 AT&T EARNINGSQ1
Adjusted Operating Revenues, Adjusted Operating Income, Adjusted Operating Income Margin, Adjusted EBITDA, Adjusted EBITDA margin, Adjusted EBITDA service margin and Adjusted diluted EPS should be considered in addition to, but not as a substitute for, other measures of financial performance reported in accordance with GAAP. AT&T's calculation of Adjusted items, as presented, may differ from similarly titled measures reported by other companies.
Adjusted Operating Income, Adjusted Operating Income Margin,
Adjusted EBITDA, Adjusted EBITDA Margin and Adjusted EBITDA Service Margin
Dollars in millions First Quarter 2019 2018 Operating Income $ 7,233 $ 6,201 Adjustments to Operating Revenues 42 - Adjustments to Operating Expenses 2,310 1,309 Adjusted Operating Income 9,585 7,510 EBITDA 14,439 12,195 Adjustments to Operating Revenues 42 - Adjustments to Operations and Support Expenses 321 247 Adjusted EBITDA 14,802 12,442 Total Operating Revenues 44,827 38,038 Adjustments to Operating Revenues 42 - Total Adusted Operating Revenue 44,869 38,038 Service Revenues 40,684 33,646 Adjustments to Service Revenues 42 - Adusted Service Revenue 40,726 33,646 Operating Income Margin 16.1% 16.3% Adjusted Operating Income Margin 21.4% 19.7% Adjusted EBITDA Margin 33.0% 32.7% Adjusted EBITDA Service Margin 36.3% 37.0%
Adjusted Diluted EPS First Quarter 2019 2018 Diluted Earnings Per Share (EPS) $ 0.56 $ 0.75 Amortization of intangible assets 0.21 0.13 Merger integration items1 0.01 0.06 (Gain) loss on sale of assets, impairments and other adjustments2
0.05 0.03
Actuarial (gain) loss3 0.05 (0.12) Tax-related items (0.02) - Adjusted EPS $ 0.86 $ 0.85 Year-over-year growth - Adjusted 1.2% Weighted Average Common Shares Outstanding with Dilution (000,000) 7,342 6,180 1Includes combined merger integration items and merger-related interest income and expense, and redemption premiums. 2Includes gains on transactions, natural disaster adjustments and charges, and employee-related and other costs. 3Includes adjustments for actuarial gains or losses ($432 million loss in the first quarter of 2019) associated with our pension benefit plan, which we immediately recognize in the income statement, pursuant to our accounting policy for the recognition of actuarial gains/losses. As a result, adjusted EPS reflects an expected return on plan assets of $816 million (based on an average expected return on plan assets of 7.00% for our pension trust), rather than the actual return on plan assets of $2.8 billion (actual return of 5.8% for the quarter), included in the GAAP measure of income.
6

32CONTENTS
DISCUSSION AND RECONCILIATIONOF NON-GAAP MEASURES
INVESTOR BRIEFING2019 AT&T EARNINGSQ1
PRO FORMA NET DEBT TO ADJUSTED EBITDANet Debt to EBITDA ratios are non-GAAP financial measures frequently used by investors and credit rating agencies and management believes these measures provide relevant and useful information to investors and other users of our financial data. Our Net Debt to Pro Forma Adjusted EBITDA ratio is calculated by dividing the Net Debt by the sum of the most recent four quarters Pro Forma Adjusted EBITDA. Net Debt is calculated by subtracting cash and cash equivalents and certificates of deposit and time deposits that are greater than 90 days, from the sum of debt maturing within one year and long-term debt.
SUPPLEMENTAL OPERATIONAL MEASURESWe provide a supplemental discussion of our business solutions operations that is calculated by combining our Mobility and Business Wireline operating units, and then adjusting to remove non-business operations. The following table presents a reconciliation of our supplemental Business Solutions results.
Pro Forma Net Debt to Adjusted EBITDA
Net Debt to EBITDA ratios are non-GAAP financial measures frequently used by investors and credit rating agencies and management believes these measures provide relevant and useful information to investors and other users of our financial data. Our Net Debt to Pro Forma Adjusted EBITDA ratio is calculated by dividing the Net Debt by the sum of the most recent four quarters Pro Forma Adjusted EBITDA. Net Debt is calculated by subtracting cash and cash equivalents and certificates of deposit and time deposits that are greater than 90 days, from the sum of debt maturing within one year and long-term debt.
Net Debt to Pro Forma Adjusted EBITDA Dollars in millions Three Months Ended Jun. 30, Sep. 30, Dec. 31, Mar. 31, Four
Quarters
20181 20181 20181 2019 Pro Forma Adjusted EBITDA1,2 $ 15,119 $ 15,872 $ 15,029 $ 14,802 $ 60,822 Add back severance (133) (76) (327) - (536) Net Debt Pro Forma Adjusted EBITDA 14,986 15,796 14,702 14,802 60,286 End-of-period current debt 11,538 End-of-period long-term debt 163,942 Total End-of-Period Debt 175,480 Less: Cash and Cash Equivalents 6,516 Net Debt Balance 168,964 Annualized Net Debt to Pro Forma Adjusted EBITDA Ratio 2.80 1As reported in AT&T's Form 8-K filed July 24, 2018, October 24, 2018 and January 30, 2019. 2Includes the purchase accounting reclassification of released content amortization of $491 million pro forma and $98 million reported by AT&T in the second quarter of 2018, $772 million reported in the third quarter of 2018, $545 million reported by AT&T in the fourth quarter of 2018 and $150 million reported by AT&T in the first quarter of 2019.
7
Supplemental Operational Measures
We provide a supplemental discussion of our business solutions operations that is calculated by combining our Mobility and Business Wireline operating units, and then adjusting to remove non-business operations. The following table presents a reconciliation of our supplemental Business Solutions results.
Supplemental Operational Measure First Quarter March 31, 2019 March 31, 2018
Mobility Business Wireline Adjustments1
Business Solutions Mobility
Business Wireline Adjustments1
Business Solutions
Operating Revenues Wireless service $ 13,792 $ - $ (11,879) $ 1,913 $ 13,403 $ - $ (11,612) $ 1,791 Strategic and managed services - 3,792 - 3,792 - 3,595 - 3,595 Legacy voice and data services - 2,404 - 2,404 - 2,865 - 2,865 Other services and equipment - 302 - 302 - 287 - 287 Wireless equipment 3,775 - (3,179) 596 3,952 - (3,374) 578 Total Operating Revenues 17,567 6,498 (15,058) 9,007 17,355 6,747 (14,986) 9,116 Operations and support 10,181 4,040 (8,581) 5,640 10,102 4,016 (8,524) 5,594 EBITDA 7,386 2,458 (6,477) 3,367 7,253 2,731 (6,462) 3,522 Depreciation and amortization 2,035 1,235 (1,729) 1,541 2,095 1,170 (1,807) 1,458 Total Operating Expenses 12,216 5,275 (10,310) 7,181 12,197 5,186 (10,331) 7,052 Operating Income 5,351 1,223 (4,748) 1,826 5,158 1,561 (4,655) 2,064 Equity in net Income of Affiliates - - - - - (1) - (1) Contribution $ 5,351 $ 1,223 $ (4,748) $ 1,826 $ 5,158 $ 1,560 $ (4,655) $ 2,063 1 Non-business wireless reported in the Communication segment under the Mobility business unit.
8