Embed Size (px)
Citation preview

Investor Briefing
2018 AT&T EARNINGSQ2
No. 301 | UPDATED AUGUST 27, 2018
Contents
Investor Briefing
Consolidated Results 3
Business Solutions 6
Entertainment Group 8
Consumer Mobility 11
International 12
AT&T Mobility 13
Highlights 16
2018 AT&T EARNINGSQ2
Financial and Operational Information 20
35Discussion and Reconciliation of Non-GAAP Measures
Consolidated Results 3
Business Solutions 6
Entertainment Group 8
Consumer Mobility 11
International 12
AT&T Mobility 13
Highlights 16
Nj The company’s consolidated results include 16 days of Time Warner results for the second quarter. Time Warner’s total second-quarter
results on a historical basis are located on AT&T’s Investor Relations website. Pro forma schedules are expected to be filed in August.

CONTENTS
2018 AT&T EARNINGSQ2
3
Investor Briefing
AT&T Completes Time Warner Acquisition; Agrees to Acquire AppNexus; Reports Second-Quarter Results
Consolidated results include 16 days of
Time Warner results for the second quarter
Nj Diluted EPS of $0.81 as reported compared to $0.63 in the year-ago quarter
Nj Adjusted EPS of $0.91 compared to $0.79 in the year-ago quarter
Nj Consolidated revenues of $39.0 billion
Nj Cash from operations of $10.2 billion, up 17.5%
Nj Capital expenditures of $5.1 billion
Nj Free cash flow of $5.1 billion, up 46.4%
Company Updates 2018 Guidance1
Nj Raising adjusted EPS to high end of $3.50 range
Nj Raising free cash flow to high end of $21 billion range (inclusive of all deal and integration costs)
Nj Capital Investment of approximately $25 billion; $22 billion net of expected FirstNet reimbursements and vendor financing
Consolidated Results
Nj Strong subscriber gains:
3.8 million total wireless net adds
3.1 million in U.S., driven by connected devices and prepaid
756,000 in Mexico
219,000 total video net adds (U.S. and Latin America)
Nj U.S. wireless results:
Service revenue growth on a comparable basis
46,000 postpaid phone net adds with continued strong year-over-year improvement
Continued prepaid growth with 356,000 phone net adds
Nearly 400,000 branded smartphones added to base
Second-quarter postpaid phone churn of 0.82%
Nj Entertainment Group results:
342,000 DIRECTV NOW net adds to reach more than 1.8 million subscribers
80,000 total video net adds; total video customer base stable with DIRECTV NOW; AT&T WatchTV launched
76,000 IP broadband net adds; 23,000 total broadband net adds; more than 9 million customer locations passed with fiber
AdWorks continues double-digit revenue growth
Nj Time Warner acquisition closed on June 14; full second-quarter results include:
HBO and Turner year-over-year subscription revenue growth
Turner ad revenue up 3%
Record number of series in production at Warner Bros.
166 Primetime Emmy Awards nominations

4CONTENTS
2018 AT&T EARNINGSQ2
Operating expenses were $32.5 billion versus $33.3 billion, primarily due to the netting of USF and other regulatory fee revenues and the deferral of commissions under ASC 606. Excluding those impacts, operating expenses were $34.0 billion, an increase of about $700 million due to inclusion of Time Warner results, content cost pressure and higher wireless equipment costs partially offset by cost efficiencies.
Operating income was $6.5 billion, stable versus the year-ago quarter; and operating income margin was 16.6% versus 16.4%. On a comparative basis, operating income was $5.9 billion and operating income margin was 14.8%. When adjusting for a non-cash actuarial gain on benefit plans, amortization, merger- and integration-related expenses and other items, operating income was $8.2 billion, or $7.7 billion on a comparative basis, versus $8.1 billion in the year-ago quarter and operating income margin was 21.1%, or 19.2% on a comparative basis, versus 20.3% in the year-ago quarter.
Second-quarter net income attributable to AT&T was $5.1 billion, or $0.81 per diluted share, versus $3.9 billion, or $0.63 per diluted share, in the year-ago quarter. Adjusting for a $0.21 non-cash actuarial gain on benefit plans and $0.31 of costs for amortization, merger- and integration-related expenses and other items, earnings per diluted share was $0.91 compared to an adjusted $0.79 in the year-ago quarter, a 15.2% increase.
Cash from operating activities was $10.2 billion, and capital expenditures were $5.1 billion. Capital investment included about $275 million in FirstNet capital costs and reflects about $300 million in FirstNet reimbursements. Free cash flow — cash from operating activities minus capital expenditures — was $5.1 billion for the quarter.
CONSOLIDATED FINANCIAL RESULTS
AT&T adopted new U.S. accounting standards as required that deal with revenue recognition (ASC 606), post-employment benefit costs and certain cash receipts on installment receivables. These changes impact the company’s income statements and cash flows. With the adoption of ASC 606, the company made a policy decision to record Universal Service Fees (USF) and other regulatory fees on a net basis. The company is providing comparable results in addition to GAAP to help investors better understand the impact on financials from ASC 606 and the policy decision. Historical income statements and cash flows have been recast to show only the impact of the adoption of the other two accounting standards.
The company’s consolidated results include 16 days of Time Warner results for the second quarter. Time Warner’s total second-quarter results on a historical basis are located on AT&T’s Investor Relations website. Pro forma schedules are expected to be filed in August.
AT&T’s consolidated revenues for the second quarter totaled $39.0 billion versus $39.8 billion in the year-ago quarter, primarily due to the impact of ASC 606 which included netting of $900 million of USF with operating expenses. On a comparative basis, declines in domestic video and legacy wireline services were offset by adding approximately $1.1 billion from Time Warner net of eliminations and growth in wireless, strategic business services and advertising. On a comparative basis, revenues were $39.9 billion, an increase of 0.2% primarily due to the second-quarter close of the Time Warner acquisition.
Investor BriefingConsolidated Results
Adjusted Earnings Per Share
2Q17 3Q17 4Q17 1Q18
$0.85
$0.79
$0.74$0.78
2Q18
$0.91
Consolidated RevenuesI N B I L L I O N S
2Q17 3Q17 4Q17 1Q18 2Q18 Historical Accounting
Method
$38.0
$39.9$39.8 $39.7$41.7
2Q18
$39.0

5
Investor Briefing
CONTENTS
2018 AT&T EARNINGSQ2
2018 OUTLOOK1
AT&T expects in 2018:
Nj Raising adjusted EPS to high end of the $3.50 range
Nj Raising free cash flow to high end of the $21 billion range; inclusive of all deal and integration costs
Nj Capital Investment of approximately $25 billion; $22 billion net of expected FirstNet reimbursements and vendor financing
Consolidated Results
vv
v
Cash from OperationsI N B I L L I O N S
Free Cash Flow CAP EX
$3.5$4.5
$5.2
$5.3$5.1
2Q17 3Q17 4Q17
$2.8
$6.1
1Q18
$8.9$8.7
$10.8
$9.5
$5.1
$5.1
2Q18
$10.2
$5.6
1 Adjustments include a non-cash mark-to-market benefit plan gain/loss, merger-related interest expense, merger integration and amortization costs and other adjustments. We expect the mark-to-market adjustment which is driven by interest rates and investment returns that are not reasonably estimable at this time, to be the largest of these items. Accordingly, we cannot provide a reconciliation between forecasted adjusted diluted EPS and reported diluted EPS without unreasonable effort.

2018 AT&T EARNINGSQ2
BUSINESS WIRELESS FINANCIAL RESULTS
Business wireless revenues were $2.4 billion, up 2.1% year over year due to higher equipment revenues. On a comparative basis, revenues were up 4.2% driven by growth in both service and equipment revenues.
Nj Wireless service revenues were down 8.7% year over year on a reported basis, reflecting revenue recognition including changes in USF recording net. On a comparative basis, service revenues were up 1.7%.
BUSINESS WIRELINE FINANCIAL RESULTS
In business wireline, declines in legacy products were partially offset by continued growth in strategic business services. Total business wireline revenues were $6.7 billion, down 8.9% year over year, or down 4.5% on a comparable basis.
The Business Solutions segment provides both wireless and wireline services to business customers. AT&T’s wireless and wired networks provide complete communications solutions to these customers. AT&T’s business customer revenues include results from enterprise, public sector, wholesale and small/midsize customers.
6
Effective Jan. 1, 2018, wireless subscribers who participate in employer-sponsored plans have been moved to Consumer Mobility from Business Solutions. Historical results have been recast to reflect that change.
FINANCIAL HIGHLIGHTS
Total second-quarter revenues from business customers were $9.1 billion, down 6.2% versus the year-earlier quarter due to the impact of ASC 606 revenue recognition and declines in legacy wireline services which were partially offset by increases in strategic business services and wireless. On a comparative basis, revenues were $9.4 billion, down 2.4%.
Nj Second-quarter operating expenses were $7.1 billion, down 5.7%, or essentially flat on a comparative basis, versus the second quarter of 2017. Operating income totaled $2.0 billion, down 8.0%, or down 11.4% on a comparative basis, year over year with IP revenue growth and cost efficiencies partially offsetting declines in legacy services, higher FirstNet expenses and higher wireless sales costs.
Nj Second-quarter operating income margin was 21.6%, or 20.0% on a comparative basis, with declines in legacy services and higher FirstNet expenses and wireless sales costs offsetting growth in IP revenues, wireless and increased cost efficiencies.
Investor Briefing
CONTENTS
Business Solutions
2018 AT&T EARNINGSQ2
Revenues & EBITDA Margin*I N B I L L I O N S
Revenues EBITDA EBITDA Margin
$3.6 $3.5 $3.6
3Q17 4Q17
$3.5 $3.4
1Q182Q17
$9.1 $9.4$9.7 $9.6$9.9
2Q18 Historical Accounting
Method
$3.4
2Q18
$9.1
37.4% 36.8% 36.0% 38.6%35.8%
38.0%
*Prior quarters have been recast to remove certain hosting colocation operations pending divestiture.

7
Investor BriefingBusiness Solutions
CONTENTS
2018 AT&T EARNINGSQ2
Nj Strategic business services, the wireline capabilities that lead AT&T’s most advanced business solutions — including VPNs, Ethernet, cloud, IP conferencing, voice over IP, dedicated internet, IP broadband and security services — continued its solid performance. Revenues grew by about 3%, or about $83 million, on a comparable basis versus the year-earlier quarter. On a comparative basis, these services represent 44% of total business wireline revenues and more than 70% of wireline data revenues and are an annualized revenue stream of more than $12 billion. This growth helped offset a decline of about $450 million, on a comparable basis, in legacy services in the quarter.
Business Solutions
SUBSCRIBER METRICS
At the end of the second quarter, AT&T had about 58 million business wireless subscribers, including all connected devices for the company.
Nj Business Solutions added 122,000 postpaid subscribers and a record 3.0 million connected devices in the second quarter.
Nj During the quarter, the company lost 4,000 high-speed IP broadband business subscribers. Total business broadband subscribers were down 26,000.
Strategic Service Revenues*,**I N B I L L I O N S
Strategic Services Revenues % of Business Wireline Revenues
40.5% 41.5%41.6%
2Q17 3Q17 4Q17 1Q18
43.4%
$3.1$3.0 $3.0
$3.1
2Q18
43.6%
$3.0
*Uses historical accounting method. **Prior quarters have been recast to remove certain hosting colocation operations pending divestiture.
Connected Devices Subscribers & Net Adds*I N M I L L I O N S
SubscribersNet Adds
2.3 2.32.6
2Q17 3Q17 4Q17 1Q18
2.7
41.7
34.736.4
39.0
*Connected devices are now entirely in the business segment; historical numbers have been adjusted.
2Q18
3.0
44.7
2018 AT&T EARNINGSQ2
FINANCIAL HIGHLIGHTS
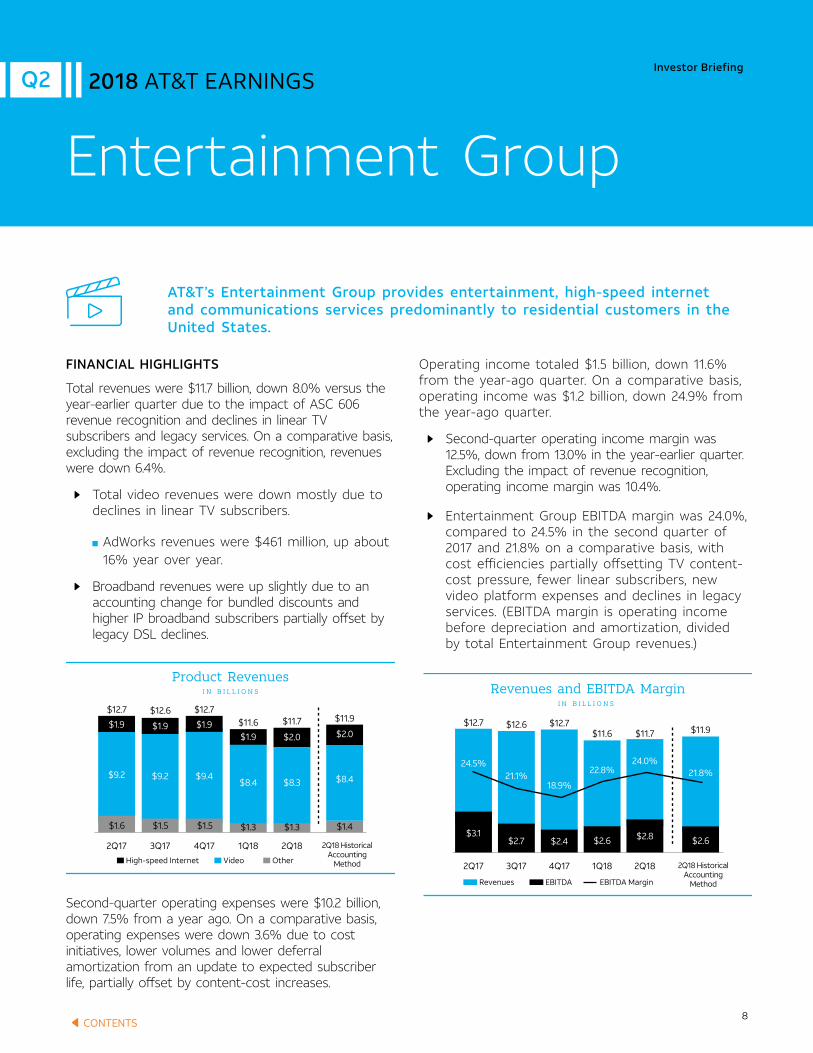
Total revenues were $11.7 billion, down 8.0% versus the year-earlier quarter due to the impact of ASC 606 revenue recognition and declines in linear TV subscribers and legacy services. On a comparative basis, excluding the impact of revenue recognition, revenues were down 6.4%.
Nj Total video revenues were down mostly due to declines in linear TV subscribers.
AdWorks revenues were $461 million, up about 16% year over year.
Nj Broadband revenues were up slightly due to an accounting change for bundled discounts and higher IP broadband subscribers partially offset by legacy DSL declines.
Second-quarter operating expenses were $10.2 billion, down 7.5% from a year ago. On a comparative basis, operating expenses were down 3.6% due to cost initiatives, lower volumes and lower deferral amortization from an update to expected subscriber life, partially offset by content-cost increases.
8
Operating income totaled $1.5 billion, down 11.6% from the year-ago quarter. On a comparative basis, operating income was $1.2 billion, down 24.9% from the year-ago quarter.
Nj Second-quarter operating income margin was 12.5%, down from 13.0% in the year-earlier quarter. Excluding the impact of revenue recognition, operating income margin was 10.4%.
Nj Entertainment Group EBITDA margin was 24.0%, compared to 24.5% in the second quarter of 2017 and 21.8% on a comparative basis, with cost efficiencies partially offsetting TV content-cost pressure, fewer linear subscribers, new video platform expenses and declines in legacy services. (EBITDA margin is operating income before depreciation and amortization, divided by total Entertainment Group revenues.)
AT&T’s Entertainment Group provides entertainment, high-speed internet and communications services predominantly to residential customers in the United States.
Investor Briefing
CONTENTS
Entertainment Group
2018 AT&T EARNINGSQ2
$8.3
$1.3
$2.0
Product RevenuesI N B I L L I O N S
Video OtherHigh-speed Internet
$9.2 $9.2 $9.4
$1.6 $1.5 $1.5
$1.9 $1.9$1.9
2Q17 3Q17 4Q17
$8.4 $8.4
$1.3 $1.4
$1.9
1Q18
$11.6 $11.9$12.7 $12.7$12.6
2Q18 Historical Accounting
Method
2Q18
$11.7$2.0
2Q18 Historical Accounting
Method
$2.7 $2.4
24.5%21.1%
18.9%
Revenues and EBITDA Margin
Revenues EBITDA EBITDA Margin
2Q17 3Q17 4Q17
$2.6
22.8% 21.8%
1Q18
$11.6 $11.9$12.7 $12.6 $12.7
I N B I L L I O N S
$3.1
24.0%
2Q18
$11.7
$2.8 $2.6
CONTENTS
2018 AT&T EARNINGSQ2
9
Investor BriefingEntertainment Group
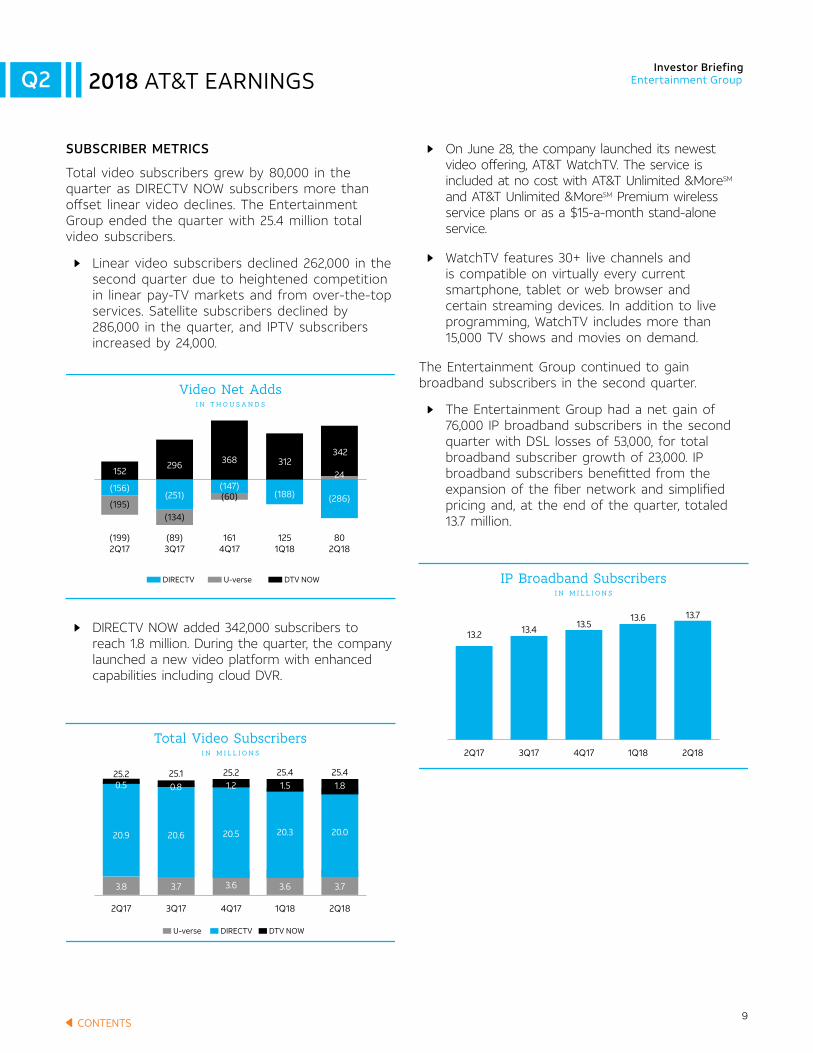
Nj On June 28, the company launched its newest video offering, AT&T WatchTV. The service is included at no cost with AT&T Unlimited &MoreSM and AT&T Unlimited &MoreSM Premium wireless service plans or as a $15-a-month stand-alone service.
Nj WatchTV features 30+ live channels and is compatible on virtually every current smartphone, tablet or web browser and certain streaming devices. In addition to live programming, WatchTV includes more than 15,000 TV shows and movies on demand.
The Entertainment Group continued to gain broadband subscribers in the second quarter.
Nj The Entertainment Group had a net gain of 76,000 IP broadband subscribers in the second quarter with DSL losses of 53,000, for total broadband subscriber growth of 23,000. IP broadband subscribers benefitted from the expansion of the fiber network and simplified pricing and, at the end of the quarter, totaled 13.7 million.
SUBSCRIBER METRICS
Total video subscribers grew by 80,000 in the quarter as DIRECTV NOW subscribers more than offset linear video declines. The Entertainment Group ended the quarter with 25.4 million total video subscribers.
Nj Linear video subscribers declined 262,000 in the second quarter due to heightened competition in linear pay-TV markets and from over-the-top services. Satellite subscribers declined by 286,000 in the quarter, and IPTV subscribers increased by 24,000.
Nj DIRECTV NOW added 342,000 subscribers to reach 1.8 million. During the quarter, the company launched a new video platform with enhanced capabilities including cloud DVR.
Total Video SubscribersI N M I L L I O N S
DIRECTV DTV NOWU-verse
3.8 3.7 3.6
20.9 20.6 20.5
2Q17 3Q17 4Q17
3.6
20.3
1Q18
25.425.2 25.1 25.21.5
3.7
20.0
2Q18
25.41.80.5 0.8 1.2 1.5
IP Broadband SubscribersI N M I L L I O N S
2Q17 3Q17 4Q17 1Q18
13.6
13.2 13.4 13.5
2Q18
13.7
24
Video Net AddsI N T H O U S A N D S
DIRECTV U-verse DTV NOW
(199)2Q17
1
(60) (188)(147)
296 368
1251Q18
(89)3Q17
1614Q17
312152
(195)(251)
(156)
(134)
(286)
802Q18
342
10CONTENTS
2018 AT&T EARNINGSQ2
Nj Customers continue to move up broadband speed tiers. About 68% of all IP broadband customers have purchased speed tiers between 18 megabits and 1 gigabit. Half of all broadband subscribers on AT&T’s fiber network have speeds of 100 megabits or more. Customers with speeds of 100 megabits or faster have more than doubled year over year.
Nj At the same time, the company continues its fiber deployment. The company now markets its 100% fiber network to more than 9 million customer locations in parts of 71 metro areas. Broadband penetration in the fiber footprint continues to be significantly higher than in AT&T’s non-fiber footprint and is nearly 50% in locations marketed to for more than 30 months.
Investor BriefingEntertainment Group

2018 AT&T EARNINGSQ2
SUBSCRIBER METRICS
At the end of the second quarter, AT&T had 89.2 million Consumer Mobility subscribers.
Nj In the quarter, Consumer Mobility lost 144,000 total subscribers. The company had prepaid phone net adds of 356,000. This was more than offset by the loss of 49,000 postpaid subscribers, due to tablet declines, and 451,000 reseller subscribers.
Effective Jan. 1, 2018, wireless subscribers who participate in employer-sponsored plans have been moved to Consumer Mobility from Business Solutions. Historical results have been recast to reflect that change.
FINANCIAL HIGHLIGHTS
Total revenues from Consumer Mobility customers totaled $14.9 billion, down 1.5% versus the year-earlier quarter and up 0.6% on a comparative basis, reflecting higher postpaid equipment revenues and stable postpaid service revenues.
Nj Second-quarter operating expenses were $9.9 billion, down 4.5% versus the second quarter of 2017, and up 1.1% on a comparative basis, reflecting higher smartphone sales and higher depreciation expense partly offset by increased cost efficiencies.
Nj Operating income totaled $5.0 billion, up 5.0% versus the second quarter of 2017 and down 0.4% on a comparative basis, due to higher postpaid smartphone volumes. Second-quarter operating income margin was 33.5%, or 31.1% on a comparative basis, down from the year-earlier quarter with higher smartphone sales and increased depreciation expense partially offset by increased cost efficiencies.
Nj Consumer Mobility EBITDA margin was 45.6%, compared to 42.8% in the second quarter of 2017 and 43.0% on a comparative basis. EBITDA service margin was 57.2%, compared to 51.8% in the year-ago quarter and 52.4% on a comparative basis. (EBITDA service margin is operating income before depreciation and amortization, divided by total service revenues.)
Consumer MobilityThe Consumer Mobility segment provides nationwide wireless service to consumer and wholesale subscribers located in the United States and in U.S. territories. The company’s wireless network powers voice and data services, including high-speed internet and video entertainment.
Investor Briefing
CONTENTS11
2018 AT&T EARNINGSQ2
EBITDA Service Margin
2Q17 3Q17 4Q17 1Q18
55.6%
44.9%
52.4%51.7%51.8%
2Q18 Historical Accounting
Method
2Q18
57.2%
1Q18
192
4Q17
84
3Q17
227
2Q17
267
2Q18
356
Prepaid Net AddsI N T H O U S A N D S

2018 AT&T EARNINGSQ2
12
With revenues in multiple currencies, total International revenues were $2.0 billion, down 3.7% from the year-ago quarter largely due to foreign exchange pressures. On a comparable basis, revenues were $2.0 billion, down 2.6% year over year. Second-quarter operating expenses were $2.1 billion, or $2.2 billion on a comparable basis. AT&T’s International operating loss totaled ($165) million, compared to ($57) million in the year-ago second quarter. Second-quarter operating income margin was (8.5)%, or (9.3)% on a comparable basis.
MEXICO
AT&T owns and operates a wireless network in Mexico. AT&T covered nearly 100 million people in Mexico with 4G LTE at the end of the second quarter.
Nj Revenues in Mexico were $697 million, up 4.8% versus the year-earlier quarter, largely due to gains in equipment revenues and subscriber growth, which were partially offset by competitive pricing. On a comparable basis, revenues were up 8.1%. Service revenues were down year over year due to an approximately $100 million impact from the shutdown of a wholesale business in the fourth quarter of 2017.
Nj Mexico second-quarter operating loss was ($217) million compared to a loss of ($198) million in the year-ago quarter, and ($196) million on a comparable basis, with continued subscriber growth offset by higher depreciation.
Nj In the quarter, AT&T added 142,000 postpaid subscribers and 611,000 prepaid subscribers to reach 16.4 million total wireless subscribers in Mexico, a 25% increase from a year ago.
DIRECTV LATIN AMERICA
DIRECTV Latin America revenues reflect price increases driven by macroeconomic conditions with generally depreciating local currencies. Total revenues from Latin America were $1.3 billion, down 7.9% year over year due primarily to foreign exchange pressures. Operating income was $52 million with continued positive free cash flow year to date.
Nj Second-quarter subscriber net adds were 140,000 even with declines in Brazil. Total subscribers at the end of the quarter were 13.7 million. Sky Mexico had approximately 8.0 million subscribers as of June 30, 2018.
The International segment includes wireless services in Mexico and satellite entertainment services in Latin America. AT&T is a leading provider of pay television services in Latin America with satellite operations serving Argentina, Brazil, Chile, Colombia, Ecuador, Peru, Uruguay, Venezuela and parts of the Caribbean. The company also owns 41% of Sky Mexico. Sky Mexico financial results are accounted for as an equity-method investment.
Investor Briefing
CONTENTS
International
2018 AT&T EARNINGSQ2
Latin America Mexico Wireless
$1.4
$0.8
2Q17 3Q17 4Q17
$1.4$1.4 $1.3$1.4
$0.7$0.7 $0.7$0.7
1Q18
$2.0$2.0 $2.0$2.1$2.2
RevenuesI N B I L L I O N S
2Q18 Historical Accounting
Method
$1.3
$0.7
2Q18
$2.0
10.5
5.7
16.4
Wireless Subscribers - MexicoI N M I L L I O N S
Postpaid Prepaid Other
7.68.2
9.4
5.2 5.3 5.5
2Q17 3Q17 4Q17 1Q18
9.9
5.6
15.6
13.113.8
15.1
2Q18

2018 AT&T EARNINGSQ2
13
FINANCIAL HIGHLIGHTS
Wireless revenues reflected the impact of ASC 606 revenue recognition, lower service revenues from customers migrating to no-overage plans, and declines in reseller, offset by higher equipment revenues from increased postpaid smartphone sales versus the year-ago quarter.
Nj Total wireless revenues were $17.3 billion, down 1.0% year over year, due to a decrease in service revenues. On a comparable basis, revenues were up 1.1%. Wireless service revenues of $13.7 billion were down 5.5% year over year but up 0.2% on a comparable basis. Wireless equipment revenues increased 20.6% to $3.6 billion, or up 5.5% on a comparable basis, due to increased postpaid smartphone sales.
Nj Second-quarter wireless operating expenses totaled $11.8 billion, down 2.5% year over year, as the impact of revenue recognition and cost efficiencies offset higher postpaid smartphone volumes, increased depreciation and higher FirstNet expenses. Wireless operating income was $5.5 billion, up 2.4% year over year. On a comparable basis, wireless operating income was $5.2 billion, or down 3.3%.
Nj Wireless margins reflected pressure from the higher postpaid smartphone volumes and increased depreciation in the quarter, partially offset by the impact of revenue recognition and continued success in driving operating costs out of the business. AT&T’s second-quarter wireless operating income margin was 31.9%, compared to 30.8% in the year-earlier quarter and 29.5% on a comparable basis.
Nj Wireless EBITDA margin was 44.1%, compared to 42.2% in the second quarter of 2017 and 41.4% on a comparable basis. Wireless EBITDA service margin was 55.7%, compared to 50.9% in the year-ago quarter and 50.4% on a comparable basis.
ARPU
The impact of revenue recognition and change in policy on USF fees and the continued migration to no-overage plans is reflected in postpaid service ARPU (average revenues per user).
Nj Postpaid phone-only ARPU decreased 7.1% versus the year-earlier quarter. On a comparable basis, phone-only ARPU was down 0.4%.
AT&T’s U.S. mobility operations are divided between the Business Solutions and Consumer Mobility segments. For comparison purposes, the company is providing supplemental information for its total domestic mobility operations.
Investor Briefing
CONTENTS
AT&T Mobility
2018 AT&T EARNINGSQ2
Revenues and EBITDA Service MarginsI N B I L L I O N S
Revenues EBITDA EBITDA Service Margin
$7.4 $7.3 $6.3
50.9% 50.7% 44.1%
2Q17 3Q17 4Q17
$7.3
54.1% 50.4%
1Q18
$17.6$17.5 $17.4 $17.4
$19.2
2Q18 Historical Accounting
Method
$7.3
55.7%
2Q18
$17.3
$7.6
Phone-only Postpaid ARPU
Phone-only Postpaid ARPU
2Q17 3Q17 4Q17
$58.30 $58.29$57.33
$53.07
$58.09
1Q18 2Q18 Historical Accounting
Method
$54.18
2Q18

CONTENTS
2018 AT&T EARNINGSQ2
SMARTPHONES
The company’s branded smartphone base continued to grow in the quarter.
Nj The company had 6.1 million branded smartphone gross adds and upgrades in the quarter, including 1.7 million from prepaid. The postpaid upgrade rate in the quarter was 3.8%, the lowest upgrade rate ever.
Nj Sales on AT&T Next were 3.6 million, or 83% of all postpaid smartphone gross adds and upgrades. The company also had 409,000 BYOD gross adds. That means about 92% of postpaid smartphone transactions in the quarter were on non-subsidy plans.
More than 50% of the company’s postpaid smartphone base is currently on AT&T Next, with more than 90% of postpaid smartphone subscribers on no-device-subsidy plans.
SUBSCRIBER METRICS
In the second quarter, AT&T posted a net increase in total wireless subscribers of 3.1 million to reach 146.9 million in service.
Nj The company had a net gain of 73,000 postpaid subscribers of which 46,000 were postpaid phones. Postpaid smartphone net adds were 143,000. Gains in connected watches were offset by tablet losses.
Nj The company added 453,000 prepaid subscribers, which included 356,000 prepaid phone subscribers. AT&T also added 3.0 million connected devices in the quarter and lost 444,000 reseller subscribers.
Nj The company had 526,000 branded net adds (both postpaid and prepaid) in the quarter, including 285,000 branded smartphones.
14
Investor BriefingAT&T Mobility
Wireless SubscribersI N M I L L I O N S
Postpaid Prepaid Reseller Connected Devices
34.7 36.439.0
14.2 15.1
77.0 77.0 77.5
2Q17 3Q17 4Q17
41.7
77.4
1Q18
143.8
136.1 138.4141.2
9.09.915.715.310.3
9.4
44.7
77.4
2Q18
146.9
8.616.2
453
Branded Net AddsI N T H O U S A N D S
Postpaid Prepaid
267
2Q17
134
558
241
324
140
1Q183Q17 4Q17
290
526410 458
698
143 49 73
2Q18
(89)
2Q17
(22)
329
1Q183Q17 4Q17
(97)
Postpaid Phone Net AddsI N T H O U S A N D S
46
2Q18
Branded Phone Subscribers &Postpaid Upgrade Rate
I N M I L L I O N S
Postpaid Feature Phones & Other
PrepaidPhones
Postpaid Upgrade Rate
Postpaid Smartphones
2Q17 3Q17 4Q17
59.2 59.3 59.95.4 5.0
4.814.2
14.6
4.1% 3.9%
7.0%60.0
4.5
14.9
1Q18
4.3%
79.478.8 78.8
79.3
14.5
60.2
4.2
15.4
2Q18
3.8%
79.8

CONTENTS
2018 AT&T EARNINGSQ2
15
Investor Briefing
CHURN
Postpaid churn was 1.02%, essentially stable from 1.01% in the year-ago quarter. Postpaid phone churn was 0.82%, compared to an all-time low of 0.79% in the year-ago quarter. Branded churn was 1.50%, compared to 1.57% in the year-ago quarter.
AT&T Mobility
Postpaid Churn
Postpaid Churn Postpaid Phone Churn
0.79%0.84%
0.89%
2Q17 3Q17 4Q17
0.84%
1Q18
1.01%1.06% 1.06%
1.11%
0.82%
2Q18
1.02%
2018 AT&T EARNINGSQ2
16
In recent weeks, AT&T:
WIRELESS
Nj Launched two new unlimited wireless plans — AT&T Unlimited &More Premium and AT&T Unlimited &More — that include a streaming service called WatchTV that offers over 30 channels of live TV at no additional cost. AT&T &More Premium customers can also add a premium option of their choice, like HBO, Amazon Music Unlimited or Pandora Premium, for no extra cost.
Nj Hosted the first AT&T 5G consumer demo, a unique holo-portation experience spanning multiple buildings, at both AT&T SHAPE and the 24th Electronic Entertainment Expo an annual event bringing together top talent in the esports community.
Nj Surpassed the 9 million subscriber mark at Cricket Wireless – doubling its subscriber base in 4 years.
Nj Opened the company’s first pop-up retail store and confirmed plans to add more points of distribution by the end of 2018, including a variety of store formats.
Nj Announced AT&T’s investment in Magic Leap and intent to be the exclusive wireless distributor of the Magic Leap One.
Nj Announced AT&T’s intent to carry the world’s first holographic smartphone — RED HYDROGEN ONE — which will be available later this year.
ENTERTAINMENT GROUP
Nj Unveiled the all new over-the-top (OTT) streaming service, WatchTV, following the close of AT&T’s merger with Time Warner. The no-frills live TV streaming service has more than 30 live channels and access to 15,000 on-demand titles. WatchTV costs $15 per month as a stand-alone service and is available at no additional cost with the company’s two new unlimited plans, &More and &More Premium.
Nj Updated DIRECTV NOW with a refreshed user interface and experience, a cloud DVR, an additional stream, expanded on-demand content library and nearly 90 new local affiliate channels with the ability to take these locals on the road in rights-eligible markets.
Nj Highlighted the convergence of technology and entertainment at AT&T SHAPE at Warner Bros. Studios. The third annual event sold out with more than 14,000 registrants, more than 20 innovative tech demos and revolutionary speakers including Sean Combs, Ava DuVernay and Issa Rae.
Nj Premiered the new original spy-thriller series CONDOR on AUDIENCE Network. CONDOR received critical acclaim and was the second-highest-performing drama on the network.
Investor Briefing
CONTENTS
AT&T helps millions around the globe connect with leading entertainment, mobile, high-speed internet and voice services. The company is one of the world’s largest providers of pay TV with customers in the U.S. and 11 Latin American countries. And it helps businesses worldwide serve their customers better with mobility and highly secure cloud solutions.
Highlights
2018 AT&T EARNINGSQ2
2018 AT&T EARNINGSQ2
17
Investor Briefing
Nj Announced that AT&T and Google Cloud are optimizing collaboration and cloud networking for business customers. Google Cloud Platform joined the AT&T NetBond® for Cloud ecosystem, and AT&T CollaborateSM now supports G Suite, Google’s cloud-based productivity suite for business.
Nj Conducted a 5G trial at the 118th U.S. Open Championship at Shinnecock Hills Golf Club with FOX Sports, FOX Innovation Lab, Intel and Ericsson. AT&T’s spectrum was used to transmit 4K video via emerging 5G technology from a wireless camera on the 7th hole to the FOX production truck, where the footage was then used in the broadcast to DIRECTV viewers.
Nj Launched the 3rd generation of the company’s DIRECTV for Business video platform, the COM3000, to offer business customers 4K HDR programming, more HD channels and more flexibility than ever before.
Nj Announced a new strategic alliance with Brookfield Infrastructure and its institutional partners for AT&T to transfer data center co-location operations and assets to Brookfield Infrastructure Partners.
WARNERMEDIA
Nj Ranked #1, #3 and #5 in the top five ad-supported cable networks in primetime among adults 18-49 with TNT, TBS and Adult Swim, respectively, in the second quarter of 2018. Additionally, Adult Swim was the #1 ad-supported cable network in total day among adults 18-34 and 18-49 in the quarter.
Nj Received 108 Primetime Emmy nominations for HBO, marking the eighth year that HBO has received 100 or more nominations.
Nj Released Warner Bros.’ star-studded film Ocean’s 8, which has grossed more than $250 million at the worldwide box office to date.
Nj Placed more than 75 series from Warner Bros. – its highest number ever – across all networks and services heading into the 2018-2019 television season.
Nj Expanded to now reach more than 9 million locations in parts of 71 metro areas with fiber. A recent launch was in South Bend, Ind. where AT&T is also conducting its first residential customer fixed wireless 5G trial, illustrating how the convergence of fiber and 5G will allow the company to deliver faster speeds and lower latency for its customers. AT&T plans to reach at least 14 million fiber locations across at least 84 metro areas by mid-2019.
Nj Launched “Todo y Más,” a new service tier on DIRECTV NOW specifically for Hispanic audiences, bringing the most live-streaming Spanish channels together in a single package compared with other OTT providers.
BUSINESS
Nj Launched new ways to sign up for FirstNet service with the Subscriber Paid offer and FirstNet Dealer Program. Nearly 1,500 public safety agencies across 52 states and territories have joined FirstNet, more than doubling the network’s adoption since April.
Nj Announced plans to acquire AlienVault®, a privately held company based in San Mateo, Calif. The acquisition will enable AT&T to expand its enterprise-grade security solutions portfolio and offerings to millions of small and medium-sized businesses. The transaction is expected to close in the third quarter of 2018.
Nj Announced plans to launch NarrowBand Internet of Things (NB-IoT) in the U.S. and Mexico in 2019, as a complement to AT&T’s existing LTE-M network. The addition of NB-IoT will help support massive IoT deployments and the growing business need for connectivity solutions that offer longer battery life, lower costs and better in-building coverage.
Nj Collaborated with Honeywell to deliver IoT technology for aircraft and freight solutions in countries across the globe in Europe, North America, Latin America, Asia, Africa and Australia.
Highlights
CONTENTS

18
Investor Briefing
CONTENTS
2018 AT&T EARNINGSQ2 Highlights
INTERNATIONAL
Nj Continued to deploy AT&T’s network in the Mexico City Metro. In 2Q, AT&T announced the third connected line, Line 3, which now has 4G LTE connectivity and free Wi-Fi service.
Nj Was recognized for the third year in a row as a Great Place to Work®, improving the company’s ranking to #5 across all industries in Mexico.
Nj Was recognized by Great Place to Work® with the 2018 “Better for the World” award. The company’s Latin American operations were also ranked as a “Top 25 Best Place to Work.”
Nj Delivered the most complete coverage of the 2018 FIFA World CupTM with all games live on DIRECTV Sports in HD, 4K and virtual reality. All games were also available with live streaming on the DIRECTV Sports app & DIRECTVSports.com.
19
Investor Briefing
2018 AT&T EARNINGSQ2
CONTENTS
Highlights
THIRD-QUARTER 2018 EARNINGS DATE: OCTOBER 24, 2018
AT&T will release third-quarter 2018 earnings on October 24, 2018, after the market closes.
The company’s Investor Briefing and related earnings materials will be available on the AT&T website at https://investors.att.com by 4:30 p.m. Eastern time.
AT&T will also host a conference call to discuss the results at 4:30 p.m. Eastern time the same day. Dial-in and replay information will be announced on First Call approximately 8 weeks before the call, which will also be broadcast live and will be available for replay over the internet at https://investors.att.com.
CAUTIONARY LANGUAGE CONCERNING FORWARD-LOOKING STATEMENTS
Information set forth in this Investor Briefing contains financial estimates and other forward-looking statements that are subject to risks and uncertainties, and actual results may differ materially. A discussion of factors that may affect future results is contained in AT&T’s filings with the Securities and Exchange Commission. AT&T disclaims any obligation to update or revise statements contained in this Investor Briefing based on new information or otherwise.
This Investor Briefing may contain certain non-GAAP financial measures. Reconciliations between the non-GAAP financial measures and the GAAP financial measures are included in the exhibits to the Investor Briefing and are available on the company’s website at https://investors.att.com.
The “quiet period” for FCC Spectrum Auction 903 (also known as the CAF II auction) is now in effect. During the quiet period, auction applicants are required to avoid discussions of bids, bidding strategy and post-auction market structure with other auction applicants.
AT&T INVESTOR BRIEFING
The AT&T Investor Briefing is published by the Investor Relations staff of AT&T Inc. Requests for further information may be directed to one of the Investor Relations managers by phone at 210-351-3327.
Correspondence should be sent to: Investor Relations AT&T Inc. 208 S. Akard Street Dallas, TX 75202
Email address: [email protected]
Senior Vice President-Investor Relations Mike Viola
Investor Relations Staff Jamie Anderson Tim Bever Michael Black Jeston Dumas Kent Evans Matt GallaherNate MelihercikMartin Sheehan Chris Womack
Business Solutions
Investor Briefing
20
2018 AT&T EARNINGSQ2Investor Briefing
AT&T INC. FINANCIAL DATA
2018 2017 As Adjusted
2018 2017 As Adjusted
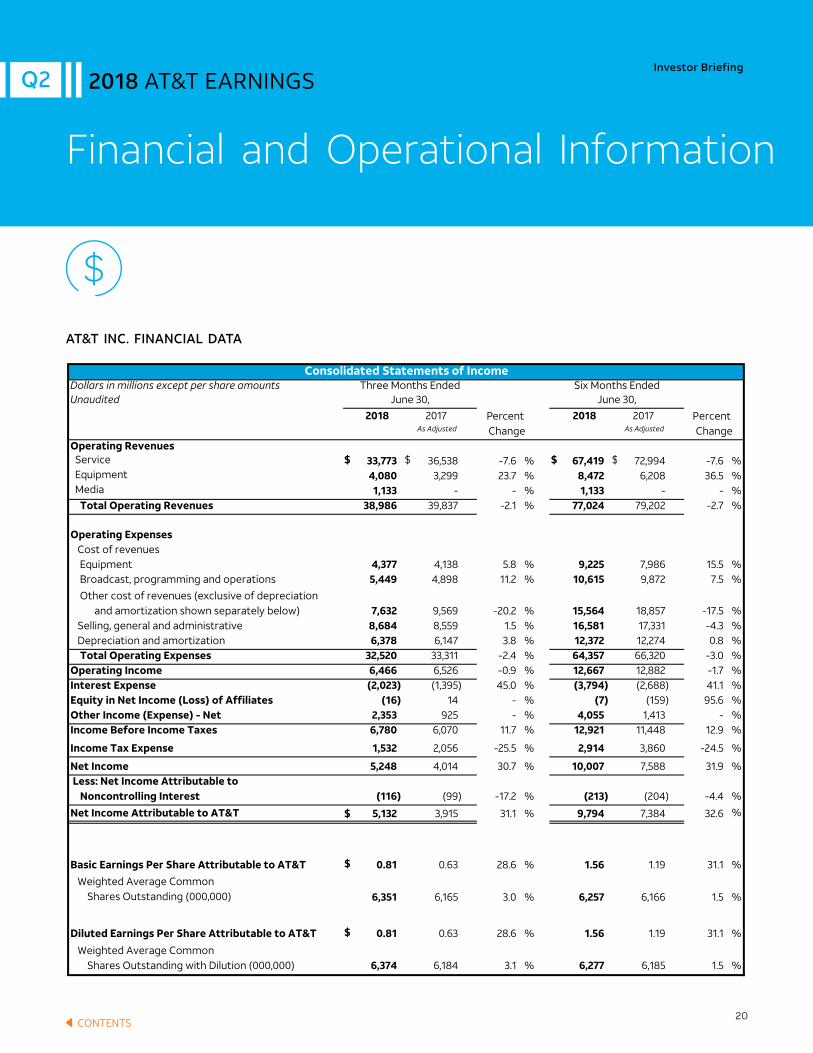
Service $ 33,773 $ 36,538 -7.6 % $ 67,419 $ 72,994 -7.6 % Equipment 4,080 3,299 23.7 % 8,472 6,208 36.5 % Media 1,133 - - % 1,133 - - %
38,986 39,837 -2.1 % 77,024 79,202 -2.7 %
4,377 4,138 5.8 % 9,225 7,986 15.5 %5,449 4,898 11.2 % 10,615 9,872 7.5 %
7,632 9,569 -20.2 % 15,564 18,857 -17.5 %8,684 8,559 1.5 % 16,581 17,331 -4.3 %6,378 6,147 3.8 % 12,372 12,274 0.8 %
32,520 33,311 -2.4 % 64,357 66,320 -3.0 %6,466 6,526 -0.9 % 12,667 12,882 -1.7 %(2,023) (1,395) 45.0 % (3,794) (2,688) 41.1 %
(16) 14 - % (7) (159) 95.6 %2,353 925 - % 4,055 1,413 - %6,780 6,070 11.7 % 12,921 11,448 12.9 %
1,532 2,056 -25.5 % 2,914 3,860 -24.5 %
5,248 4,014 30.7 % 10,007 7,588 31.9 %
(116) (99) -17.2 % (213) (204) -4.4 %
$ 5,132 3,915 31.1 % 9,794 7,384 32.6 %
$ 0.81 0.63 28.6 % 1.56 1.19 31.1 %
6,351 6,165 3.0 % 6,257 6,166 1.5 %
$ 0.81 0.63 28.6 % 1.56 1.19 31.1 %
6,374 6,184 3.1 % 6,277 6,185 1.5 %
Net Income Attributable to AT&T
Basic Earnings Per Share Attributable to AT&T Weighted Average Common Shares Outstanding (000,000)
Diluted Earnings Per Share Attributable to AT&T Weighted Average Common Shares Outstanding with Dilution (000,000)
Other Income (Expense) - NetIncome Before Income Taxes
Income Tax Expense
Net Income Less: Net Income Attributable to Noncontrolling Interest
Depreciation and amortization Total Operating ExpensesOperating IncomeInterest ExpenseEquity in Net Income (Loss) of Affiliates
Cost of revenues Equipment Broadcast, programming and operations
Other cost of revenues (exclusive of depreciation and amortization shown separately below) Selling, general and administrative
Percent Change
Percent Change
Operating Revenues
Total Operating Revenues
Operating Expenses
Unaudited June 30, June 30,
AT&T Inc.Financial Data
Consolidated Statements of IncomeDollars in millions except per share amounts Three Months Ended Six Months Ended
Financial and Operational Information
2018 AT&T EARNINGSQ2
CONTENTS

21
Investor Briefing
2018 AT&T EARNINGSQ2 Financial and Operational Information
Jun. 30, Dec. 31,2018 2017
$ 13,523 $ 50,498 25,492 16,522
1,966 1,369 14,305 10,757 55,286 79,146 5,849 -
129,556 125,222 143,499 105,449 96,802 96,136 24,440 7,021
Distribution Networks 17,403 - 30,800 11,119
8,007 1,560 23,734 18,444
$ 535,376 $ 444,097
$ 21,672 $ 38,374 35,488 34,470
5,914 4,213 1,889 1,262 3,630 3,070
68,593 81,389 168,495 125,972
59,665 43,207 29,476 31,775 25,017 19,747
114,158 94,729
7,621 6,495 125,960 89,563
56,555 50,500 (12,872) (12,714)
5,716 7,017 1,150 1,146
184,130 142,007
$ 535,376 $ 444,097
Treasury stockAccumulated other comprehensive incomeNoncontrolling interestTotal stockholders' equityTotal Liabilities and Stockholders' Equity
Total deferred credits and other noncurrent liabilitiesStockholders' EquityCommon stock Additional paid-in capitalRetained earnings
Long-Term DebtDeferred Credits and Other Noncurrent LiabilitiesDeferred income taxesPostemployment benefit obligationOther noncurrent liabilities
Accounts payable and accrued liabilitiesAdvanced billing and customer depositsAccrued taxesDividends payableTotal current liabilities
Other AssetsTotal Assets
Liabilities and Stockholders' EquityCurrent LiabilitiesDebt maturing within one year
GoodwillLicensesTrademarks and Trade Names - Net
Other Intangible Assets - NetInvestments in and Advances to Equity Affiliates
Prepaid expensesOther current assetsTotal current assetsNoncurrent Inventories and Theatrical Film and Television Production CostsProperty, Plant and Equipment - Net
Unaudited
AssetsCurrent AssetsCash and cash equivalentsAccounts receivable - net of allowances for doubtful accounts of $804 and $663
AT&T Inc.Financial Data
Consolidated Balance SheetsDollars in millions
AT&T INC. FINANCIAL DATA
CONTENTS

22
Investor Briefing
2018 AT&T EARNINGSQ2
2018 2017 As Adjusted
$ 10,007 $ 7,588
Depreciation and amortization 12,372 12,274 Amortization of film and television costs 168 - Undistributed earnings from investments in equity affiliates 235 167 Provision for uncollectible accounts 808 795 Deferred income tax expense 2,032 964 Net (gain) loss from sale of investments, net of impairments (29) 12 Actuarial (gain) loss on pension and postretirement benefits (2,726) (259)
Accounts receivable 233 119 Other current assets, inventories and theatrical film and television production costs 1,039 470 Accounts payable and other accrued liabilities (3,890) (2,761) Equipment installment receivables and related sales 490 525 Deferred customer contract acquisition and fulfillment costs (1,725) (796)
(280) (280) 442 (1,148)
9,169 10,082 19,176 17,670
Purchase of property and equipment (10,959) (10,750) Interest during construction (267) (473)
(40,715) 1,224 59 51
(218) 169 Advances to and investments in equity affiliates, net (1,035) - Cash collections of deferred purchase price 500 382
(52,635) (9,397)
2,992 (2) 4,839 -
26,478 24,115 (30,212) (6,118)
(564) (458) 12 24
(6,144) (6,021) (1,121) 77 (3,720) 11,617
(37,179) 19,890 50,932 5,935
$ 13,753 $ 25,825
Net Cash (Used in) Provided by Financing ActivitiesNet (decrease) increase in cash and cash equivalents and restricted cashCash and cash equivalents and restricted cash beginning of yearCash and Cash Equivalents and Restricted Cash End of Period
Repayment of long-term debtPurchase of treasury stockIssuance of treasury stockDividends paidOther
Net Cash Used in Investing Activities
Financing ActivitiesNet change in short-term borrowings with original maturities of three months or lessIssuance of other short-term borrowingsIssuance of long-term debt
Investing ActivitiesCapital expenditures:
Acquisitions, net of cash acquiredDispositions(Purchases) sales of securities, net
Changes in operating assets and liabilities:
Retirement benefit fundingOther - netTotal adjustmentsNet Cash Provided by Operating Activities
Unaudited June 30,
Operating ActivitiesNet incomeAdjustments to reconcile net income to net cash provided by operating activities:
AT&T Inc.Financial Data
Consolidated Statements of Cash FlowsDollars in millions Six Months Ended
AT&T INC. FINANCIAL DATA
Financial and Operational Information
CONTENTS
23
Investor Briefing
2018 AT&T EARNINGSQ2
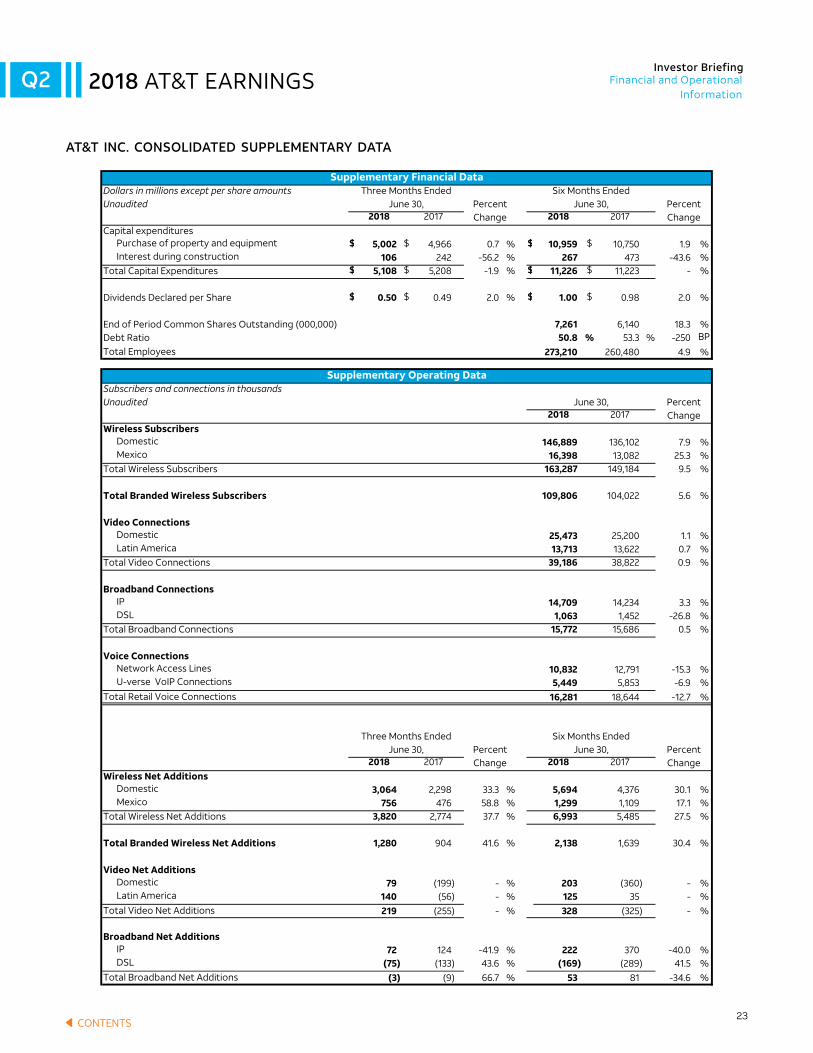
AT&T INC. CONSOLIDATED SUPPLEMENTARY DATA
2018 2017 2018 2017
Purchase of property and equipment $ 5,002 $ 4,966 0.7 % $ 10,959 $ 10,750 1.9 %Interest during construction 106 242 -56.2 % 267 473 -43.6 %
$ 5,108 $ 5,208 -1.9 % $ 11,226 $ 11,223 - %
$ 0.50 $ 0.49 2.0 % $ 1.00 $ 0.98 2.0 %
7,261 6,140 18.3 %50.8 % 53.3 % -250 BP
273,210 260,480 4.9 %
2018 2017
Domestic 146,889 136,102 7.9 %Mexico 16,398 13,082 25.3 %
163,287 149,184 9.5 %
109,806 104,022 5.6 %
Domestic 25,473 25,200 1.1 %Latin America 13,713 13,622 0.7 %
39,186 38,822 0.9 %
IP 14,709 14,234 3.3 %DSL 1,063 1,452 -26.8 %
15,772 15,686 0.5 %
Network Access Lines 10,832 12,791 -15.3 %U-verse VoIP Connections 5,449 5,853 -6.9 %
16,281 18,644 -12.7 %
2018 2017 2018 2017
Domestic 3,064 2,298 33.3 % 5,694 4,376 30.1 %Mexico 756 476 58.8 % 1,299 1,109 17.1 %
3,820 2,774 37.7 % 6,993 5,485 27.5 %
1,280 904 41.6 % 2,138 1,639 30.4 %
Domestic 79 (199) - % 203 (360) - %Latin America 140 (56) - % 125 35 - %
219 (255) - % 328 (325) - %
IP 72 124 -41.9 % 222 370 -40.0 %DSL (75) (133) 43.6 % (169) (289) 41.5 %
(3) (9) 66.7 % 53 81 -34.6 %
Total Branded Wireless Net Additions
Video Net Additions
Total Video Net Additions
Broadband Net Additions
Total Broadband Net Additions
PercentChange Change
Wireless Net Additions
Total Wireless Net Additions
Three Months Ended Six Months EndedJune 30, Percent June 30,
Broadband Connections
Total Broadband Connections
Voice Connections
Total Retail Voice Connections
Wireless Subscribers
Total Wireless Subscribers
Total Branded Wireless Subscribers
Video Connections
Total Video Connections
Unaudited June 30, PercentChange
End of Period Common Shares Outstanding (000,000)Debt RatioTotal Employees
Supplementary Operating DataSubscribers and connections in thousands
Change ChangeCapital expenditures
Total Capital Expenditures
Dividends Declared per Share
Unaudited June 30, Percent June 30, Percent
AT&T Inc.Consolidated Supplementary Data
Supplementary Financial DataDollars in millions except per share amounts Three Months Ended Six Months Ended
2018 2017 2018 2017
Purchase of property and equipment $ 5,002 $ 4,966 0.7 % $ 10,959 $ 10,750 1.9 %Interest during construction 106 242 -56.2 % 267 473 -43.6 %
$ 5,108 $ 5,208 -1.9 % $ 11,226 $ 11,223 - %
$ 0.50 $ 0.49 2.0 % $ 1.00 $ 0.98 2.0 %
7,261 6,140 18.3 %50.8 % 53.3 % -250 BP
273,210 260,480 4.9 %
2018 2017
Domestic 146,889 136,102 7.9 %Mexico 16,398 13,082 25.3 %
163,287 149,184 9.5 %
109,806 104,022 5.6 %
Domestic 25,473 25,200 1.1 %Latin America 13,713 13,622 0.7 %
39,186 38,822 0.9 %
IP 14,709 14,234 3.3 %DSL 1,063 1,452 -26.8 %
15,772 15,686 0.5 %
Network Access Lines 10,832 12,791 -15.3 %U-verse VoIP Connections 5,449 5,853 -6.9 %
16,281 18,644 -12.7 %
2018 2017 2018 2017
Domestic 3,064 2,298 33.3 % 5,694 4,376 30.1 %Mexico 756 476 58.8 % 1,299 1,109 17.1 %
3,820 2,774 37.7 % 6,993 5,485 27.5 %
1,280 904 41.6 % 2,138 1,639 30.4 %
Domestic 79 (199) - % 203 (360) - %Latin America 140 (56) - % 125 35 - %
219 (255) - % 328 (325) - %
IP 72 124 -41.9 % 222 370 -40.0 %DSL (75) (133) 43.6 % (169) (289) 41.5 %
(3) (9) 66.7 % 53 81 -34.6 %
Total Branded Wireless Net Additions
Video Net Additions
Total Video Net Additions
Broadband Net Additions
Total Broadband Net Additions
PercentChange Change
Wireless Net Additions
Total Wireless Net Additions
Three Months Ended Six Months EndedJune 30, Percent June 30,
Broadband Connections
Total Broadband Connections
Voice Connections
Total Retail Voice Connections
Wireless Subscribers
Total Wireless Subscribers
Total Branded Wireless Subscribers
Video Connections
Total Video Connections
Unaudited June 30, PercentChange
End of Period Common Shares Outstanding (000,000)Debt RatioTotal Employees
Supplementary Operating DataSubscribers and connections in thousands
Change ChangeCapital expenditures
Total Capital Expenditures
Dividends Declared per Share
Unaudited June 30, Percent June 30, Percent
AT&T Inc.Consolidated Supplementary Data
Supplementary Financial DataDollars in millions except per share amounts Three Months Ended Six Months Ended
Financial and Operational Information
CONTENTS

Investor Briefing
2018 AT&T EARNINGSQ2
24
2018 2017 2018 2017
Service $ 11,853 $ 12,467 -4.9 % $ 23,465 $ 24,932 -5.9 %Equipment 3,016 2,624 14.9 % 6,390 4,965 28.7 %
14,869 15,091 -1.5 % 29,855 29,897 -0.1 %
8,085 8,636 -6.4 % 16,609 17,196 -3.4 %1,806 1,716 5.2 % 3,613 3,432 5.3 %9,891 10,352 -4.5 % 20,222 20,628 -2.0 %4,978 4,739 5.0 % 9,633 9,269 3.9 %
- - - % - - - %$ 4,978 $ 4,739 5.0 % $ 9,633 $ 9,269 3.9 %
33.5 % 31.4 % 210 BP 32.3 % 31.0 % 130 BP
2018 2017
Postpaid 65,326 65,570 -0.4 %Prepaid 15,376 14,187 8.4 %
80,702 79,757 1.2 %8,484 10,182 -16.7 %
89,186 89,939 -0.8 %
2018 2017 2018 2017
Postpaid (49) (28) -75.0 % (113) (310) 63.5 %Prepaid 356 267 33.3 % 548 549 -0.2 %
307 239 28.5 % 435 239 82.0 %(451) (364) -23.9 % (841) (951) 11.6 %(144) (125) -15.2 % (406) (712) 43.0 %
ResellerTotal Consumer Mobility Net Additions
PercentChange Change
Consumer Mobility Net Additions
Branded
Three Months Ended Six Months EndedJune 30, Percent June 30,
Consumer Mobility Subscribers
BrandedResellerTotal Consumer Mobility Subscribers
Unaudited June 30, PercentChange
Segment Contribution
Segment Operating Income Margin
Supplementary Operating DataSubscribers and connections in thousands
Operations and supportDepreciation and amortization Total Segment Operating ExpensesSegment Operating IncomeEquity in Net Income of Affiliates
Change ChangeSegment Operating Revenues
Total Segment Operating Revenues
Segment Operating Expenses
Unaudited June 30, Percent June 30, Percent
CONSUMER MOBILITY
The Consumer Mobility segment provides nationwide wireless service to consumers and wholesale and resale wireless subscribers located in the U.S. or in U.S. territories. We provide voice and data services, including high-speed internet, and video services.
Segment ResultsDollars in millions Three Months Ended Six Months Ended
2018 2017 2018 2017
Service $ 11,853 $ 12,467 -4.9 % $ 23,465 $ 24,932 -5.9 %Equipment 3,016 2,624 14.9 % 6,390 4,965 28.7 %
14,869 15,091 -1.5 % 29,855 29,897 -0.1 %
8,085 8,636 -6.4 % 16,609 17,196 -3.4 %1,806 1,716 5.2 % 3,613 3,432 5.3 %9,891 10,352 -4.5 % 20,222 20,628 -2.0 %4,978 4,739 5.0 % 9,633 9,269 3.9 %
- - - % - - - %$ 4,978 $ 4,739 5.0 % $ 9,633 $ 9,269 3.9 %
33.5 % 31.4 % 210 BP 32.3 % 31.0 % 130 BP
2018 2017
Postpaid 65,326 65,570 -0.4 %Prepaid 15,376 14,187 8.4 %
80,702 79,757 1.2 %8,484 10,182 -16.7 %
89,186 89,939 -0.8 %
2018 2017 2018 2017
Postpaid (49) (28) -75.0 % (113) (310) 63.5 %Prepaid 356 267 33.3 % 548 549 -0.2 %
307 239 28.5 % 435 239 82.0 %(451) (364) -23.9 % (841) (951) 11.6 %(144) (125) -15.2 % (406) (712) 43.0 %
ResellerTotal Consumer Mobility Net Additions
PercentChange Change
Consumer Mobility Net Additions
Branded
Three Months Ended Six Months EndedJune 30, Percent June 30,
Consumer Mobility Subscribers
BrandedResellerTotal Consumer Mobility Subscribers
Unaudited June 30, PercentChange
Segment Contribution
Segment Operating Income Margin
Supplementary Operating DataSubscribers and connections in thousands
Operations and supportDepreciation and amortization Total Segment Operating ExpensesSegment Operating IncomeEquity in Net Income of Affiliates
Change ChangeSegment Operating Revenues
Total Segment Operating Revenues
Segment Operating Expenses
Unaudited June 30, Percent June 30, Percent
CONSUMER MOBILITY
The Consumer Mobility segment provides nationwide wireless service to consumers and wholesale and resale wireless subscribers located in the U.S. or in U.S. territories. We provide voice and data services, including high-speed internet, and video services.
Segment ResultsDollars in millions Three Months Ended Six Months Ended
CONSUMER MOBILITY
The Consumer Mobility segment provides nationwide wireless service to consumers and wholesale and resale wireless subscribers located in the U.S. or in U.S. territories. We provide voice and data services, including high-speed internet, and video services.
Financial and Operational Information
CONTENTS
25
Investor Briefing
2018 AT&T EARNINGSQ2
2018 2017 2018 2017
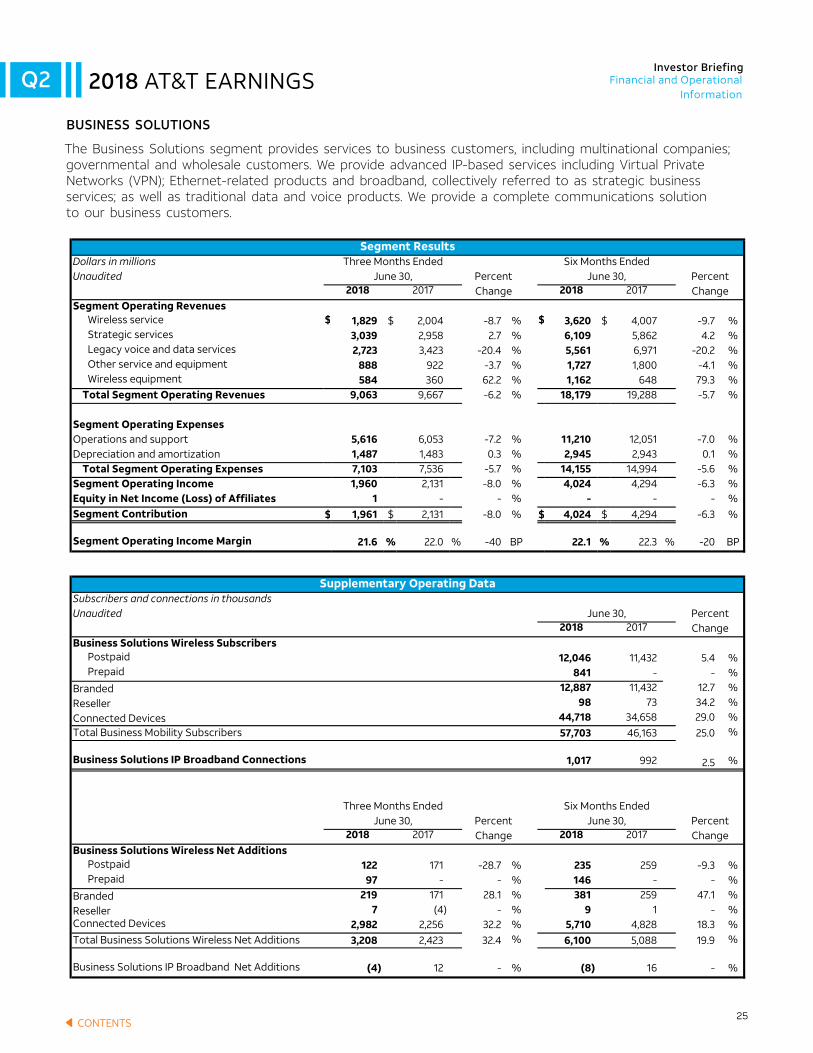
Wireless service $ 1,829 $ 2,004 -8.7 % $ 3,620 $ 4,007 -9.7 %Strategic services 3,039 2,958 2.7 % 6,109 5,862 4.2 %Legacy voice and data services 2,723 3,423 -20.4 % 5,561 6,971 -20.2 %Other service and equipment 888 922 -3.7 % 1,727 1,800 -4.1 %Wireless equipment 584 360 62.2 % 1,162 648 79.3 %
9,063 9,667 -6.2 % 18,179 19,288 -5.7 %
5,616 6,053 -7.2 % 11,210 12,051 -7.0 %1,487 1,483 0.3 % 2,945 2,943 0.1 %7,103 7,536 -5.7 % 14,155 14,994 -5.6 %1,960 2,131 -8.0 % 4,024 4,294 -6.3 %
1 - - % - - - %$ 1,961 $ 2,131 -8.0 % $ 4,024 $ 4,294 -6.3 %
21.6 % 22.0 % -40 BP 22.1 % 22.3 % -20 BP
2018 2017
Postpaid 12,046 11,432 5.4 %Prepaid 841 - - %
Branded 12,887 11,432 12.7 %Reseller 98 73 34.2 %Connected Devices 44,718 34,658 29.0 %
57,703 46,163 25.0 %
1,017 992 2.5 %
2018 2017 2018 2017
Postpaid 122 171 -28.7 % 235 259 -9.3 %Prepaid 97 - - % 146 - - %
Branded 219 171 28.1 % 381 259 47.1 %Reseller 7 (4) - % 9 1 - %Connected Devices 2,982 2,256 32.2 % 5,710 4,828 18.3 %
3,208 2,423 32.4 % 6,100 5,088 19.9 %
(4) 12 - % (8) 16 - %
Change ChangeBusiness Solutions Wireless Net Additions
Total Business Solutions Wireless Net Additions
Business Solutions IP Broadband Net Additions
Six Months EndedJune 30, Percent June 30, Percent
Business Solutions Wireless Subscribers
Total Business Mobility Subscribers
Business Solutions IP Broadband Connections
Three Months Ended
Unaudited June 30, PercentChange
Segment Contribution
Segment Operating Income Margin
Supplementary Operating DataSubscribers and connections in thousands
Operations and support Depreciation and amortization Total Segment Operating ExpensesSegment Operating IncomeEquity in Net Income (Loss) of Affiliates
Change ChangeSegment Operating Revenues
Total Segment Operating Revenues
Segment Operating Expenses
Unaudited June 30, Percent June 30, Percent
BUSINESS SOLUTIONS
The Business Solutions segment provides services to business customers, including multinational companies; governmental and wholesale customers. We provide advanced IP-based services including Virtual Private Networks (VPN); Ethernet-related products and broadband, collectively referred to as strategic business services; as well as traditional data and voice products. We provide a complete communications solution to our business customers.
Segment ResultsDollars in millions Three Months Ended Six Months Ended
BUSINESS SOLUTIONS
The Business Solutions segment provides services to business customers, including multinational companies; governmental and wholesale customers. We provide advanced IP-based services including Virtual Private Networks (VPN); Ethernet-related products and broadband, collectively referred to as strategic business services; as well as traditional data and voice products. We provide a complete communications solution to our business customers.
Financial and Operational Information
CONTENTS

26
Investor Briefing
2018 AT&T EARNINGSQ2
2018 2017 2018 2017
Video entertainment $ 8,331 $ 9,153 -9.0 % $ 16,690 $ 18,173 -8.2 %High-speed internet 1,981 1,927 2.8 % 3,859 3,868 -0.2 %Legacy voice and data services 785 981 -20.0 % 1,604 2,012 -20.3 %Other service and equipment 553 600 -7.8 % 1,074 1,209 -11.2 %
11,650 12,661 -8.0 % 23,227 25,262 -8.1 %
8,852 9,561 -7.4 % 17,791 19,166 -7.2 %1,346 1,458 -7.7 % 2,658 2,878 -7.6 %
10,198 11,019 -7.5 % 20,449 22,044 -7.2 %1,452 1,642 -11.6 % 2,778 3,218 -13.7 %
(20) (12) -66.7 % (11) (18) 38.9 %$ 1,432 $ 1,630 -12.1 % $ 2,767 $ 3,200 -13.5 %
12.5 % 13.0 % -50 BP 12.0 % 12.7 % -70 BP
2018 2017
Satellite 19,984 20,856 -4.2 %U-verse 3,656 3,825 -4.4 %DIRECTV NOW 1,809 491 - %
25,449 25,172 1.1 %
IP 13,692 13,242 3.4 %DSL 763 1,060 -28.0 %
14,455 14,302 1.1 %
Retail Consumer Switched Access Lines 4,333 5,257 -17.6 %U-verse Consumer VoIP Connections 4,950 5,439 -9.0 %
9,283 10,696 -13.2 %
2018 2017 2018 2017
Satellite (286) (156) -83.3 % (474) (156) - %U-verse 24 (195) - % 25 (428) - %DIRECTV NOW 342 152 - % 654 224 - %
80 (199) - % 205 (360) - %
IP 76 112 -32.1 % 230 354 -35.0 %DSL (53) (104) 49.0 % (125) (231) 45.9 %
23 8 - % 105 123 -14.6 %Total Broadband Net Additions1 Includes the impact of customers that migrated to DIRECTV NOW.
Change ChangeVideo Net Additions1
Total Video Net Additions
Broadband Net Additions
Six Months EndedJune 30, Percent June 30, Percent
Total Broadband Connections
Voice Connections
Total Retail Consumer Voice Connections
Three Months Ended
ChangeVideo Connections
Total Video Connections
Broadband Connections
Unaudited June 30, Percent
Segment Contribution
Segment Operating Income Margin
Supplementary Operating DataSubscribers and connections in thousands
Operations and support Depreciation and amortization Total Segment Operating ExpensesSegment Operating IncomeEquity in Net Income (Loss) of Affiliates
Change ChangeSegment Operating Revenues
Total Segment Operating Revenues
Segment Operating Expenses
Unaudited June 30, Percent June 30, Percent
ENTERTAINMENT GROUP
The Entertainment Group segment provides video, internet, voice communication, and interactive and targeted advertising services to customers located in the U.S. or in U.S. territories.
Segment ResultsDollars in millions Three Months Ended Six Months Ended
ENTERTAINMENT GROUP
The Entertainment Group segment provides video, internet, voice communication, and interactive and targeted advertising services to customers located in the U.S. or in U.S. territories.
Financial and Operational Information
CONTENTS
27
Investor Briefing
2018 AT&T EARNINGSQ2
2018 2017 2018 2017
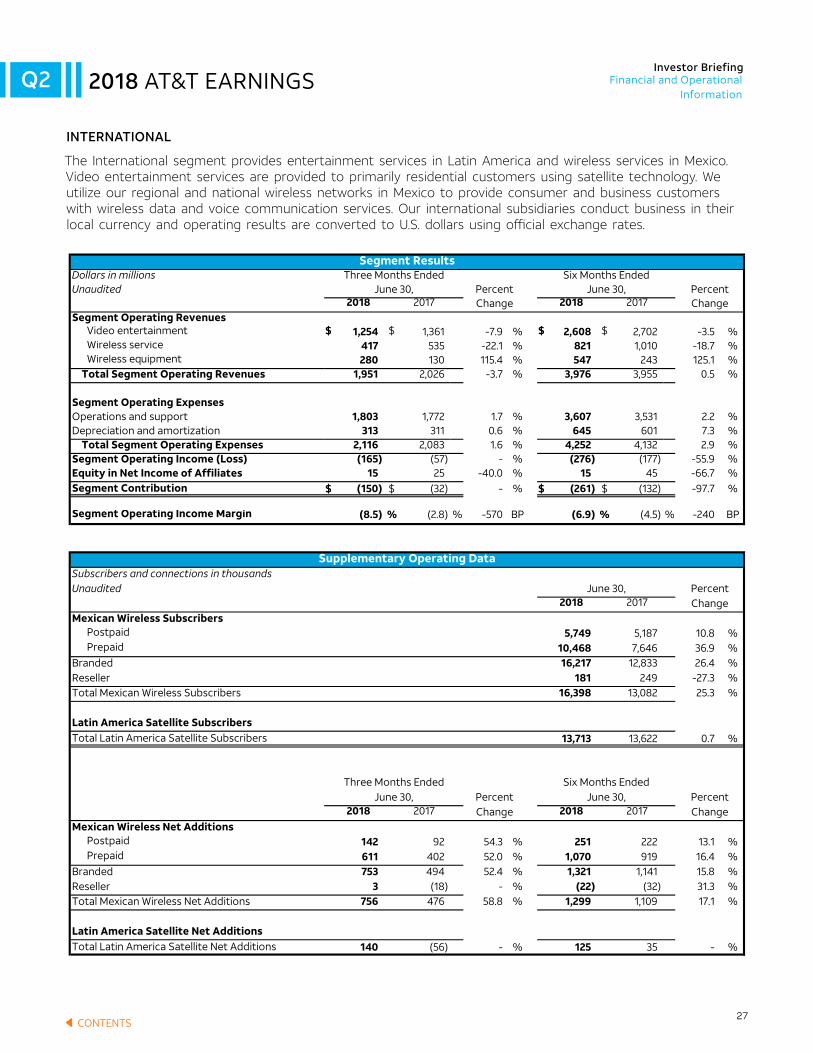
Video entertainment $ 1,254 $ 1,361 -7.9 % $ 2,608 $ 2,702 -3.5 %Wireless service 417 535 -22.1 % 821 1,010 -18.7 %Wireless equipment 280 130 115.4 % 547 243 125.1 %
1,951 2,026 -3.7 % 3,976 3,955 0.5 %
1,803 1,772 1.7 % 3,607 3,531 2.2 %313 311 0.6 % 645 601 7.3 %
2,116 2,083 1.6 % 4,252 4,132 2.9 %(165) (57) - % (276) (177) -55.9 %
15 25 -40.0 % 15 45 -66.7 %$ (150) $ (32) - % $ (261) $ (132) -97.7 %
(8.5) % (2.8) % -570 BP (6.9) % (4.5) % -240 BP
2018 2017
Postpaid 5,749 5,187 10.8 %Prepaid 10,468 7,646 36.9 %
16,217 12,833 26.4 %181 249 -27.3 %
16,398 13,082 25.3 %
13,713 13,622 0.7 %
2018 2017 2018 2017
Postpaid 142 92 54.3 % 251 222 13.1 %Prepaid 611 402 52.0 % 1,070 919 16.4 %
753 494 52.4 % 1,321 1,141 15.8 %3 (18) - % (22) (32) 31.3 %
756 476 58.8 % 1,299 1,109 17.1 %
140 (56) - % 125 35 - %
ResellerTotal Mexican Wireless Net Additions
Latin America Satellite Net AdditionsTotal Latin America Satellite Net Additions
PercentChange Change
Mexican Wireless Net Additions
Branded
Total Latin America Satellite Subscribers
Three Months Ended Six Months EndedJune 30, Percent June 30,
Mexican Wireless Subscribers
BrandedResellerTotal Mexican Wireless Subscribers
Latin America Satellite Subscribers
Unaudited June 30, PercentChange
Segment Contribution
Segment Operating Income Margin
Supplementary Operating DataSubscribers and connections in thousands
Operations and supportDepreciation and amortization Total Segment Operating ExpensesSegment Operating Income (Loss)Equity in Net Income of Affiliates
Change ChangeSegment Operating Revenues
Total Segment Operating Revenues
Segment Operating Expenses
Unaudited June 30, Percent June 30, Percent
INTERNATIONAL
The International segment provides entertainment services in Latin America and wireless services in Mexico. Video entertainment services are provided to primarily residential customers using satellite technology. We utilize our regional and national wireless networks in Mexico to provide consumer and business customers with wireless data and voice communication services. Our international subsidiaries conduct business in their local currency and operating results are converted to U.S. dollars using official exchange rates.
Segment ResultsDollars in millions Three Months Ended Six Months Ended
INTERNATIONAL
The International segment provides entertainment services in Latin America and wireless services in Mexico. Video entertainment services are provided to primarily residential customers using satellite technology. We utilize our regional and national wireless networks in Mexico to provide consumer and business customers with wireless data and voice communication services. Our international subsidiaries conduct business in their local currency and operating results are converted to U.S. dollars using official exchange rates.
Financial and Operational Information
CONTENTS

28
Investor Briefing
2018 AT&T EARNINGSQ2
2018 2017 2018 2017
Service $ 13,682 $ 14,471 -5.5 % $ 27,085 $ 28,939 -6.4 %Equipment 3,600 2,984 20.6 % 7,552 5,613 34.5 %
17,282 17,455 -1.0 % 34,637 34,552 0.2 %
9,663 10,091 -4.2 % 19,765 19,976 -1.1 %2,113 1,988 6.3 % 4,208 3,980 5.7 %
11,776 12,079 -2.5 % 23,973 23,956 0.1 %$ 5,506 $ 5,376 2.4 % $ 10,664 $ 10,596 0.6 %
31.9 % 30.8 % 110 BP 30.8 % 30.7 % 10 BP
2018 2017
Postpaid 77,372 77,002 0.5 %Prepaid 16,217 14,187 14.3 %
93,589 91,189 2.6 %8,582 10,255 -16.3 %
44,718 34,658 29.0 %146,889 136,102 7.9 %
329 326 0.9 %
2018 2017 2018 2017
Postpaid 73 143 -49.0 % 122 (51) - %Prepaid 453 267 69.7 % 694 549 26.4 %
526 410 28.3 % 816 498 63.9 %(444) (368) -20.7 % (832) (950) 12.4 %
2,982 2,256 32.2 % 5,710 4,828 18.3 %3,064 2,298 33.3 % 5,694 4,376 30.1 %
(7) - - % (6) (2,723) 99.8 %
1.50 % 1.57 % -7 BP 1.57 % 1.64 % -7 BP1.02 % 1.01 % 1 BP 1.04 % 1.07 % -3 BP0.82 % 0.79 % 3 BP 0.83 % 0.84 % -1 BP
Postpaid ChurnPostpaid Phone Only Churn
ResellerConnected DevicesTotal AT&T Mobility Net AdditionsM&A Activity, Partitioned Customers and Other Adjustments
Branded Churn
PercentChange Change
AT&T Mobility Net Additions
Branded
Domestic Licensed POPs (000,000)
Three Months Ended Six Months EndedJune 30, Percent June 30,
AT&T Mobility Subscribers
BrandedResellerConnected DevicesTotal AT&T Mobility Subscribers
Unaudited June 30, PercentChange
Operating Income Margin
Supplementary Operating DataSubscribers and connections in thousands
Operating ExpensesOperations and supportDepreciation and amortization Total Operating ExpensesOperating Income
Change ChangeOperating Revenues
Total Operating Revenues
Unaudited June 30, Percent June 30, Percent
SUPPLEMENTAL OPERATING INFORMATION - AT&T MOBILITY
As a supplemental discussion of our operating results, for comparison purposes, we are providing a view of our combined domestic wireless operations (AT&T Mobility).
Operating ResultsDollars in millions Three Months Ended Six Months Ended
SUPPLEMENTAL OPERATING INFORMATION - AT&T MOBILITY
As a supplemental discussion of our operating results, for comparison purposes, we are providing a view of our combined domestic wireless operations (AT&T Mobility).
Financial and Operational Information
CONTENTS
29
Investor Briefing
2018 AT&T EARNINGSQ2
June 30, 2018
Revenues
Operations and Support
Expenses EBITDA
Depreciation and
AmortizationOperating
Income (Loss)
Equity in Net Income (Loss)
of AffiliatesSegment
Contribution
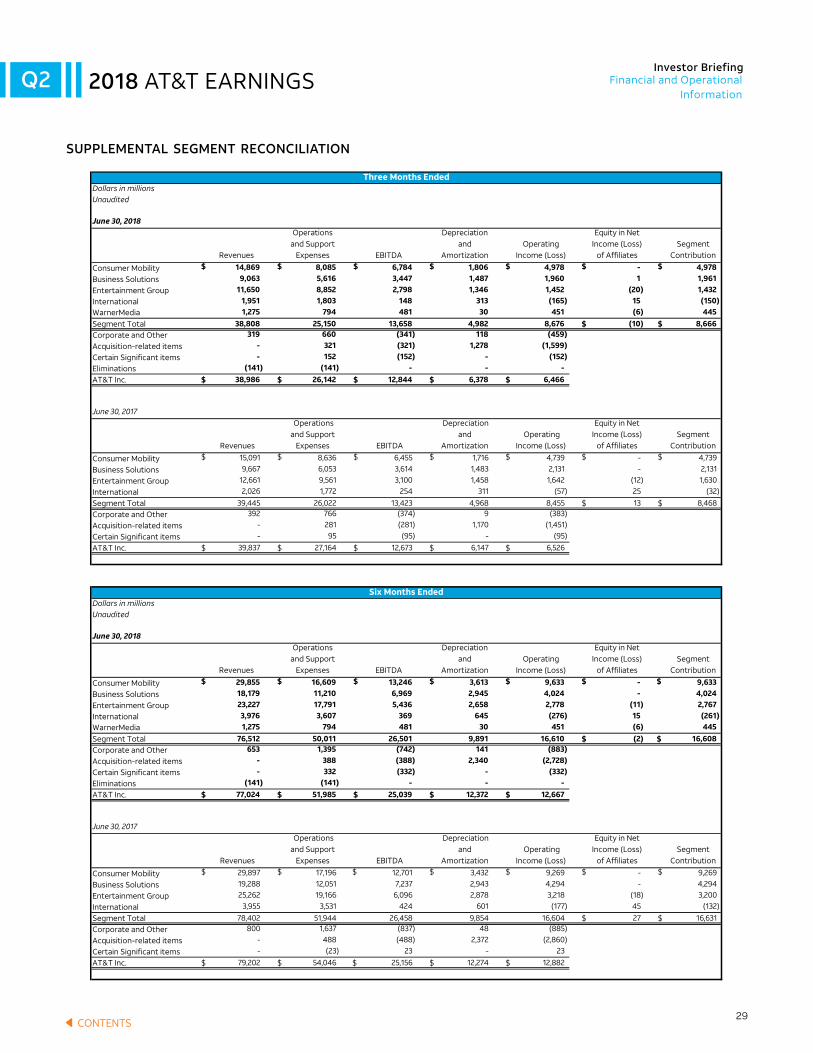
Consumer Mobility $ 14,869 $ 8,085 $ 6,784 $ 1,806 $ 4,978 $ - $ 4,978 Business Solutions 9,063 5,616 3,447 1,487 1,960 1 1,961 Entertainment Group 11,650 8,852 2,798 1,346 1,452 (20) 1,432 International 1,951 1,803 148 313 (165) 15 (150) WarnerMedia 1,275 794 481 30 451 (6) 445 Segment Total 38,808 25,150 13,658 4,982 8,676 $ (10) $ 8,666 Corporate and Other 319 660 (341) 118 (459) Acquisition-related items - 321 (321) 1,278 (1,599) Certain Significant items - 152 (152) - (152) Eliminations (141) (141) - - - AT&T Inc. $ 38,986 $ 26,142 $ 12,844 $ 6,378 $ 6,466
June 30, 2017
Revenues
Operations and Support
Expenses EBITDA
Depreciation and
Amortization Operating
Income (Loss)
Equity in Net Income (Loss)
of AffiliatesSegment
Contribution
Consumer Mobility $ 15,091 $ 8,636 $ 6,455 $ 1,716 $ 4,739 $ - $ 4,739
Business Solutions 9,667 6,053 3,614 1,483 2,131 - 2,131
Entertainment Group 12,661 9,561 3,100 1,458 1,642 (12) 1,630
International 2,026 1,772 254 311 (57) 25 (32)
Segment Total 39,445 26,022 13,423 4,968 8,455 $ 13 $ 8,468 Corporate and Other 392 766 (374) 9 (383)
Acquisition-related items - 281 (281) 1,170 (1,451)
Certain Significant items - 95 (95) - (95)
AT&T Inc. $ 39,837 $ 27,164 $ 12,673 $ 6,147 $ 6,526
June 30, 2018
Revenues
Operations and Support
Expenses EBITDA
Depreciation and
AmortizationOperating
Income (Loss)
Equity in Net Income (Loss)
of AffiliatesSegment
Contribution
Consumer Mobility $ 29,855 $ 16,609 $ 13,246 $ 3,613 $ 9,633 $ - $ 9,633 Business Solutions 18,179 11,210 6,969 2,945 4,024 - 4,024 Entertainment Group 23,227 17,791 5,436 2,658 2,778 (11) 2,767 International 3,976 3,607 369 645 (276) 15 (261) WarnerMedia 1,275 794 481 30 451 (6) 445 Segment Total 76,512 50,011 26,501 9,891 16,610 $ (2) $ 16,608 Corporate and Other 653 1,395 (742) 141 (883) Acquisition-related items - 388 (388) 2,340 (2,728) Certain Significant items - 332 (332) - (332) Eliminations (141) (141) - - - AT&T Inc. $ 77,024 $ 51,985 $ 25,039 $ 12,372 $ 12,667
June 30, 2017
Revenues
Operations and Support
Expenses EBITDA
Depreciation and
Amortization Operating
Income (Loss)
Equity in Net Income (Loss)
of AffiliatesSegment
Contribution
Consumer Mobility $ 29,897 $ 17,196 $ 12,701 $ 3,432 $ 9,269 $ - $ 9,269
Business Solutions 19,288 12,051 7,237 2,943 4,294 - 4,294
Entertainment Group 25,262 19,166 6,096 2,878 3,218 (18) 3,200
International 3,955 3,531 424 601 (177) 45 (132)
Segment Total 78,402 51,944 26,458 9,854 16,604 $ 27 $ 16,631 Corporate and Other 800 1,637 (837) 48 (885)
Acquisition-related items - 488 (488) 2,372 (2,860)
Certain Significant items - (23) 23 - 23
AT&T Inc. $ 79,202 $ 54,046 $ 25,156 $ 12,274 $ 12,882
Dollars in millionsUnaudited
SUPPLEMENTAL SEGMENT RECONCILIATION
Three Months EndedDollars in millionsUnaudited
Six Months Ended
SUPPLEMENTAL SEGMENT RECONCILIATION
Financial and Operational Information
CONTENTS

30
Investor Briefing
2018 AT&T EARNINGSQ2
2018Accounting
ImpactHistorical
2018 2017
Service $ 33,773 $ (1,390) $ 35,163 $ 36,538 -3.8 % Equipment 4,080 469 3,611 3,299 9.5 % Media 1,133 (2) 1,135 - - %
38,986 (923) 39,909 39,837 0.2 %
4,377 - 4,377 4,138 5.8 %
5,449 - 5,449 4,898 11.2 %
7,632 (903) 8,535 9,569 -10.8 %8,684 (583) 9,267 8,559 8.3 %6,378 - 6,378 6,147 3.8 %
32,520 (1,486) 34,006 33,311 2.1 %6,466 563 5,903 6,526 -9.5 %(2,023) - (2,023) (1,395) 45.0 %
(16) - (16) 14 - %2,353 - 2,353 925 - %6,780 563 6,217 6,070 2.4 %1,532 138 1,394 2,056 -32.2 %
5,248 425 4,823 4,014 20.2 %
(116) (6) (110) (99) -11.1 %$ 5,132 $ 419 $ 4,713 $ 3,915 20.4 %
$ 0.81 $ 0.07 $ 0.74 $ 0.63 17.5 %
6,351 - 6,351 6,165 3.0 %
$ 0.81 $ 0.07 $ 0.74 $ 0.63 17.5 %
6,374 - 6,374 6,184 3.1 %
Weighted Average Common Shares Outstanding (000,000)
Diluted Earnings Per Share Attributable to AT&T Weighted Average Common Shares Outstanding with Dilution (000,000)
Income Tax Expense
Net Income
Less: Net Income Attributable to Noncontrolling InterestNet Income Attributable to AT&T
Basic Earnings Per Share Attributable to AT&T
Operating IncomeInterest ExpenseEquity in Net Income (Loss) of AffiliatesOther Income (Expense) - NetIncome Before Income Taxes
Broadcast, programming and operations
Other cost of revenues (exclusive of depreciation and amortization shown separately below) Selling, general and administrative Depreciation and amortization Total Operating Expenses
Operating Revenues
Total Operating Revenues
Operating Expenses Cost of revenues Equipment
Percent Change
June 30,
As a supplemental discussion of our operating results, we are providing results under the comparative historical accounting method prior to our adoption of ASC 606 and other accounting changes.
SUPPLEMENTAL INCOME STATEMENT
Supplemental Consolidated Statements of IncomeDollars in millions except per share amounts Three Months EndedUnaudited
SUPPLEMENTAL INCOME STATEMENT
As a supplemental discussion of our operating results, we are providing consolidated results under the comparative historical accounting method prior to our adoption of ASC 606.
Financial and Operational Information
CONTENTS
31
Investor Briefing
2018 AT&T EARNINGSQ2
2018Accounting
ImpactHistorical
2018 2017
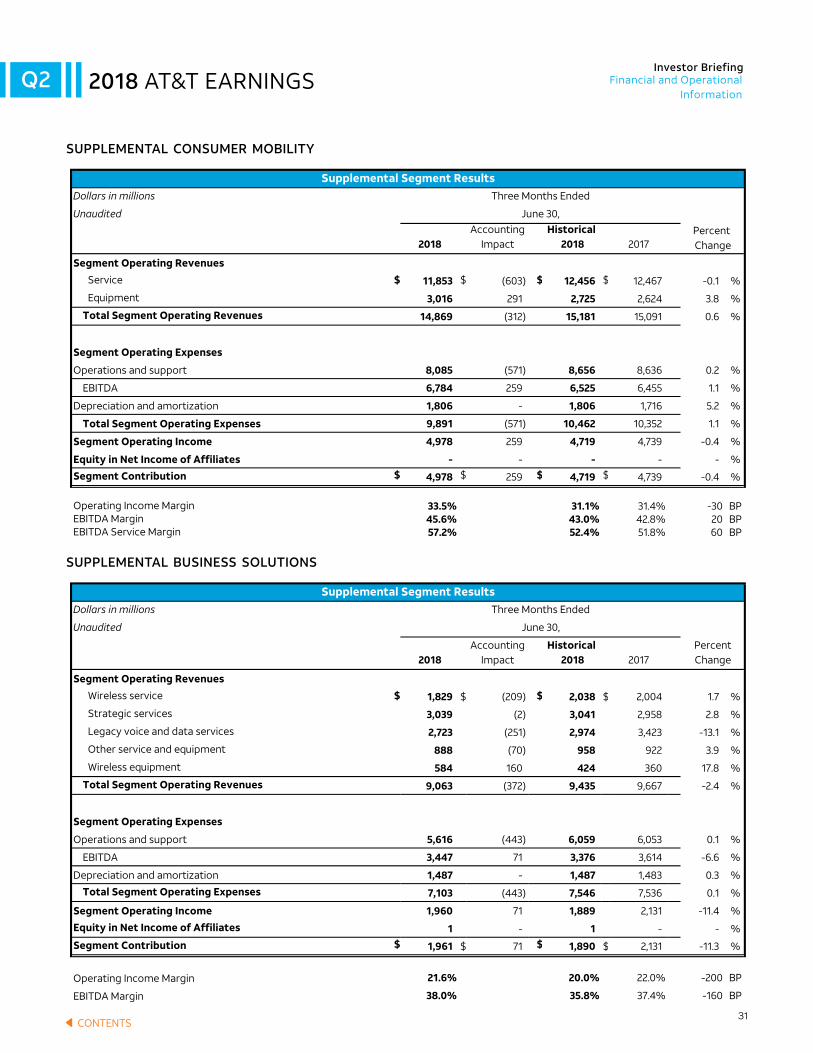
Service $ 11,853 $ (603) $ 12,456 $ 12,467 -0.1 %
Equipment 3,016 291 2,725 2,624 3.8 %
14,869 (312) 15,181 15,091 0.6 %
8,085 (571) 8,656 8,636 0.2 %
6,784 259 6,525 6,455 1.1 %
1,806 - 1,806 1,716 5.2 %
9,891 (571) 10,462 10,352 1.1 %
4,978 259 4,719 4,739 -0.4 %
- - - - - %$ 4,978 $ 259 $ 4,719 $ 4,739 -0.4 %
33.5% 31.1% 31.4% -30 BP45.6% 43.0% 42.8% 20 BP57.2% 52.4% 51.8% 60 BP
2018Accounting
ImpactHistorical
2018 2017
Wireless service $ 1,829 $ (209) $ 2,038 $ 2,004 1.7 %
Strategic services 3,039 (2) 3,041 2,958 2.8 %
Legacy voice and data services 2,723 (251) 2,974 3,423 -13.1 %
Other service and equipment 888 (70) 958 922 3.9 %
Wireless equipment 584 160 424 360 17.8 %
9,063 (372) 9,435 9,667 -2.4 %
5,616 (443) 6,059 6,053 0.1 %
3,447 71 3,376 3,614 -6.6 %
1,487 - 1,487 1,483 0.3 %
7,103 (443) 7,546 7,536 0.1 %
1,960 71 1,889 2,131 -11.4 %
1 - 1 - - %$ 1,961 $ 71 $ 1,890 $ 2,131 -11.3 %
21.6% 20.0% 22.0% -200 BP
38.0% 35.8% 37.4% -160 BP
Segment Contribution
Operating Income Margin
EBITDA Margin
EBITDA
Depreciation and amortization
Total Segment Operating Expenses
Segment Operating IncomeEquity in Net Income of Affiliates
Percent Change
Segment Operating Revenues
Total Segment Operating Revenues
Segment Operating Expenses
Operations and support
Supplemental Segment ResultsDollars in millions Three Months Ended
Unaudited June 30,
Segment Contribution
Operating Income MarginEBITDA MarginEBITDA Service Margin
SUPPLEMENTAL BUSINESS SOLUTIONS
EBITDA
Depreciation and amortization
Total Segment Operating Expenses
Segment Operating Income
Equity in Net Income of Affiliates
Percent Change
Segment Operating Revenues
Total Segment Operating Revenues
Segment Operating Expenses
Operations and support
SUPPLEMENTAL CONSUMER MOBILITY
Supplemental Segment ResultsDollars in millions Three Months Ended
Unaudited June 30,
2018Accounting
ImpactHistorical
2018 2017
Service $ 11,853 $ (603) $ 12,456 $ 12,467 -0.1 %
Equipment 3,016 291 2,725 2,624 3.8 %
14,869 (312) 15,181 15,091 0.6 %
8,085 (571) 8,656 8,636 0.2 %
6,784 259 6,525 6,455 1.1 %
1,806 - 1,806 1,716 5.2 %
9,891 (571) 10,462 10,352 1.1 %
4,978 259 4,719 4,739 -0.4 %
- - - - - %$ 4,978 $ 259 $ 4,719 $ 4,739 -0.4 %
33.5% 31.1% 31.4% -30 BP45.6% 43.0% 42.8% 20 BP57.2% 52.4% 51.8% 60 BP
2018Accounting
ImpactHistorical
2018 2017
Wireless service $ 1,829 $ (209) $ 2,038 $ 2,004 1.7 %
Strategic services 3,039 (2) 3,041 2,958 2.8 %
Legacy voice and data services 2,723 (251) 2,974 3,423 -13.1 %
Other service and equipment 888 (70) 958 922 3.9 %
Wireless equipment 584 160 424 360 17.8 %
9,063 (372) 9,435 9,667 -2.4 %
5,616 (443) 6,059 6,053 0.1 %
3,447 71 3,376 3,614 -6.6 %
1,487 - 1,487 1,483 0.3 %
7,103 (443) 7,546 7,536 0.1 %
1,960 71 1,889 2,131 -11.4 %
1 - 1 - - %$ 1,961 $ 71 $ 1,890 $ 2,131 -11.3 %
21.6% 20.0% 22.0% -200 BP
38.0% 35.8% 37.4% -160 BP
Segment Contribution
Operating Income Margin
EBITDA Margin
EBITDA
Depreciation and amortization
Total Segment Operating Expenses
Segment Operating IncomeEquity in Net Income of Affiliates
Percent Change
Segment Operating Revenues
Total Segment Operating Revenues
Segment Operating Expenses
Operations and support
Supplemental Segment ResultsDollars in millions Three Months Ended
Unaudited June 30,
Segment Contribution
Operating Income MarginEBITDA MarginEBITDA Service Margin
SUPPLEMENTAL BUSINESS SOLUTIONS
EBITDA
Depreciation and amortization
Total Segment Operating Expenses
Segment Operating Income
Equity in Net Income of Affiliates
Percent Change
Segment Operating Revenues
Total Segment Operating Revenues
Segment Operating Expenses
Operations and support
SUPPLEMENTAL CONSUMER MOBILITY
Supplemental Segment ResultsDollars in millions Three Months Ended
Unaudited June 30,
SUPPLEMENTAL CONSUMER MOBILITY
SUPPLEMENTAL BUSINESS SOLUTIONS
Financial and Operational Information
CONTENTS
32
Investor Briefing
2018 AT&T EARNINGSQ2
2018Accounting
ImpactHistorical
2018 2017
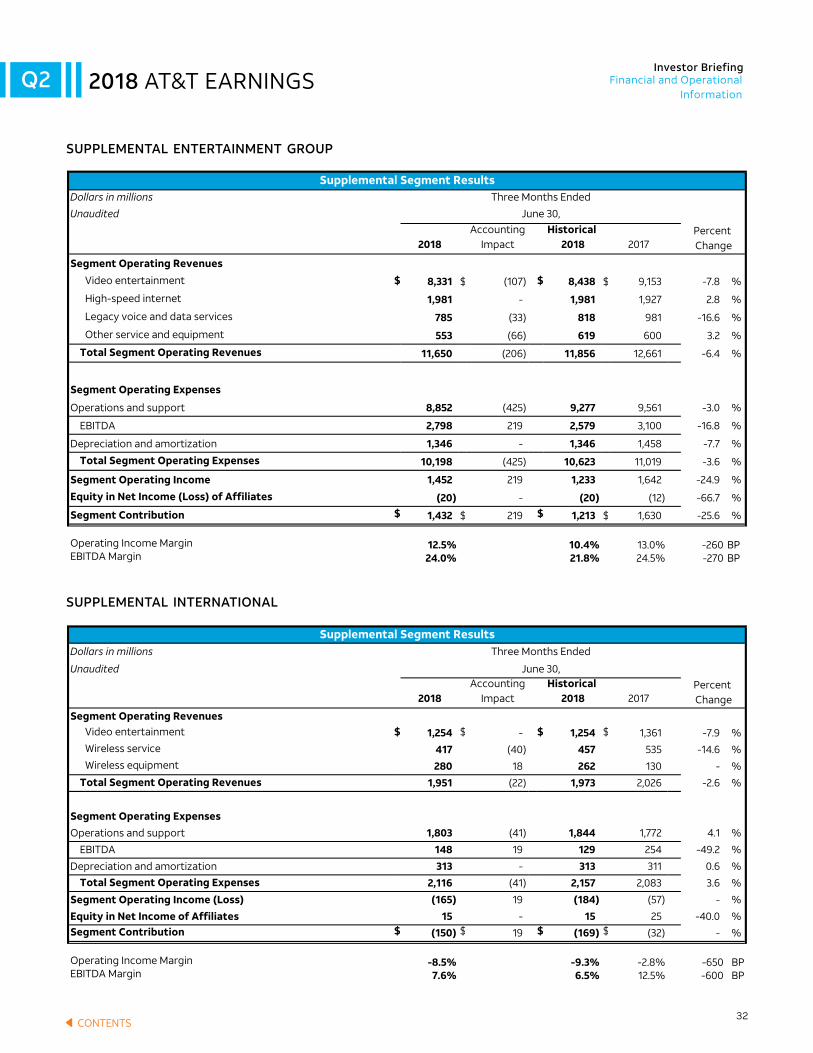
Video entertainment $ 8,331 $ (107) $ 8,438 $ 9,153 -7.8 %
High-speed internet 1,981 - 1,981 1,927 2.8 %
Legacy voice and data services 785 (33) 818 981 -16.6 %
Other service and equipment 553 (66) 619 600 3.2 %
11,650 (206) 11,856 12,661 -6.4 %
8,852 (425) 9,277 9,561 -3.0 %
2,798 219 2,579 3,100 -16.8 %
1,346 - 1,346 1,458 -7.7 %
10,198 (425) 10,623 11,019 -3.6 %
1,452 219 1,233 1,642 -24.9 %
(20) - (20) (12) -66.7 %$ 1,432 $ 219 $ 1,213 $ 1,630 -25.6 %
12.5% 10.4% 13.0% -260 BP24.0% 21.8% 24.5% -270 BP
2018Accounting
ImpactHistorical
2018 2017
Video entertainment $ 1,254 $ - $ 1,254 $ 1,361 -7.9 %Wireless service 417 (40) 457 535 -14.6 %Wireless equipment 280 18 262 130 - %
1,951 (22) 1,973 2,026 -2.6 %
1,803 (41) 1,844 1,772 4.1 %
148 19 129 254 -49.2 %
313 - 313 311 0.6 %
2,116 (41) 2,157 2,083 3.6 %
(165) 19 (184) (57) - %
15 - 15 25 -40.0 %$ (150) $ 19 $ (169) $ (32) - %
-8.5% -9.3% -2.8% -650 BP7.6% 6.5% 12.5% -600 BP
Segment Contribution
Operating Income MarginEBITDA Margin
EBITDA
Depreciation and amortization
Total Segment Operating Expenses
Segment Operating Income (Loss)Equity in Net Income of Affiliates
Percent Change
Segment Operating Revenues
Total Segment Operating Revenues
Segment Operating ExpensesOperations and support
Dollars in millions Three Months Ended
Unaudited June 30,
Segment Contribution
Operating Income MarginEBITDA Margin
SUPPLEMENTAL INTERNATIONAL
Supplemental Segment Results
EBITDA
Depreciation and amortization
Total Segment Operating Expenses
Segment Operating IncomeEquity in Net Income (Loss) of Affiliates
Percent Change
Segment Operating Revenues
Total Segment Operating Revenues
Segment Operating Expenses
Operations and support
SUPPLEMENTAL ENTERTAINMENT GROUP
Supplemental Segment ResultsDollars in millions Three Months Ended
Unaudited June 30,
2018Accounting
ImpactHistorical
2018 2017
Video entertainment $ 8,331 $ (107) $ 8,438 $ 9,153 -7.8 %
High-speed internet 1,981 - 1,981 1,927 2.8 %
Legacy voice and data services 785 (33) 818 981 -16.6 %
Other service and equipment 553 (66) 619 600 3.2 %
11,650 (206) 11,856 12,661 -6.4 %
8,852 (425) 9,277 9,561 -3.0 %
2,798 219 2,579 3,100 -16.8 %
1,346 - 1,346 1,458 -7.7 %
10,198 (425) 10,623 11,019 -3.6 %
1,452 219 1,233 1,642 -24.9 %
(20) - (20) (12) -66.7 %$ 1,432 $ 219 $ 1,213 $ 1,630 -25.6 %
12.5% 10.4% 13.0% -260 BP24.0% 21.8% 24.5% -270 BP
2018Accounting
ImpactHistorical
2018 2017
Video entertainment $ 1,254 $ - $ 1,254 $ 1,361 -7.9 %Wireless service 417 (40) 457 535 -14.6 %Wireless equipment 280 18 262 130 - %
1,951 (22) 1,973 2,026 -2.6 %
1,803 (41) 1,844 1,772 4.1 %
148 19 129 254 -49.2 %
313 - 313 311 0.6 %
2,116 (41) 2,157 2,083 3.6 %
(165) 19 (184) (57) - %
15 - 15 25 -40.0 %$ (150) $ 19 $ (169) $ (32) - %
-8.5% -9.3% -2.8% -650 BP7.6% 6.5% 12.5% -600 BP
Segment Contribution
Operating Income MarginEBITDA Margin
EBITDA
Depreciation and amortization
Total Segment Operating Expenses
Segment Operating Income (Loss)Equity in Net Income of Affiliates
Percent Change
Segment Operating Revenues
Total Segment Operating Revenues
Segment Operating ExpensesOperations and support
Dollars in millions Three Months Ended
Unaudited June 30,
Segment Contribution
Operating Income MarginEBITDA Margin
SUPPLEMENTAL INTERNATIONAL
Supplemental Segment Results
EBITDA
Depreciation and amortization
Total Segment Operating Expenses
Segment Operating IncomeEquity in Net Income (Loss) of Affiliates
Percent Change
Segment Operating Revenues
Total Segment Operating Revenues
Segment Operating Expenses
Operations and support
SUPPLEMENTAL ENTERTAINMENT GROUP
Supplemental Segment ResultsDollars in millions Three Months Ended
Unaudited June 30,
SUPPLEMENTAL ENTERTAINMENT GROUP
SUPPLEMENTAL INTERNATIONAL
Financial and Operational Information
CONTENTS
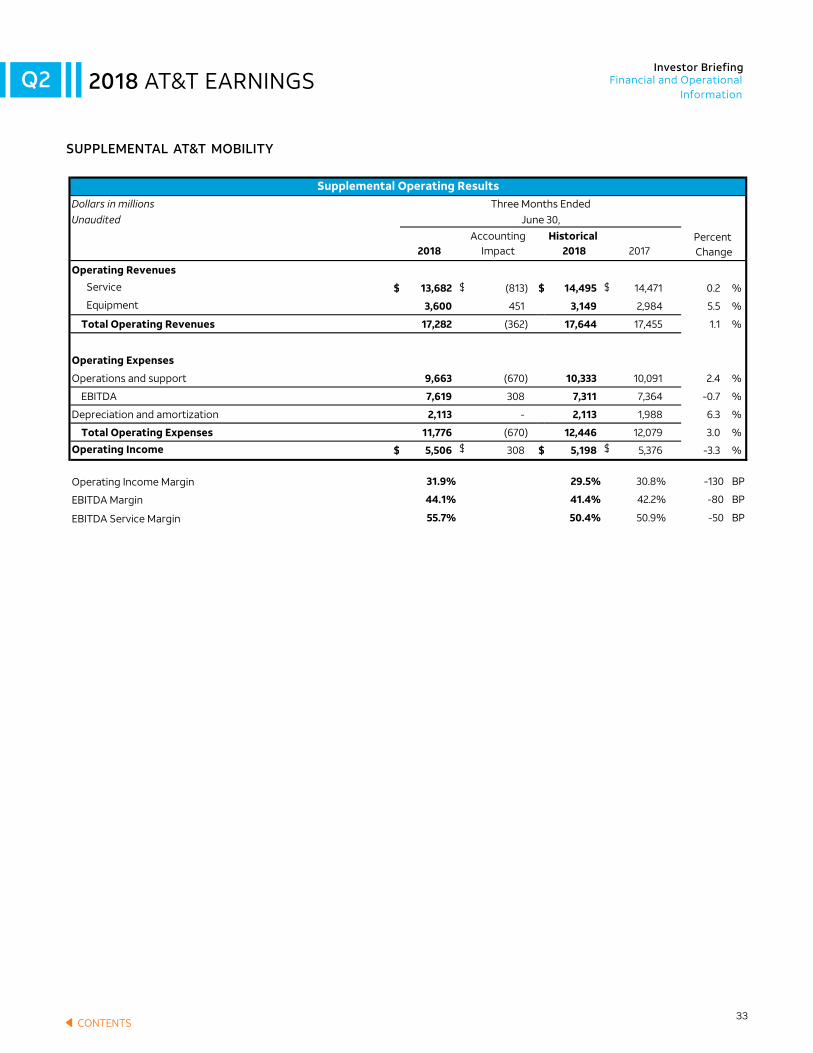
33
Investor Briefing
2018 AT&T EARNINGSQ2
2018Accounting
ImpactHistorical
2018 2017
Service $ 13,682 $ (813) $ 14,495 $ 14,471 0.2 %
Equipment 3,600 451 3,149 2,984 5.5 %
17,282 (362) 17,644 17,455 1.1 %
9,663 (670) 10,333 10,091 2.4 %
7,619 308 7,311 7,364 -0.7 %
2,113 - 2,113 1,988 6.3 %
11,776 (670) 12,446 12,079 3.0 %
$ 5,506 $ 308 $ 5,198 $ 5,376 -3.3 %
31.9% 29.5% 30.8% -130 BP
44.1% 41.4% 42.2% -80 BP
55.7% 50.4% 50.9% -50 BP
2018Accounting
ImpactHistorical
2018 2017
Video entertainment $ 1,254 $ - $ 1,254 $ 1,361 -7.9 %
1,254 - 1,254 1,361 -7.9 %
1,016 (40) 1,056 998 5.8 %
238 40 198 363 -45.5 %
186 - 186 222 -16.2 %
1,202 (40) 1,242 1,220 1.8 %
52 40 12 141 -91.5 %
15 - 15 25 -40.0 %$ 67 $ 40 $ 27 $ 166 -83.7 %
4.1% 1.0% 10.4% -940 BP19.0% 15.8% 26.7% -1090 BPEBITDA Margin
Total Operating Expenses
Operating Income (Loss)
Equity in Net Income (Loss) of AffiliatesOperating Contribution
Operating Income Margin
Total Operating Revenues
Operating Expenses
Operations and support
EBITDA
Depreciation and amortization
Unaudited June 30,
Percent Change
Operating Revenues
EBITDA Margin
EBITDA Service Margin
SUPPLEMENTAL LATIN AMERICA
Supplemental Latin America ResultsDollars in millions Three Months Ended
EBITDA
Depreciation and amortization
Total Operating ExpensesOperating Income
Operating Income Margin
Percent Change
Operating Revenues
Total Operating Revenues
Operating Expenses
Operations and support
SUPPLEMENTAL AT&T MOBILITY
Supplemental Operating ResultsDollars in millions Three Months EndedUnaudited June 30,
SUPPLEMENTAL AT&T MOBILITY
Financial and Operational Information
CONTENTS

34
Investor Briefing
2018 AT&T EARNINGSQ2
SUPPLEMENTAL LATIN AMERICA
2018Accounting
ImpactHistorical
2018 2017
Wireless service $ 417 $ (40) $ 457 $ 535 -14.6 %
Wireless equipment 280 18 262 130 - %
697 (22) 719 665 8.1 %
787 (1) 788 774 1.8 %
(90) (21) (69) (109) 36.7 %
127 - 127 89 42.7 %
914 (1) 915 863 6.0 %
(217) (21) (196) (198) 1.0 %$ (217) $ (21) $ (196) $ (198) 1.0 %
-31.1% -27.3% -29.8% 250 BP-12.9% -9.6% -16.4% 680 BP
Operating Income MarginEBITDA Margin
EBITDA
Depreciation and amortization
Total Operating Expenses
Operating Income (Loss)Operating Contribution
Percent Change
Operating Revenues
Total Operating Revenues
Operating Expenses
Operations and support
SUPPLEMENTAL MEXICO
Supplemental Mexico ResultsDollars in millions Three Months Ended
Unaudited June 30,
SUPPLEMENTAL MEXICO
2018Accounting
ImpactHistorical
2018 2017
Service $ 13,682 $ (813) $ 14,495 $ 14,471 0.2 %
Equipment 3,600 451 3,149 2,984 5.5 %
17,282 (362) 17,644 17,455 1.1 %
9,663 (670) 10,333 10,091 2.4 %
7,619 308 7,311 7,364 -0.7 %
2,113 - 2,113 1,988 6.3 %
11,776 (670) 12,446 12,079 3.0 %
$ 5,506 $ 308 $ 5,198 $ 5,376 -3.3 %
31.9% 29.5% 30.8% -130 BP
44.1% 41.4% 42.2% -80 BP
55.7% 50.4% 50.9% -50 BP
2018Accounting
ImpactHistorical
2018 2017
Video entertainment $ 1,254 $ - $ 1,254 $ 1,361 -7.9 %
1,254 - 1,254 1,361 -7.9 %
1,016 (40) 1,056 998 5.8 %
238 40 198 363 -45.5 %
186 - 186 222 -16.2 %
1,202 (40) 1,242 1,220 1.8 %
52 40 12 141 -91.5 %
15 - 15 25 -40.0 %$ 67 $ 40 $ 27 $ 166 -83.7 %
4.1% 1.0% 10.4% -940 BP19.0% 15.8% 26.7% -1090 BPEBITDA Margin
Total Operating Expenses
Operating Income (Loss)
Equity in Net Income (Loss) of AffiliatesOperating Contribution
Operating Income Margin
Total Operating Revenues
Operating Expenses
Operations and support
EBITDA
Depreciation and amortization
Unaudited June 30,
Percent Change
Operating Revenues
EBITDA Margin
EBITDA Service Margin
SUPPLEMENTAL LATIN AMERICA
Supplemental Latin America ResultsDollars in millions Three Months Ended
EBITDA
Depreciation and amortization
Total Operating ExpensesOperating Income
Operating Income Margin
Percent Change
Operating Revenues
Total Operating Revenues
Operating Expenses
Operations and support
SUPPLEMENTAL AT&T MOBILITY
Supplemental Operating ResultsDollars in millions Three Months EndedUnaudited June 30,
Financial and Operational Information
CONTENTS
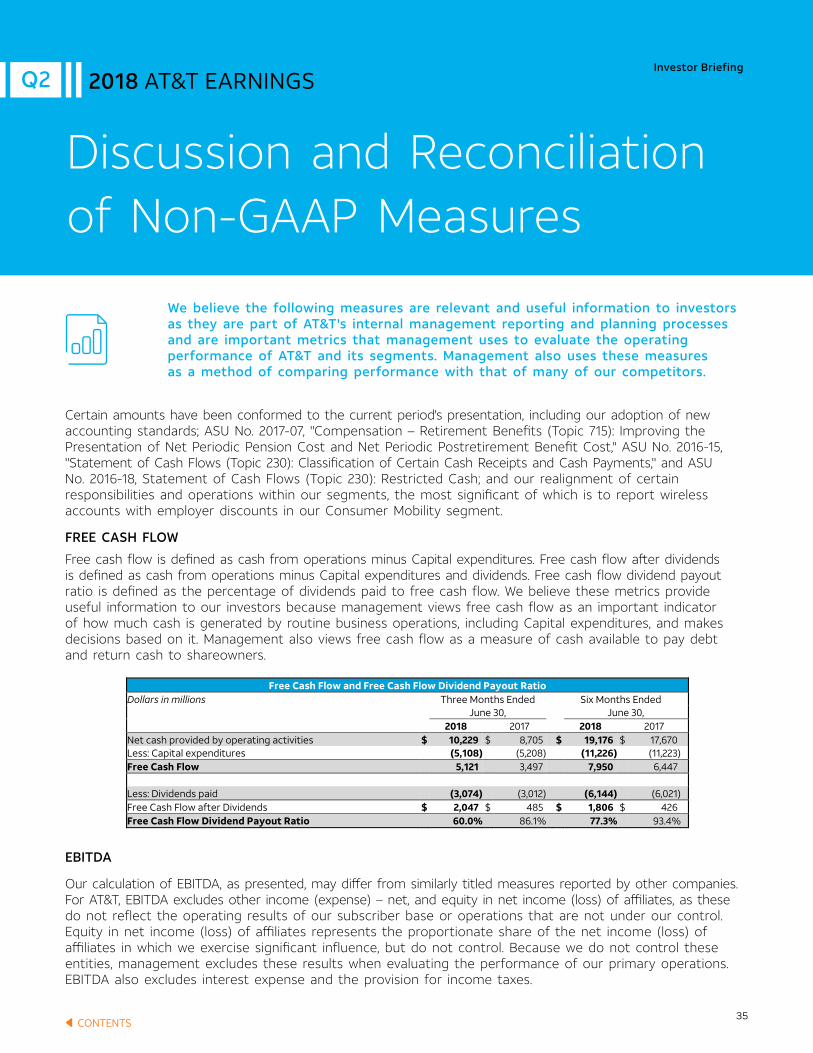
Business Solutions
Investor Briefing
35
2018 AT&T EARNINGSQ2
Certain amounts have been conformed to the current period's presentation, including our adoption of new accounting standards; ASU No. 2017-07, "Compensation – Retirement Benefits (Topic 715): Improving the Presentation of Net Periodic Pension Cost and Net Periodic Postretirement Benefit Cost," ASU No. 2016-15, "Statement of Cash Flows (Topic 230): Classification of Certain Cash Receipts and Cash Payments," and ASU No. 2016-18, Statement of Cash Flows (Topic 230): Restricted Cash; and our realignment of certain responsibilities and operations within our segments, the most significant of which is to report wireless accounts with employer discounts in our Consumer Mobility segment.
FREE CASH FLOW
Free cash flow is defined as cash from operations minus Capital expenditures. Free cash flow after dividends is defined as cash from operations minus Capital expenditures and dividends. Free cash flow dividend payout ratio is defined as the percentage of dividends paid to free cash flow. We believe these metrics provide useful information to our investors because management views free cash flow as an important indicator of how much cash is generated by routine business operations, including Capital expenditures, and makes decisions based on it. Management also views free cash flow as a measure of cash available to pay debt and return cash to shareowners.
EBITDA
Our calculation of EBITDA, as presented, may differ from similarly titled measures reported by other companies. For AT&T, EBITDA excludes other income (expense) – net, and equity in net income (loss) of affiliates, as these do not reflect the operating results of our subscriber base or operations that are not under our control. Equity in net income (loss) of affiliates represents the proportionate share of the net income (loss) of affiliates in which we exercise significant influence, but do not control. Because we do not control these entities, management excludes these results when evaluating the performance of our primary operations. EBITDA also excludes interest expense and the provision for income taxes.
Investor Briefing
Discussion and Reconciliation of Non-GAAP Measures
We believe the following measures are relevant and useful information to investors as they are part of AT&T's internal management reporting and planning processes and are important metrics that management uses to evaluate the operating performance of AT&T and its segments. Management also uses these measures as a method of comparing performance with that of many of our competitors.
2018 AT&T EARNINGSQ2
CONTENTS
Discussion and Reconciliation of Non-GAAP Measures
We believe the following measures are relevant and useful information to investors as they are part of AT&T's internal management reporting and planning processes and are important metrics that management uses to evaluate the operating performance of AT&T and its segments. Management also uses these measures as a method of comparing performance with that of many of our competitors.
Certain amounts have been conformed to the current period's presentation, including our adoption of new accounting standards; ASU No. 2017-07, "Compensation – Retirement Benefits (Topic 715): Improving the Presentation of Net Periodic Pension Cost and Net Periodic Postretirement Benefit Cost," ASU No. 2016-15, "Statement of Cash Flows (Topic 230): Classification of Certain Cash Receipts and Cash Payments," and ASU No. 2016-18, Statement of Cash Flows (Topic 230): Restricted Cash; and our realignment of certain responsibilities and operations within our segments, the most significant of which is to report wireless accounts with employer discounts in our Consumer Mobility segment.
Free Cash Flow
Free cash flow is defined as cash from operations minus Capital expenditures. Free cash flow after dividends is defined as cash from operations minus Capital expenditures and dividends. Free cash flow dividend payout ratio is defined as the percentage of dividends paid to free cash flow. We believe these metrics provide useful information to our investors because management views free cash flow as an important indicator of how much cash is generated by routine business operations, including Capital expenditures, and makes decisions based on it. Management also views free cash flow as a measure of cash available to pay debt and return cash to shareowners.
Free Cash Flow and Free Cash Flow Dividend Payout Ratio Dollars in millions Three Months Ended Six Months Ended
June 30, June 30, 2018 2017 2018 2017
Net cash provided by operating activities $ 10,229 $ 8,705 $ 19,176 $ 17,670 Less: Capital expenditures (5,108) (5,208) (11,226) (11,223) Free Cash Flow 5,121 3,497 7,950 6,447
Less: Dividends paid (3,074) (3,012) (6,144) (6,021) Free Cash Flow after Dividends $ 2,047 $ 485 $ 1,806 $ 426 Free Cash Flow Dividend Payout Ratio 60.0% 86.1% 77.3% 93.4%
EBITDA
Our calculation of EBITDA, as presented, may differ from similarly titled measures reported by other companies. For AT&T, EBITDA excludes other income (expense) – net, and equity in net income (loss) of affiliates, as these do not reflect the operating results of our subscriber base or operations that are not under our control. Equity in net income (loss) of affiliates represents the proportionate share of the net income (loss) of affiliates in which we exercise significant influence, but do not control. Because we do not control these entities, management excludes these results when evaluating the performance of our primary operations. EBITDA also excludes interest expense and the provision for income taxes. Excluding these items eliminates the expenses associated with our capital and tax structures. Finally, EBITDA excludes depreciation and amortization in order to eliminate the impact of capital investments. EBITDA does not give effect to cash used for debt service requirements and thus does not reflect available funds for distributions, reinvestment or other discretionary uses. EBITDA is not presented as an alternative measure of operating results or cash flows from operations, as determined in accordance with U.S. generally accepted accounting principles (GAAP).
EBITDA service margin is calculated as EBITDA divided by service revenues.
1
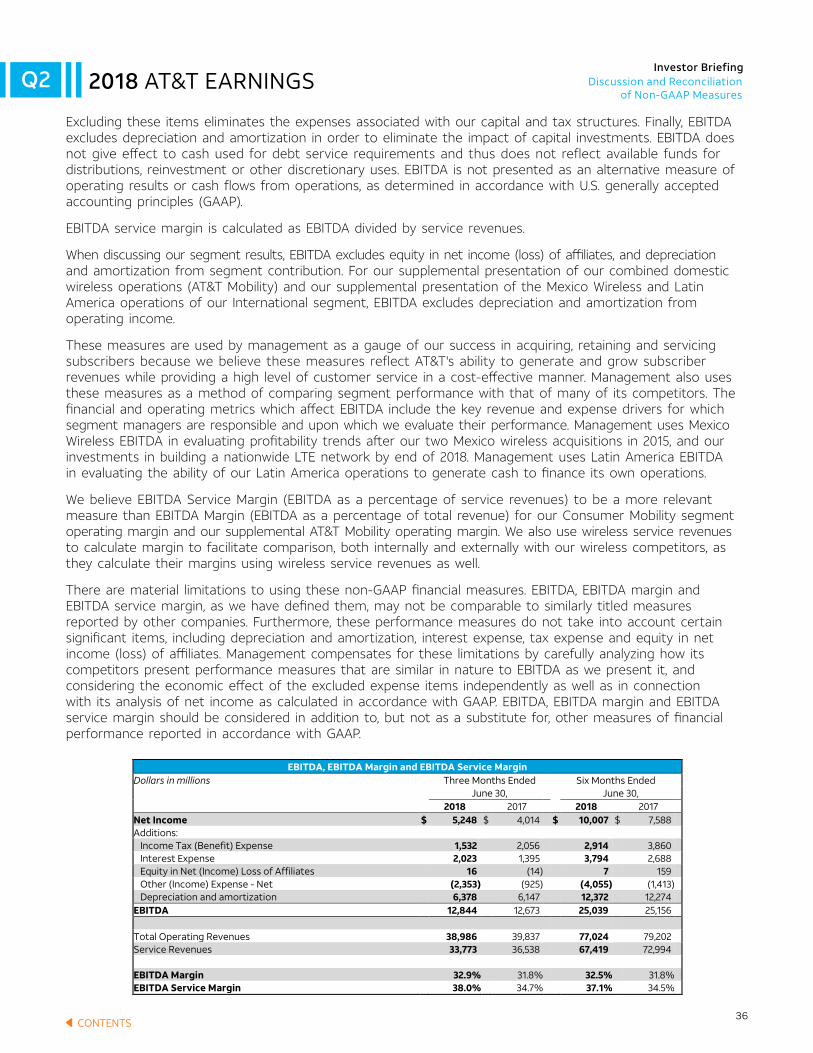
36
Investor Briefing
2018 AT&T EARNINGSQ2
Excluding these items eliminates the expenses associated with our capital and tax structures. Finally, EBITDA excludes depreciation and amortization in order to eliminate the impact of capital investments. EBITDA does not give effect to cash used for debt service requirements and thus does not reflect available funds for distributions, reinvestment or other discretionary uses. EBITDA is not presented as an alternative measure of operating results or cash flows from operations, as determined in accordance with U.S. generally accepted accounting principles (GAAP).
EBITDA service margin is calculated as EBITDA divided by service revenues.
When discussing our segment results, EBITDA excludes equity in net income (loss) of affiliates, and depreciation and amortization from segment contribution. For our supplemental presentation of our combined domestic wireless operations (AT&T Mobility) and our supplemental presentation of the Mexico Wireless and Latin America operations of our International segment, EBITDA excludes depreciation and amortization from operating income.
These measures are used by management as a gauge of our success in acquiring, retaining and servicing subscribers because we believe these measures reflect AT&T's ability to generate and grow subscriber revenues while providing a high level of customer service in a cost-effective manner. Management also uses these measures as a method of comparing segment performance with that of many of its competitors. The financial and operating metrics which affect EBITDA include the key revenue and expense drivers for which segment managers are responsible and upon which we evaluate their performance. Management uses Mexico Wireless EBITDA in evaluating profitability trends after our two Mexico wireless acquisitions in 2015, and our investments in building a nationwide LTE network by end of 2018. Management uses Latin America EBITDA in evaluating the ability of our Latin America operations to generate cash to finance its own operations.
We believe EBITDA Service Margin (EBITDA as a percentage of service revenues) to be a more relevant measure than EBITDA Margin (EBITDA as a percentage of total revenue) for our Consumer Mobility segment operating margin and our supplemental AT&T Mobility operating margin. We also use wireless service revenues to calculate margin to facilitate comparison, both internally and externally with our wireless competitors, as they calculate their margins using wireless service revenues as well.
There are material limitations to using these non-GAAP financial measures. EBITDA, EBITDA margin and EBITDA service margin, as we have defined them, may not be comparable to similarly titled measures reported by other companies. Furthermore, these performance measures do not take into account certain significant items, including depreciation and amortization, interest expense, tax expense and equity in net income (loss) of affiliates. Management compensates for these limitations by carefully analyzing how its competitors present performance measures that are similar in nature to EBITDA as we present it, and considering the economic effect of the excluded expense items independently as well as in connection with its analysis of net income as calculated in accordance with GAAP. EBITDA, EBITDA margin and EBITDA service margin should be considered in addition to, but not as a substitute for, other measures of financial performance reported in accordance with GAAP.
EBITDA, EBITDA Margin and EBITDA Service Margin Dollars in millions Three Months Ended Six Months Ended June 30, June 30,
2018 2017 2018 2017 Net Income $ 5,248 $ 4,014 $ 10,007 $ 7,588 Additions: Income Tax (Benefit) Expense 1,532 2,056 2,914 3,860 Interest Expense 2,023 1,395 3,794 2,688 Equity in Net (Income) Loss of Affiliates 16 (14) 7 159 Other (Income) Expense - Net (2,353) (925) (4,055) (1,413) Depreciation and amortization 6,378 6,147 12,372 12,274 EBITDA 12,844 12,673 25,039 25,156 Total Operating Revenues 38,986 39,837 77,024 79,202 Service Revenues 33,773 36,538 67,419 72,994 EBITDA Margin 32.9% 31.8% 32.5% 31.8% EBITDA Service Margin 38.0% 34.7% 37.1% 34.5%
Supplemental EBITDA, EBITDA Margin and EBITDA Service Margin Dollars in millions Three Months
Ended June 30, 2018
Net Income $ 4,823 Additions: Income Tax (Benefit) Expense 1,394 Interest Expense 2,023 Equity in Net (Income) Loss of Affiliates 16 Other (Income) Expense - Net (2,353) Depreciation and amortization 6,378 EBITDA 12,281 Total Operating Revenues 39,909 Service Revenues 35,163 EBITDA Margin 30.8% EBITDA Service Margin 34.9%
3
Discussion and Reconciliation of Non-GAAP Measures
CONTENTS

37
2018 AT&T EARNINGSQ2
Segment EBITDA, EBITDA Margin and EBITDA Service Margin Dollars in millions Three Months Ended Six Months Ended June 30, June 30, 2018 2017 2018 2017 Consumer Mobility Segment Segment Contribution $ 4,978 $ 4,739 $ 9,633 $ 9,269 Additions: Depreciation and amortization 1,806 1,716 3,613 3,432 EBITDA 6,784 6,455 13,246 12,701 Total Segment Operating Revenues 14,869 15,091 29,855 29,897 Service Revenues 11,853 12,467 23,465 24,932 Segment Operating Income Margin 33.5% 31.4% 32.3% 31.0% EBITDA Margin 45.6% 42.8% 44.4% 42.5% EBITDA Service Margin 57.2% 51.8% 56.5% 50.9% Business Solutions Segment Segment Contribution $ 1,961 $ 2,131 $ 4,024 $ 4,294 Additions: Equity in Net (Income) Loss of Affiliates (1) - - - Depreciation and amortization 1,487 1,483 2,945 2,943 EBITDA 3,447 3,614 6,969 7,237 Total Segment Operating Revenues 9,063 9,667 18,179 19,288 Segment Operating Income Margin 21.6% 22.0% 22.1% 22.3% EBITDA Margin 38.0% 37.4% 38.3% 37.5% Entertainment Group Segment Segment Contribution $ 1,432 $ 1,630 $ 2,767 $ 3,200 Additions: Equity in Net (Income) Loss of Affiliates 20 12 11 18 Depreciation and amortization 1,346 1,458 2,658 2,878 EBITDA 2,798 3,100 5,436 6,096 Total Segment Operating Revenues 11,650 12,661 23,227 25,262 Segment Operating Income Margin 12.5% 13.0% 12.0% 12.7% EBITDA Margin 24.0% 24.5% 23.4% 24.1% International Segment Segment Contribution $ (150) $ (32) $ (261) $ (132) Additions: Equity in Net (Income) of Affiliates (15) (25) (15) (45) Depreciation and amortization 313 311 645 601 EBITDA 148 254 369 424 Total Segment Operating Revenues 1,951 2,026 3,976 3,955 Segment Operating Income Margin -8.5% -2.8% -6.9% -4.5% EBITDA Margin 7.6% 12.5% 9.3% 10.7%
4
Investor BriefingDiscussion and Reconciliation
of Non-GAAP Measures
CONTENTS
EBITDA, EBITDA Margin and EBITDA Service Margin Dollars in millions Three Months Ended Six Months Ended June 30, June 30,
2018 2017 2018 2017 Net Income $ 5,248 $ 4,014 $ 10,007 $ 7,588 Additions: Income Tax (Benefit) Expense 1,532 2,056 2,914 3,860 Interest Expense 2,023 1,395 3,794 2,688 Equity in Net (Income) Loss of Affiliates 16 (14) 7 159 Other (Income) Expense - Net (2,353) (925) (4,055) (1,413) Depreciation and amortization 6,378 6,147 12,372 12,274 EBITDA 12,844 12,673 25,039 25,156 Total Operating Revenues 38,986 39,837 77,024 79,202 Service Revenues 33,773 36,538 67,419 72,994 EBITDA Margin 32.9% 31.8% 32.5% 31.8% EBITDA Service Margin 38.0% 34.7% 37.1% 34.5%
Supplemental EBITDA, EBITDA Margin and EBITDA Service Margin Dollars in millions Three Months
Ended June 30, 2018
Net Income $ 4,823 Additions: Income Tax (Benefit) Expense 1,394 Interest Expense 2,023 Equity in Net (Income) Loss of Affiliates 16 Other (Income) Expense - Net (2,353) Depreciation and amortization 6,378 EBITDA 12,281 Total Operating Revenues 39,909 Service Revenues 35,163 EBITDA Margin 30.8% EBITDA Service Margin 34.9%
3

38
2018 AT&T EARNINGSQ2
Supplemental AT&T Mobility EBITDA, EBITDA Margin and EBITDA Service Margin Dollars in millions Three Months Ended Six Months Ended June 30, June 30, 2018 2017 2018 2017 AT&T Mobility Operating Income $ 5,506 $ 5,376 $ 10,664 $ 10,596 Add: Depreciation and amortization 2,113 1,988 4,208 3,980 EBITDA 7,619 7,364 14,872 14,576 Total Operating Revenues 17,282 17,455 34,637 34,552 Service Revenues 13,682 14,471 27,085 28,939 Operating Income Margin 31.9% 30.8% 30.8% 30.7% EBITDA Margin 44.1% 42.2% 42.9% 42.2% EBITDA Service Margin 55.7% 50.9% 54.9% 50.4%
Supplemental Latin America EBITDA and EBITDA Margin Dollars in millions Three Months Ended Six Months Ended June 30, June 30, 2018 2017 2018 2017 International - Latin America Operating Income $ 52 $ 141 $ 200 $ 218 Add: Depreciation and amortization 186 222 391 436 EBITDA 238 363 591 654 Total Operating Revenues 1,254 1,361 2,608 2,702 Operating Income Margin 4.1% 10.4% 7.7% 8.1% EBITDA Margin 19.0% 26.7% 22.7% 24.2%
Supplemental Mexico EBITDA and EBITDA Margin Dollars in millions Three Months Ended Six Months Ended June 30, June 30, 2018 2017 2018 2017 International - Mexico Operating Income (Loss) $ (217) $ (198) $ (476) $ (395) Add: Depreciation and amortization 127 89 254 165 EBITDA (90) (109) (222) (230) Total Operating Revenues 697 665 1,368 1,253 Operating Income Margin -31.1% -29.8% -34.8% -31.5% EBITDA Margin -12.9% -16.4% -16.2% -18.4%
5
Investor BriefingDiscussion and Reconciliation
of Non-GAAP Measures
CONTENTS
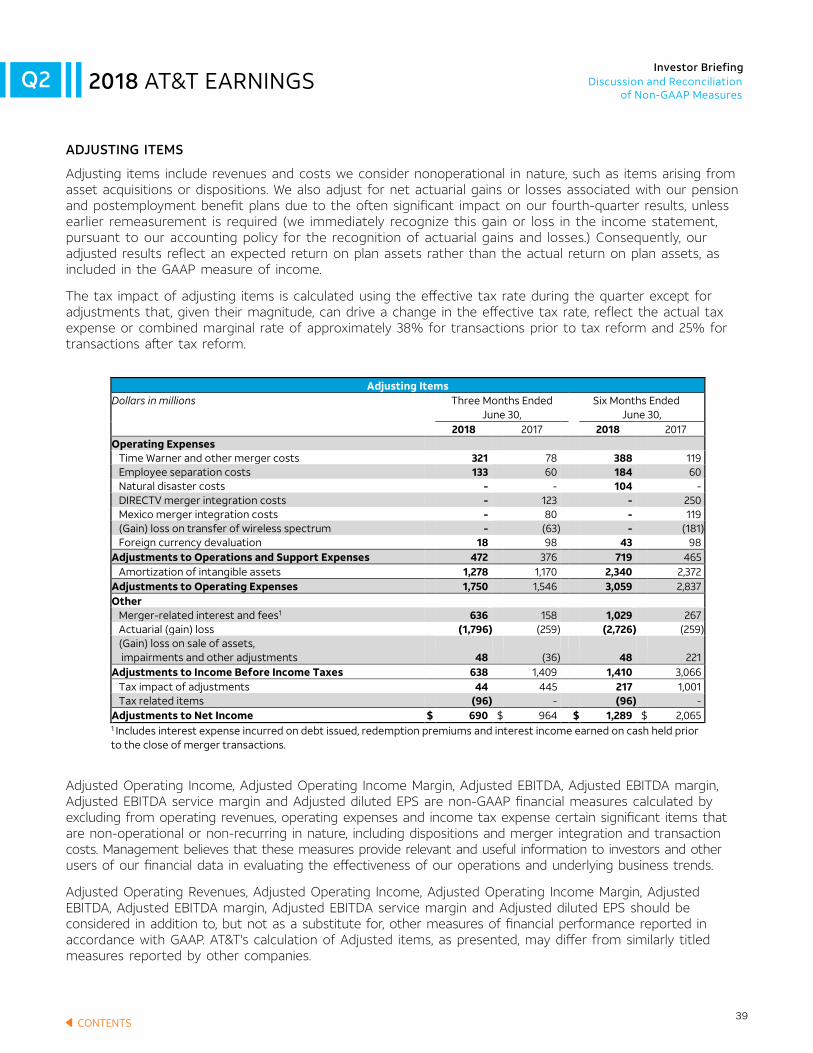
39
2018 AT&T EARNINGSQ2
ADJUSTING ITEMS
Adjusting items include revenues and costs we consider nonoperational in nature, such as items arising from asset acquisitions or dispositions. We also adjust for net actuarial gains or losses associated with our pension and postemployment benefit plans due to the often significant impact on our fourth-quarter results, unless earlier remeasurement is required (we immediately recognize this gain or loss in the income statement, pursuant to our accounting policy for the recognition of actuarial gains and losses.) Consequently, our adjusted results reflect an expected return on plan assets rather than the actual return on plan assets, as included in the GAAP measure of income.
The tax impact of adjusting items is calculated using the effective tax rate during the quarter except for adjustments that, given their magnitude, can drive a change in the effective tax rate, reflect the actual tax expense or combined marginal rate of approximately 38% for transactions prior to tax reform and 25% for transactions after tax reform.
Adjusted Operating Income, Adjusted Operating Income Margin, Adjusted EBITDA, Adjusted EBITDA margin, Adjusted EBITDA service margin and Adjusted diluted EPS are non-GAAP financial measures calculated by excluding from operating revenues, operating expenses and income tax expense certain significant items that are non-operational or non-recurring in nature, including dispositions and merger integration and transaction costs. Management believes that these measures provide relevant and useful information to investors and other users of our financial data in evaluating the effectiveness of our operations and underlying business trends.
Adjusted Operating Revenues, Adjusted Operating Income, Adjusted Operating Income Margin, Adjusted EBITDA, Adjusted EBITDA margin, Adjusted EBITDA service margin and Adjusted diluted EPS should be considered in addition to, but not as a substitute for, other measures of financial performance reported in accordance with GAAP. AT&T's calculation of Adjusted items, as presented, may differ from similarly titled measures reported by other companies.
Adjusting Items
Adjusting items include revenues and costs we consider nonoperational in nature, such as items arising from asset acquisitions or dispositions. We also adjust for net actuarial gains or losses associated with our pension and postemployment benefit plans due to the often significant impact on our fourth-quarter results, unless earlier remeasurement is required (we immediately recognize this gain or loss in the income statement, pursuant to our accounting policy for the recognition of actuarial gains and losses.) Consequently, our adjusted results reflect an expected return on plan assets rather than the actual return on plan assets, as included in the GAAP measure of income. The tax impact of adjusting items is calculated using the effective tax rate during the quarter except for adjustments that, given their magnitude, can drive a change in the effective tax rate, reflect the actual tax expense or combined marginal rate of approximately 38% for transactions prior to tax reform and 25% for transactions after tax reform.
Adjusting Items
Dollars in millions Three Months Ended Six Months Ended June 30, June 30, 2018 2017 2018 2017 Operating Expenses Time Warner and other merger costs 321 78 388 119 Employee separation costs 133 60 184 60 Natural disaster costs - - 104 - DIRECTV merger integration costs - 123 - 250 Mexico merger integration costs - 80 - 119 (Gain) loss on transfer of wireless spectrum - (63) - (181) Foreign currency devaluation 18 98 43 98 Adjustments to Operations and Support Expenses 472 376 719 465 Amortization of intangible assets 1,278 1,170 2,340 2,372 Adjustments to Operating Expenses 1,750 1,546 3,059 2,837 Other Merger-related interest and fees1 636 158 1,029 267 Actuarial (gain) loss (1,796) (259) (2,726) (259) (Gain) loss on sale of assets, impairments and other adjustments
48 (36) 48 221
Adjustments to Income Before Income Taxes 638 1,409 1,410 3,066 Tax impact of adjustments 44 445 217 1,001 Tax related items (96) - (96) - Adjustments to Net Income $ 690 $ 964 $ 1,289 $ 2,065 1 Includes interest expense incurred on debt issued, redemption premiums and interest income earned on cash held prior to the close of merger transactions. Adjusted Operating Income, Adjusted Operating Income Margin, Adjusted EBITDA, Adjusted EBITDA margin, Adjusted EBITDA service margin and Adjusted diluted EPS are non-GAAP financial measures calculated by excluding from operating revenues, operating expenses and income tax expense certain significant items that are non-operational or non-recurring in nature, including dispositions and merger integration and transaction costs. Management believes that these measures provide relevant and useful information to investors and other users of our financial data in evaluating the effectiveness of our operations and underlying business trends. Adjusted Operating Revenues, Adjusted Operating Income, Adjusted Operating Income Margin, Adjusted EBITDA, Adjusted EBITDA margin, Adjusted EBITDA service margin and Adjusted diluted EPS should be considered in addition to, but not as a substitute for, other measures of financial performance reported in accordance with GAAP. AT&T's calculation of Adjusted items, as presented, may differ from similarly titled measures reported by other companies.
6
Investor BriefingDiscussion and Reconciliation
of Non-GAAP Measures
CONTENTS

40
2018 AT&T EARNINGSQ2
Dollars in millions
2018 2017 2018 2017Operating Income $ 6,466 $ 6,526 $ 12,667 $ 12,882 Adjustments to Operating Expenses 1,750 1,546 3,059 2,837 Adjusted Operating Income 8,216 8,072 15,726 15,719
EBITDA 12,844 12,673 25,039 25,156 Adjustments to Operations and Support Expenses 472 376 719 465 Adjusted EBITDA 13,316 13,049 25,758 25,621 WarnerMedia Operating Income 1,236 3,047 Additions: Depreciation and amortization 168 339 Merger costs 548 694 WarnerMedia Adjusted EBITDA 1,952 4,080 WarnerMedia segment income (post acquisition) (451) (451) WarnerMedia segment depreciation and amortization (post acquisition)
(30) (30)
WarnerMedia merger costs (post acquisition) (159) (159) Film and television cost amortization (release prior to June 14) 612 1,103 Pro Forma Adjusted EBITDA 1 15,240 30,301
Total Operating Revenues 38,986 39,837 77,024 79,202 Service Revenues 33,773 36,538 67,419 72,994
Operating Income Margin 16.6% 16.4% 16.4% 16.3%Adjusted Operating Income Margin 21.1% 20.3% 20.4% 19.8%Adjusted EBITDA Margin 34.2% 32.8% 33.4% 32.3%Adjusted EBITDA Service Margin 39.4% 35.7% 38.2% 35.1%
Supplemental Results under Historical Accounting MethodOperating Income 5,903 Adjustments to Operating Expenses 1,750 Adjusted Supplemental Operating Income 7,653
EBITDA 12,281 Adjustments to Operations and Support Expenses 472 Adjusted Supplemental EBITDA 12,753
Supplemental Operating Revenues 39,909
Adjusted Supplemental Operating Income Margin 19.2%Adjusted Supplemental EBITDA margin 32.0%
1 Pro Forma Adjusted EBITDA reflects the combined results of operations of the combined company based on the historicalfinancial statements of AT&T and Time Warner, after giving effect to the merger and certain adjustments, and is intended toreflect the impact of the Time Warner acquisition on AT&T. WarnerMedia operating income, depreciation and amortizationexpense and merger costs are provided on Item 7.01 Form 8-K filed by AT&T on July 24, 2018. Pro Forma adjustments are to (1)remove the duplication of operating results for the 16-day period in which AT&T also reported Time Warner results and (2) torecognize the purchase accounting classification of released content as intangible assets and accordingly reclassify associatedcontent amortization from operating expense to amortization expense. Intercompany revenue and expense eliminations netand do not impact EBITDA.
Adjusted Operating Income, Adjusted Operating Income Margin, Adjusted EBITDA, Adjusted EBITDA Margin and Adjusted EBITDA Service Margin
Three Months Ended Six Months EndedJune 30, June 30,
Investor BriefingDiscussion and Reconciliation
of Non-GAAP Measures
CONTENTS
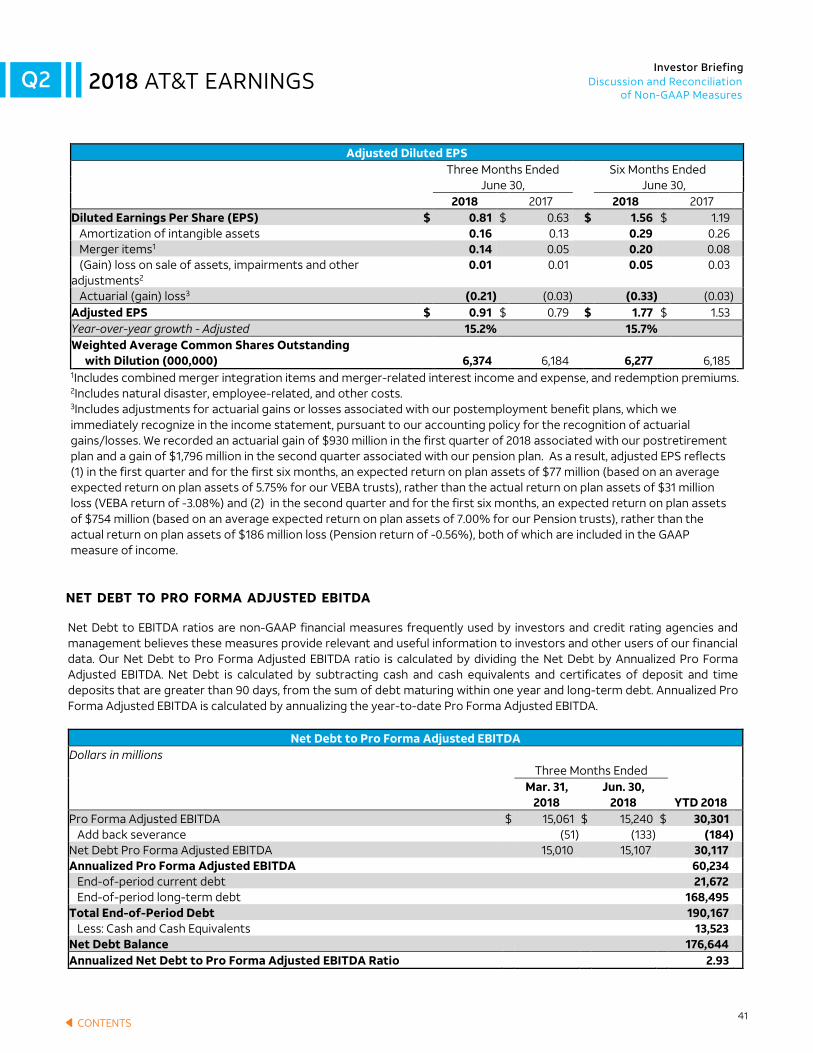
41
2018 AT&T EARNINGSQ2Investor Briefing
Discussion and Reconciliation of Non-GAAP Measures
CONTENTS
8
Adjusted Diluted EPS Three Months Ended Six Months Ended
June 30, June 30, 2018 2017 2018 2017
Diluted Earnings Per Share (EPS) $ 0.81 $ 0.63 $ 1.56 $ 1.19 Amortization of intangible assets 0.16 0.13 0.29 0.26 Merger items1 0.14 0.05 0.20 0.08 (Gain) loss on sale of assets, impairments and other adjustments2
0.01 0.01 0.05 0.03
Actuarial (gain) loss3 (0.21) (0.03) (0.33) (0.03) Adjusted EPS $ 0.91 $ 0.79 $ 1.77 $ 1.53 Year-over-year growth - Adjusted 15.2% 15.7% Weighted Average Common Shares Outstanding with Dilution (000,000) 6,374 6,184 6,277 6,185 1Includes combined merger integration items and merger-related interest income and expense, and redemption premiums. 2Includes natural disaster, employee-related, and other costs. 3Includes adjustments for actuarial gains or losses associated with our postemployment benefit plans, which we immediately recognize in the income statement, pursuant to our accounting policy for the recognition of actuarial gains/losses. We recorded an actuarial gain of $930 million in the first quarter of 2018 associated with our postretirement plan and a gain of $1,796 million in the second quarter associated with our pension plan. As a result, adjusted EPS reflects (1) in the first quarter and for the first six months, an expected return on plan assets of $77 million (based on an averageexpected return on plan assets of 5.75% for our VEBA trusts), rather than the actual return on plan assets of $31 millionloss (VEBA return of -3.08%) and (2) in the second quarter and for the first six months, an expected return on plan assetsof $754 million (based on an average expected return on plan assets of 7.00% for our Pension trusts), rather than theactual return on plan assets of $186 million loss (Pension return of -0.56%), both of which are included in the GAAPmeasure of income.
Net Debt to Pro Forma Adjusted EBITDA
Net Debt to EBITDA ratios are non-GAAP financial measures frequently used by investors and credit rating agencies and management believes these measures provide relevant and useful information to investors and other users of our financial data. Our Net Debt to Pro Forma Adjusted EBITDA ratio is calculated by dividing the Net Debt by Annualized Pro Forma Adjusted EBITDA. Net Debt is calculated by subtracting cash and cash equivalents and certificates of deposit and time deposits that are greater than 90 days, from the sum of debt maturing within one year and long-term debt. Annualized Pro Forma Adjusted EBITDA is calculated by annualizing the year-to-date Pro Forma Adjusted EBITDA.
Net Debt to Pro Forma Adjusted EBITDA Dollars in millions
Three Months Ended Mar. 31, Jun. 30,
2018 2018 YTD 2018 Pro Forma Adjusted EBITDA $ 15,061 $ 15,240 $ 30,301 Add back severance (51) (133) (184) Net Debt Pro Forma Adjusted EBITDA 15,010 15,107 30,117 Annualized Pro Forma Adjusted EBITDA 60,234 End-of-period current debt 21,672 End-of-period long-term debt 168,495 Total End-of-Period Debt 190,167 Less: Cash and Cash Equivalents 13,523 Net Debt Balance 176,644 Annualized Net Debt to Pro Forma Adjusted EBITDA Ratio 2.93
NET DEBT TO PRO FORMA ADJUSTED EBITDA

42CONTENTS
2018 AT&T EARNINGSQ2
SUPPLEMENTAL OPERATIONAL MEASURES
We provide a supplemental discussion of our domestic wireless operations that is calculated by combining our Consumer Mobility and Business Solutions segments, and then adjusting to remove non-wireless operations. The following table presents a reconciliation of our supplemental AT&T Mobility results.
Supplemental Operational Measures
We provide a supplemental discussion of our domestic wireless operations that is calculated by combining our Consumer Mobility and Business Solutions segments, and then adjusting to remove non-wireless operations. The following table presents a reconciliation of our supplemental AT&T Mobility results.
Supplemental Operational Measure Three Months Ended June 30, 2018 June 30, 2017
Consumer
Mobility Business
Solutions Adjustments1 AT&T Mobility Consumer
Mobility Business
Solutions Adjustments1 AT&T Mobility Operating Revenues Wireless service $ 11,853 $ 1,829 $ - $ 13,682 $ 12,467 $ 2,004 $ - $ 14,471 Strategic services - 3,039 (3,039) - - 2,958 (2,958) - Legacy voice and data services - 2,723 (2,723) - - 3,423 (3,423) - Other services and equipment - 888 (888) - - 922 (922) - Wireless equipment 3,016 584 - 3,600 2,624 360 - 2,984 Total Operating Revenues 14,869 9,063 (6,650) 17,282 15,091 9,667 (7,303) 17,455 Operating Expenses Operations and support 8,085 5,616 (4,038) 9,663 8,636 6,053 (4,598) 10,091 EBITDA 6,784 3,447 (2,612) 7,619 6,455 3,614 (2,705) 7,364 Depreciation and amortization 1,806 1,487 (1,180) 2,113 1,716 1,483 (1,211) 1,988 Total Operating Expenses 9,891 7,103 (5,218) 11,776 10,352 7,536 (5,809) 12,079 Operating Income $ 4,978 $ 1,960 $ (1,432) $ 5,506 $ 4,739 $ 2,131 $ (1,494) $ 5,376 1 Business wireline operations reported in Business Solutions segment.
Supplemental Operational Measure
Six Months Ended June 30, 2018 June 30, 2017
Consumer
Mobility Business
Solutions Adjustments1 AT&T Mobility Consumer
Mobility Business
Solutions Adjustments1 AT&T Mobility Operating Revenues Wireless service $ 23,465 $ 3,620 $ - $ 27,085 $ 24,932 $ 4,007 $ - $ 28,939 Strategic services - 6,109 (6,109) - - 5,862 (5,862) - Legacy voice and data services - 5,561 (5,561) - - 6,971 (6,971) - Other services and equipment - 1,727 (1,727) - - 1,800 (1,800) - Wireless equipment 6,390 1,162 - 7,552 4,965 648 - 5,613 Total Operating Revenues 29,855 18,179 (13,397) 34,637 29,897 19,288 (14,633) 34,552 Operating Expenses Operations and support 16,609 11,210 (8,054) 19,765 17,196 12,051 (9,271) 19,976 EBITDA 13,246 6,969 (5,343) 14,872 12,701 7,237 (5,362) 14,576 Depreciation and amortization 3,613 2,945 (2,350) 4,208 3,432 2,943 (2,395) 3,980 Total Operating Expenses 20,222 14,155 (10,404) 23,973 20,628 14,994 (11,666) 23,956 Operating Income $ 9,633 $ 4,024 $ (2,993) $ 10,664 $ 9,269 $ 4,294 $ (2,967) $ 10,596 1 Business wireline operations reported in Business Solutions segment.
9SUPPLEMENTAL INTERNATIONAL
We provide a supplemental presentation of the Mexico Wireless and Latin America operations within our International segment. The following table presents a reconciliation of our International segment.Supplemental International
We provide a supplemental presentation of the Mexico Wireless and Latin America operations within our International segment. The following table presents a reconciliation of our International segment.
Supplemental International Three Months Ended June 30, 2018 June 30, 2017
Latin America Mexico International Latin America Mexico International Operating Revenues Video service $ 1,254 $ - $ 1,254 $ 1,361 $ - $ 1,361 Wireless service - 417 417 - 535 535 Wireless equipment - 280 280 - 130 130 Total Operating Revenues 1,254 697 1,951 1,361 665 2,026 Operating Expenses Operations and support 1,016 787 1,803 998 774 1,772 Depreciation and amortization 186 127 313 222 89 311 Total Operating Expenses 1,202 914 2,116 1,220 863 2,083 Operating Income (Loss) 52 (217) (165) 141 (198) (57) Equity in Net Income of Affiliates 15 - 15 25 - 25 Segment Contribution $ 67 $ (217) $ (150) $ 166 $ (198) $ (32)
Supplemental International
Six Months Ended June 30, 2018 June 30, 2017
Latin America Mexico International Latin America Mexico International Operating Revenues Video service $ 2,608 $ - $ 2,608 $ 2,702 $ - $ 2,702 Wireless service - 821 821 - 1,010 1,010 Wireless equipment - 547 547 - 243 243 Total Operating Revenues 2,608 1,368 3,976 2,702 1,253 3,955 Operating Expenses Operations and support 2,017 1,590 3,607 2,048 1,483 3,531 Depreciation and amortization 391 254 645 436 165 601 Total Operating Expenses 2,408 1,844 4,252 2,484 1,648 4,132 Operating Income (Loss) 200 (476) (276) 218 (395) (177) Equity in Net Income of Affiliates 15 - 15 45 - 45 Segment Contribution $ 215 $ (476) $ (261) $ 263 $ (395) $ (132)
10
Investor BriefingDiscussion and Reconciliation
of Non-GAAP Measures