Embed Size (px)
Citation preview

May 10, 2017
CASIO COMPUTER CO., LTD.
Results Briefing for Year Ended March 31, 2017
Forward-looking Statements
Earnings estimates and expectations that are not historical fact included in this report are forward-looking statements.
Although such forward-looking statements reflect the judgment of management based on information currently available to it, various factors could cause actual results to differ materially.
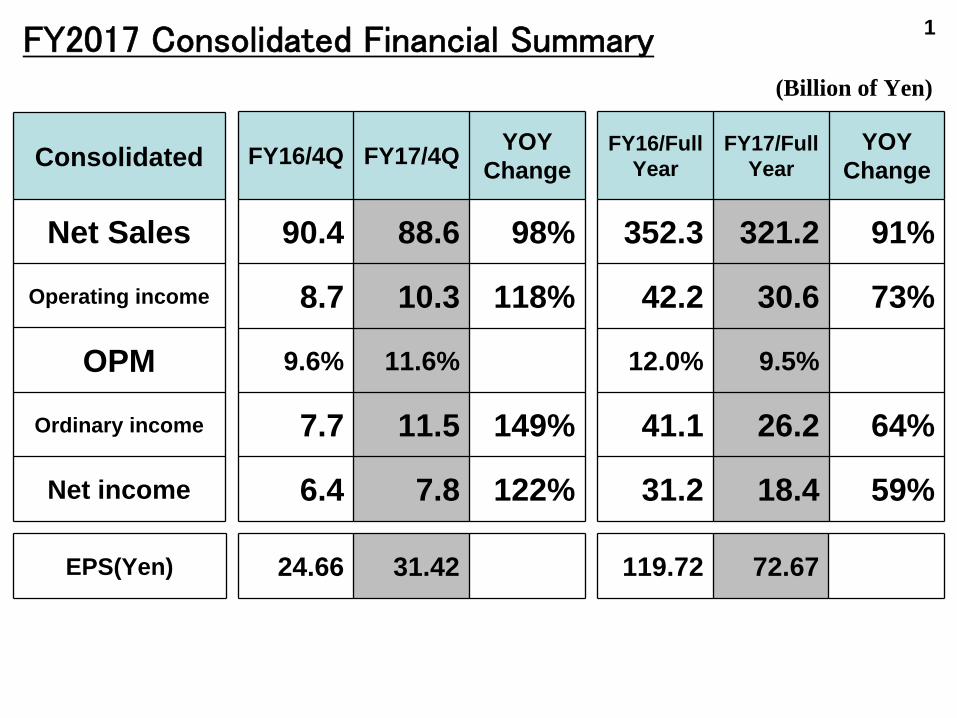
Consolidated
Net Sales
Operating income
OPM
Ordinary income
Net income
FY16/4Q FY17/4Q YOY Change
90.4 88.6 98%
8.7 10.3 118%
9.6% 11.6%
7.7 11.5 149%
6.4 7.8 122%
EPS(Yen) 24.66 31.42
FY2017
Consolidated Financial Summary
FY16/Full Year
FY17/Full Year
YOY Change
352.3 321.2 91%
42.2 30.6 73%
12.0% 9.5%
41.1 26.2 64%
31.2 18.4 59%
119.72 72.67
1
(Billion of Yen)

FY16/4Q
FY/17/ 4Q
YOY change
75.2 74.6 99%
13.1 11.9 91%
2.2 2.2 98%
90.4 88.6 98%
FY16/Full Year
FY17/Full Year
YOY change
301.0 272.8 91%42.7 39.7 93%8.6 8.7 100%
352.3 321.2 91%
Net Sales
ConsumerSystem equipment
Others
TOTAL
10.1 11.5 114%
0.3 0 -0 0 -
(1.7) (1.2) -8.7 10.3 118%
49.0 37.2 76%(1.8) (2.2) -(0.1) 0.3 -(4.9) (4.7) -42.2 30.6 73%
ConsumerSystem equipment
Others
Adjustment
TOTAL
Net Sales and Operating Income by Segment 2
(Billion of Yen)
Operating income

Timepieces・Full-year: sales declined by 4% YOY to 169.6 billion yen, while sales in local currencies increased by 5%. OPM at 20%.
・Full-year: sales down 11% YOY at 84.4 billion yen. OPM at 7%・4Q: sales increased by 11% YOY at OPM 12%.
Educational Products
・Scientific calculators continued strong performance; sales down 4% YOY while recording 8% increase in local currencies. OPM at 16%.
・Sales down 21% YOY due to production delay associated with quality issues. Loss of 1.3 billion yen.
・Sales remained flat YOY thanks to keeping sales for students. OPM at 3%.
・4Q: sales up 3% YOY (up 6% in local currencies) at OPM 19%.
· 4Q: sales increased 42% YOY; OPM recovered to 7%.
・4Q: thanks to large orders and the contribution from English conversation learning tools, sales up 5% YOY at OPM 11%.
<Calculator:Approx 50%>
<Electronic dictionary: Approx 25%>
<Electronic musical instrument:Approx 25%>
Overview by Business
Timepieces(Net Sales)
Educational Products(Net Sales)
・4Q: sales temporarily slowed down ahead of the launch of powerful new products in 1Q (down 5% YOY). OPM at 20%
3
・G-SHOCK was strong, reaching annual sales of 8.5 million units.
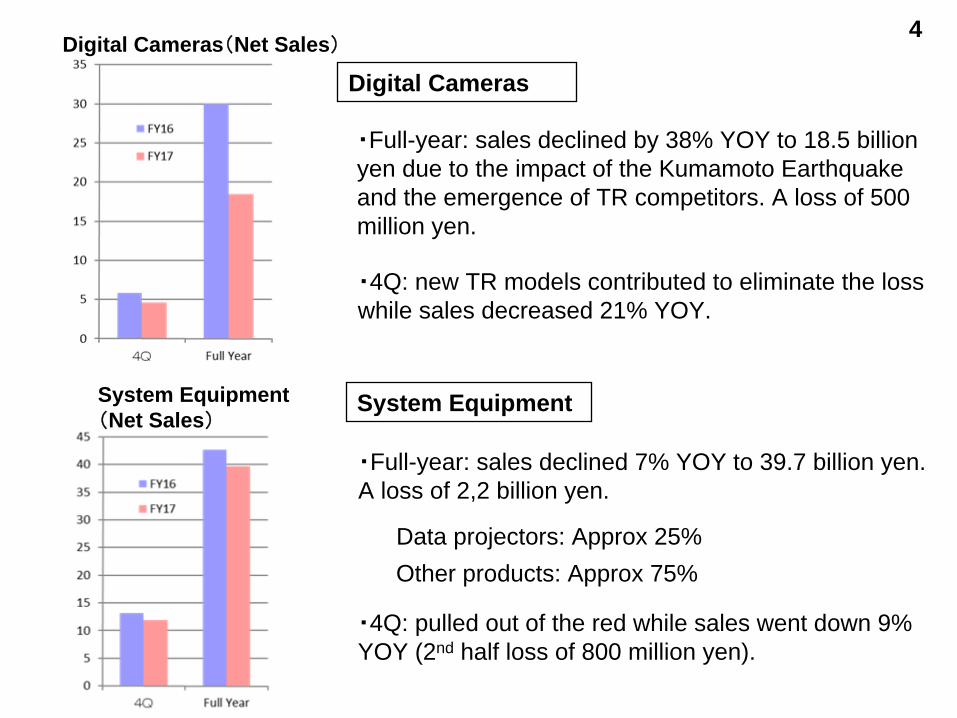
System Equipment
Digital Cameras
・Full-year: sales declined by 38% YOY to 18.5 billion yen due to the impact of the Kumamoto Earthquake and the emergence of TR competitors. A loss of 500 million yen.
・Full-year: sales declined 7% YOY to 39.7 billion yen. A loss of 2,2 billion yen.
Data projectors: Approx 25%Other products: Approx 75%
・4Q: new TR models contributed to eliminate the loss while sales decreased 21% YOY.
・4Q: pulled out of the red while sales went down 9% YOY (2nd half loss of 800 million yen).
4Digital Cameras(Net Sales)
System Equipment(Net Sales)
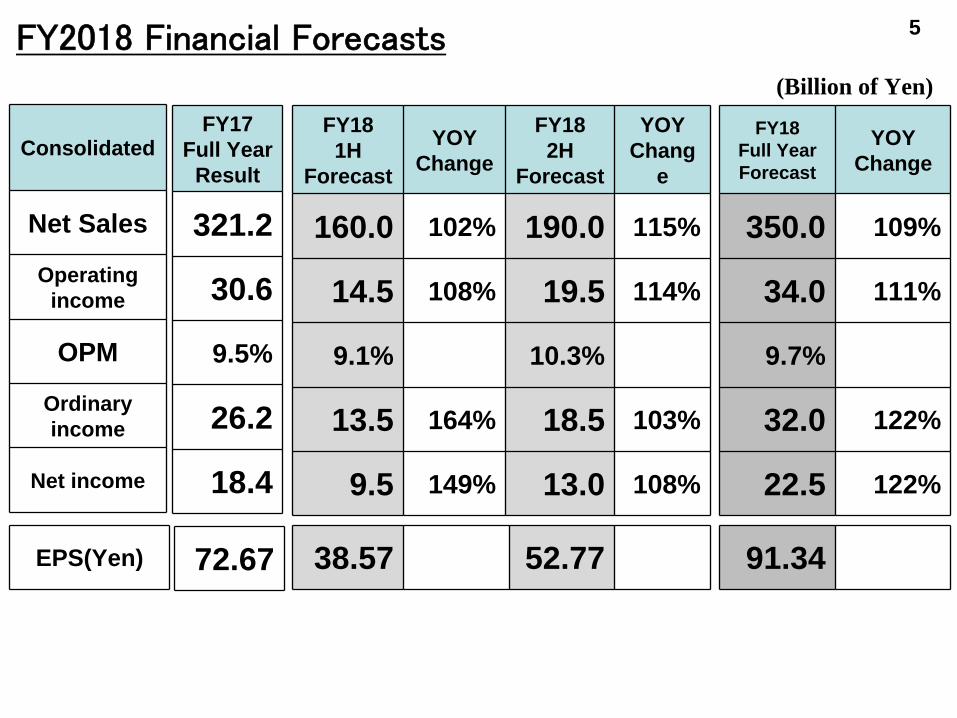
Consolidated
Net Sales
Operating income
OPM
Ordinary income
Net income
FY181H
Forecast
YOYChange
FY182H
Forecast
YOYChang
e
160.0 102% 190.0 115%
14.5 108% 19.5 114%
9.1% 10.3%
13.5 164% 18.5 103%
9.5 149% 13.0 108%
EPS(Yen)
FY18Full Year Forecast
YOYChange
350.0 109%
34.0 111%
9.7%
32.0 122%
22.5 122%
FY17 Full Year
Result
321.2
30.6
9.5%
26.2
18.4
72.67 38.57 52.77 91.34
FY2018 Financial Forecasts 5
(Billion of Yen)
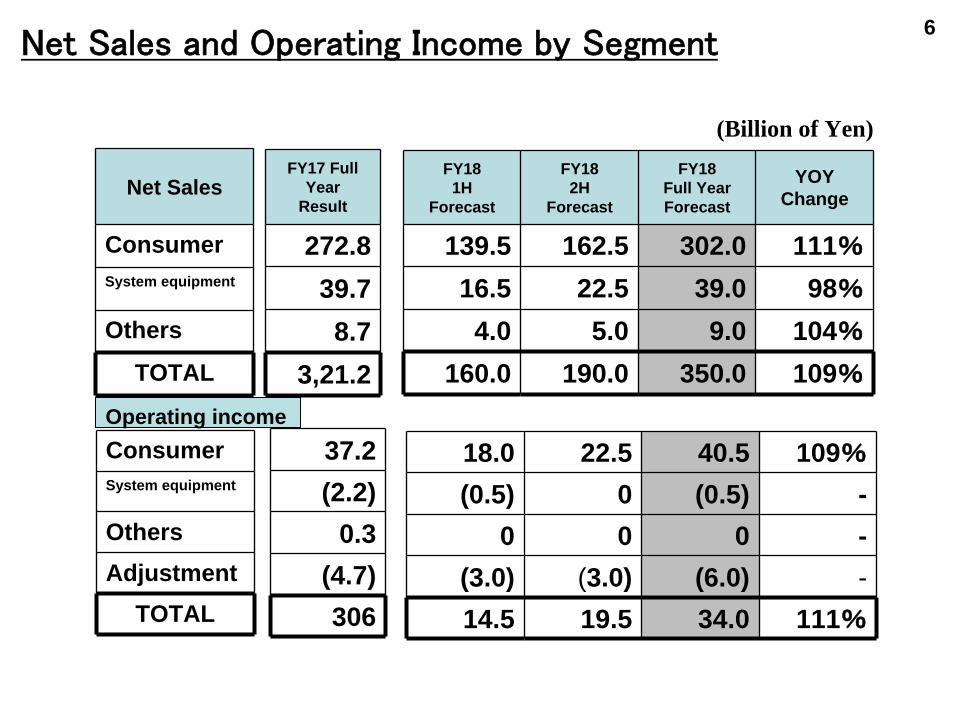
FY17 Full Year
Result
272.839.78.7
3,21.2
FY181H
Forecast
FY182H
Forecast
FY18Full Year Forecast
YOYChange
139.5 162.5 302.0 111%
16.5 22.5 39.0 98%
4.0 5.0 9.0 104%
160.0 190.0 350.0 109%
Net Sales
ConsumerSystem equipment
Others
TOTAL
ConsumerSystem equipment
OthersAdjustment
TOTAL
6
37.2(2.2)
0.3(4.7)306
18.0 22.5 40.5 109%
(0.5) 0 (0.5) -0 0 0 -
(3.0) (3.0) (6.0) -14.5 19.5 34.0 111%
Net Sales and Operating Income by Segment
(Billion of Yen)
Operating income
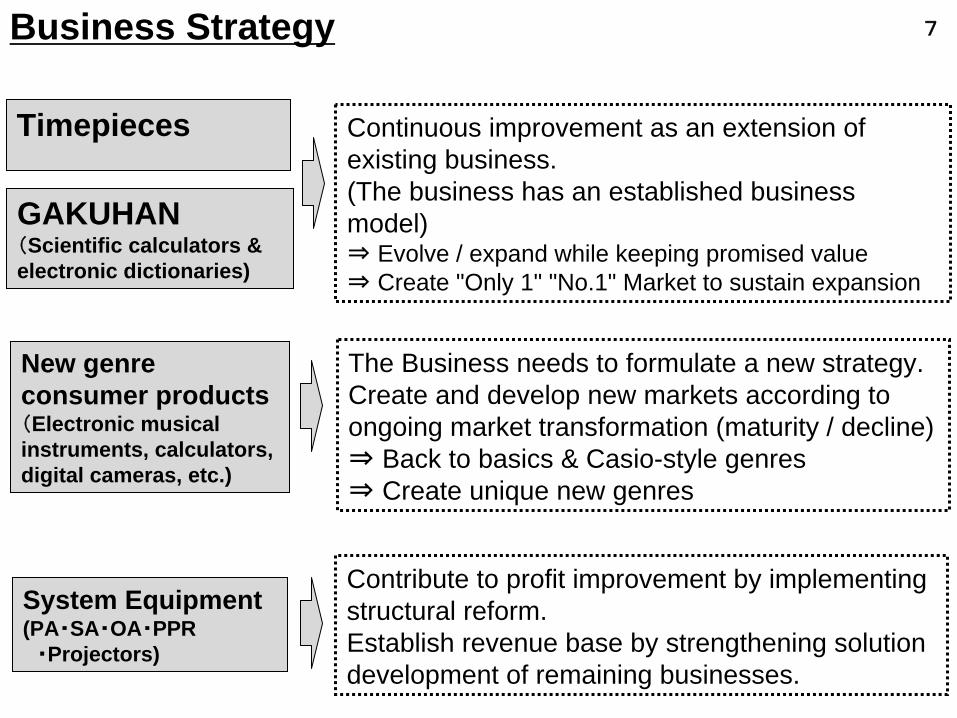
Business Strategy
Timepieces
GAKUHAN(Scientific calculators & electronic dictionaries)
New genre consumer products (Electronic musical instruments, calculators, digital cameras, etc.)
Continuous improvement as an extension of existing business.(The business has an established business model)⇒ Evolve / expand while keeping promised value ⇒ Create "Only 1" "No.1" Market to sustain expansion
The Business needs to formulate a new strategy.Create and develop new markets according to ongoing market transformation (maturity / decline)⇒ Back to basics & Casio-style genres⇒ Create unique new genres
7
System Equipment(PA・SA・OA・PPR
・Projectors)
Contribute to profit improvement by implementing structural reform.Establish revenue base by strengthening solution development of remaining businesses.
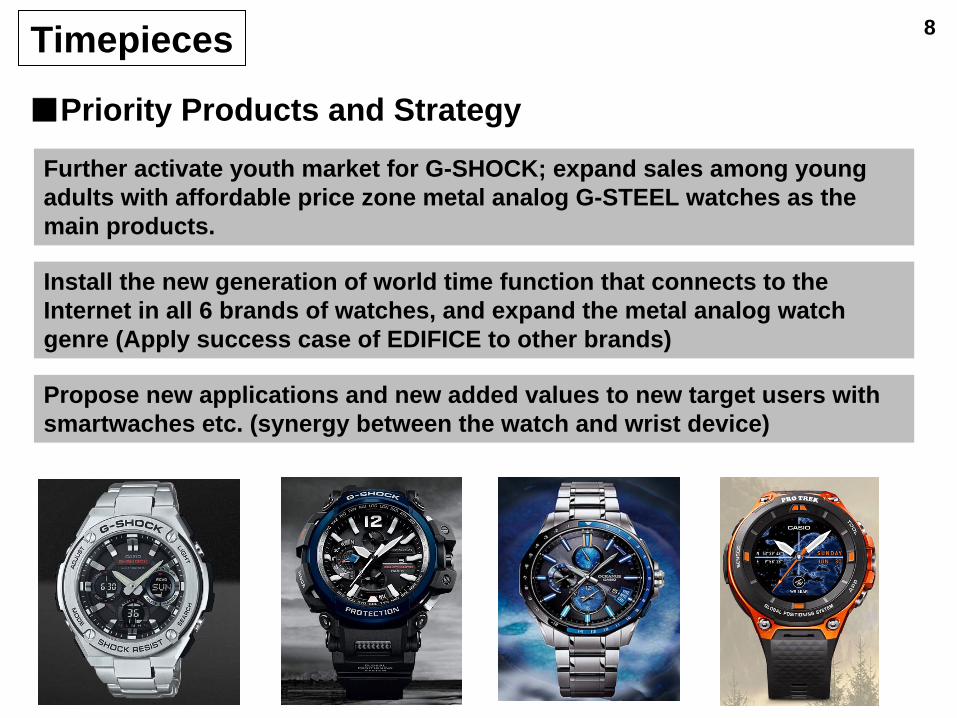
Install the new generation of world time function that connects to the Internet in all 6 brands of watches, and expand the metal analog watch genre (Apply success case of EDIFICE to other brands)
Further activate youth market for G-SHOCK; expand sales among young adults with affordable price zone metal analog G-STEEL watches as the main products.
■Priority Products and Strategy
8
Propose new applications and new added values to new target users with smartwaches etc. (synergy between the watch and wrist device)
Timepieces
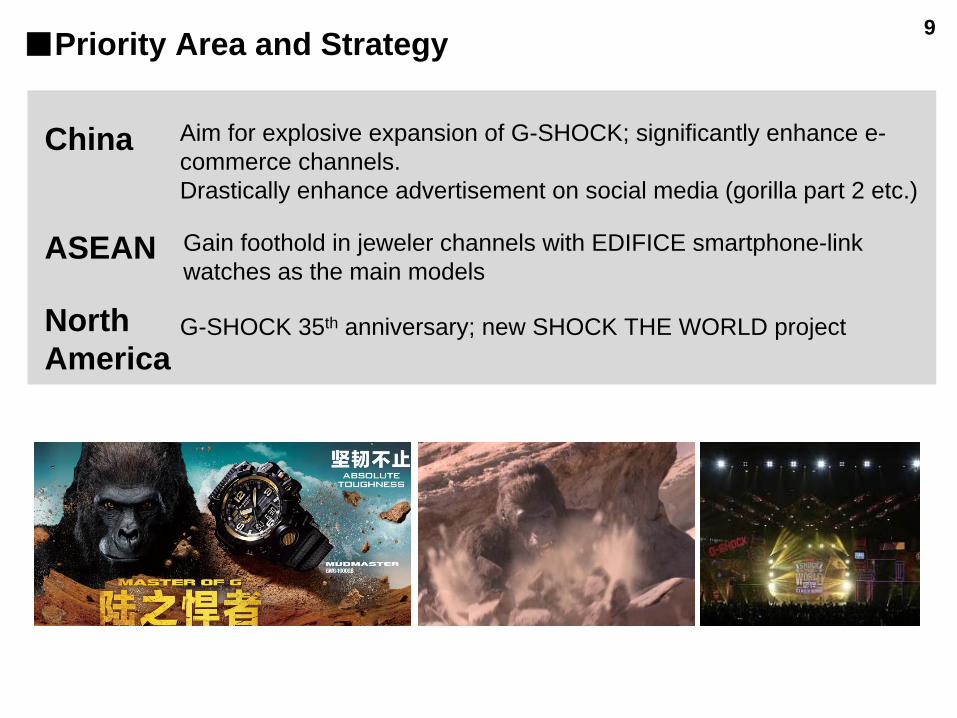
China
■Priority Area and Strategy 9
Aim for explosive expansion of G-SHOCK; significantly enhance e- commerce channels.Drastically enhance advertisement on social media (gorilla part 2 etc.)
ASEAN Gain foothold in jeweler channels with EDIFICE smartphone-link watches as the main models
North America
G-SHOCK 35th anniversary; new SHOCK THE WORLD project

GAKUHAN Business(Scientific Calculators and Electronic Dictionaries)
■ Powerful development of the GAKUHAN structure (unique mechanism of annual students purchase)
■ Strengthen sustainable and stable business by GAKUHAN throughout the world and cultivate new markets
■ Every year, new students sustainably & stably purchase these products as essential items of their study
10
11
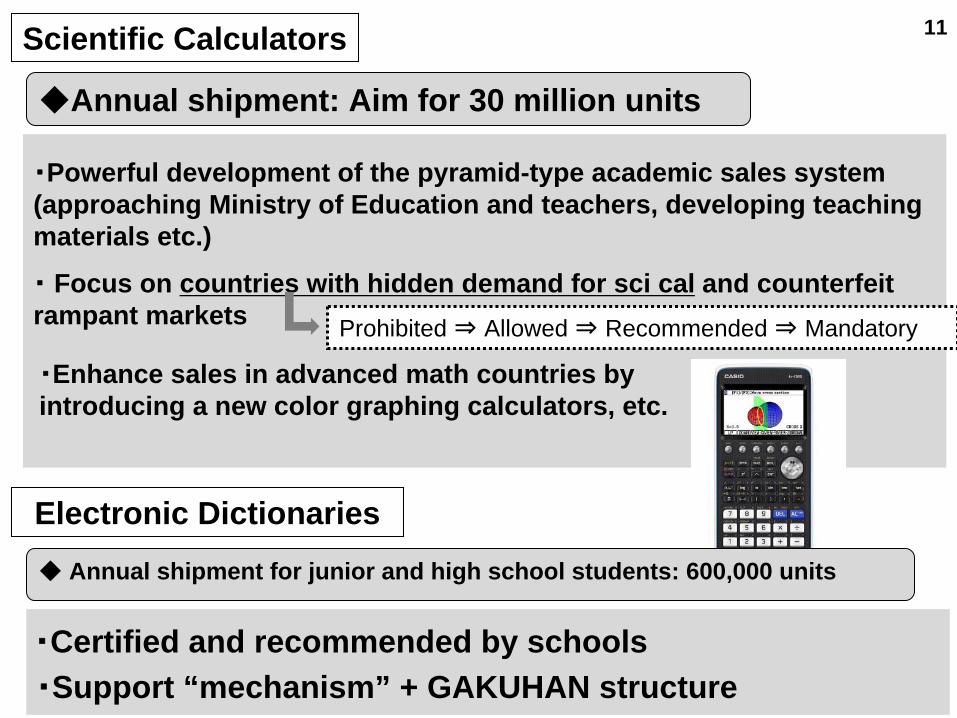
・Powerful development of the pyramid-type academic sales system (approaching Ministry of Education and teachers, developing teaching materials etc.)
・
Focus on countries with hidden demand for sci cal and counterfeit
rampant markets
・Enhance sales in advanced math countries by introducing a new color graphing calculators, etc.
Scientific Calculators
Prohibited ⇒ Allowed ⇒ Recommended ⇒ Mandatory
◆Annual shipment: Aim for 30 million units
Electronic Dictionaries
・Certified and recommended by schools・Support “mechanism” + GAKUHAN structure
◆ Annual shipment for junior and high school students: 600,000 units
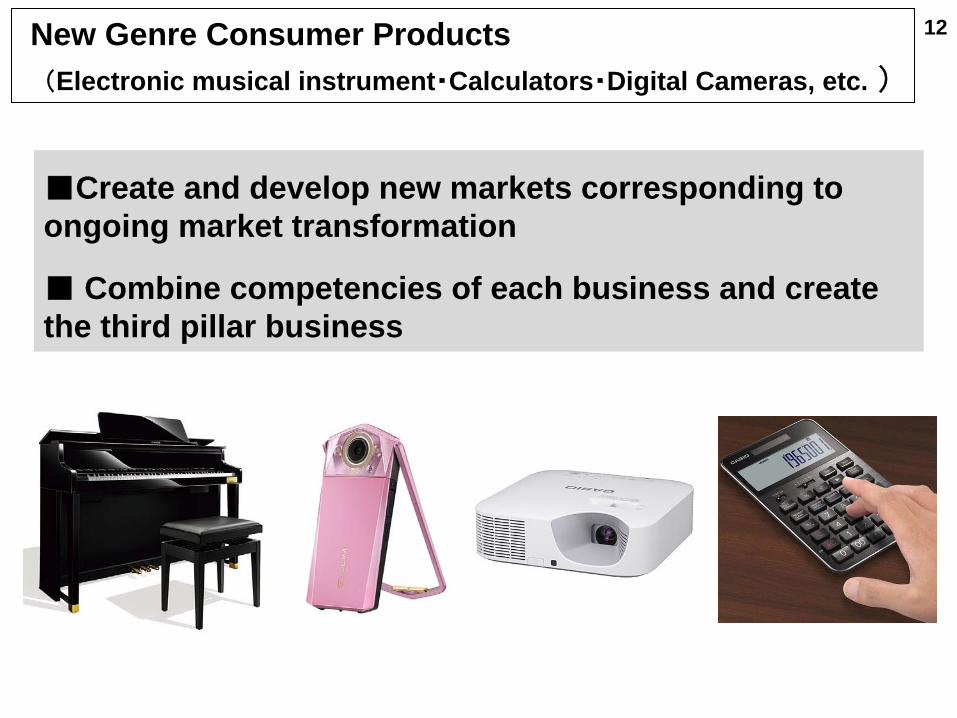
New Genre Consumer Products(Electronic musical instrument・Calculators・Digital Cameras, etc. )
■Create and develop new markets corresponding to ongoing market transformation
■ Combine competencies of each business and create the third pillar business
12
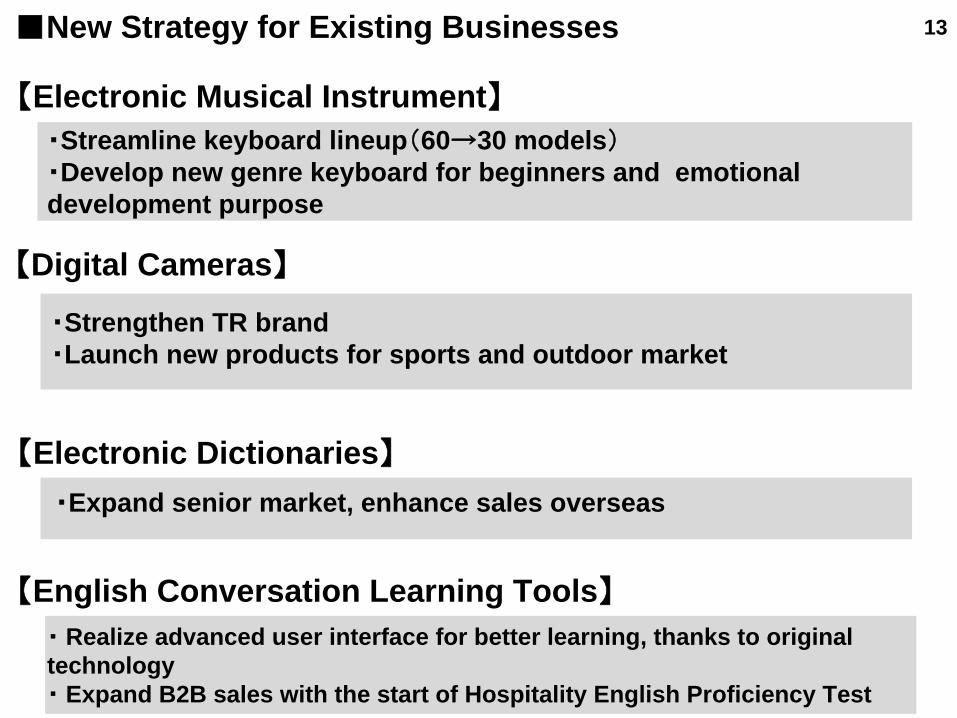
【Electronic Musical Instrument】・Streamline keyboard lineup(60→30 models)・Develop new genre keyboard for beginners and emotional development purpose
【Digital Cameras】
・Strengthen TR brand・Launch new products for sports and outdoor market
13■New Strategy for Existing Businesses
【Electronic Dictionaries】
・Expand senior market, enhance sales overseas
【English Conversation Learning Tools】
・
Realize advanced user interface for better learning, thanks to original
technology・
Expand B2B sales with the start of Hospitality English Proficiency Test

14■ Combine competencies of Digital Camera, Electronic Musical Instrument, and Projector businesses to create the third pillar business
・Merging competencies
・Camera module・Image processing module・Sensor module・Laser and LED hybrid light source module・Sound module
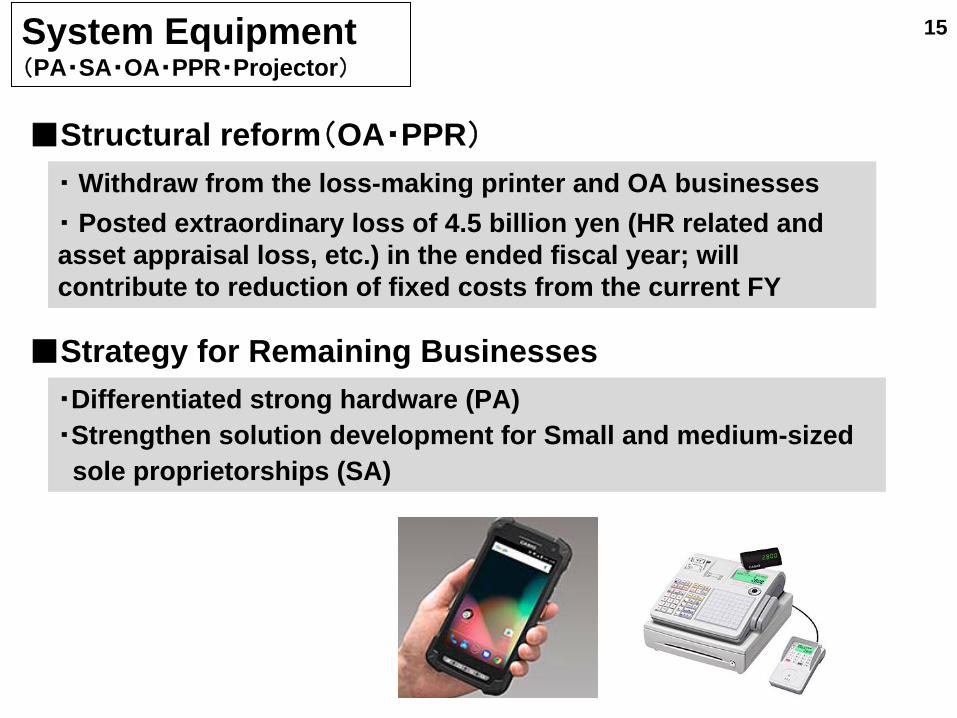
・Differentiated strong hardware (PA)・Strengthen solution development for Small and medium-sizedsole proprietorships (SA)
15System Equipment(PA・SA・OA・PPR・Projector)
■Structural reform(OA・PPR)
・
Withdraw from the loss-making printer and OA businesses
・
Posted extraordinary loss of 4.5 billion yen (HR related and
asset appraisal loss, etc.) in the ended fiscal year; will contribute to reduction of fixed costs from the current FY
■Strategy for Remaining Businesses
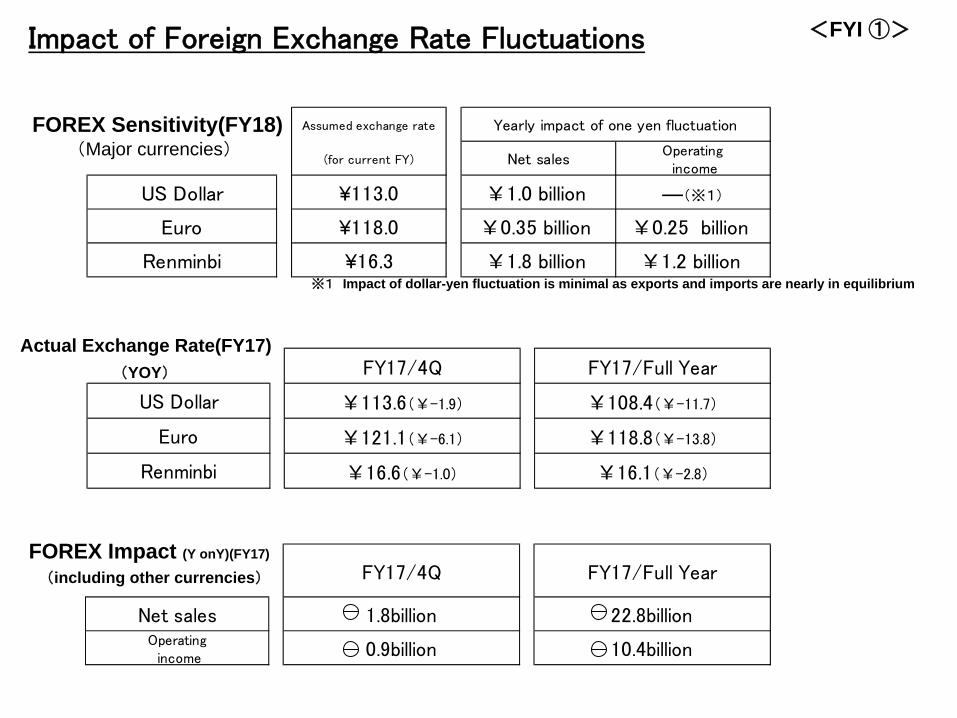
※1
Impact of dollar-yen fluctuation is minimal as exports and imports are nearly in equilibrium
FY17/4Q FY17/Full Year
1.8billion 22.8billion
0.9billion 10.4billion
Net salesOperating income
FY17/4Q FY17/Full Year
¥113.6(¥-1.9) ¥108.4(¥-11.7)
¥121.1(¥-6.1) ¥118.8(¥-13.8)
¥16.6(¥-1.0) ¥16.1(¥-2.8)
US Dollar
Euro
Renminbi
Assumed exchange rate
(for current FY) Net salesOperating
income
¥113.0 ¥1.0 billion ―(※1)
¥118.0 ¥0.35 billion ¥0.25 billion
¥16.3 ¥1.8 billion ¥1.2 billion Renminbi
Yearly impact of one yen fluctuation
US Dollar
Euro
<FYI ①>
FOREX Sensitivity(FY18)(Major currencies)
FOREX Impact (Y onY)(FY17)
Actual Exchange Rate(FY17)
(including other currencies)
(YOY)
Impact of Foreign Exchange Rate Fluctuations
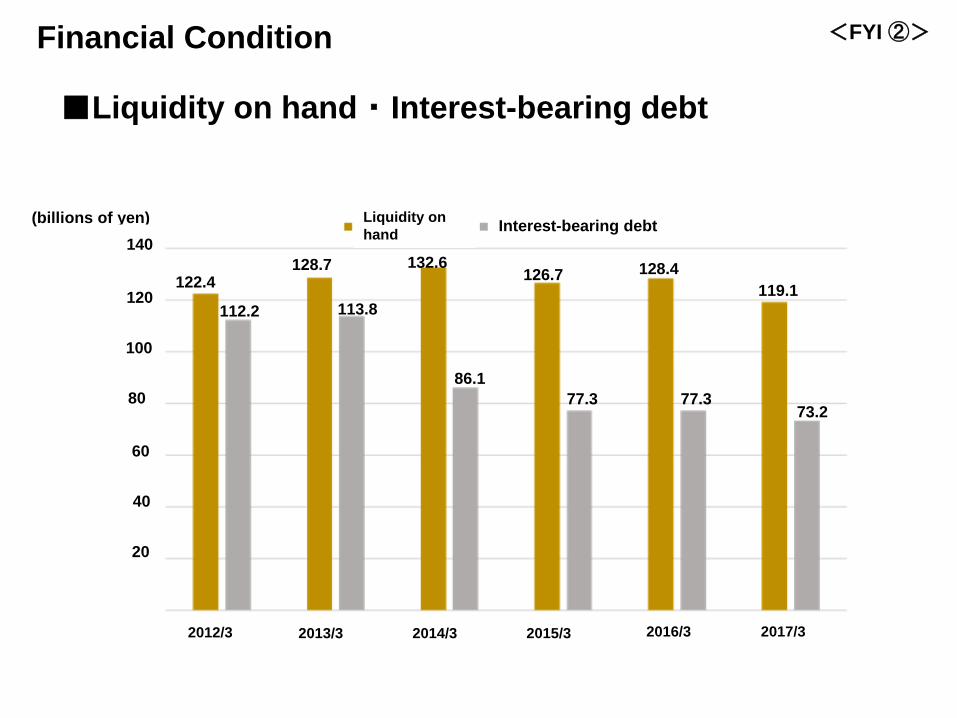
122.4
112.2
128.7
113.8
132.6
86.1
126.7
77.3
128.4
77.3
119.1
73.2
■Liquidity on hand ・
Interest-bearing debt
Financial Condition
(billions of yen)140
120
100
80
60
40
20
2012/3 2013/3 2014/3 2015/3 2016/3 2017/3
<FYI ②>
Liquidity on hand Interest-bearing debt
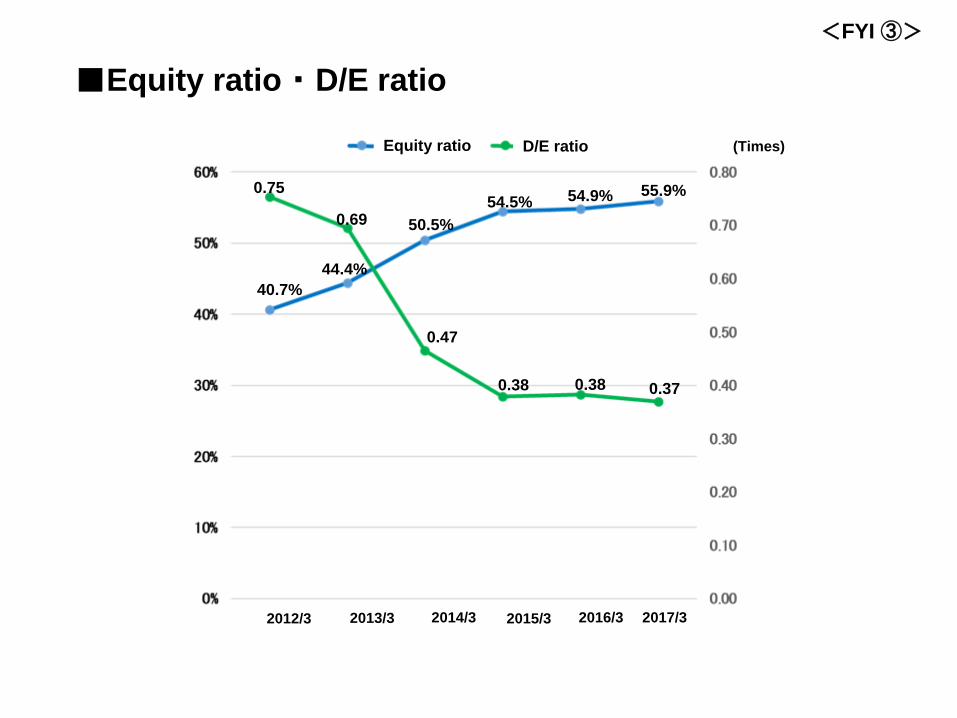
2012/3 2013/3 2014/3 2015/3 2016/3
40.7%
0.75
44.4%
50.5%54.5% 54.9%
0.69
0.47
0.38 0.38
2017/3
0.37
55.9%
■Equity ratio ・
D/E ratio
Equity ratio D/E ratio (Times)
<FYI ③>
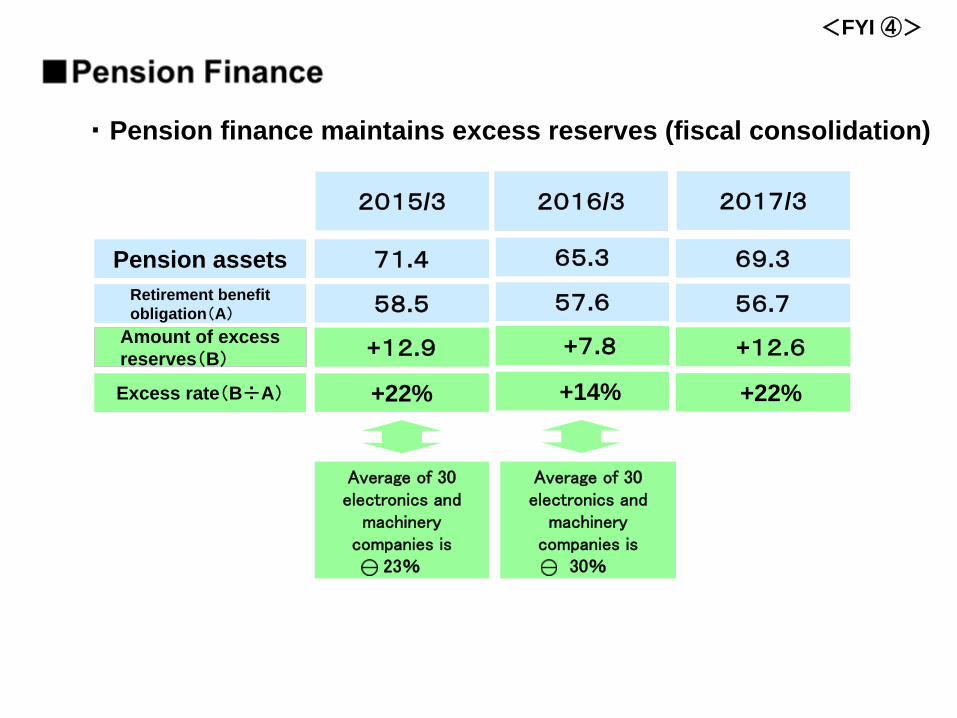
Pension assets 65.3 69.3Retirement benefit obligation(A)
57.6 56.7
為替前提2016/3 2017/3
71.4
58.5
2015/3
積立超過額(B) +78億円 +99億円+129億円
・
Pension finance maintains excess reserves (fiscal consolidation)
Amount of excess reserves(B)
+7.8 +12.6+12.9
Excess rate(B÷A) +14% +22%+22%
Average of 30 electronics and
machinery companies is
23%
Average of 30 electronics and
machinery companies is
30%
<FYI ④>
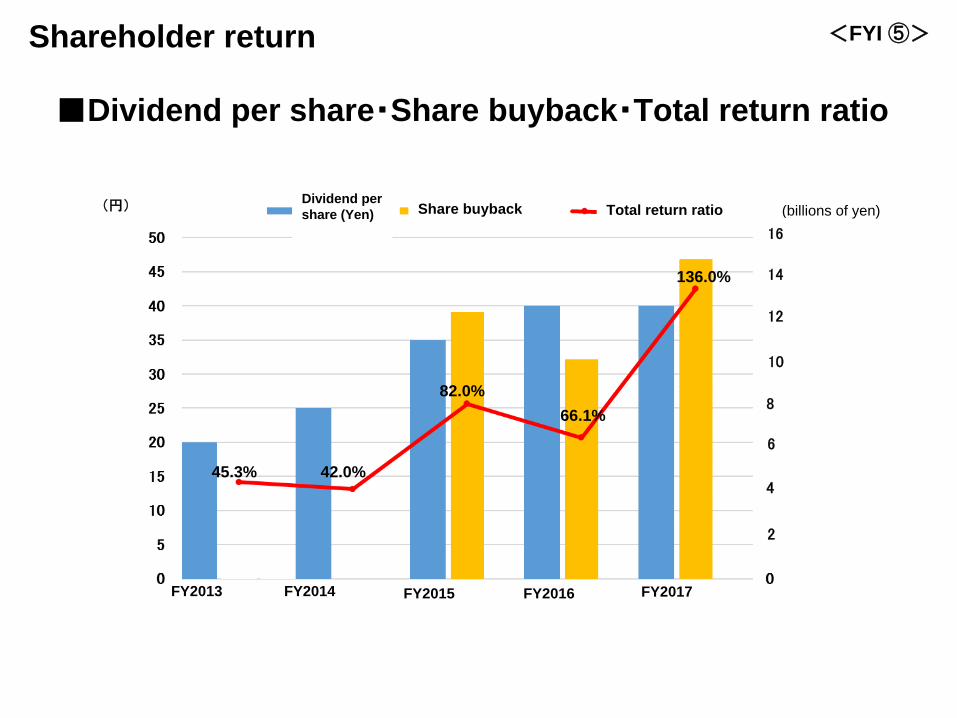
45.3% 42.0%
82.0%66.1%
(円)
136.0%
Shareholder return
■Dividend per share・Share buyback・Total return ratio
Dividend per share (Yen) Share buyback Total return ratio (billions of yen)
16
14
12
10
8
6
4
2
<FYI ⑤>
FY2013 FY2014 FY2015 FY2016 FY2017

END