Embed Size (px)
Citation preview

Trends in private equity investment (2020)
knig
htfra
nk.c
o.in
/res
earc
hInvestments in Real Estate

www.knightfrank.co.in/research
Mumbai HOKnight Frank (India) Pvt. Ltd.Paville House, Near Twin Towers,Off. Veer Savarkar Marg, Prabhadevi, Mumbai 400 025, IndiaTel: 022 6745 0101 / 4928 0101;
BengaluruKnight Frank (India) Pvt. Ltd.204 & 205, 2nd Floor, Embassy Square, #148 Infantry Road, Bengaluru 560001, IndiaTel: 080 40732600 / 22385515
PuneKnight Frank (India) Pvt. Ltd.Unit No.701, Level 7, Pentagon Towers P4, Magarpatta City, Hadapsar,Pune 411 013, IndiaTel: 020 67491500 / 30188500;
ChennaiKnight Frank (India) Pvt. Ltd.1st Floor, Centre block, Sunny Side, 8/17, Shafee Mohammed Road, Nungambakkam, Chennai 600 006, IndiaTel: 044 4296 9000
GurgaonKnight Frank (India) Pvt. Ltd.Office Address: 1505-1508, 15th Floor, Tower B,Signature Towers South City 1,Gurgaon 122 001, IndiaTel: 0124 4782700;
HyderabadKnight Frank (India) Pvt. Ltd.SLN Terminus, Office No. 06-01, 5th Floor, Survey No. 133, Gachibowli, Hyderabad – 500032, IndiaTel: 040 44554141;
KolkataKnight Frank (India) Pvt. Ltd.PS Srijan Corporate Park Unit Number – 1202A, 12th Floor,Block – EP & GP, Plot Number - GP 2,Sector – V, Salt Lake, Kolkata 700 091, IndiaTel: 033 66521000
Ahmedabad Knight Frank (India) Pvt. Ltd.Unit Nos. 407 & 408, Block ‘C’, The First,B/H Keshav Baugh Party Plot, Vastrapur, Ahmedabad – 380015Tel: 079 48940259/ 40380259

C O N T E N T S
Fragility in Indian financing ecosystem
PE investments in retail
PE Investments in Indian real estate
PE investments in residential
PE investments in warehousing
PE investments in office
1
5
2 3
64
Page no.......................... 06
Page no.......................... 25
Page no.......................... 08 Page no.......................... 12
Page no.......................... 30Page no.......................... 16

I N V E S T M E N T S I N R E A L E S TAT E
4
I N V E S T M E N T S I N R E A L E S TAT E
5
E X E C U T I V E S U M M A R Y
The term VUCA - volatile, uncertain, complex and ambiguous - has been common parlance post the 2008 Global Financial
Crisis (GFC). Events such as the taper tantrum, Eurozone crisis, Brexit and Fed rate hikes warranted its use during the
corresponding period. However, if we were to juxtapose those events with the COVID-19 pandemic, then the COVID-19 crisis
would dwarf them all. None of the crisis including the dreadful 2008 GFC, has ever brought the entire world to a standstill
and restricted movement of people the way COVID-19 has done.
The COVID-19 pandemic has affected almost all businesses without
exception, as most major economies have had to adopt a national
lockdown to tackle the crisis. Economists across the globe have
predicted a global recession in 2020 and expect it to be far more severe
than 2008. Valuations across asset classes and businesses are expected
to plummet in 2020.
In the past decade, India has taken repeated hits to its beleaguered
financial system, and in 2020 the nation narrowly avoided a systemic
collapse and financial meltdown by the bailing out of Yes Bank. The
COVID-19 crisis could not have come at a worse time for India. The
nation has adopted one of the most stringent lockdown measures
globally and hence the economic impact is expected to be acute.
While the financial system of India, from banks to Non-Banking
Financial Companies (NBFCs) have had their share of problems in the
previous decade, private equity (PE) had emerged as a major source of
capital for the real estate sector attracting investments of over USD 45
billion from 2011 till date (May 2020). The residential segments were
performing exceptionally well during the initial half of the decade and
commercial segments saw pick up in the second half.
The saga of Indian real estate sector in the last decade has been
similar to A Tale of Two Cities, where the residential segment has gone
downhill while the commercial segment (office, retail and warehousing)
has enjoyed some of its best years in terms of demand and investments
in the same period.
India’s office market has grown by leaps and bounds in the last decade
and is at its peak – with 6 out of 8 Indian cities featuring on the list
of top 10 cities in the Asia Pacific (APAC) region based on annual
transaction volumes in 2019 and finding a place ahead of cities such
as Beijing, Singapore, Kuala Lumpur, Hong Kong, etc. Some of the
Indian cities have very low single digit vacancy levels and have been
witnessing strong double digit growth in rentals in recent years, which
has allured investors. The strong demand of Indian office space in the
recent years was majorly driven by companies in IT/ITeS and BPO/KPO
sectors and also by co-working players. The vast availability of Science,
Technology, Engineering and Mathematics (STEM) talent pool and
the associated cost arbitrage make India an attractive destination for
companies to have their off-shore units in. Strong PE investments of
over USD 13.6 billion are a testament to the strong fundamentals of the
India office market. While work from home will pose a serious threat to
demand for office space in the post COVID-19 era, the enforcement of
GDPR norms globally would acts as a major hindrance to this transition.
The low per-capita availability of malls across cities, favorable
demographics, rise in disposable incomes, rising consumer demand
and the transformation of malls into a modern entertainment and
destination centre make a strong case for growth in retail revenues
in malls. 2019 was the best year for PE investments in retail with the
investment volumes touching a historic high of USD 922 million.
Propelled by reforms such as granting infrastructure status to the
logistics industry including warehousing, implementation of GST,
development of multimodal corridor and many more, the warehousing
sector in India has reached its inflection point. Identifying the potential
for growth investors have committed equity investments of over USD
6.5 billion since 2017, which is the second highest after office in that
period. Though COVID-19 has cast it shadow on the warehousing sector
in the first 5 months of 2020, however, the pandemic is likely to have
a positive impact on warehousing due to a significant shift in supply
chain management methods and renewed growth of e-commerce.
The COVID-19 pandemic has brought all businesses across the globe
back to the ground level. It would be interesting to assess the flow of
private equity (PE) capital in Indian real estate in the next 12-15 months.
For private equity capital, as the flow of money is not restricted by any
border, the capital chases the asset class or country offering the highest
risk adjusted returns. This report assesses the flow of PE in Indian real
estate in the last decade and throws light upon how things would pan
out in the near term (next 12 months).
I N V E S T M E N T S I N R E A L E S TAT E
6
F R A G I L I T Y I N T H E I N D I A N F I N A N C I N G E C O S Y S T E M
The Indian banking sector has been undergoing a painstakingly long and overdue clean-up process since 2014. The
measures adopted by the Reserve Bank of India (RBI) along with the Government of India (GOI) has ensured that banks
identify NPAs, make sufficient provisions, write-off bad debts, initiate the process of recovery/liquidation and improve their
lending standards. The Insolvency and Bankruptcy Code (IBC) 2016 and the pumping of INR 2.5 lakh crore (INR 2.5 trillion)
into public sector banks were some of the major steps taken in this direction.

I N V E S T M E N T S I N R E A L E S TAT E
7
While banks were busy undergoing a rigorous NPA clean-up process,
the Non-Banking Financial Companies (NBFCs) which include Housing
Finance Companies (HFCs) went from a cycle of boom to bust in the
same period. The NBFCs had jumped at the lending opportunity that
emerged due to banks going soft to clean up their books. They had
started lending aggressively and often to high risk segments. Due
to the lower regulatory supervision and lower lending restrictions
as compared to banks, the NBFCs could also lend to unorganized
segments which form a large share of India’s economy and are not
catered to by banks. The market opportunity both in organized as well
as unorganized segments was huge. Within a short span of time, the
NBFCs became an important pillar for financing India’s consumption
growth. They financed a gamut of activities from individual
aspirational purchases to sectors that needed long term financing like
real estate and infrastructure. To expand their margins along with
rapid growth in topline, a large number of NBFCs adopted the model of
borrowing short term and lending long term without paying much heed
to the asset-liability mismatch which was building up in their books.
They were able to roll over the short-term debt but fell victim to the
fallacy that they could continue operating in this manner.
The bull run of NBFCs culminated with the IL&FS default in September
2018. With this, investors lost confidence in the business model
of NBFCs, and as a result, the cycle of rolling over short term debt
stopped abruptly. The sector has been in turmoil ever since. A few
large NBFCs went out of business while others started to wind down
their operations. India’s GDP growth started to go downhill and the
country recorded its lowest growth rate in 6 years during the quarter of
December 2019.
After the IL&FS default in 2018, fissures in the financial system were
seen again towards the start of 2020 with Yes Bank - one of the top
5 private banks in India - coming to the brink of collapse. However,
proactive action by the Reserve Bank which got the State Bank of
India (SBI), along with other banks to bail out Yes Bank helped avert
a financial disaster. The bailout was successful and it helped calm
investors’ nerves and the nation avoided a financial meltdown.
Even as the Indian economy was recovering from these back-to-back
hits on its financial system, the COVID-19 pandemic erupted. In order
to tackle this new threat, the Government introduced one of the most
stringent lockdown measures seen globally, with most businesses
coming to a complete standstill for over 65 days from March 25th to
May 31st. Due to the lockdown, many companies have resorted to salary
cuts, deferred wages, freezed hiring and halted all expansion plans to
tide over the crisis and conserve cash.
While it is too early to estimate the damage to economy due to the
lockdown, it is definitely going to result in job losses, pay cuts and a
huge slowdown in demand across industries. Many businesses will be
pushed to the verge of bankruptcy and will find it difficult to honor
their debt obligations. Therefore, the NPA mess in the Indian banking
system which was showing early signs of abating is likely to remain.
As per RBI’s Financial Stability Report (FSB) released in December
2019, the NPAs in the Indian banking system is expected to touch 9.9%
by September 2020 in the worst case scenario projections. However,
this forecast did not take into account the COVID-19 impact and the
eventual figure may be higher. Such a situation would erode the capital
buffers of several financial institutions and cripple the beleaguered
financial system.
2020 will be a challenging year for India. Several rating agencies and
banks have cut India’s GDP growth forecast for FY21 and expect the
country’s growth to contract in FY21. With the economy coming under
severe stress, the financial institutions may not be in a position to
provide the requisite capital required to support growth.

I N V E S T M E N T S I N R E A L E S TAT E
8
P E I N V E S T M E N T S I N I N D I A N R E A L E S T A T E
The Indian real estate sector was earlier perceived by global investors as developing in terms of quality of assets across
segments. However, several developments have changed this perception. Some of the biggest path-breaking reforms in
real estate became a reality in the past few years which include the Real Estate (Regulation and Development) Act, 2016
(RERA), the Benami Transactions (Prohibition) Amendment Act, 2016, infrastructure status to affordable housing projects,
demonetization, relaxation of norms to encourage Real Estate Investment Trust (REIT) listings, and the Goods and Services
Tax (GST). These reforms collectively set a new order, changed perceptions and led to a reduction of the associated risk
premiums. This was reflected in the investments in real estate which has been on an upswing after 2014.

I N V E S T M E N T S I N R E A L E S TAT E
9
• The Indian real estate sector has attracted over USD 45 billion of
private equity capital in the last decade from the start of 2011 till
date. About 80% of this amount was invested over the past five
years, i.e. 2015–19 when the reforms started coming in.
• The PE investments in real estate peaked at USD 8.8 billion (bn) in
2018 which had been the best year for real estate in the previous
decade. In 2019, the investments declined by 23% YoY to USD
6.8 bn. This decline is primarily attributable to the decline in
investments in residential and office. While the residential sector
has been passing through tumultuous times, dearth of mature
assets has led to a decline in investments in office.
• In 2020 (YTD), the investor activity dropped sharply with only 5
deals getting concluded, adding up to a meagre USD 238 million
and dropping by 93% YoY compared to USD 3.4 billion during
same time period last year. The drop can be attributed to both the
COVID-19 pandemic which impacted investor sentiments as well as
the slowdown of the Indian economy in 2019.
Chart 1: PE investments across debt and equity in Indian real estate
Amount invested (USD mn) Number of deals
Source: Knight Frank Research, Venture intelligence
Note: 1. Private equity includes real estate funds, pure private equity funds, sector
focused funds, pension funds, sovereign funds and Alternate Investment Funds (AIF).
2. YTD 2020 represents investments till 31st May 2020
• The COVID-19 outbreak started in Wuhan in China during
November 2019 and started spreading first within China and then
to other countries. Many investors who had invested in China
took a big hit on their real estate portfolio as their tenants started
demanding rent free periods and other concessions to mitigate the
COVID-19 impact. While the COVID-19 induced lockdown in India
started towards the end of Q1 2020 (March 25th onwards), investors
expected a similar scenario to play out in India and preferred to go
on a wait-and-watch mode.
• Private equity (PE) by virtue, is risk capital, which is generally
invested in purchasing equity of a company or a project in order to
make the maximum returns from the upside. In India, however, PE
has been scouting for relatively risk-free opportunities like rent-
yielding commercial assets, where the development and occupancy
risks are largely mitigated. Hence, since 2015, the investors took up
equity positions in rent yielding commercial assets (office, retail
and warehousing) and their share in overall investments zoomed
from 2011 to 2019 (refer chart 2) as compared to residential which
involved greater risk.
YTD 2020201920182017201620152014201320122011
3,232
1,404
2,2992,515
5,212
5,841
8,5798,837
6,792
238
81
51
67
9994
84
58 59
49
5
I N V E S T M E N T S I N R E A L E S TAT E
1 0
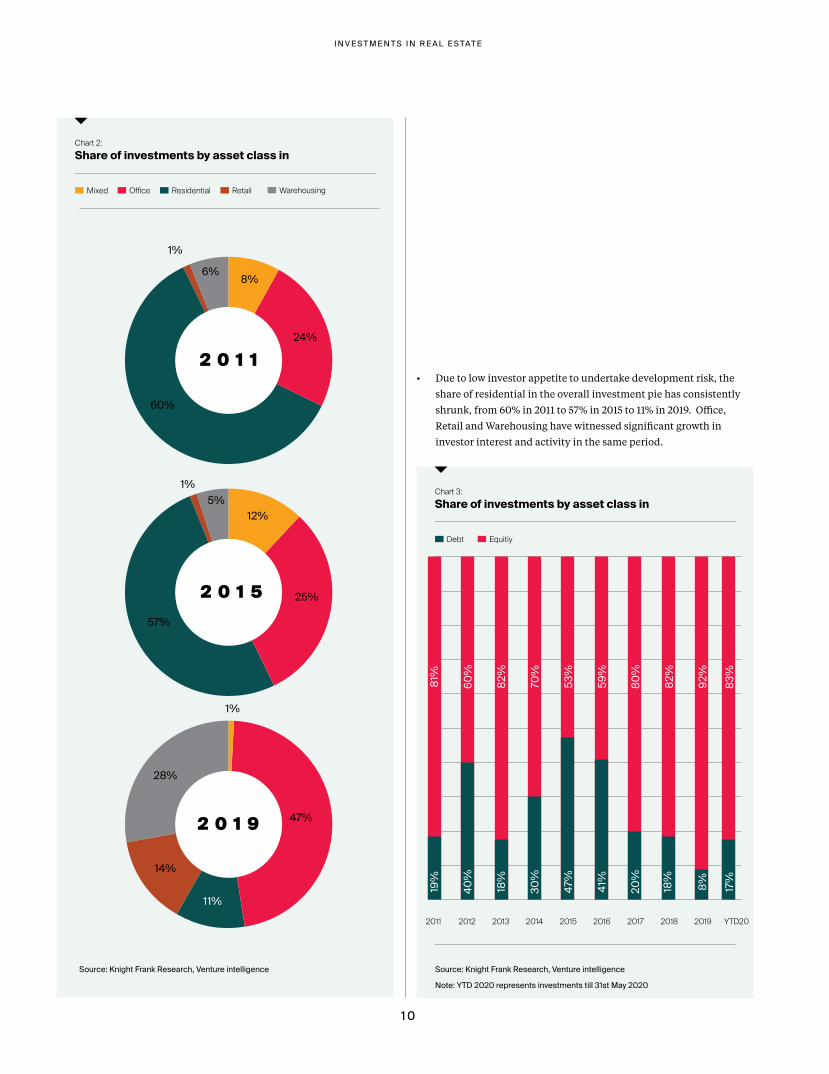
Chart 2: Share of investments by asset class in
Chart 3: Share of investments by asset class in
Mixed
Debt
Office
Equitiy
Residential Retail Warehousing
Source: Knight Frank Research, Venture intelligence Source: Knight Frank Research, Venture intelligence
Note: YTD 2020 represents investments till 31st May 2020
2 0 1 1
2 0 1 5
2 0 1 9
1%
6% 8%
24%
60%
1%
1%
47%
11%
14%
28%
5%12%
25%
57%
• Due to low investor appetite to undertake development risk, the
share of residential in the overall investment pie has consistently
shrunk, from 60% in 2011 to 57% in 2015 to 11% in 2019. Office,
Retail and Warehousing have witnessed significant growth in
investor interest and activity in the same period.
2011 2012 2013 2014 2015 2016 2017 2018 2019 YTD20
19%
40%
18%
30%
47%
41%
20%
18%
8% 17%
81%
60%
82%
70%
53%
59%
80%
82%
92%
83%

I N V E S T M E N T S I N R E A L E S TAT E
1 1
Currently, there is a lot of uncertainty regarding how COVID-19 will impact business and economy. It is not known how long the virus will last or if there will be a second wave, how much time it will take to develop an effective vaccine, what will be the loss in economic activity, etc.
India has enforced one of the most stringent lockdown measures globally to combat the virus outbreak. This makes the uncertainty in case of India even higher.
For PE, the flow of capital is not confined to any particular border and money chases the asset class/country offering the highest risk-adjusted returns globally. The world economy is expected to plunge into recession in 2020 and this will lead to a sharp drop in valuations. This drop would entice investors to scout for opportunities in their home country and other developed nations over emerging markets. As investing in their home country does not entail any currency risk, they would prefer it to investing elsewhere. Further, the sovereign funds and pension funds, which were actively invested in India in recent years may face pressure from their sponsors to return the capital which has not been deployed. The sponsors want to use this money to give stimulus and for bailouts. Given this backdrop, the private equity activity in Indian real estate is likely to be subdued in 2020.
Outlookfor near term (next 12 months)

I N V E S T M E N T S I N R E A L E S TAT E
1 2
P E I N V E S T M E N T S I N R E S I D E N T I A L
During the early years of the previous decade, the residential sector was the preferred destination of PE investments.
At that time, the residential segment was witnessing a strong sales momentum and prices were appreciating every year,
as demand exceeded supply. However, the tide started to turn towards the end of 2014 as the residential sales started
to decline and prices became stagnant, starting to correct in subsequent periods. As the decade progressed, problems
and flaws in the residential development business became apparent. The reforms which the Government implemented
since 2014, exacerbated the crisis for developers forcing several of them to quit the industry altogether. The last nail in
the coffin for the sector was the liquidity crisis in the NBFC sector which started with the default of IL&FS in September
2018. The decline in PE investments in residential in the later years of the previous decade can be seen as a direct
consequence of these events (chart 4).
I N V E S T M E N T S I N R E A L E S TAT E
1 3
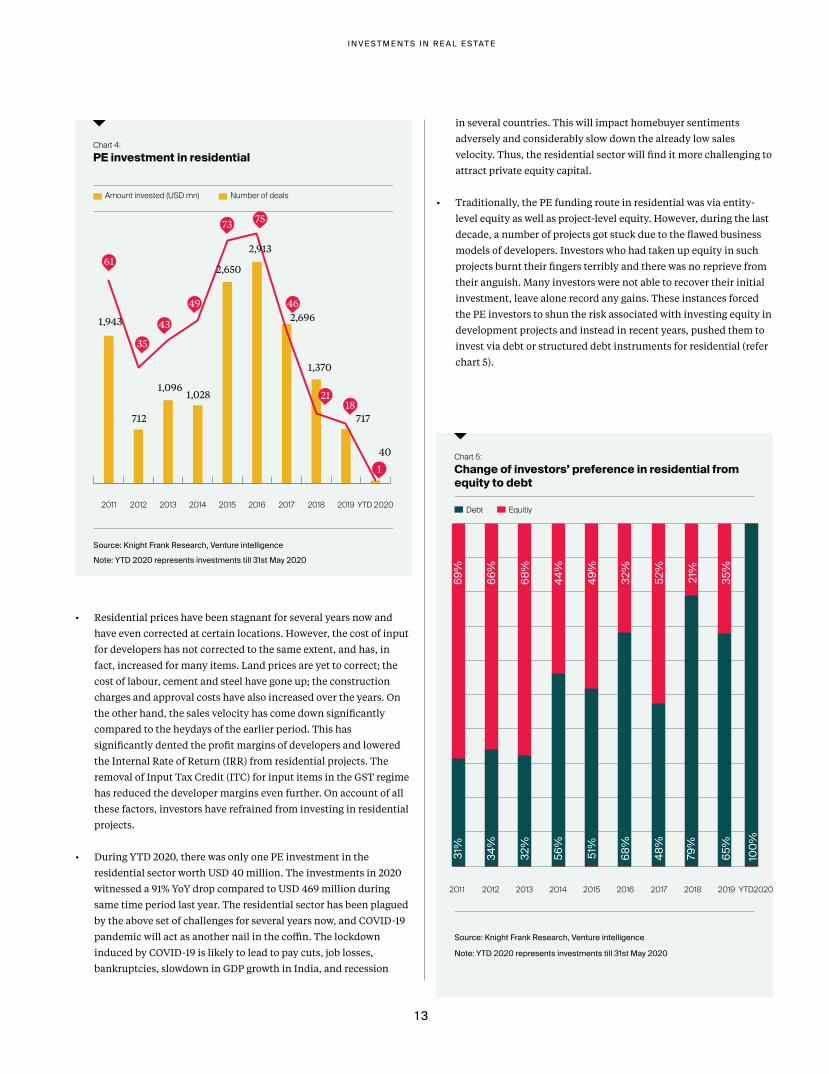
Chart 4: PE investment in residential
Amount invested (USD mn) Number of deals
Source: Knight Frank Research, Venture intelligence
Note: YTD 2020 represents investments till 31st May 2020
• Residential prices have been stagnant for several years now and
have even corrected at certain locations. However, the cost of input
for developers has not corrected to the same extent, and has, in
fact, increased for many items. Land prices are yet to correct; the
cost of labour, cement and steel have gone up; the construction
charges and approval costs have also increased over the years. On
the other hand, the sales velocity has come down significantly
compared to the heydays of the earlier period. This has
significantly dented the profit margins of developers and lowered
the Internal Rate of Return (IRR) from residential projects. The
removal of Input Tax Credit (ITC) for input items in the GST regime
has reduced the developer margins even further. On account of all
these factors, investors have refrained from investing in residential
projects.
• During YTD 2020, there was only one PE investment in the
residential sector worth USD 40 million. The investments in 2020
witnessed a 91% YoY drop compared to USD 469 million during
same time period last year. The residential sector has been plagued
by the above set of challenges for several years now, and COVID-19
pandemic will act as another nail in the coffin. The lockdown
induced by COVID-19 is likely to lead to pay cuts, job losses,
bankruptcies, slowdown in GDP growth in India, and recession
in several countries. This will impact homebuyer sentiments
adversely and considerably slow down the already low sales
velocity. Thus, the residential sector will find it more challenging to
attract private equity capital.
• Traditionally, the PE funding route in residential was via entity-
level equity as well as project-level equity. However, during the last
decade, a number of projects got stuck due to the flawed business
models of developers. Investors who had taken up equity in such
projects burnt their fingers terribly and there was no reprieve from
their anguish. Many investors were not able to recover their initial
investment, leave alone record any gains. These instances forced
the PE investors to shun the risk associated with investing equity in
development projects and instead in recent years, pushed them to
invest via debt or structured debt instruments for residential (refer
chart 5).
Chart 5: Change of investors’ preference in residential from equity to debt
Debt Equitiy
Source: Knight Frank Research, Venture intelligence
Note: YTD 2020 represents investments till 31st May 2020
YTD 2020201920182017201620152014201320122011
1,943
712
1,0961,028
2,650
2,913
2,696
1,370
717
40
61
35
43
49
73 75
46
2118
1
2011 2012 2013 2014 2015 2016 2017 2018 2019
31%
34%
32%
56%
51%
68%
48%
79%
65%
100%
69%
66%
68%
44%
49%
32%
52%
21%
35%
YTD2020

I N V E S T M E N T S I N R E A L E S TAT E
1 4
• Thinking inside the box
There are a few NBFCs that are still willing to lend to real estate.
However, the risk appetite which was witnessed earlier in the
pre-IL&FS days has entirely vanished. The covenants have
become more stringent and they are willing to lend only to
smaller projects with disbursals not exceeding INR 300 - 500
million, provided the track record of the developer is good. The
rationale is to minimize exposure to a particular project and to
make it easier for the lenders to dictate terms to the developer.
Further, the earlier mistake of – the same lender financing project
construction as well as the home buyer - is not being repeated.
• Mega launches no longer possible
There are very few lenders left in the market who have the ability
to write large cheques. The ones who are still capable, are not
willing to take that risk. This is forcing developers to divide their
projects in multiple phases. Further, if a particular phase has
not achieved a good sales position, then the funding for the next
phase is put on hold. This has forced developers to alter their
business models and focus more on getting their product right.
• No or limited refinancing opportunities
Earlier, NBFCs engaged in refinancing loans and other obligations
of developers. This had helped the developers stay afloat in recent
years of slow sales velocity, particularly when sales had slowed
down considerably. Now the refinancing opportunities by NBFCs
have almost dried up making it harder for developers to survive
this carnage.
While this was the situation of NBFCs before the COVID-19
induced lockdown, post the lockdown, the NBFCs themselves
will struggle to survive. RBI, in its March 26, 2020 directive, had
asked all financial institutions to offer a 3 month moratorium on
all term loans. Later the moratorium was again extended by RBI
for 3 months ending August 31st. Following this directive, banks
and NBFCs started offering moratorium to their customers. Many
NBFCs had borrowed from banks for their funding requirements,
but banks were reluctant to extend the same to their NBFC
borrowers. This caused cash flow problems for many NBFCs.
Despite the Supreme Court’s order to the banking regulator to
ensure that all borrowers get the moratorium benefit, the RBI has
left the decision to extend moratorium to particular NBFCs at the
discretion of banks. The banks’ decisions are based on the NBFCs
credit and liquidity profiles.
To help NBFCs tide over the cash flow issues, RBI announced on
April 17, 2020 a 3 year special INR 500 billion Targeted Long Term
Repo (TLTRO) window for banks to lend to NBFCs and Micro
Finance Institutions (MFIs). However, the first tranche of INR
250 billion auction by RBI received a tepid response from banks
with only INR 128 billion or a little over 50% being subscribed.
Banks are associating higher risks with NBFCs and the larger part
of the INR 128 billion was loaned to top rated NBFCs with strong
parental backing (generally a diversified conglomerate). This
special financing window provided by RBI has failed to enthuse
the NBFC sector and their concerns have remained unaddressed.
The finance minister has announced an INR 750 billion special
funding window for NBFCs of which INR 300 billion would be
through investments in debt papers issues by NBFCs in primary
and secondary markets and the other INR 450 billion was in the
form of partial credit guarantee scheme. This will help NBFC
to solve their short term liquidity problem and also bring down
the cost of funds for them. However, more measures need to be
undertaken to ensure this liquidity infusion reaches real estate
sector.
Transformation in how NBFCs lend to residential real estate
The NBFC crisis has cast a long shadow on the Indian real estate sector, particularly on the residential segments as they were heavily reliant on NBFCs for their funding requirements. Very few NBFCs are presently lending to
real estate and the large ones are almost out of the market. In such a scenario, we are witnessing a drastic change in the way that they are lending to real estate.

I N V E S T M E N T S I N R E A L E S TAT E
1 5
The residential sales had already slowed down compared to its heydays, and the demand from homebuyers is expected to dwindle further in 2020. The lockdown is expected to have a devastating effect on the economy with associated pay cuts, job losses and businesses closing down becoming the new order of the day. This will significantly dent homebuyer sentiments. When individuals are not sure about their future stream of income and job situation, the tenacity to make to a big ticket purchase like real estate which involves a long term commitment goes down. Thus, residential sales velocity will slow down significantly in the near term and the recovery in residential segment which has not happened in the past 4 years will get further delayed.
While this is the situation on the demand side, the challenges on the supply side are complex. The residential segment has already started witnessing consolidation, with the non-serious and over-leveraged developers going out of business. This trend is likely to continue as the policy changes have altered the structure of the industry to such an extent that it is impossible to carry out the residential business the way it was done earlier. The NBFC crisis which has left a deep lacuna in real estate funding, is further accentuating this shift.
Earlier, PE for developers came in at the land stage, the NBFCs came in at the approvals stage and the banks came in at the construction stage. Further, in the pre-RERA days, customer advances also acted as a source of finance for all these 3 stages. However, things have changed now as RERA has made it impossible for customer advances to come in before the approval stage. PE funds are not keen on residential and are focusing on the commercial segments, NBFCs do not have the requisite capital to lend to real estate and even if banks are willing to lend to real estate, by regulation they cannot come in before the construction stage. Hence, this gap which was earlier filled in by PE, NBFC and customer advances, now needs to be financed by the developers’ own equity. Very few developers have such deep pockets and going forward, it is the developers with strong balance sheets and who are willing to put in their own equity, are the ones who would be able to carry out this business. Many residential developers will start monetizing their land parcels and rent yielding assets in 2020 to build cash reserves and to strengthen their balance sheets and repay existing obligations. However, the 6 month moratorium extended by RBI would give them some reprieve till August.
Outlookfor near term (next 12 months)

I N V E S T M E N T S I N R E A L E S TAT E
1 6
P E I N V E S T M E N T S I N O F F I C E
The Indian office market has been on a bull run in recent times with leasing volumes touching a new high each
year since 2016 driven by demand from the BFSI, Information Technology (IT) and Co-working sectors. The
performance of office has been in stark contrast to that of residential in the same period. The primary reason for
this is the balanced demand-supply equilibrium in the Indian office market. 2019 was a milestone year for the
Indian office market with the All-India office transaction activity reaching a historic high of 60.6 mn sq ft (5.6 mn
sq m). The PE investors have taken cognizance of the strong fundamentals of the Indian office market and have
invested over USD 13.6 billion as equity investment in the last decade, with a large quantum of USD 9.2 billion (68%)
coming in over the last 3 years (refer chart 6).

I N V E S T M E N T S I N R E A L E S TAT E
1 7
Chart 6: PE investment in office
Amount invested (USD mn) Number of deals
Source: Knight Frank Research, Venture intelligence
Note: YTD 2020 represents investments till 31st May 2020
• After rising from 4 consecutive years, the PE investments in office
asset declined in 2019. This decline was on account of the dearth of
mature office assets. The lack of mature assets is forcing investors
to look at opportunities in under-construction assets and greenfield
developments which garnered 10% and 13% of the investments
respectively (refer chart 7).
• The situation took an adverse turn in the first 5 months of 2020
with only 2 deals concluding amounting to USD 141 million. The
investments reported a drop of 81% YoY compared to USD 757
million invested during same time period last year. The slowdown
in investor activity can be attributed to the COVID-19 impact. The
global recession forecasted for 2020 due to COVID-19 is expected
to affect the demand for office space in near-term. Investors are
waiting for the dust to settle before making any new purchase.
YTD 2020201920182017201620152014201320122011
390 393
926
792
620
1,226
2,168
4,092
2,946
141
5 46
5
64
9
16
20
2
Chart 7: Share of investments since 2011
Source: Knight Frank Research, Venture intelligence
Under-construction
New Devlopment
Ready77%
13%
10%

I N V E S T M E N T S I N R E A L E S TAT E
1 8
• The Indian IT ecosystem has evolved over the last decade from providing traditional coding services to providing
new age services like Artificial Intelligence (AI), machine learning and data analytics. Such services command a
premium and are more remunerative, thereby increasing the rent paying ability of IT companies. While the BFSI
industry within India has been growing at a considerable pace, it is the demand from global BFSI companies for
their offshore centers or Knowledge/Business Process Outsourcing (KPO/BPO) units aka Global In-house Centres
(GICs) that is majorly driving demand for office space in the BFSI segments. The depreciation of rupee will further
aid this cause and stimulate the shift of more such offshoring units to India which would boost the office demand.
• As per Nasscom study in 2017, there are around 1,100 GICs in India and their numbers have just grown over the
years. The availability of vast talent in India in the fields of Science, Technology, Engineering and Mathematics
(STEM) and the cost arbitrage makes India one of the most attractive destinations for companies in the BFSI and
IT sectors. In addition to this, the emergence of co-working as a major occupier segment has given a fillip to the
overall demand for office space in the recent years.
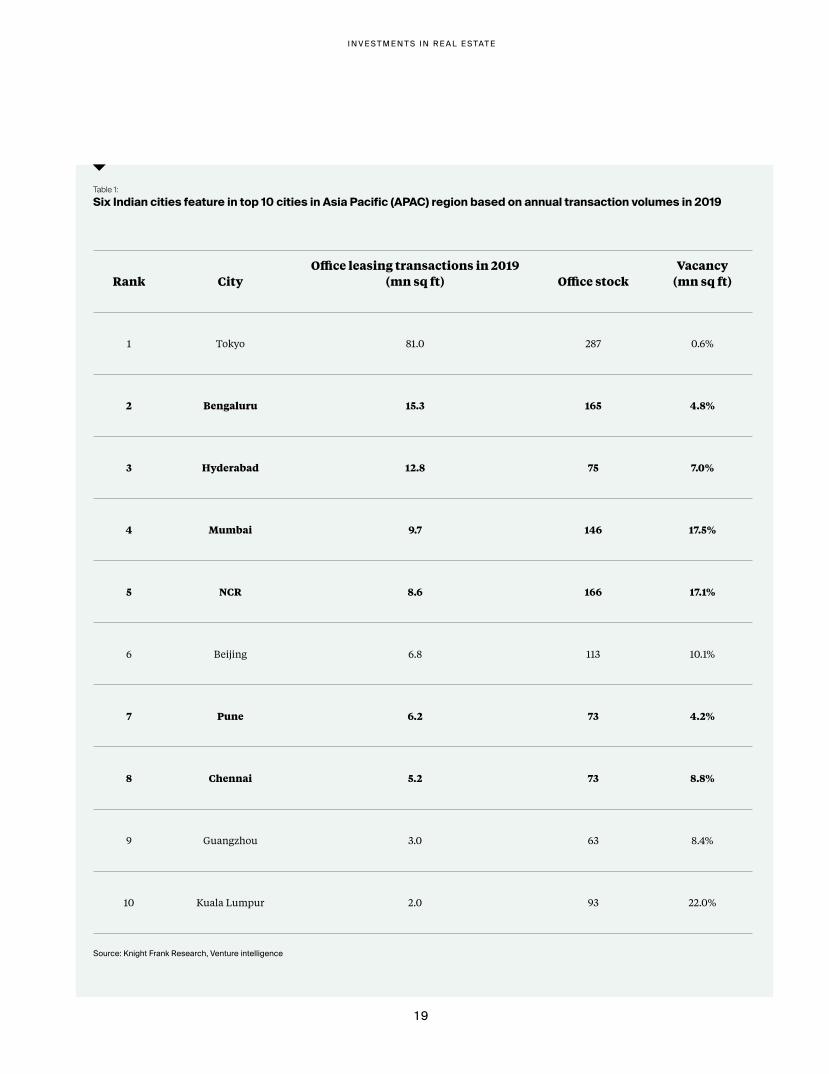
• Some of the Indian cities have stepped up and stolen the limelight from other cities in the Asia-Pacific (APAC)
region. 6 out of the top 8 Indian cities feature in the top 10 markets in terms of annual leasing transaction
volumes in the APAC region (refer table) in 2019. Bengaluru and Hyderabad were the second and third largest
office markets in APAC region in terms of office leasing transactions in 2019 followed by Mumbai and NCR, and
feature ahead of cities such as Beijing, Shanghai, Singapore, Jakarta and several others in the APAC region. The
low vacancy rates in these cities coupled with the double digit rental growth has further allured investors.
Strong fundamentals of Indian office market
In the short-term, investors would prefer to wait till the pandemic comes under control and would also look to gauge the impact of forecasted recession on office space demand in 2020 before
investing. However, these factors would not undermine the strong fundamentals of Indian office market for long due to the following reasons:
I N V E S T M E N T S I N R E A L E S TAT E
1 9
Table 1: Six Indian cities feature in top 10 cities in Asia Pacific (APAC) region based on annual transaction volumes in 2019
Rank CityOffice leasing transactions in 2019
(mn sq ft) Office stockVacancy
(mn sq ft)
1 Tokyo 81.0 287 0.6%
2 Bengaluru 15.3 165 4.8%
3 Hyderabad 12.8 75 7.0%
4 Mumbai 9.7 146 17.5%
5 NCR 8.6 166 17.1%
6 Beijing 6.8 113 10.1%
7 Pune 6.2 73 4.2%
8 Chennai 5.2 73 8.8%
9 Guangzhou 3.0 63 8.4%
10 Kuala Lumpur 2.0 93 22.0%
Source: Knight Frank Research, Venture intelligence

I N V E S T M E N T S I N R E A L E S TAT E
2 0
Threat of work from home
A serious threat that has emerged to the long term demand for office
space is the concept of work from home (WFH). While WFH has been
around for several years now, in India, the adoption rate was low. It is
a first that companies in India have allowed most of their employees
to work from home for a period extending over 40-55 days due to the
COVID-19 induced lockdown. Many companies have realized the
benefits of working from home and the corresponding savings in real
estate and other associated costs for them as well as their employees.
One of India’s leading IT company intends to have 75% of its staff
working from home in the next 5 years. However, it is easier said than
done and the thinking may change post the lockdown. The biggest
hindrance that is emerging is the Global Data Protection Rules (GDPR),
which most countries are drafting, while a few have already been
enacted. These rules give paramount importance to data and penalize
any misuse heavily. The rules lay out stringent guidelines with regard
to the location where the data can be stored and how it can be used. Till
now, only the financial/critical data of companies were handled with
such sensitivity. The GDPR puts many categories of data collected in the
normal course of business in this sensitive category and mandates it to
be managed in the same way as financial/critical data.
The off-shore units (KPO/BPO)/back-offices of global companies located
in India would have to handle all the data coming from its onshore units
carefully, or else their parent company would be liable to pay hefty
fines in their home countries running into several millions dollars. As
a result, these companies would be reluctant to allow their employees
working from home fearing the possibility of breach or theft. A few other
obstacles to work from home in India are - low internet speed, lack of
reliable 24-hour electricity supply besides congested homes with many
people sharing an apartment which does not or rather cannot provide an
undisturbed environment for work thereby reducing productivity.

I N V E S T M E N T S I N R E A L E S TAT E
2 1
I N V E S T M E N T S I N R E A L E S TAT E
2 2
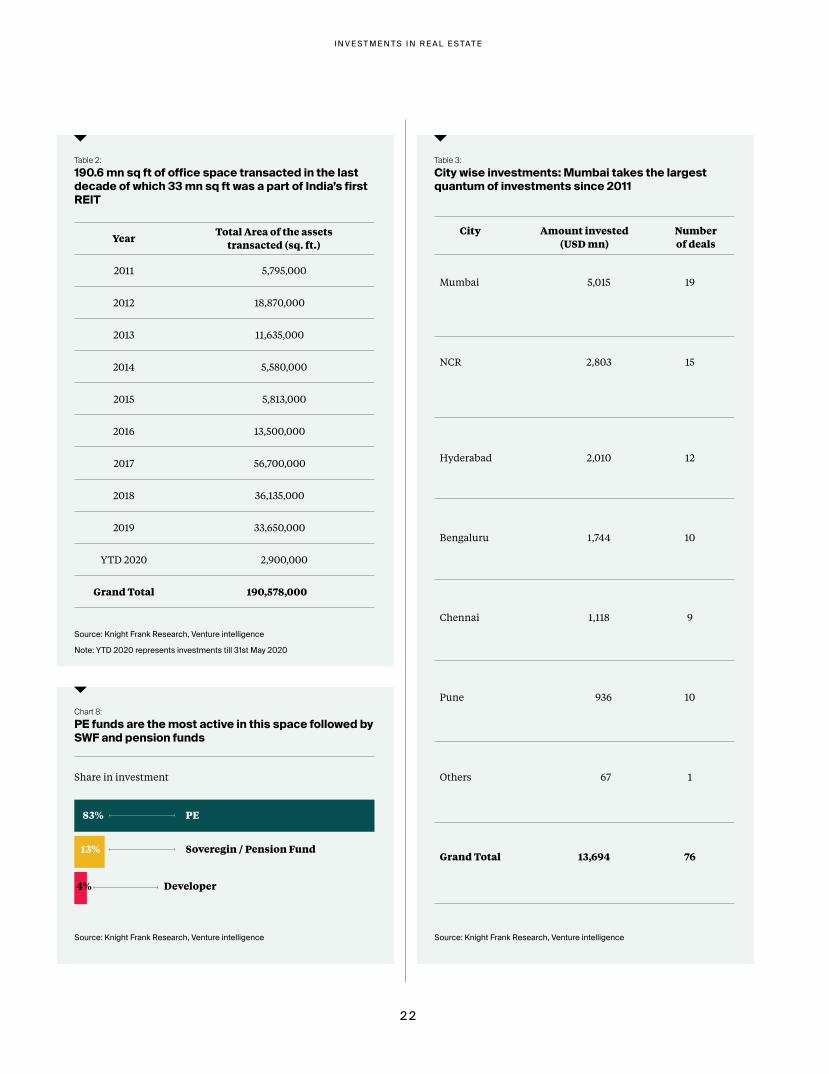
Table 2: 190.6 mn sq ft of office space transacted in the last decade of which 33 mn sq ft was a part of India’s first REIT
Table 3: City wise investments: Mumbai takes the largest quantum of investments since 2011
Chart 8: PE funds are the most active in this space followed by SWF and pension funds
YearTotal Area of the assets
transacted (sq. ft.)
2011 5,795,000
2012 18,870,000
2013 11,635,000
2014 5,580,000
2015 5,813,000
2016 13,500,000
2017 56,700,000
2018 36,135,000
2019 33,650,000
YTD 2020 2,900,000
Grand Total 190,578,000
Source: Knight Frank Research, Venture intelligence
Note: YTD 2020 represents investments till 31st May 2020
Source: Knight Frank Research, Venture intelligence Source: Knight Frank Research, Venture intelligence
Share in investment
Developer
Soveregin / Pension Fund
PE83%
13%
4%
City Amount invested (USD mn)
Number of deals
Mumbai 5,015 19
NCR 2,803 15
Hyderabad 2,010 12
Bengaluru 1,744 10
Chennai 1,118 9
Pune 936 10
Others 67 1
Grand Total 13,694 76
I N V E S T M E N T S I N R E A L E S TAT E
2 3
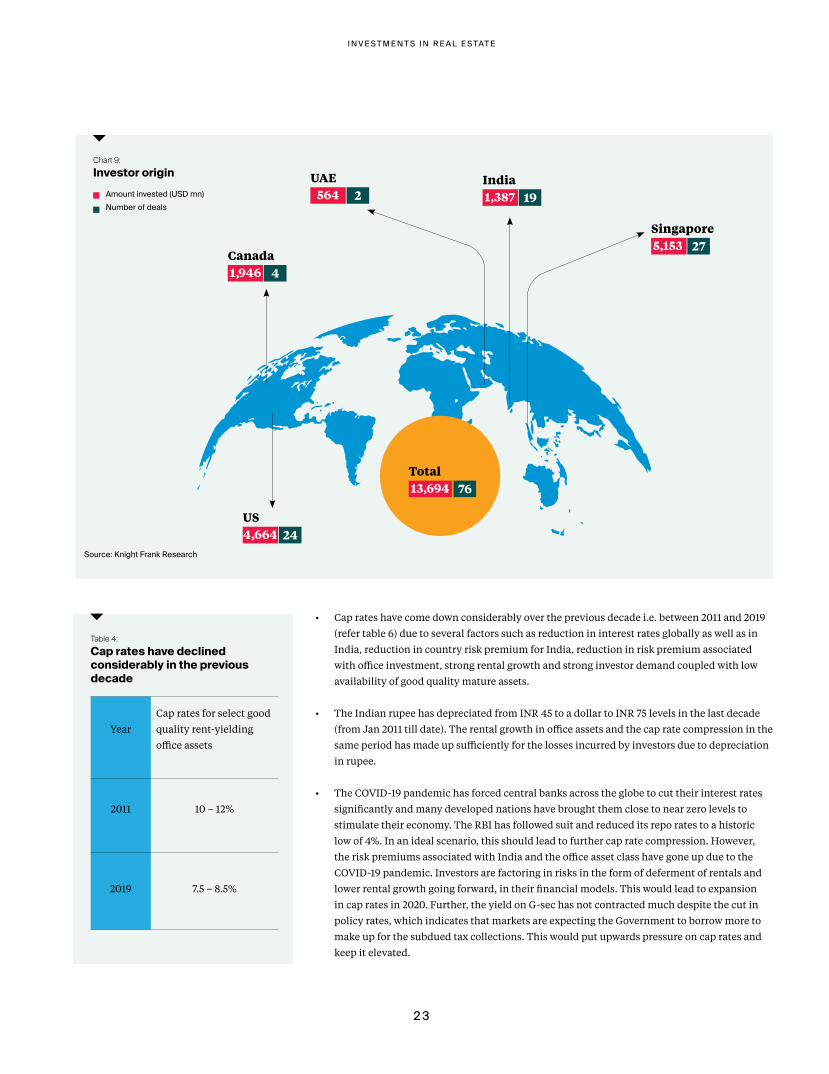
Chart 9: Investor origin
Source: Knight Frank Research
Singapore
India
Canada
US
UAE
5,153
1,387
1,946
4,664
564
27
19
4
24
2Amount invested (USD mn)Number of deals
• Cap rates have come down considerably over the previous decade i.e. between 2011 and 2019
(refer table 6) due to several factors such as reduction in interest rates globally as well as in
India, reduction in country risk premium for India, reduction in risk premium associated
with office investment, strong rental growth and strong investor demand coupled with low
availability of good quality mature assets.
• The Indian rupee has depreciated from INR 45 to a dollar to INR 75 levels in the last decade
(from Jan 2011 till date). The rental growth in office assets and the cap rate compression in the
same period has made up sufficiently for the losses incurred by investors due to depreciation
in rupee.
• The COVID-19 pandemic has forced central banks across the globe to cut their interest rates
significantly and many developed nations have brought them close to near zero levels to
stimulate their economy. The RBI has followed suit and reduced its repo rates to a historic
low of 4%. In an ideal scenario, this should lead to further cap rate compression. However,
the risk premiums associated with India and the office asset class have gone up due to the
COVID-19 pandemic. Investors are factoring in risks in the form of deferment of rentals and
lower rental growth going forward, in their financial models. This would lead to expansion
in cap rates in 2020. Further, the yield on G-sec has not contracted much despite the cut in
policy rates, which indicates that markets are expecting the Government to borrow more to
make up for the subdued tax collections. This would put upwards pressure on cap rates and
keep it elevated.
Total 13,694 76
Table 4: Cap rates have declined considerably in the previous decade
Year
Cap rates for select good
quality rent-yielding
office assets
2011 10 – 12%
2019 7.5 – 8.5%

I N V E S T M E N T S I N R E A L E S TAT E
2 4
The demand-supply equilibrium for office markets across India has been balanced and the scale was tilted more in the favour of asset owners. However in 2019, for the first time in 6 years, office supply across the top 8 markets exceeded demand.
The recent years of outperformance of office as an asset class has encouraged developers and investors to construct new office buildings. While in the short term, supply is expected to remain in deficit, a huge amount of office supply is expected to hit the top cities in the next 3-5 years. The lockdown will push this supply back by 12 to 18 months. Developers would also go slow on completing these projects anticipating lower occupier demand and increase in input cost due to lockdown induced disruptions. While a supply glut which led to the bubble like situation we witnessed in 2008 may not repeat, this upcoming supply had started acting as headwinds to rental growth and the rental growth tapered down in most markets in 2019.
Even though India continues to remain an attractive destination globally for companies to have their offices in, the prevailing business uncertainty and any event of recession forecasted in the upcoming quarters of 2020 will reduce overall demand and impede expansion plans of occupiers. Occupiers will resist any hike in rentals and look to renegotiate existing/expiring leases. As asset owners are cognizant of the supply building up in office, they would be amenable to negotiate at lower rentals for long term leases. Hence, the cycle of strong rental growth which we had witnessed over the last 3-4 years will taper down or even stagnate, impacting valuations.
The pandemic induced recession will lead to a significant drop in asset valuations across the globe. Investors are likely to get ample opportunities in their home country and such opportunities do not entail any exposure to currency risks. On account of all the above factors, in the near term, investors are likely to slow down their investments in office assets in India and the cap rates would expand from 2019 levels.
Outlookfor near term (next 12 months)

I N V E S T M E N T S I N R E A L E S TAT E
2 5
P E I N V E S T M E N T S I N R E T A I L
The past decade has seen failure of a large number of malls across the country. The major reasons for this include
strata sales by developers, poor planning with respect to design, smaller (non-optimal) size of malls, improper location
selection, narrow access roads, inaccurate demand forecasting, shrinkage in catchments, advent of e-commerce and in
most cases oversupply of retail spaces in the same locality. Due to oversupply of malls, the malls that were doing well
initially started to suffer. A large number of instances of failure made investors shift their focus away from malls. Even
developers shelved plans to build malls and the land acquired for constructing malls were either kept idle or were used
for residential or office constructions.
I N V E S T M E N T S I N R E A L E S TAT E
2 6
With a large number of malls going out of business coupled with no
new supply, the malls which survived and could transform as per the
need of the hour started commanding a premium. Occupiers/retailers
lined up to take up space in those assets. For the malls which started
doing well, the revenue sharing agreements became more and more
valuable. The owners were able to achieve rental growth higher than
what they would achieve in the case of standard rent appreciation
clauses (15% every three years) in rental agreement of office assets. This
helped allure investors.
The COVID-19 pandemic has led to a temporary shutdown of malls all
over the country and put tenants as well as developers in a precarious
situation, but the long term growth story for malls is not over yet. Once
a vaccine or a solution for the pandemic is available to the masses,
there is significant potential for mall revenues to grow due to a dearth
in supply of good quality successful malls, rising consumer demand,
increasing levels of disposable income, India’s growth potential and
demographics, besides the ongoing structural changes taking shape in
select malls to accommodate new anchors and entertainment options
in order to remain relevant in the face of competition from online retail.
Investors have spent over USD 2.5 billion in the previous decade to
acquire retail assets. As the supply of successful Grade-A malls in India
is low, many new, retail-focused investment platforms have also been
created like the CPPIB-Phoenix Mills, Warburg Pincus-Runwal, etc.
which have the mandate to construct new malls as well acquire retail
assets.
• For a considerable amount of time post the Global Financial Crisis
(GFC), a large number of malls in India struggled and some of them
went out of business. Several retail assets though, were thriving and
undergoing transformation to become modern day entertainment
hubs. It was not clear as to which malls would undergo the
transformation successfully. Thus, there was a considerable lull in
transaction of retail assets between 2011 and 2015 and investors at
the time became interested in acquiring rent-yielding, good quality
office assets.
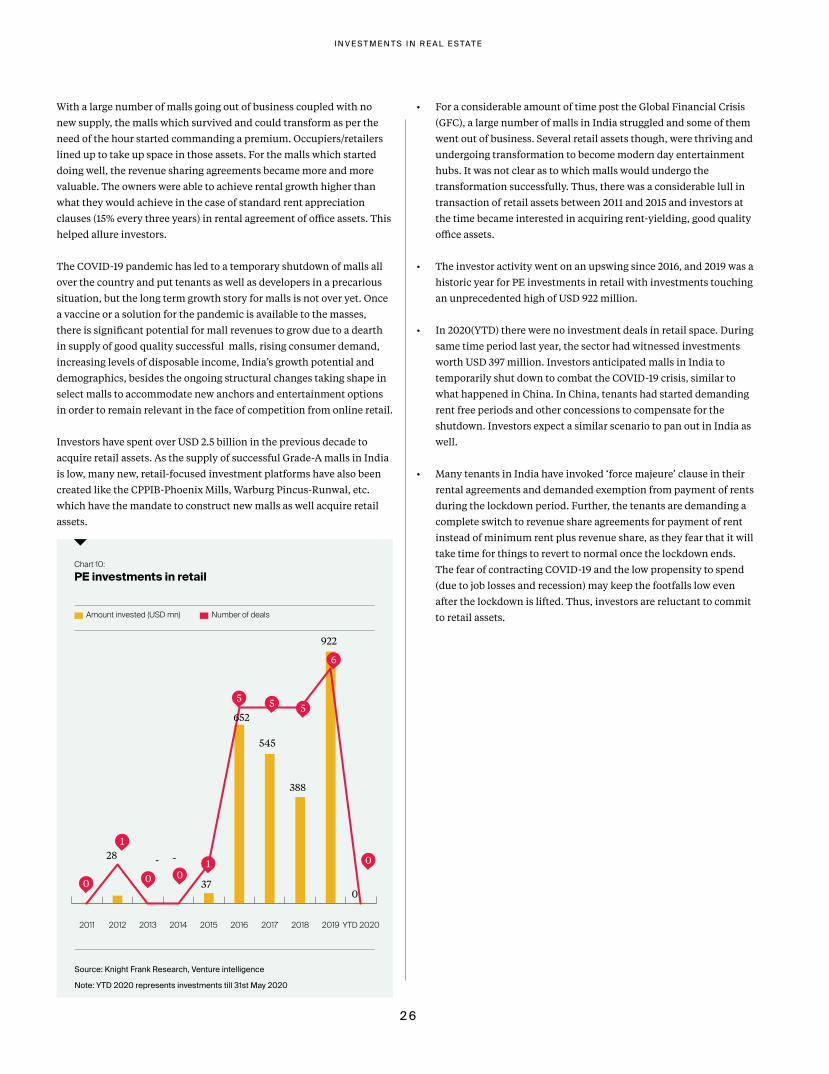
• The investor activity went on an upswing since 2016, and 2019 was a
historic year for PE investments in retail with investments touching
an unprecedented high of USD 922 million.
• In 2020(YTD) there were no investment deals in retail space. During
same time period last year, the sector had witnessed investments
worth USD 397 million. Investors anticipated malls in India to
temporarily shut down to combat the COVID-19 crisis, similar to
what happened in China. In China, tenants had started demanding
rent free periods and other concessions to compensate for the
shutdown. Investors expect a similar scenario to pan out in India as
well.
• Many tenants in India have invoked ‘force majeure’ clause in their
rental agreements and demanded exemption from payment of rents
during the lockdown period. Further, the tenants are demanding a
complete switch to revenue share agreements for payment of rent
instead of minimum rent plus revenue share, as they fear that it will
take time for things to revert to normal once the lockdown ends.
The fear of contracting COVID-19 and the low propensity to spend
(due to job losses and recession) may keep the footfalls low even
after the lockdown is lifted. Thus, investors are reluctant to commit
to retail assets.
YTD 2020201920182017201620152014201320122011
Chart 10: PE investments in retail
Amount invested (USD mn) Number of deals
Source: Knight Frank Research, Venture intelligence
Note: YTD 2020 represents investments till 31st May 2020
28 - -
37
652
545
388
922
0
1
0
1
5 5 5
0 0
6
0
I N V E S T M E N T S I N R E A L E S TAT E
2 7
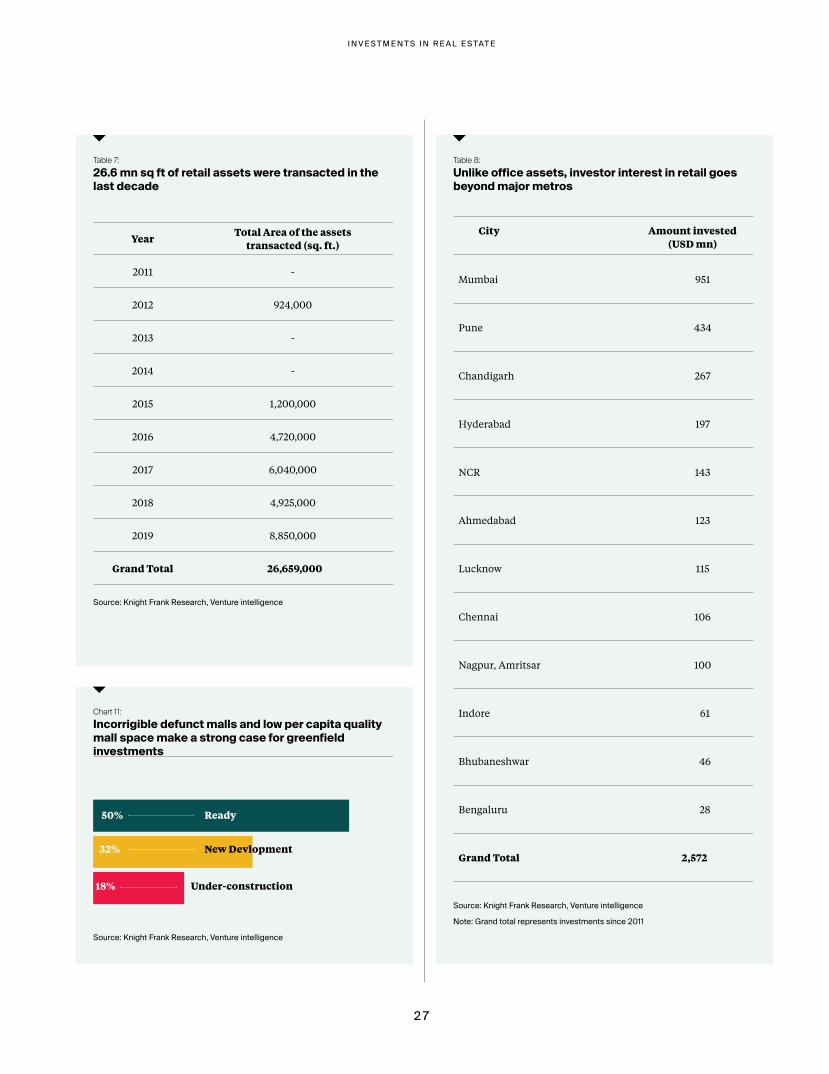
Table 7: 26.6 mn sq ft of retail assets were transacted in the last decade
Table 8: Unlike office assets, investor interest in retail goes beyond major metros
Chart 11: Incorrigible defunct malls and low per capita quality mall space make a strong case for greenfield investments
YearTotal Area of the assets
transacted (sq. ft.)
2011 -
2012 924,000
2013 -
2014 -
2015 1,200,000
2016 4,720,000
2017 6,040,000
2018 4,925,000
2019 8,850,000
Grand Total 26,659,000
Source: Knight Frank Research, Venture intelligence
Source: Knight Frank Research, Venture intelligence
Source: Knight Frank Research, Venture intelligence
Note: Grand total represents investments since 2011
Under-construction
New Devlopment
Ready50%
32%
18%
City Amount invested (USD mn)
Mumbai 951
Pune 434
Chandigarh 267
Hyderabad 197
NCR 143
Ahmedabad 123
Lucknow 115
Chennai 106
Nagpur, Amritsar 100
Indore 61
Bhubaneshwar 46
Bengaluru 28
Grand Total 2,572
I N V E S T M E N T S I N R E A L E S TAT E
2 8
• In the top cities of India like Mumbai, NCR, Bengaluru and
Pune, there can be multiple malls within the city which can do
well simultaneously, as the population density is high and the
catchment area of each mall is smaller. However, in the tier-II and
tier-III cities of India, only one or a limited number of malls can
do well simultaneously, as the population density is lower and the
catchment expanse for each mall is vast. Evidence suggests that
generally, in the tier-II and tier-III cities, the biggest mall of the
city, if managed well, is generally the best performing mall. In some
cases, these evolve into destination malls. Moreover, it is easy to
identify the best performing mall in smaller cities compared to the
top metros. Thus, investors who have ventured into tier II and tier
III cities of India have gone for the biggest and the best performing
asset of that city. As a result, unlike office assets, investor interest
goes beyond major metros.
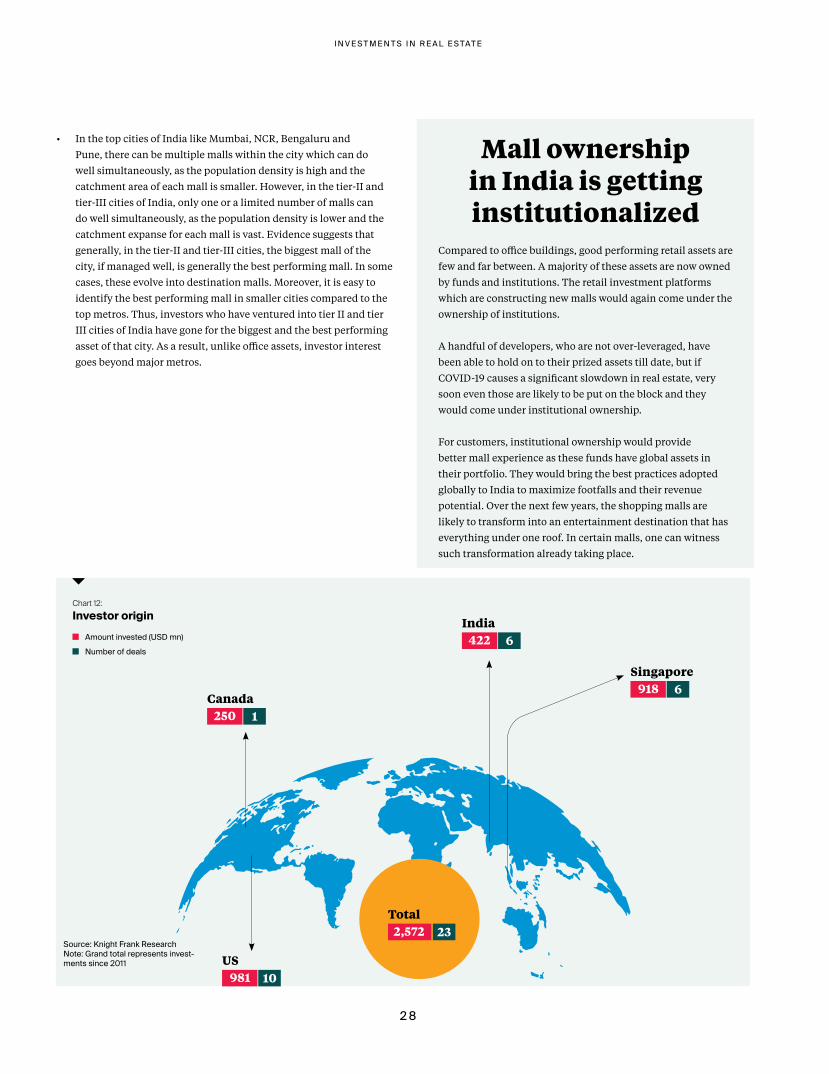
Mall ownership in India is getting institutionalized
Compared to office buildings, good performing retail assets are
few and far between. A majority of these assets are now owned
by funds and institutions. The retail investment platforms
which are constructing new malls would again come under the
ownership of institutions.
A handful of developers, who are not over-leveraged, have
been able to hold on to their prized assets till date, but if
COVID-19 causes a significant slowdown in real estate, very
soon even those are likely to be put on the block and they
would come under institutional ownership.
For customers, institutional ownership would provide
better mall experience as these funds have global assets in
their portfolio. They would bring the best practices adopted
globally to India to maximize footfalls and their revenue
potential. Over the next few years, the shopping malls are
likely to transform into an entertainment destination that has
everything under one roof. In certain malls, one can witness
such transformation already taking place.
Chart 12: Investor origin
Source: Knight Frank ResearchNote: Grand total represents invest-ments since 2011
Singapore
India
Canada
US
918
422
250
981
6
6
1
10
Amount invested (USD mn)
Number of deals
Total 2,572 23
I N V E S T M E N T S I N R E A L E S TAT E
2 9
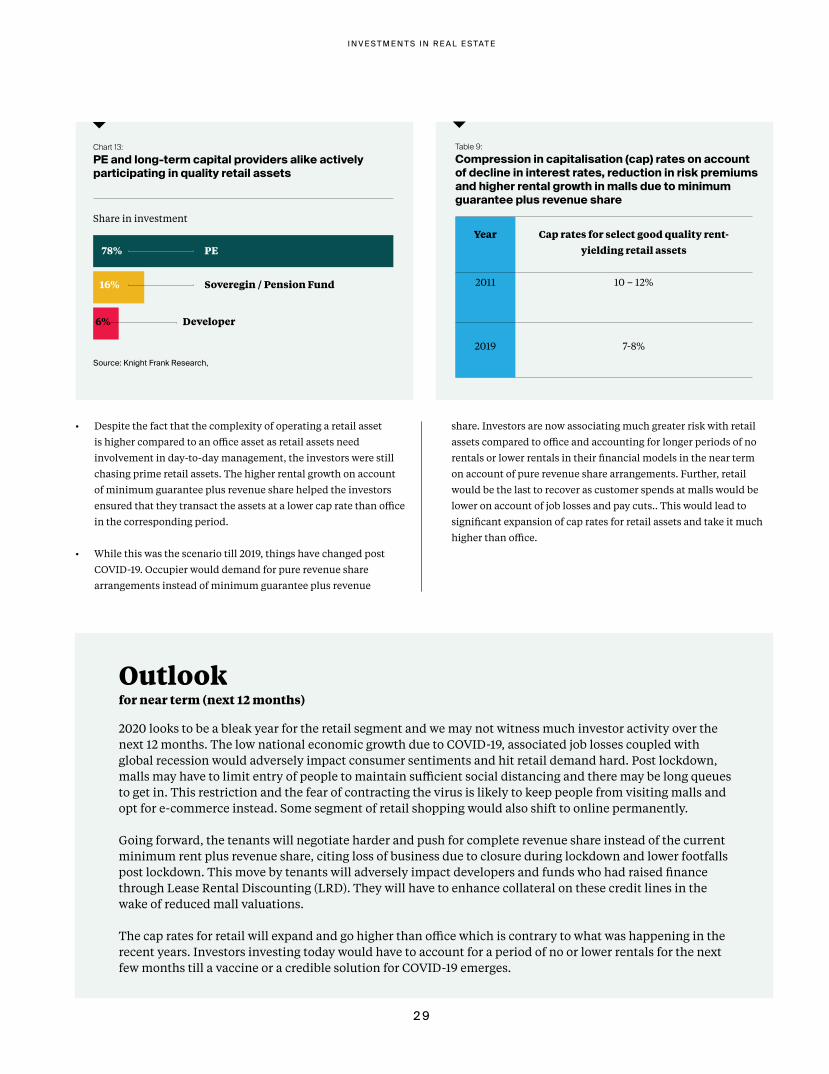
Chart 13: PE and long-term capital providers alike actively participating in quality retail assets
Source: Knight Frank Research,
Share in investment
Developer
Soveregin / Pension Fund
PE78%
16%
6%
Table 9: Compression in capitalisation (cap) rates on account of decline in interest rates, reduction in risk premiums and higher rental growth in malls due to minimum guarantee plus revenue share
Year Cap rates for select good quality rent-yielding retail assets
2011 10 – 12%
2019 7-8%
• Despite the fact that the complexity of operating a retail asset
is higher compared to an office asset as retail assets need
involvement in day-to-day management, the investors were still
chasing prime retail assets. The higher rental growth on account
of minimum guarantee plus revenue share helped the investors
ensured that they transact the assets at a lower cap rate than office
in the corresponding period.
• While this was the scenario till 2019, things have changed post
COVID-19. Occupier would demand for pure revenue share
arrangements instead of minimum guarantee plus revenue
share. Investors are now associating much greater risk with retail
assets compared to office and accounting for longer periods of no
rentals or lower rentals in their financial models in the near term
on account of pure revenue share arrangements. Further, retail
would be the last to recover as customer spends at malls would be
lower on account of job losses and pay cuts.. This would lead to
significant expansion of cap rates for retail assets and take it much
higher than office.
2020 looks to be a bleak year for the retail segment and we may not witness much investor activity over the next 12 months. The low national economic growth due to COVID-19, associated job losses coupled with global recession would adversely impact consumer sentiments and hit retail demand hard. Post lockdown, malls may have to limit entry of people to maintain sufficient social distancing and there may be long queues to get in. This restriction and the fear of contracting the virus is likely to keep people from visiting malls and opt for e-commerce instead. Some segment of retail shopping would also shift to online permanently.
Going forward, the tenants will negotiate harder and push for complete revenue share instead of the current minimum rent plus revenue share, citing loss of business due to closure during lockdown and lower footfalls post lockdown. This move by tenants will adversely impact developers and funds who had raised finance through Lease Rental Discounting (LRD). They will have to enhance collateral on these credit lines in the wake of reduced mall valuations.
The cap rates for retail will expand and go higher than office which is contrary to what was happening in the recent years. Investors investing today would have to account for a period of no or lower rentals for the next few months till a vaccine or a credible solution for COVID-19 emerges.
Outlookfor near term (next 12 months)

I N V E S T M E N T S I N R E A L E S TAT E
3 0
P E I N V E S T M E N T S I N W A R E H O U S I N G
The warehousing industry in India is undergoing an unprecedented transformation from a mere provider of storage
space within four walls into a modern day warehousing hub similar to the ones in developed countries. A majority of
warehousing operations in India are being handled by small and fragmented unorganized players, which adds to the
logistics and warehousing cost. The share of large organized players is small but growing rapidly.
Over the past few years, there has already been a gradual transition in the mindset of occupiers to use the services
offered by organized segments. This change in mindset was further accentuated with the implementation of GST.
I N V E S T M E N T S I N R E A L E S TAT E
3 1
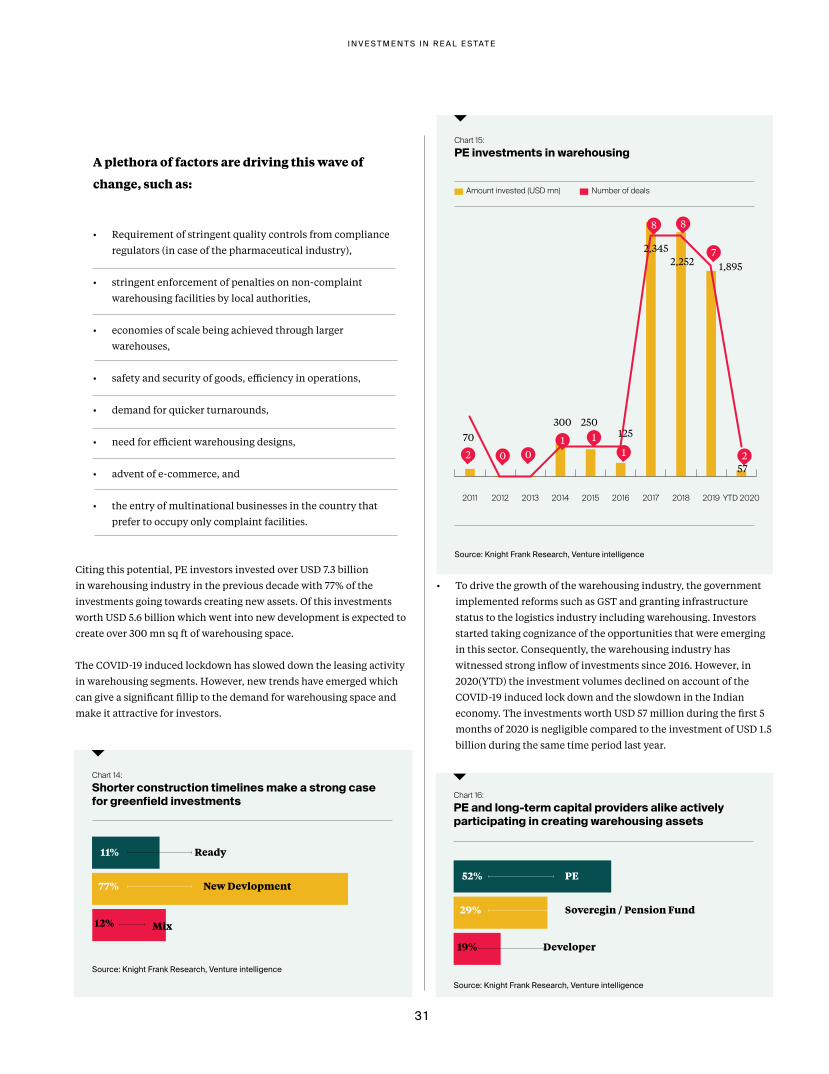
A plethora of factors are driving this wave of
change, such as:
• Requirement of stringent quality controls from compliance
regulators (in case of the pharmaceutical industry),
• stringent enforcement of penalties on non-complaint
warehousing facilities by local authorities,
• economies of scale being achieved through larger
warehouses,
• safety and security of goods, efficiency in operations,
• demand for quicker turnarounds,
• need for efficient warehousing designs,
• advent of e-commerce, and
• the entry of multinational businesses in the country that
prefer to occupy only complaint facilities.
Citing this potential, PE investors invested over USD 7.3 billion
in warehousing industry in the previous decade with 77% of the
investments going towards creating new assets. Of this investments
worth USD 5.6 billion which went into new development is expected to
create over 300 mn sq ft of warehousing space.
The COVID-19 induced lockdown has slowed down the leasing activity
in warehousing segments. However, new trends have emerged which
can give a significant fillip to the demand for warehousing space and
make it attractive for investors.
YTD 2020201920182017201620152014201320122011
Chart 15: PE investments in warehousing
Amount invested (USD mn) Number of deals
Source: Knight Frank Research, Venture intelligence
300 25012570
2,3452,252 1,895
5702
11
8 8
01
7
2
• To drive the growth of the warehousing industry, the government
implemented reforms such as GST and granting infrastructure
status to the logistics industry including warehousing. Investors
started taking cognizance of the opportunities that were emerging
in this sector. Consequently, the warehousing industry has
witnessed strong inflow of investments since 2016. However, in
2020(YTD) the investment volumes declined on account of the
COVID-19 induced lock down and the slowdown in the Indian
economy. The investments worth USD 57 million during the first 5
months of 2020 is negligible compared to the investment of USD 1.5
billion during the same time period last year.
Chart 14: Shorter construction timelines make a strong case for greenfield investments
Source: Knight Frank Research, Venture intelligence
Mix
New Devlopment
Ready11%
77%
12%
Chart 16: PE and long-term capital providers alike actively participating in creating warehousing assets
Source: Knight Frank Research, Venture intelligence
Developer
Soveregin / Pension Fund
PE52%
29%
19%
I N V E S T M E N T S I N R E A L E S TAT E
3 2
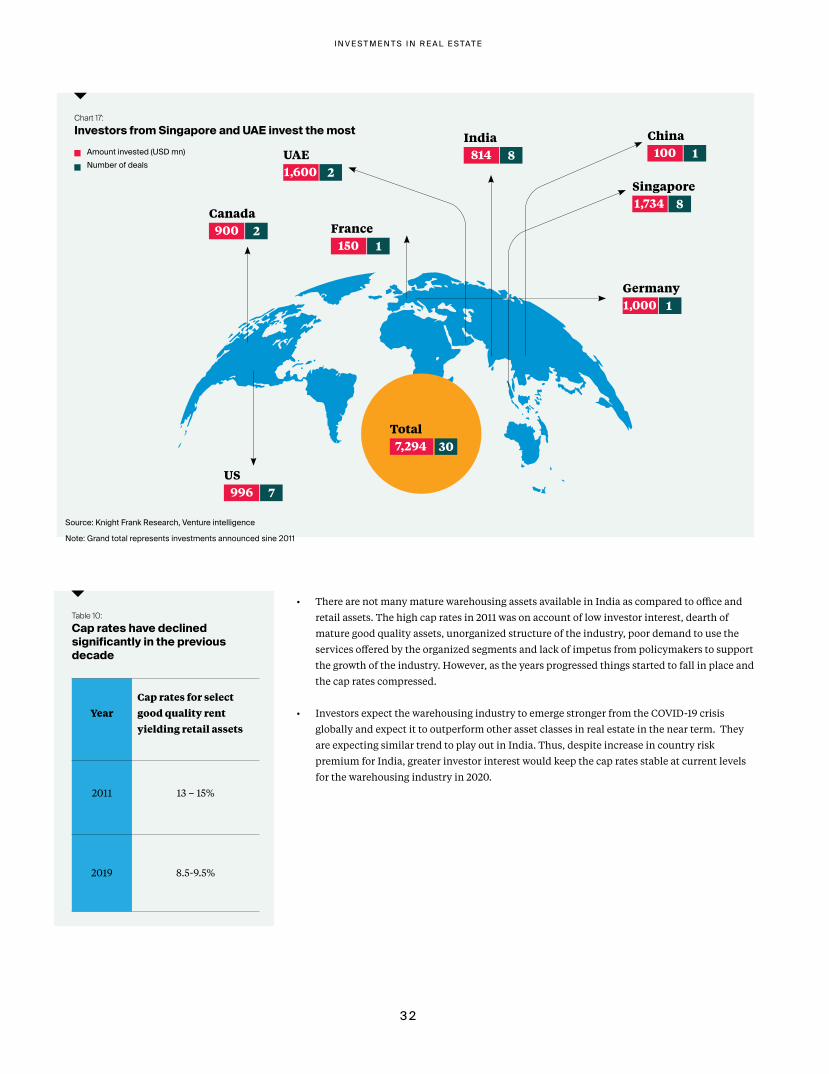
Chart 17: Investors from Singapore and UAE invest the most
Source: Knight Frank Research, Venture intelligence
Note: Grand total represents investments announced sine 2011
Singapore
Germany
France
ChinaIndia
Canada
US
UAE
1,734
1,000
150
100814
900
996
1,600
8
1
1
18
2
7
2
Amount invested (USD mn)Number of deals
Total 7,294 30
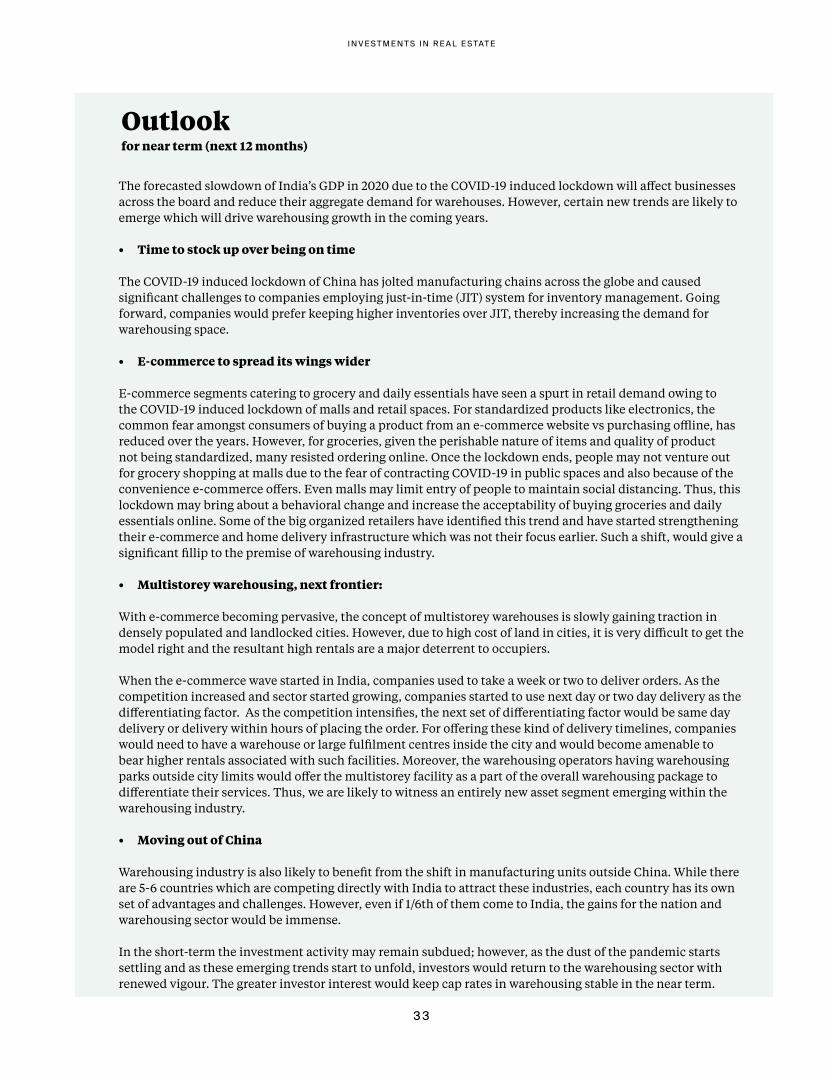
Table 10: Cap rates have declined significantly in the previous decade
YearCap rates for select good quality rent yielding retail assets
2011 13 – 15%
2019 8.5-9.5%
• There are not many mature warehousing assets available in India as compared to office and
retail assets. The high cap rates in 2011 was on account of low investor interest, dearth of
mature good quality assets, unorganized structure of the industry, poor demand to use the
services offered by the organized segments and lack of impetus from policymakers to support
the growth of the industry. However, as the years progressed things started to fall in place and
the cap rates compressed.
• Investors expect the warehousing industry to emerge stronger from the COVID-19 crisis
globally and expect it to outperform other asset classes in real estate in the near term. They
are expecting similar trend to play out in India. Thus, despite increase in country risk
premium for India, greater investor interest would keep the cap rates stable at current levels
for the warehousing industry in 2020.
I N V E S T M E N T S I N R E A L E S TAT E
3 3
The forecasted slowdown of India’s GDP in 2020 due to the COVID-19 induced lockdown will affect businesses across the board and reduce their aggregate demand for warehouses. However, certain new trends are likely to emerge which will drive warehousing growth in the coming years.
• Time to stock up over being on time
The COVID-19 induced lockdown of China has jolted manufacturing chains across the globe and caused significant challenges to companies employing just-in-time (JIT) system for inventory management. Going forward, companies would prefer keeping higher inventories over JIT, thereby increasing the demand for warehousing space.
• E-commerce to spread its wings wider
E-commerce segments catering to grocery and daily essentials have seen a spurt in retail demand owing to the COVID-19 induced lockdown of malls and retail spaces. For standardized products like electronics, the common fear amongst consumers of buying a product from an e-commerce website vs purchasing offline, has reduced over the years. However, for groceries, given the perishable nature of items and quality of product not being standardized, many resisted ordering online. Once the lockdown ends, people may not venture out for grocery shopping at malls due to the fear of contracting COVID-19 in public spaces and also because of the convenience e-commerce offers. Even malls may limit entry of people to maintain social distancing. Thus, this lockdown may bring about a behavioral change and increase the acceptability of buying groceries and daily essentials online. Some of the big organized retailers have identified this trend and have started strengthening their e-commerce and home delivery infrastructure which was not their focus earlier. Such a shift, would give a significant fillip to the premise of warehousing industry.
• Multistorey warehousing, next frontier:
With e-commerce becoming pervasive, the concept of multistorey warehouses is slowly gaining traction in densely populated and landlocked cities. However, due to high cost of land in cities, it is very difficult to get the model right and the resultant high rentals are a major deterrent to occupiers.
When the e-commerce wave started in India, companies used to take a week or two to deliver orders. As the competition increased and sector started growing, companies started to use next day or two day delivery as the differentiating factor. As the competition intensifies, the next set of differentiating factor would be same day delivery or delivery within hours of placing the order. For offering these kind of delivery timelines, companies would need to have a warehouse or large fulfilment centres inside the city and would become amenable to bear higher rentals associated with such facilities. Moreover, the warehousing operators having warehousing parks outside city limits would offer the multistorey facility as a part of the overall warehousing package to differentiate their services. Thus, we are likely to witness an entirely new asset segment emerging within the warehousing industry.
• Moving out of China
Warehousing industry is also likely to benefit from the shift in manufacturing units outside China. While there are 5-6 countries which are competing directly with India to attract these industries, each country has its own set of advantages and challenges. However, even if 1/6th of them come to India, the gains for the nation and warehousing sector would be immense.
In the short-term the investment activity may remain subdued; however, as the dust of the pandemic starts settling and as these emerging trends start to unfold, investors would return to the warehousing sector with renewed vigour. The greater investor interest would keep cap rates in warehousing stable in the near term.
for near term (next 12 months)

c o n tac t
Knight Frank India
Headquarters
Paville House, Near Twin Towers
Off Veer Savarkar Marg
Prabhadevi
Mumbai 400 025
L o c a l ly e x p e r t, g l o b a l ly c o n n e c t e d
Our teams are locally expert, yet globally
connected. Our multi-market clients are managed
centrally from our various hubs across the world.
We can help you gain access and entry to new
markets, create a working environment which
enhances productivity, attracts and retains talent,
whilst also managing your portfolio
costs effectively.
O u r m i s s i o n
At Knight Frank we
‘Connect people & property, perfectly’.
Our Globally competent teams facilitate
this for our business clients, offering a broad
menu of consulting and transactional services.
The integration of these services enable us
to understand the critical success factors
for your business.
A B O U TKnight Frank India
8O f f i c e s
I N I N D I As i n c e 1 9 9 5
1 , 4 0 0 +p e o p l e
Mumbai Ahmedabad Bengaluru Chennai Hyderabad Kolkata NCR Pune

Key Contacts
Report Authors
ADVISORY, RETAIL & HOSPITALITY Gulam ZiaExecutive Director [email protected]
Rajeev VijayExecutive Director - Advisory [email protected]
Saurabh MehrotraNational Director - Advisory [email protected]
CAPITAL MARKETSTushar RaneExecutive Director [email protected]
Sharad AgrawalExecutive Director [email protected]
FACILITIES & ASSET MANAGEMENT SERVICESSathish RajendrenChief Operating Officer [email protected]
INDUSTRIAL & LOGISTICS SERVICES Balbirsingh KhalsaNational [email protected]
Pinkesh TeckwaniNational [email protected]
OFFICE AGENCY & LRGViral DesaiNational [email protected]
PROJECT MANAGEMENTDeben MozaExecutive Director [email protected]
RESEARCH Rajani SinhaChief Economist & National Director [email protected]
RESIDENTIAL Girish ShahExecutive Director [email protected]
AHMEDABAD Balbirsingh KhalsaBranch [email protected]
BENGALURU Shantanu MazumderSenior Branch [email protected]
CHENNAI Srinivas AnkipattiSenior [email protected]
HYDERABAD Samson Arthur Branch [email protected]
KOLKATASwapan DuttaBranch [email protected]
NCRMudassir ZaidiExecutive Director - [email protected]
PUNE Paramvir Singh PaulBranch [email protected]
Vivek Rathi Director - Research [email protected]
Nibodh Shetty
Consultant - Research

Knight Frank Research provides strategic advice, consultancy services and forecasting to a wide range of clients worldwide including developers, investors, funding organisations, corporate institutions and the public sector. All our clients recognise the need for expert independent advice customised to their specific needs. Important Notice: © Knight Frank LLP 2018 This report is published for general information only and not to be relied upon in any way. Although high standards have been used in the preparation of the information, analysis, views and projections presented in this report, no responsibility or liability whatsoever can be accepted by Knight Frank LLP for any loss or damage resultant from any use of, reliance on or reference to the contents of this document. As a general report, this material does not necessarily represent the view of Knight Frank LLP in relation to particular properties or projects. Reproduction of this report in whole or in part is not allowed without prior written approval of Knight Frank LLP to the form and content within which it appears. Knight Frank LLP is a limited liability partnership registered in England with registered number OC305934. Our registered office is 55 Baker Street, London, W1U 8AN, where you may look at a list of members’ names.
Knight Frank Research Reports are available to download atknightfrank.com/research
We like questions, if you’ve got one about our research, or would like some property advice, we would love to hear from you.
Indi
a Ur
ban
Infra
stru
ctur
eIn
dia
War
ehou
sing
Thin
k Ind
ia.
Thin
k Ret
ail 2
020
India Urban Infrastructure Report
Research
Indi
a Re
al E
stat
e India Real EstateR E S I D E N T I A L A N D O F F I C E
Ju l y - D e c e m b e r 2 01 9
RESEARCH
ADVISORY, RETAIL & HOSPITALITY Gulam ZiaExecutive Director [email protected]
CAPITAL MARKETS Tushar RaneExecutive Director [email protected]
Sharad AgrawalExecutive Director [email protected]
RESEARCH Rajani SinhaChief Economist & National Director [email protected]
CORPORATE - MARKETING & PUBLIC RELATIONSGirish ShahExecutive Director [email protected]