Embed Size (px)
Citation preview

Real Estate InvestmentsReal Estate Investments
Topic 12Topic 12
I. The Nature & Scope ofI. The Nature & Scope ofReal Estate InvestmentsReal Estate Investments
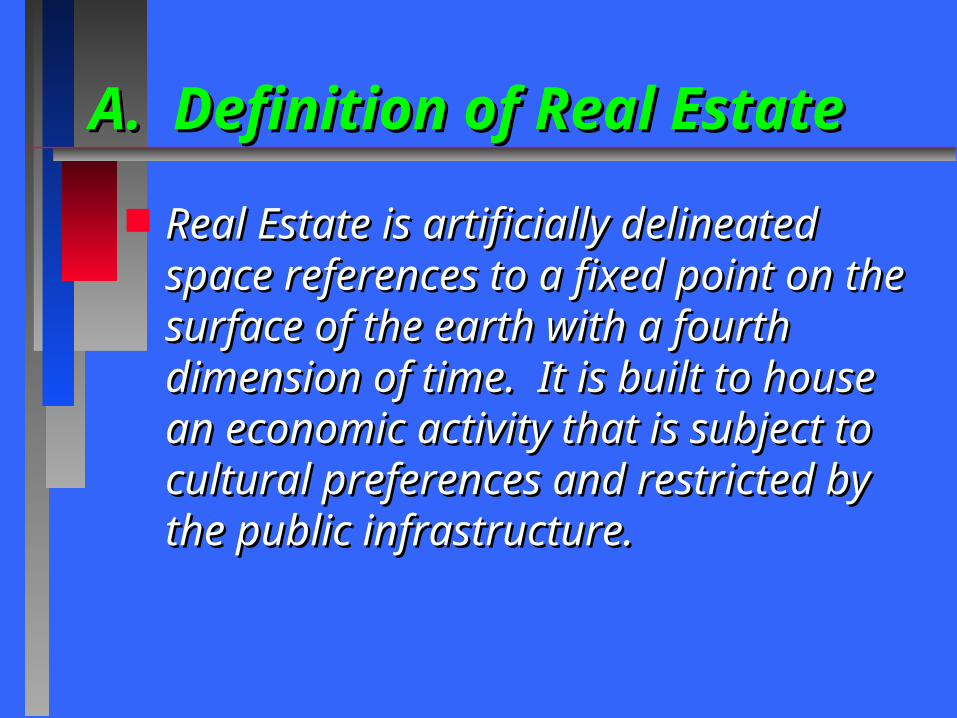
A. Definition of Real EstateA. Definition of Real Estate
Real Estate is artificially delineated Real Estate is artificially delineated space references to a fixed point on the space references to a fixed point on the surface of the earth with a fourth surface of the earth with a fourth dimension of time. It is built to house an dimension of time. It is built to house an economic activity that is subject to economic activity that is subject to cultural preferences and restricted by cultural preferences and restricted by the public infrastructure.the public infrastructure.
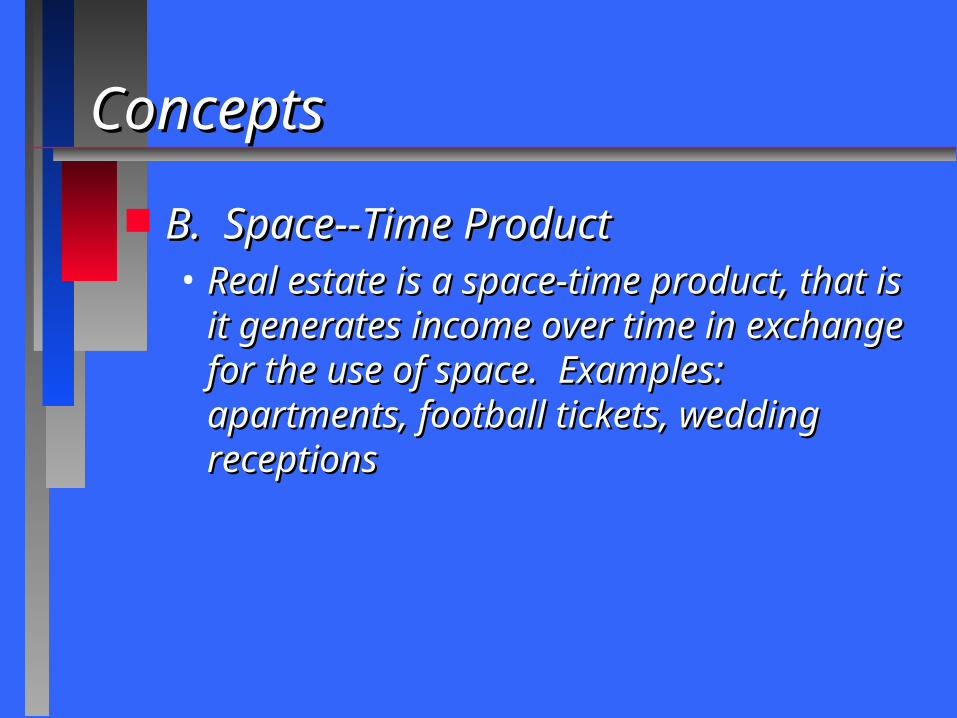
ConceptsConcepts
B. Space--Time ProductB. Space--Time Product• Real estate is a space-time product, that is Real estate is a space-time product, that is
it generates income over time in exchange it generates income over time in exchange for the use of space. Examples: for the use of space. Examples: apartments, football tickets, wedding apartments, football tickets, wedding receptionsreceptions
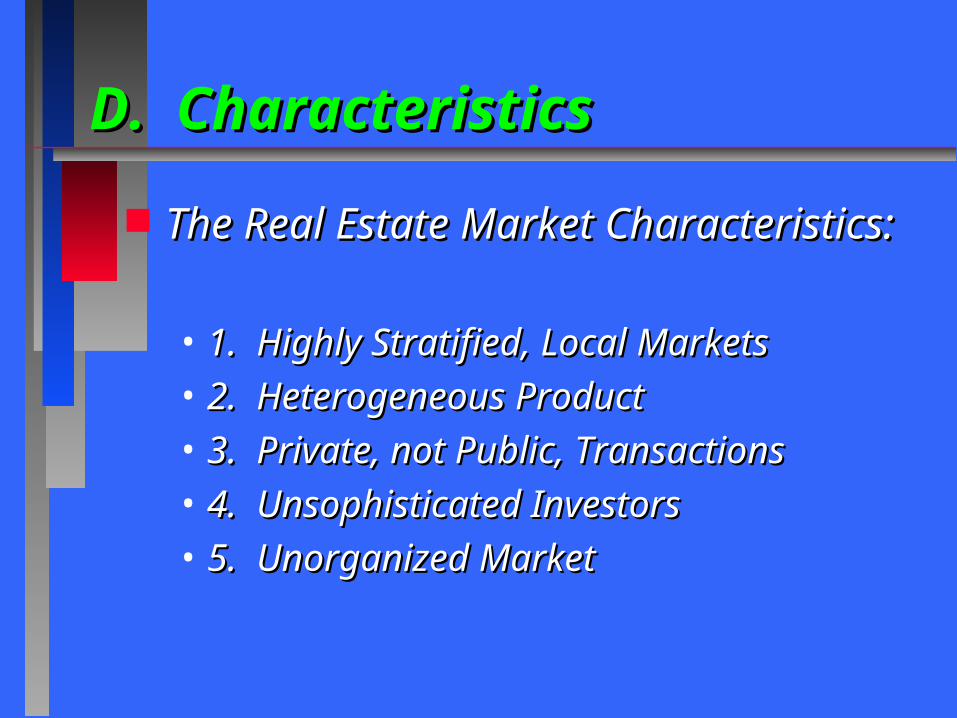
D. CharacteristicsD. Characteristics
The Real Estate Market Characteristics:The Real Estate Market Characteristics:
• 1. Highly Stratified, Local Markets1. Highly Stratified, Local Markets• 2. Heterogeneous Product2. Heterogeneous Product• 3. Private, not Public, Transactions3. Private, not Public, Transactions• 4. Unsophisticated Investors4. Unsophisticated Investors• 5. Unorganized Market5. Unorganized Market
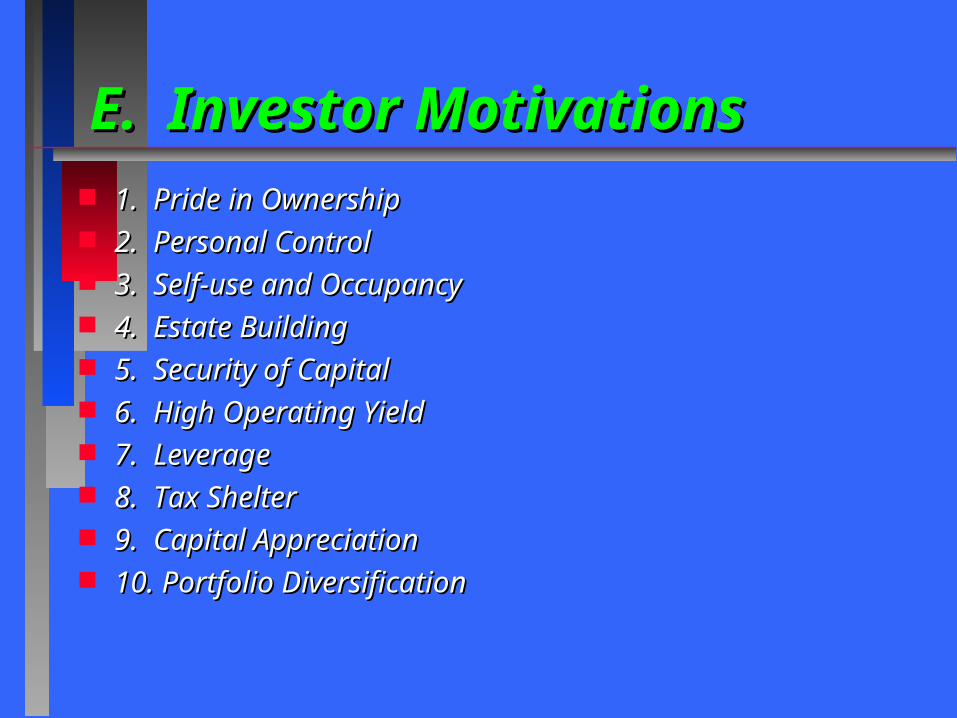
E. Investor MotivationsE. Investor Motivations 1. Pride in Ownership1. Pride in Ownership 2. Personal Control2. Personal Control 3. Self-use and Occupancy3. Self-use and Occupancy 4. Estate Building4. Estate Building 5. Security of Capital5. Security of Capital 6. High Operating Yield6. High Operating Yield 7. Leverage7. Leverage 8. Tax Shelter8. Tax Shelter 9. Capital Appreciation9. Capital Appreciation 10. Portfolio Diversification10. Portfolio Diversification
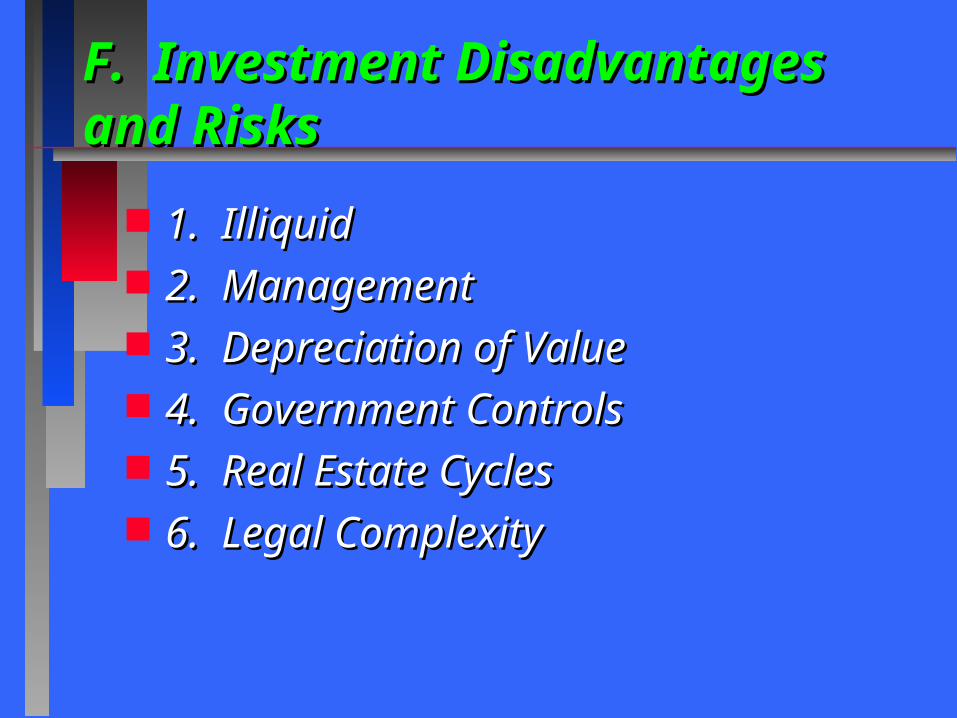
F. Investment Disadvantages and F. Investment Disadvantages and RisksRisks
1. Illiquid1. Illiquid 2. Management2. Management 3. Depreciation of Value3. Depreciation of Value 4. Government Controls4. Government Controls 5. Real Estate Cycles5. Real Estate Cycles 6. Legal Complexity6. Legal Complexity
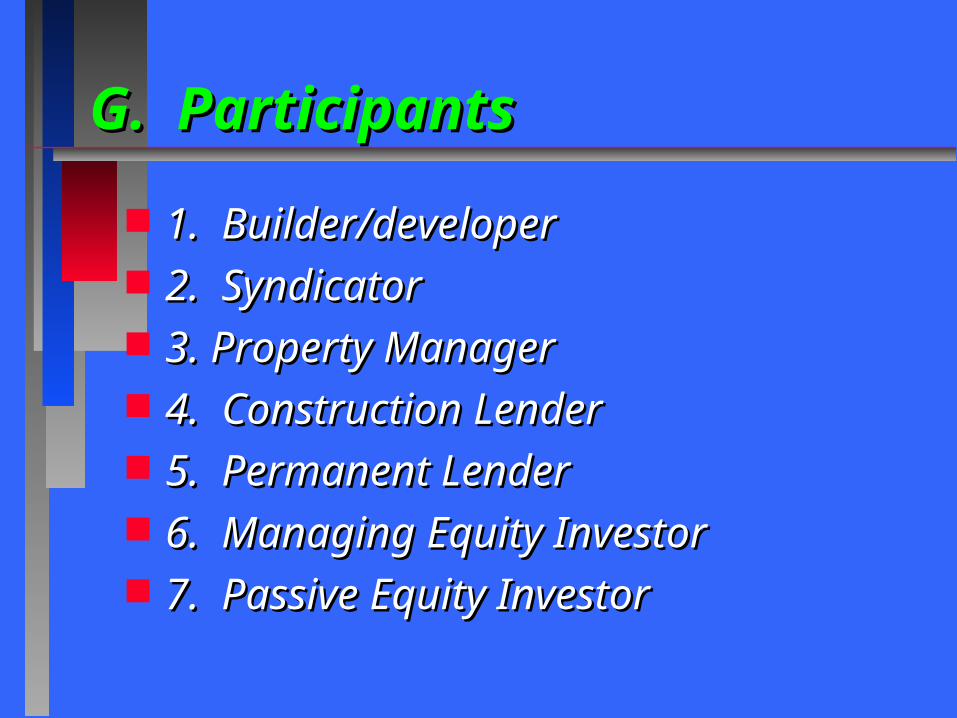
G. ParticipantsG. Participants
1. Builder/developer1. Builder/developer 2. Syndicator2. Syndicator 3. Property Manager3. Property Manager 4. Construction Lender4. Construction Lender 5. Permanent Lender5. Permanent Lender 6. Managing Equity Investor6. Managing Equity Investor 7. Passive Equity Investor7. Passive Equity Investor
Real Estate InvestmentsReal Estate Investments
Topic 12Topic 12
II. Overview ofII. Overview ofInvestment Decision ProcessInvestment Decision Process
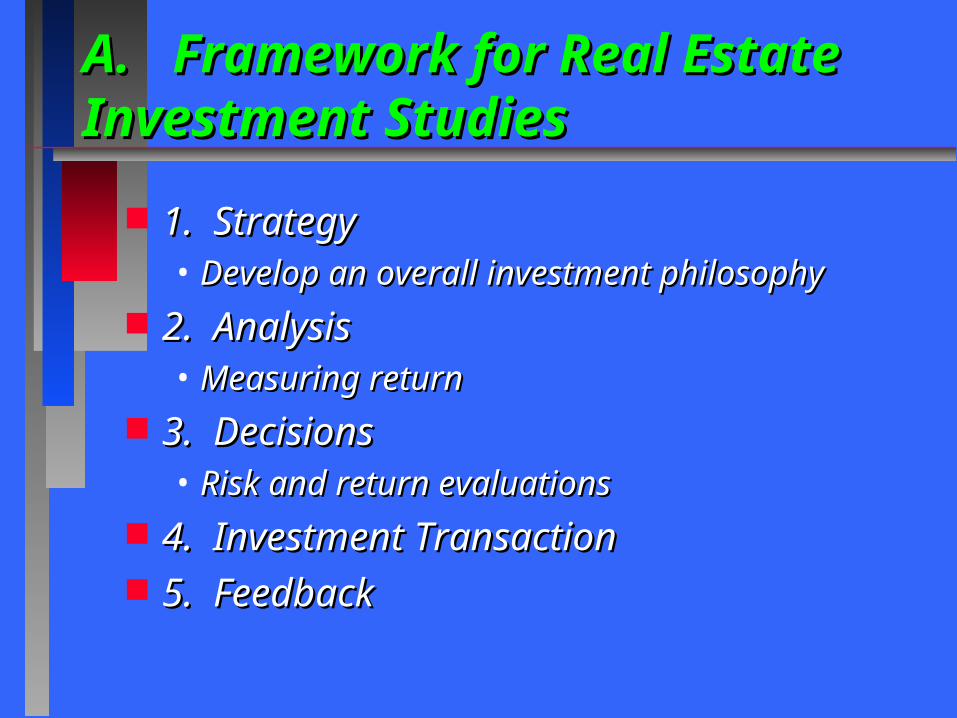
A. Framework for Real Estate A. Framework for Real Estate Investment StudiesInvestment Studies
1. Strategy1. Strategy• Develop an overall investment philosophyDevelop an overall investment philosophy
2. Analysis2. Analysis• Measuring returnMeasuring return
3. Decisions3. Decisions• Risk and return evaluationsRisk and return evaluations
4. Investment Transaction4. Investment Transaction 5. Feedback5. Feedback
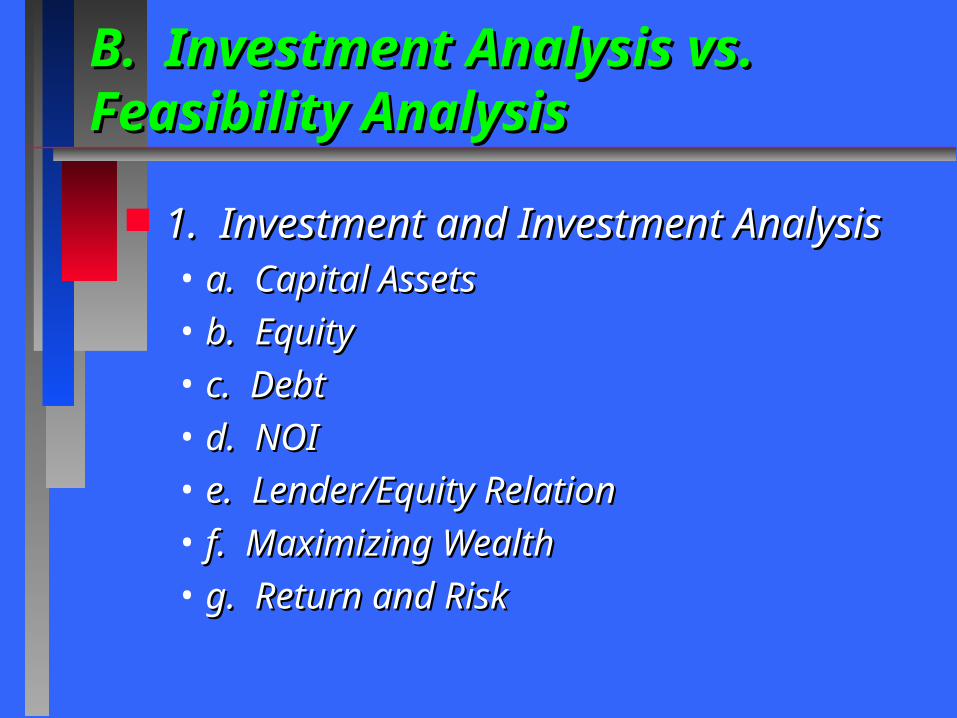
B. Investment Analysis vs. B. Investment Analysis vs. Feasibility AnalysisFeasibility Analysis
1. Investment and Investment Analysis1. Investment and Investment Analysis• a. Capital Assetsa. Capital Assets• b. Equityb. Equity• c. Debtc. Debt• d. NOId. NOI• e. Lender/Equity Relatione. Lender/Equity Relation• f. Maximizing Wealthf. Maximizing Wealth• g. Return and Riskg. Return and Risk
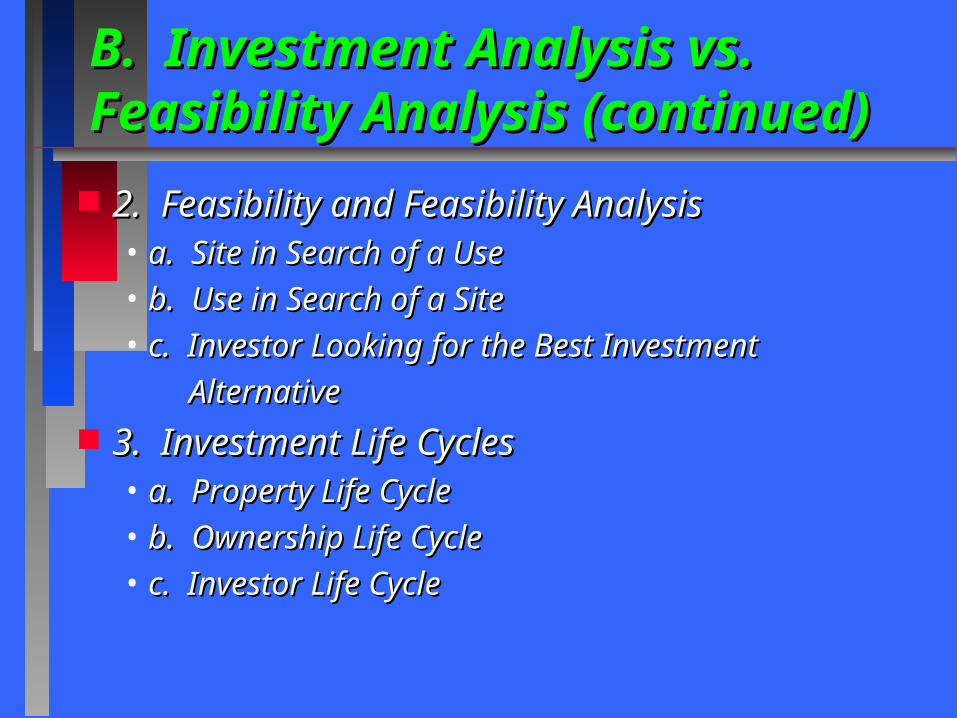
B. Investment Analysis vs. B. Investment Analysis vs. Feasibility Analysis (continued)Feasibility Analysis (continued)
2. Feasibility and Feasibility Analysis2. Feasibility and Feasibility Analysis• a. Site in Search of a Usea. Site in Search of a Use• b. Use in Search of a Siteb. Use in Search of a Site• c. Investor Looking for the Best Investment c. Investor Looking for the Best Investment
AlternativeAlternative 3. Investment Life Cycles3. Investment Life Cycles• a. Property Life Cyclea. Property Life Cycle• b. Ownership Life Cycleb. Ownership Life Cycle• c. Investor Life Cyclec. Investor Life Cycle
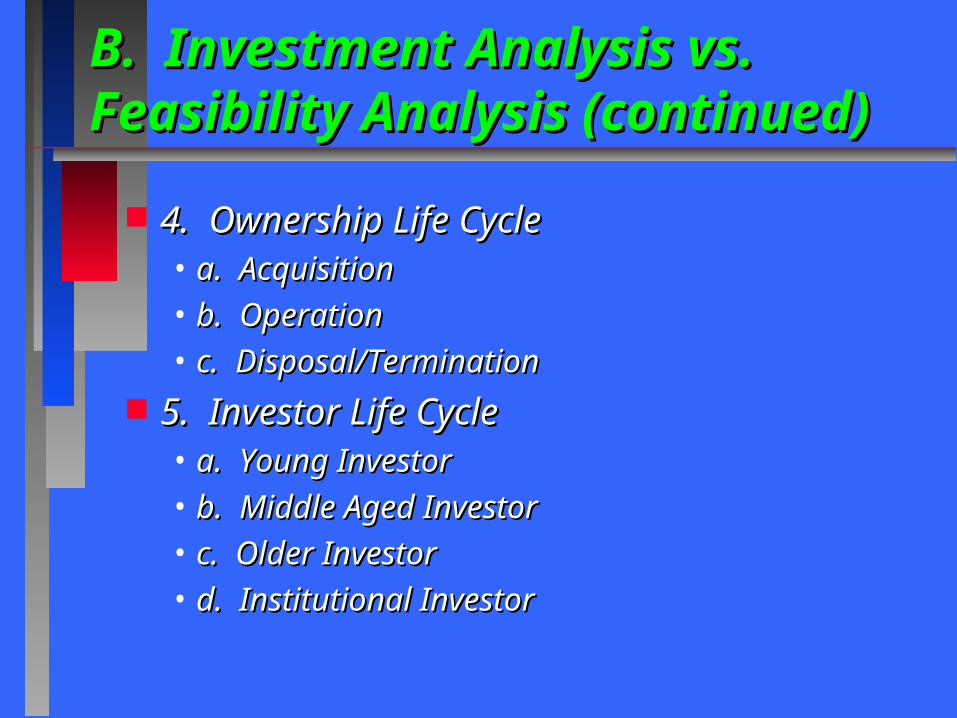
B. Investment Analysis vs. B. Investment Analysis vs. Feasibility Analysis (continued)Feasibility Analysis (continued)
4. Ownership Life Cycle4. Ownership Life Cycle• a. Acquisitiona. Acquisition• b. Operationb. Operation• c. Disposal/Terminationc. Disposal/Termination
5. Investor Life Cycle5. Investor Life Cycle• a. Young Investora. Young Investor• b. Middle Aged Investorb. Middle Aged Investor• c. Older Investorc. Older Investor• d. Institutional Investord. Institutional Investor
Real Estate InvestmentsReal Estate Investments
Topic 12Topic 12
III. Decision Making Approaches III. Decision Making Approaches to Real Estate Investmentto Real Estate Investment
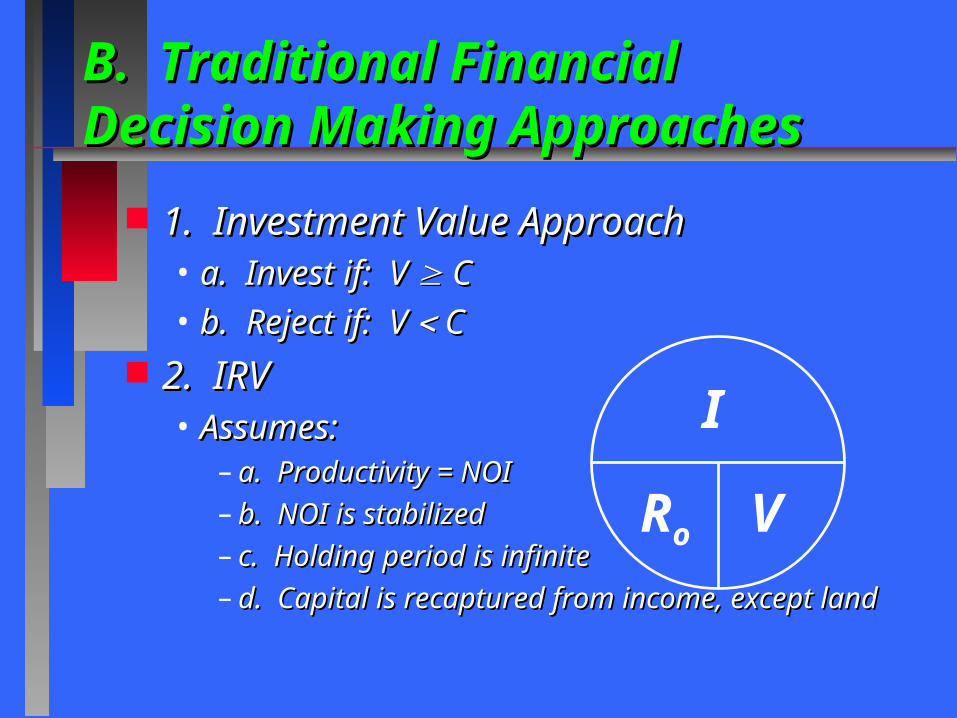
B. Traditional Financial Decision B. Traditional Financial Decision Making ApproachesMaking Approaches
1. Investment Value Approach1. Investment Value Approach• a. Invest if: V a. Invest if: V C C• b. Reject if: V b. Reject if: V C C
2. IRV2. IRV• Assumes:Assumes:– a. Productivity = NOIa. Productivity = NOI– b. NOI is stabilizedb. NOI is stabilized– c. Holding period is infinitec. Holding period is infinite– d. Capital is recaptured from income, except land d. Capital is recaptured from income, except land
I
Ro V
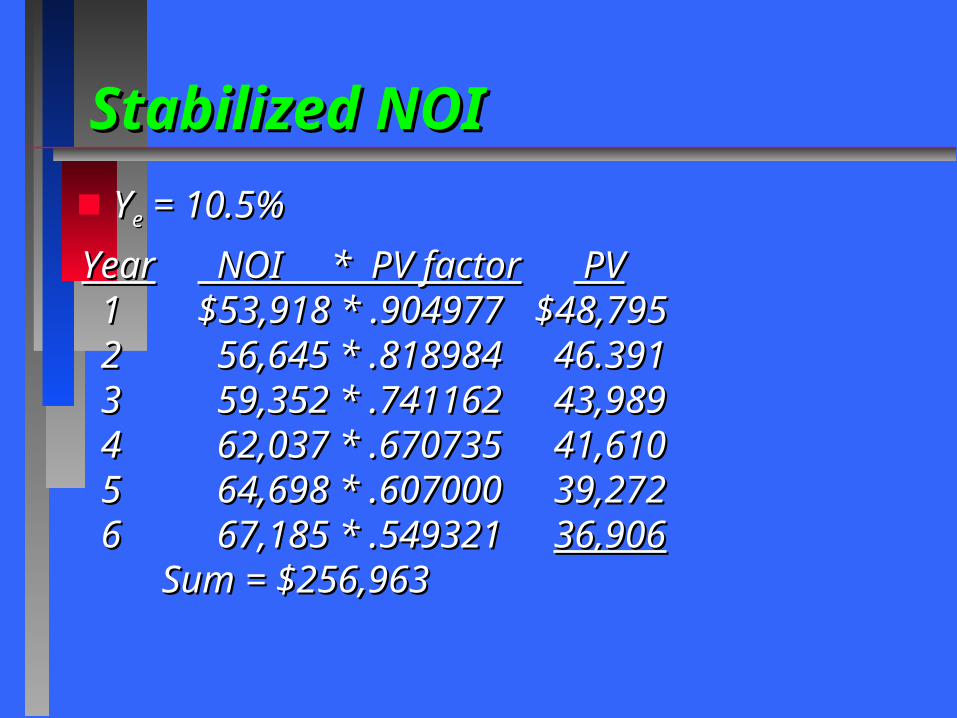
Stabilized NOIStabilized NOI
YYee = 10.5% = 10.5%
YearYear NOI * PV factor NOI * PV factor PV PV 11 $53,918 * .904977$53,918 * .904977 $48,795$48,795 22 56,645 * .818984 56,645 * .818984 46.391 46.391 33 59,352 * .741162 59,352 * .741162 43,989 43,989 44 62,037 * .670735 62,037 * .670735 41,610 41,610 55 64,698 * .607000 64,698 * .607000 39,272 39,272 66 67,185 * .549321 67,185 * .549321 36,90636,906
Sum = $256,963 Sum = $256,963
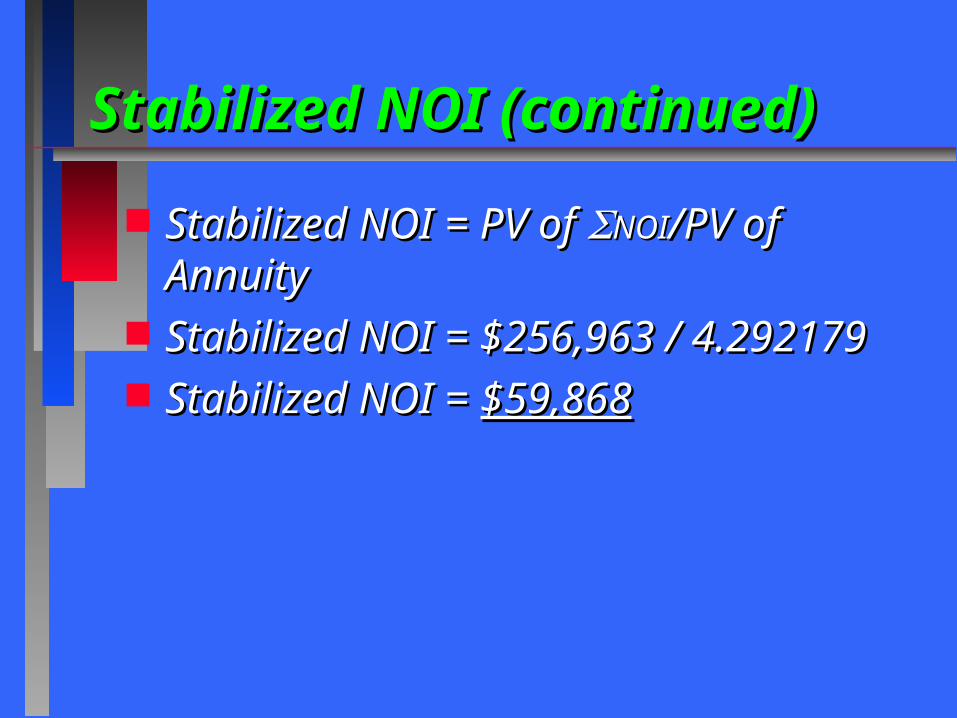
Stabilized NOI (continued)Stabilized NOI (continued)
Stabilized NOI = PV of Stabilized NOI = PV of NOINOI/PV of /PV of AnnuityAnnuity
Stabilized NOI = $256,963 / 4.292179Stabilized NOI = $256,963 / 4.292179 Stabilized NOI = Stabilized NOI = $59,868$59,868
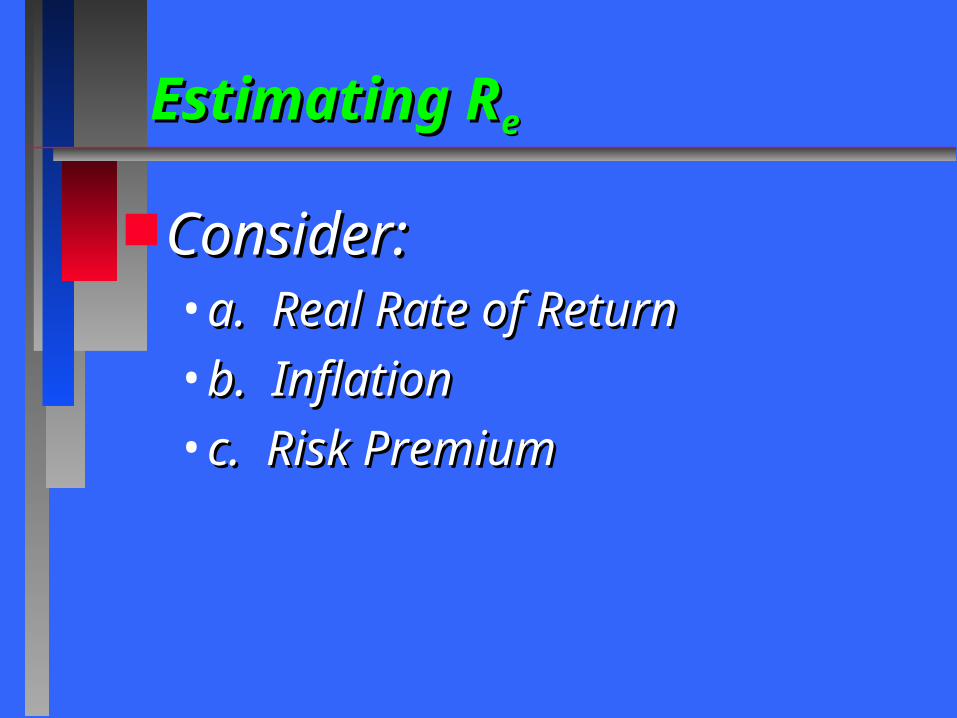
Estimating REstimating Ree
Consider:Consider:• a. Real Rate of Returna. Real Rate of Return
• b. Inflationb. Inflation
• c. Risk Premiumc. Risk Premium
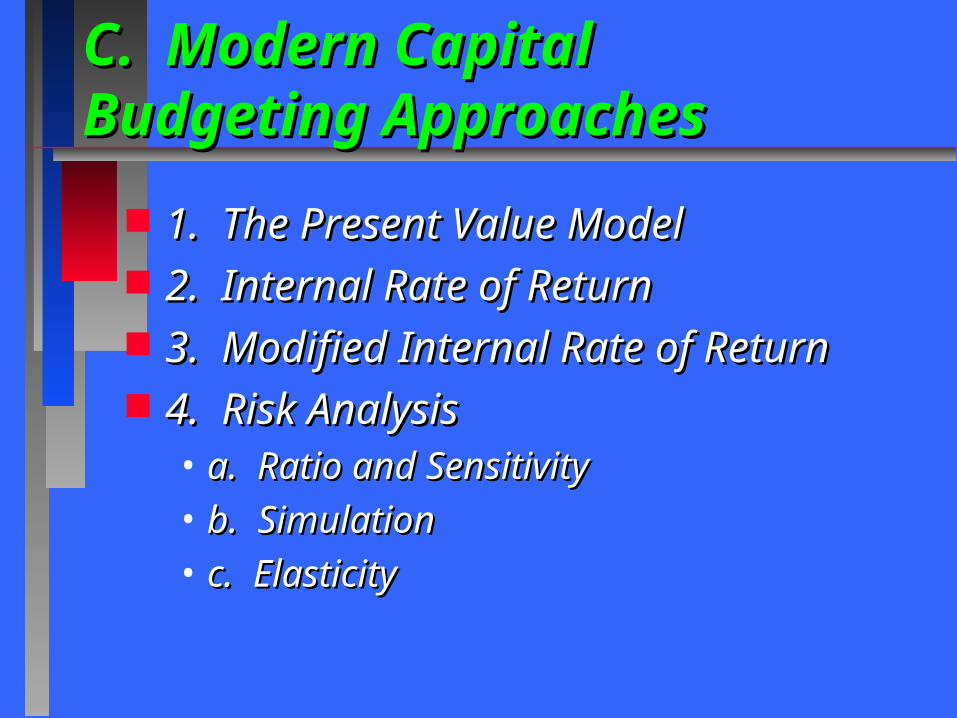
C. Modern Capital Budgeting C. Modern Capital Budgeting ApproachesApproaches
1. The Present Value Model1. The Present Value Model 2. Internal Rate of Return2. Internal Rate of Return 3. Modified Internal Rate of Return3. Modified Internal Rate of Return 4. Risk Analysis4. Risk Analysis• a. Ratio and Sensitivitya. Ratio and Sensitivity• b. Simulationb. Simulation• c. Elasticityc. Elasticity
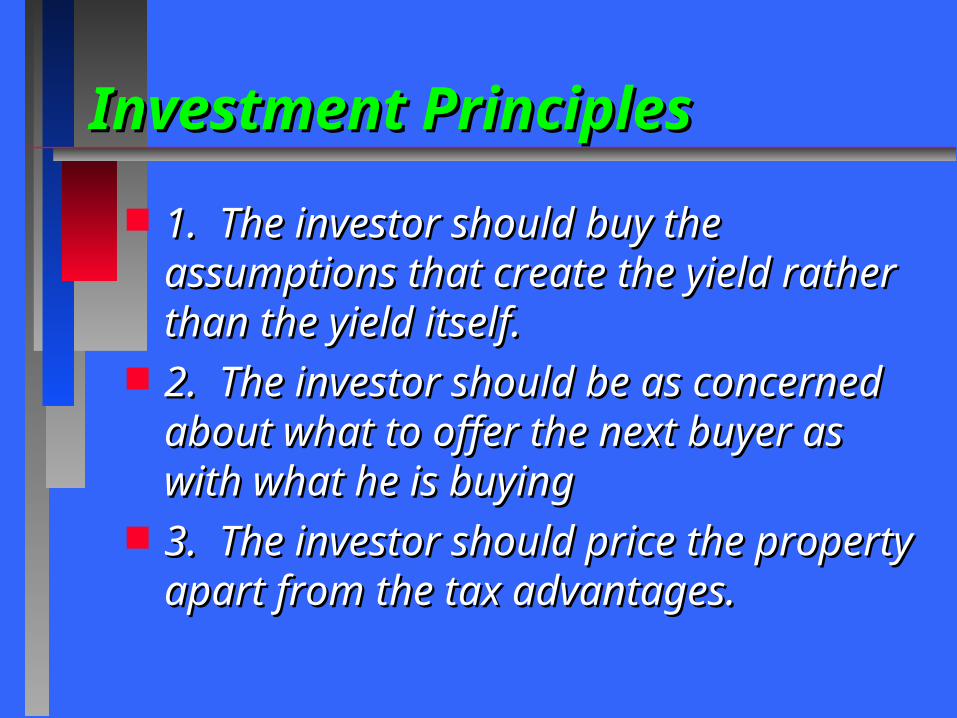
Investment PrinciplesInvestment Principles
1. The investor should buy the 1. The investor should buy the assumptions that create the yield rather assumptions that create the yield rather than the yield itself.than the yield itself.
2. The investor should be as concerned 2. The investor should be as concerned about what to offer the next buyer as about what to offer the next buyer as with what he is buyingwith what he is buying
3. The investor should price the 3. The investor should price the property apart from the tax advantages.property apart from the tax advantages.
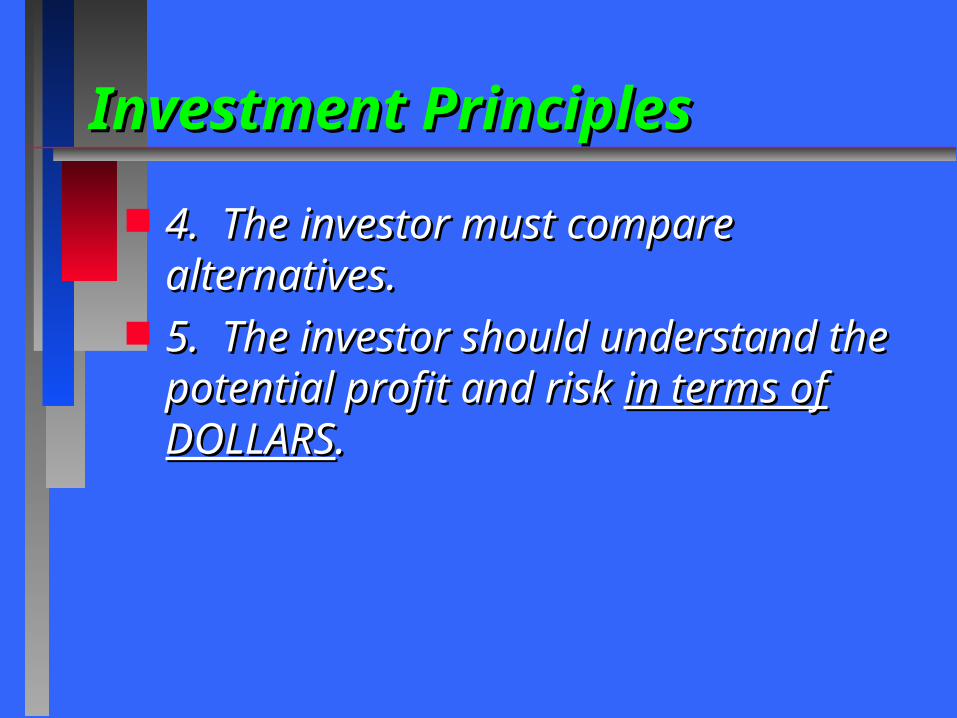
Investment PrinciplesInvestment Principles
4. The investor must compare 4. The investor must compare alternatives.alternatives.
5. The investor should understand the 5. The investor should understand the potential profit and risk potential profit and risk in terms of in terms of DOLLARSDOLLARS..
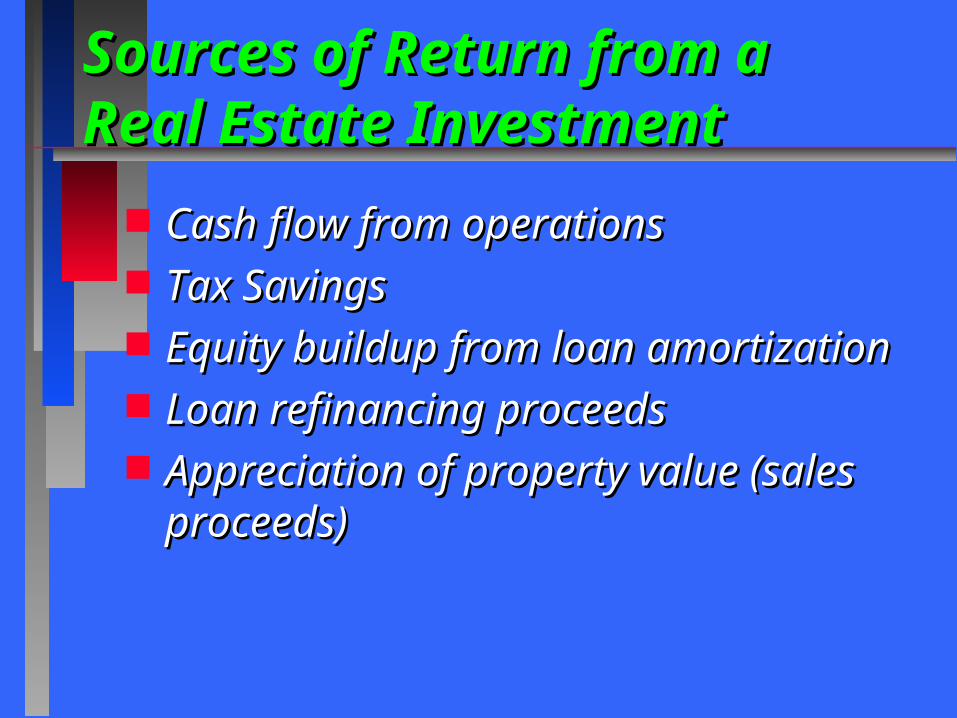
Sources of Return from aSources of Return from aReal Estate InvestmentReal Estate Investment
Cash flow from operationsCash flow from operations Tax SavingsTax Savings Equity buildup from loan amortizationEquity buildup from loan amortization Loan refinancing proceedsLoan refinancing proceeds Appreciation of property value (sales Appreciation of property value (sales
proceeds)proceeds)
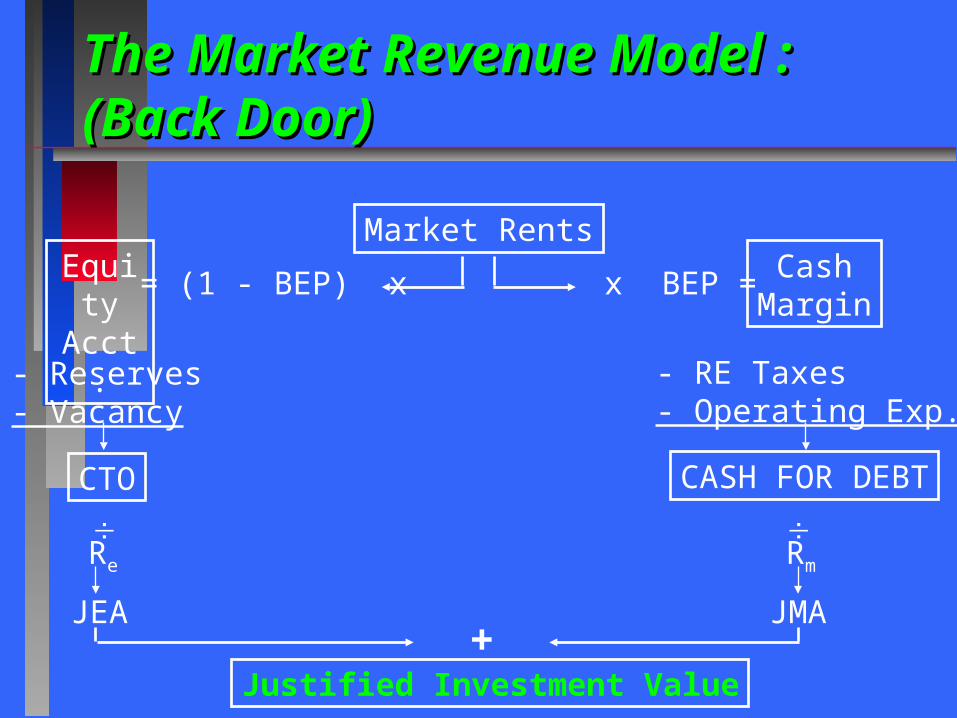
The Market Revenue Model :The Market Revenue Model :(Back Door)(Back Door)
Market RentsEquityAcct.
CashMargin
= (1 - BEP) x x BEP =
- Reserves- Vacancy
- RE Taxes- Operating Exp.
CTO CASH FOR DEBT
Re Rm
JEA JMA+
Justified Investment Value
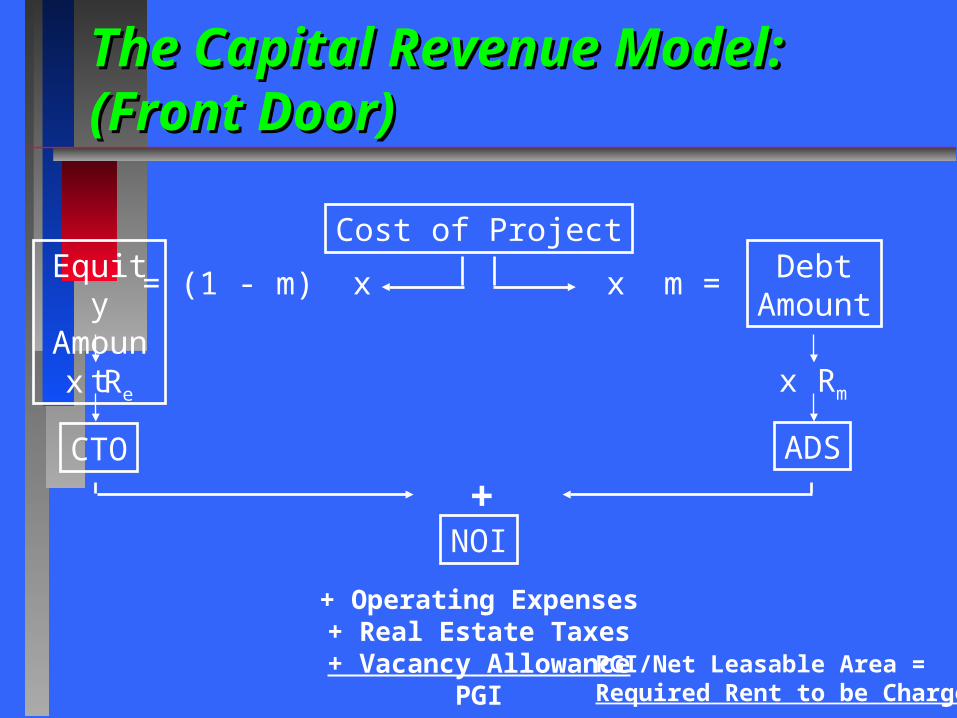
The Capital Revenue Model: The Capital Revenue Model: (Front Door)(Front Door)
Cost of ProjectEquity
AmountDebt
Amount= (1 - m) x x m =
x Re x Rm
CTO ADS
+NOI
+ Operating Expenses+ Real Estate Taxes
+ Vacancy AllowancePGI
PGI/Net Leasable Area = Required Rent to be Charged
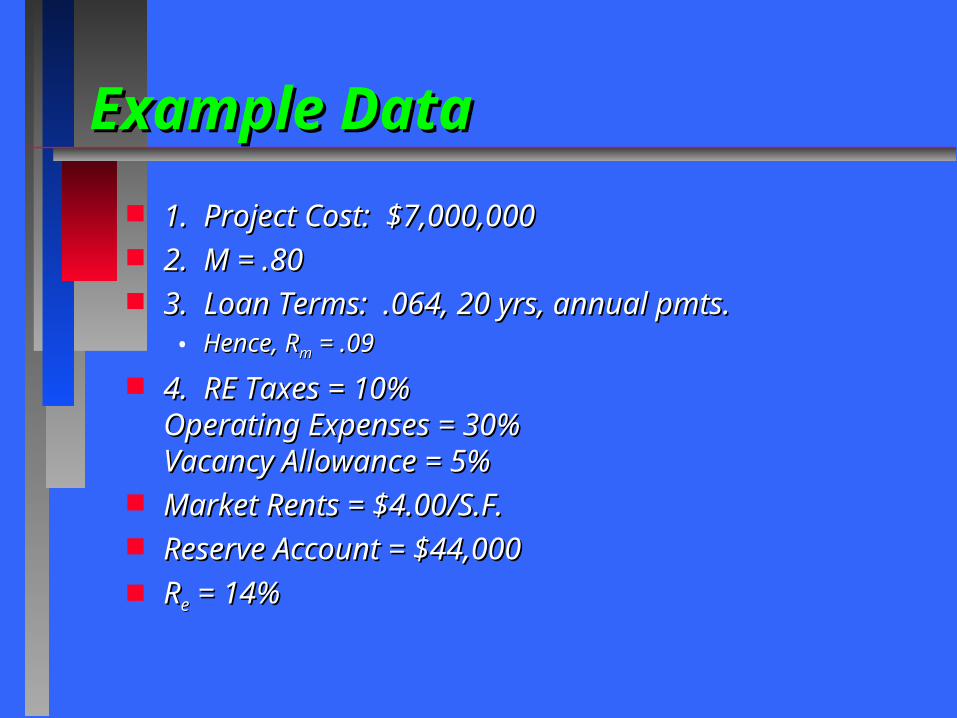
Example DataExample Data
1. Project Cost: $7,000,0001. Project Cost: $7,000,000 2. M = .802. M = .80 3. Loan Terms: .064, 20 yrs, annual pmts.3. Loan Terms: .064, 20 yrs, annual pmts.
• Hence, RHence, Rmm = .09 = .09
4. RE Taxes = 10%4. RE Taxes = 10%Operating Expenses = 30%Operating Expenses = 30%Vacancy Allowance = 5%Vacancy Allowance = 5%
Market Rents = $4.00/S.F.Market Rents = $4.00/S.F. Reserve Account = $44,000Reserve Account = $44,000 RRee = 14% = 14%
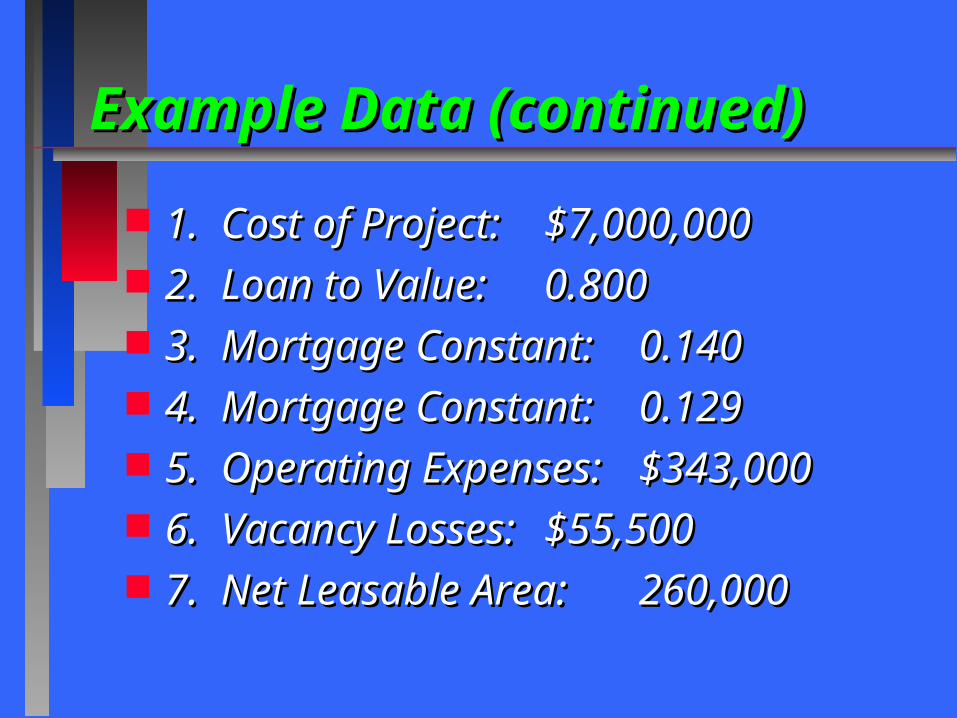
Example Data (continued)Example Data (continued)
1. Cost of Project:1. Cost of Project: $7,000,000$7,000,000 2. Loan to Value:2. Loan to Value: 0.8000.800 3. Mortgage Constant:3. Mortgage Constant: 0.1400.140 4. Mortgage Constant:4. Mortgage Constant: 0.1290.129 5. Operating Expenses:5. Operating Expenses: $343,000$343,000 6. Vacancy Losses:6. Vacancy Losses: $55,500$55,500 7. Net Leasable Area:7. Net Leasable Area: 260,000260,000
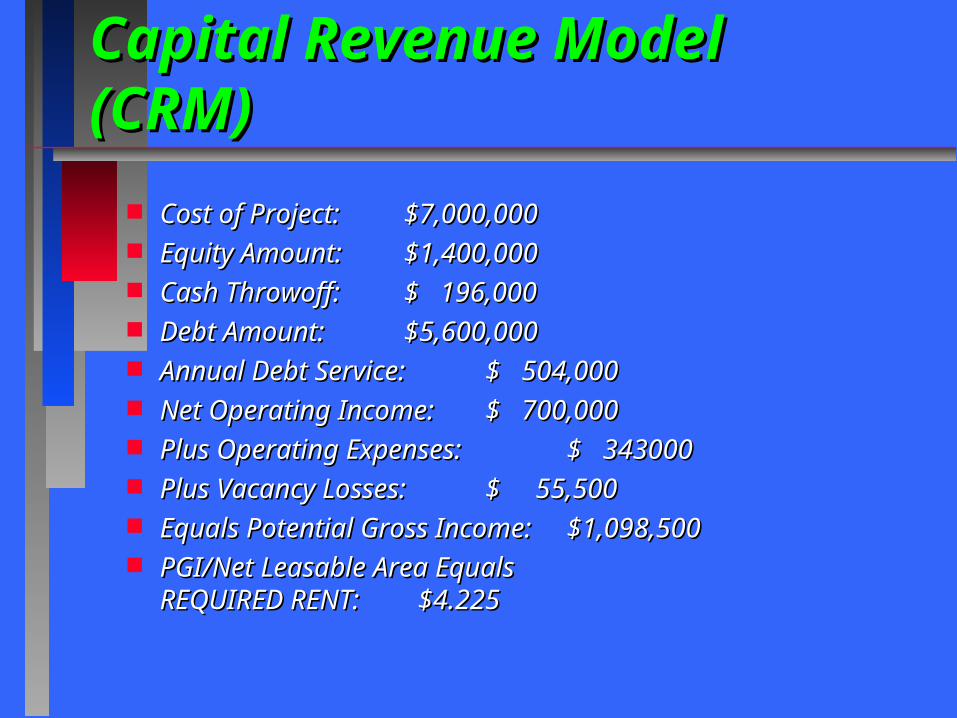
Capital Revenue Model (CRM)Capital Revenue Model (CRM)
Cost of Project:Cost of Project: $7,000,000$7,000,000 Equity Amount:Equity Amount: $1,400,000$1,400,000 Cash Throwoff:Cash Throwoff: $ 196,000$ 196,000 Debt Amount:Debt Amount: $5,600,000$5,600,000 Annual Debt Service:Annual Debt Service: $ 504,000$ 504,000 Net Operating Income:Net Operating Income: $ 700,000$ 700,000 Plus Operating Expenses:Plus Operating Expenses: $ 343000$ 343000 Plus Vacancy Losses:Plus Vacancy Losses: $ 55,500$ 55,500 Equals Potential Gross Income:Equals Potential Gross Income: $1,098,500$1,098,500 PGI/Net Leasable Area EqualsPGI/Net Leasable Area Equals
REQUIRED RENT:REQUIRED RENT: $4.225 $4.225
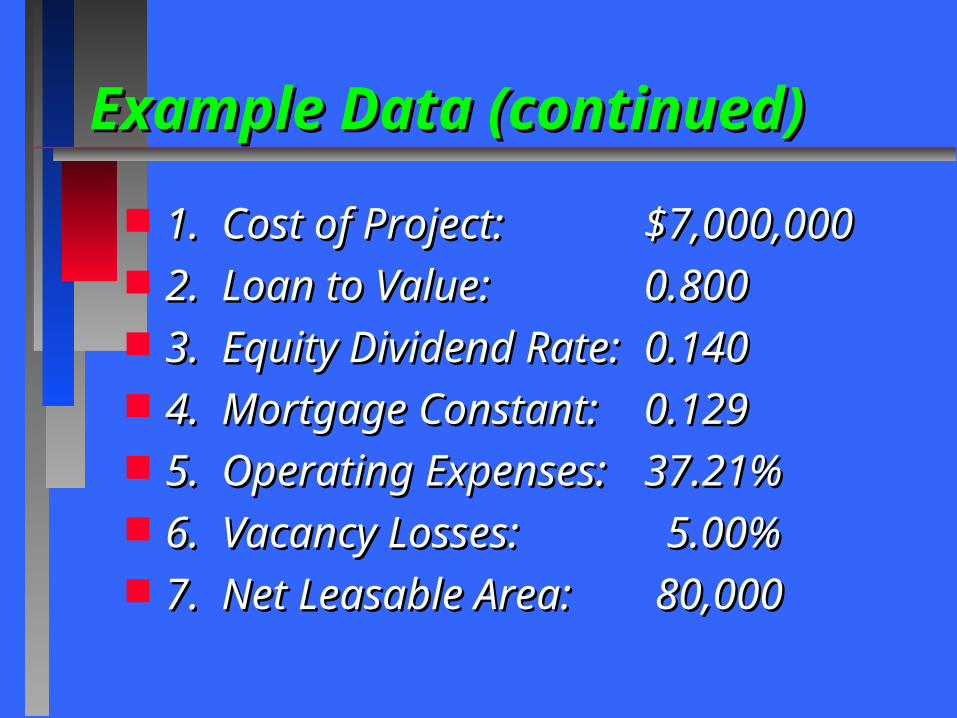
Example Data (continued)Example Data (continued)
1. Cost of Project:1. Cost of Project: $7,000,000$7,000,000 2. Loan to Value:2. Loan to Value: 0.8000.800 3. Equity Dividend Rate:3. Equity Dividend Rate: 0.1400.140 4. Mortgage Constant:4. Mortgage Constant: 0.1290.129 5. Operating Expenses:5. Operating Expenses: 37.21%37.21% 6. Vacancy Losses:6. Vacancy Losses: 5.00% 5.00% 7. Net Leasable Area:7. Net Leasable Area: 80,000 80,000
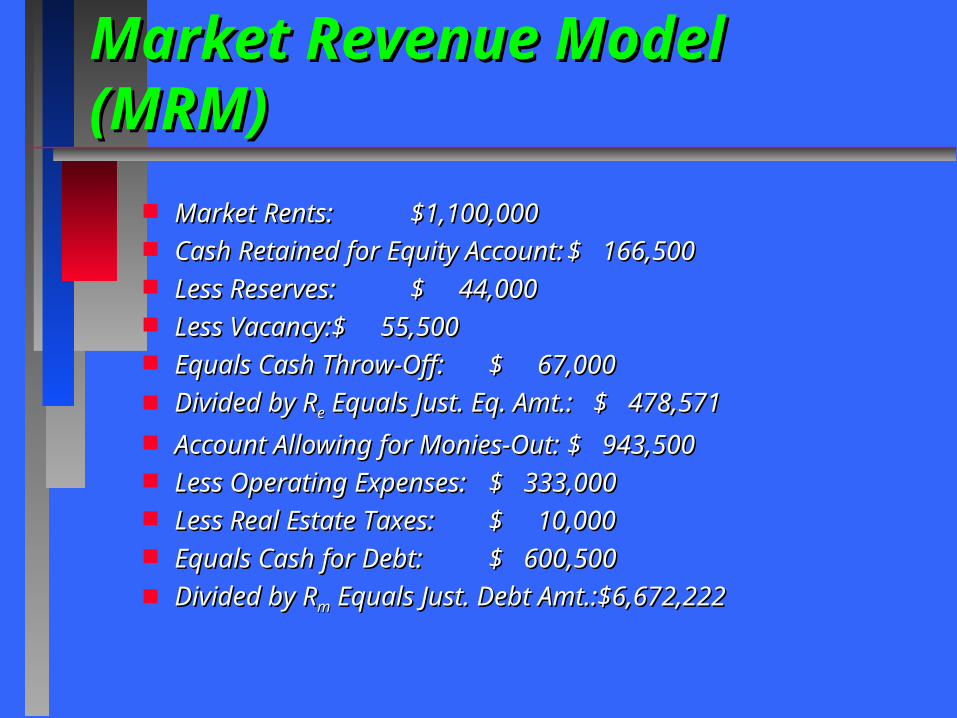
Market Revenue Model (MRM)Market Revenue Model (MRM)
Market Rents:Market Rents: $1,100,000$1,100,000 Cash Retained for Equity Account:Cash Retained for Equity Account: $ 166,500$ 166,500 Less Reserves:Less Reserves: $ 44,000$ 44,000 Less Vacancy:Less Vacancy: $ 55,500$ 55,500 Equals Cash Throw-Off:Equals Cash Throw-Off: $ 67,000$ 67,000 Divided by RDivided by Ree Equals Just. Eq. Amt.: $ 478,571 Equals Just. Eq. Amt.: $ 478,571 Account Allowing for Monies-Out:Account Allowing for Monies-Out: $ 943,500$ 943,500 Less Operating Expenses:Less Operating Expenses: $ 333,000$ 333,000 Less Real Estate Taxes:Less Real Estate Taxes: $ 10,000$ 10,000 Equals Cash for Debt:Equals Cash for Debt: $ 600,500$ 600,500 Divided by RDivided by Rmm Equals Just. Debt Amt.:$6,672,222 Equals Just. Debt Amt.:$6,672,222
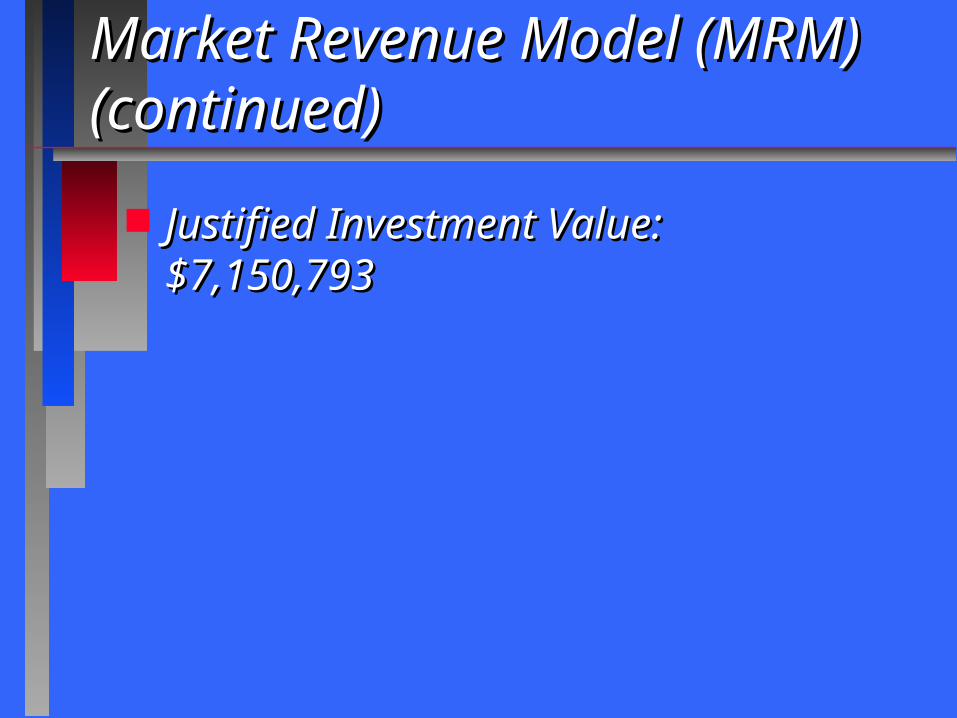
Market Revenue Model (MRM) Market Revenue Model (MRM) (continued)(continued)
Justified Investment Value:Justified Investment Value:$7,150,793$7,150,793