Embed Size (px)
Citation preview
Investment Cycles and Startup Innovation∗
Ramana NandaHarvard Business School
Boston MA
Matthew Rhodes-KropfHarvard Business School
Boston MA
January, 2012
Abstract
We find that VC-backed firms receiving their initial investment in hot mar-kets are less likely to IPO, but conditional on going public are valued higheron the day of their IPO, have more patents and have more citations to theirpatents. Our results suggest that VCs invest in riskier and more innovativestartups in hot markets (rather than just worse firms). This is true even forthe most experienced VCs. Furthermore, our results suggest that the flood ofcapital in hot markets also plays a causal role in shifting investments to morenovel startups - by lowering the cost of experimentation for early stage investorsand allowing them to make riskier, more novel, investments.
JEL Classification: G24, G32, O31
Key Words: Venture Capital, Innovation, Market Cycles, Financing Risk
∗Soldiers Field Road, Boston, MA 02163, USA. Email: [email protected] and [email protected]. Weare grateful to Bo Becker, Shai Bernstein, Michael Ewens, Bill Kerr, Paul Gompers, Robin Greenwood, ThomasHellmann, Josh Lerner, David Scharfstein, Antoinette Schoar and Rick Townsend for fruitful discussion andcomments, and to the seminar participants at MIT, UT Austin, Tuck School of Business, Harvard, Hous-ton University, Northeastern University, University of Lausanne, Notre Dame, Hong Kong University. Wethank Oliver Heimes and Sarah Wolverton for research assistance, and the Division of Faculty Research andDevelopment at HBS and the Kauffman Foundation for financial support. All errors are our own.
1
Investment Cycles and Startup Innovation
Abstract
We find that VC-backed firms receiving their initial investment in hot mar-kets are less likely to IPO, but conditional on going public are valued higheron the day of their IPO, have more patents and have more citations to theirpatents. Our results suggest that VCs invest in riskier and more innovativestartups in hot markets (rather than just worse firms). This is true even forthe most experienced VCs. Furthermore, our results suggest that the flood ofcapital in hot markets also plays a causal role in shifting investments to morenovel startups - by lowering the cost of experimentation for early stage investorsand allowing them to make riskier, more novel, investments.
JEL Classification: G24, G32, O31
Key Words: Venture Capital, Innovation, Market Cycles, Financing Risk
“Our willingness to fail gives us the ability and opportunity to succeed where others
may fear to tread.” - Vinod Khosla on his venture firms innovative success.
I. Introduction
It is well known that the financing available for startups that commercialize new technologies is
extremely volatile. These “investment cycles” have been extensively studied in the literature
on venture capital (Gompers and Lerner (2004), Kaplan and Schoar (2005), Gompers et al.
(2008)), but have also been documented in historical work linking financial market activity to
radical innovations in manufacturing, communications and transportation going back to the
mid 1700s (Kindleberger (1978); Perez (2002)). Conventional wisdom and much of the popular
literature tends to associate these cycles with negative attributes. Herding among investors
is believed to lead to an excess supply of capital in the market (Scharfstein and Stein (1990)),
lowering the discipline of external finance and leading to more “junk” and “me-too” ventures
getting financed in hot markets (Gupta (2000)).
However, an alternative view suggests that periods of heated activity in the financing of
startups may also be associated with better investment opportunities (Gompers et al. (2008),
Pastor and Veronesi (2005)). In addition, Nanda and Rhodes-Kropf (2011) argue that the
abundance of capital in such times may also allow investors to experiment more effectively,
thereby shifting the type of startups that investors finance towards those that are neither
better nor worse but more risky and innovative.
According to this latter view, the abundance of capital associated with investment cycles
may not just be a response to the arrival of new technologies, but may in fact play a critical role
in driving the commercialization and diffusion of new technologies. It also suggests that looking
only at the failure rates for firms funded in hot markets is not sufficient to infer that more
1
“junk” is funded in such times. Greater failures can also result from more experimentation, so
that simultaneously examining the degree of success for the firms that did not fail may be key
to distinguishing between a purely negative view of investment cycles and one that suggests it
also facilitates experimentation.
We study the ultimate outcome for venture capital-backed startups that were first funded
between 1980 and 2004. We find that startups receiving their initial funding in quarters when
many other startups were also funded were less likely to IPO (and more likely to go bankrupt)
than those founded in quarters when fewer firms were funded. Conditional on being successful
enough to go public, however, startups funded in more active periods were valued higher on the
day of their IPO, had a higher number of patents and received more citations to their patents.
Our results suggest that more novel, rather than just “worse” firms, seem to be funded in
boom times.1
We further examine whether more novel firms being funded in boom times is being driven
by the entry of different investors during these periods, or whether the same investors seem
to change their investments across the cycle. When we include investor fixed effects our
estimations suggest that the results are not being driven by uninformed investors entering
during hot times, but rather by the current investors changing their investments. Furthermore,
when we reduce the sample to those investors with greater than 25 investments from 1980-2004
(the most active 7%), we find that even the most experienced investors back riskier, more
innovative startups in boom times.
An obvious question about the observed correlation between hot markets and the funding
of more novel startups is whether the hot markets are purely a response to different investment
opportunities where the type of startup is more novel, or whether the abundance of capital
also changes the type of firm that investors are willing to finance in such times (independent
1The idea that worse projects are funded during hot times is likely true - we are suggesting that simultane-ously riskier, more innovative projects are funded.
2
of the investment opportunities at different points in the cycle).
In order to shed light on this question, we exploit the fact that the supply of capital into
the VC industry is greatly influenced by the asset allocation of limited partners putting money
into ‘private equity’ more broadly. We therefore use an instrumental variables estimation
strategy, where the number of startup firms financed in a given quarter is instrumented with
a variable that measures the number of leveraged buyout funds that were raised in the 5-8
quarters before the firm was funded. The assumption is that the limited partners decisions to
invest in buyout funds are uncorrelated with the opportunity set in early stage venture capital,
since buyout funds focus on turnarounds of existing companies while early stage investors
focus on new technologies and opportunities. However, the fact that limited partners allocate
capital to the ‘private equity’ asset class as a whole leads fundraising by venture and buyout
funds to be associated. Our instrumental variables approach should capture that part of the
VC investments that are due to increases in capital unrelated to the investment opportunities
available at the time for venture capital funds. Lagged buyout fundraising is used as an
instrument to account for the fact that venture funds take 1-3 years to fully invest the capital
in their funds and has the added advantage of further distancing the instrument from current
VC opportunities. Our results are robust to this IV strategy, suggesting that after accounting
for the level of investment due to differential opportunities in the cycle, increased capital in
the industry seems to change the type of startup that VCs fund, towards firms that are more
novel. This finding also holds when we include investor fixed effects, including for the most
experienced investors. Thus, increased capital in the venture industry seems to alter how even
the more experienced venture capitalists invest. These findings are consistent with a view
that an abundance of capital causes investors to increase experimentation, making them more
willing to fund risky and innovative startups in boom times (Nanda and Rhodes-Kropf (2011)).
Thus, our work is related to a growing body of work that considers the role of financial
3
intermediaries on innovation and new venture formation (see Kortum and Lerner (2000), Hell-
mann (2002), Lerner et al. (2011), Sorensen (2007), Tian and Wang (2011), Hochberg et al.
(2007), Hellmann and Puri (2002), Mollica and Zingales (2007), Samila and Sorenson (2011),
Bengtsson and Sensoy (2011)). Our results suggest that rather than just reducing frictions in
the availability of capital for new ventures, investment cycles may play a much more central
role in the diffusion and commercialization of technologies in the economy. Financial market
investment cycles may create innovation cycles.
Our findings are also complementary to recent work examining how R&D by publicly traded
firms responds to relaxed financing constraints (Brown et al. (2009), Li (2012)). While this
work is focused on the intensive margin of R&D, our work examines how shifts in the supply
of capital impacts the choice of firms that investors might choose to fund, thereby having a
bearing on the extensive margin of innovation by young firms in the economy.
Our results are also related to a growing body of work examining the relationship between
the financing environment for firms and startup outcomes. Recent work has cited the fact that
many Fortune 500 firms were founded in recessions as a means of showing how cold markets lead
to the funding of great companies (Stangler (2009)). We note that our results are consistent
with this finding. In fact, we document that firms founded in cold markets are significantly
more likely to go public. However, we propose that hot markets may not only lead to lower
discipline among investors, but also seem to facilitate the experimentation that is needed for
the commercialization and diffusion of radical new technologies. Hot markets allow investors
to take on more risky investments, and may therefore be a critical aspect of the process through
which new technologies are commercialized. Our results are therefore also relevant for policy
makers who may be concerned about regulating the flood of capital during such investment
cycles.
The rest of the paper is structured as follows. In Section 2, we develop our hypothesis
4
around the relationship between financing environment and startup outcomes. In Section 3,
we provide an overview of the Data that we use to test the hypothesis. We outline our empirical
strategy and discuss our main results in Section 4. Section 5 concludes.
II. Financing Environment and Startup Outcomes
Popular accounts of investment cycles have highlighted the large number of failures that stem
from investments made in good times and noted that many successful firms are founded in
recessions. A natural inference is that boom times lower the discipline of external finance
and lead investors to make worse investments when money is chasing deals. The underlying
assumption behind this inference is that as the threshold for new firms to be founded changes in
boom times, so that the marginal firm that gets funded is weaker. Looking at the average pool
of entrants is therefore sufficient to understand how the change in the financing environment
for new firms is associated with the type of firm that is funded.
However, understanding the extent to which a firm is weaker ex ante is often very difficult
for venture capital investors, who may be investing in new technologies, as-yet-non-existent
markets and unproven teams. In fact, much of venture capitalist’s successes seem to stem
from taking informed bets with startups and effectively terminating investments when negative
information is revealed about these firms (Metrick and Yasuda (2010)). For example, Sahlman
(2010) notes that as many as 60% of venture-capitalist’s investments return less that their cost
to the VC (either through bankruptcy or forced sales) and that about 10% of the investments
– typically the IPOs – effectively make all the returns for the funds. Sahlman points to the
example of Sequoia Capital, that in early 1999 “placed a bet on an early stage startup called
Google, that purported to have a better search algorithm” (page 2). Sequoia’s $12.5 million
investment was worth $4 billion when they sold their stake in the firm in 2005, returning 320
5
times their initial cost.
Google was by no means a sure-shot investment for Seqoia Capital in 1999. The search
algorithm space was already dominated by other players such as Yahoo! and Altavista, and
Google may just have turned out to be a “me too” investment. In fact, Bessemer Ventures,
another renowned venture capital firm had the opportunity to invest in Google because a friend
of partner David Cowan had rented her garage to Google’s founders, Larry Page and Sergey
Brin. On being asked to meet with the two founders, Cowan is said to have quipped, “Students?
A new search engine? ... How can I get out of this house without going anywhere near your
garage?” (http://www.bvp.com/portfolio/antiportfolio.aspx) In fact, Bessemer ventures had
the opportunity to, but chose not to invest in several other such incredible successes, including
Intel, Apple, Fedex, Ebay and Paypal.
The examples above point to the fact that while VCs may not be able to easily distinguish
good and bad investment opportunities ex ante, they may have a better sense of how risky a
potential investment might be. An investment that is more risky ex ante will be more likely
to fail. In this sense, an ex post distribution of risky investments can look a lot like an ex
post distribution of worse investments. However, on average the successes in risky investments
will be bigger than less risky ones, while worse investments will do badly regardless. Figure 1
highlights how the ex post distribution of risky investments differs from the ex post distribution
of worse investments. That is, rather than a shift in the distribution of outcomes to the left
(or the right if investments are consistently better), riskier investments lead to a twist in the
distribution of outcomes, with greater failures, but a few, bigger successes. Nanda and Rhodes-
Kropf (2011) propose that investors may fund riskier investments in hot markets as these times
allow investors to experiment more effectively. If this is the case, then we should expect to
see fewer successes and more failures for firms funded in hot markets. However, conditional
on a successful outcome such as an IPO, we would expect firms funded in hot markets to do
6
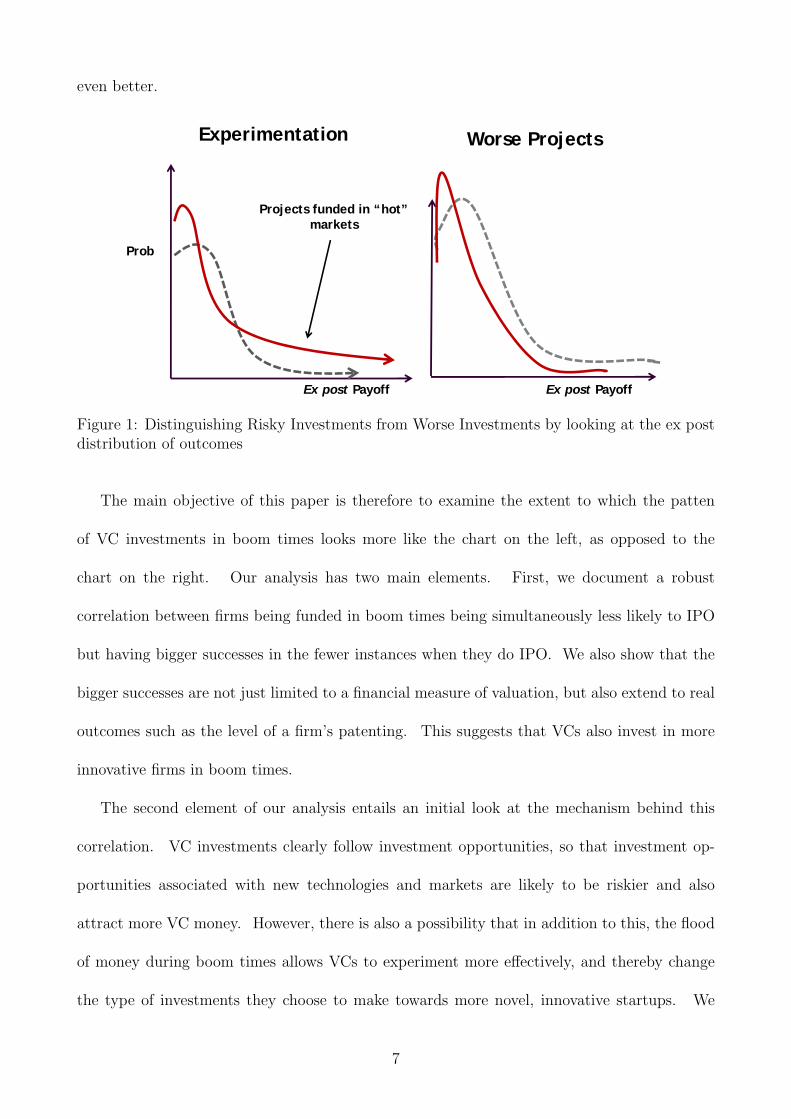
even better.
Experimentation Worse Projects
Prob
Ex post Payoff Ex post Payoff
Projects funded in “hot” markets
Figure 1: Distinguishing Risky Investments from Worse Investments by looking at the ex postdistribution of outcomes
The main objective of this paper is therefore to examine the extent to which the patten
of VC investments in boom times looks more like the chart on the left, as opposed to the
chart on the right. Our analysis has two main elements. First, we document a robust
correlation between firms being funded in boom times being simultaneously less likely to IPO
but having bigger successes in the fewer instances when they do IPO. We also show that the
bigger successes are not just limited to a financial measure of valuation, but also extend to real
outcomes such as the level of a firm’s patenting. This suggests that VCs also invest in more
innovative firms in boom times.
The second element of our analysis entails an initial look at the mechanism behind this
correlation. VC investments clearly follow investment opportunities, so that investment op-
portunities associated with new technologies and markets are likely to be riskier and also
attract more VC money. However, there is also a possibility that in addition to this, the flood
of money during boom times allows VCs to experiment more effectively, and thereby change
the type of investments they choose to make towards more novel, innovative startups. We
7
examine the extent to which this second mechanism of “money changing deals” may also be
at play, by using instrumental variables to untangle the endogeneity in the analysis.
Before proceeding with the results, we first outline the data used in our analysis in Section
III. below.
III. Data
The core of our analyses are based on data from Thompson Venture Economics.2 This dataset
forms the basis of studies by the National Venture Capital Association in the US, as well
as most academic papers on venture capital. We focus our analysis on US based startups,
since data for these firms is most comprehensive. The US is also a good setting for our study
because the institutionalization of the venture industry in the US implies that startups backed
by venture capital firms are likely to comprise the majority of startups that commercialize new
technologies in the US.
We focus our analysis on startups whose first financing event was an early stage (Seed or
Series A) investment from 1980 onwards. This allows us to follow them to see their eventual
outcome. Given that we are interested in following the firms until they exit, we truncate the
sample in 2004 to allow ourselves sufficient time for firms that were first financed in 2004 to
IPO. We therefore focus our analysis on startups receiving their initial early stage investment
over the twenty five year period from 1980 to 2004, but follow these firm’s eventual outcomes
until the end of 2010.
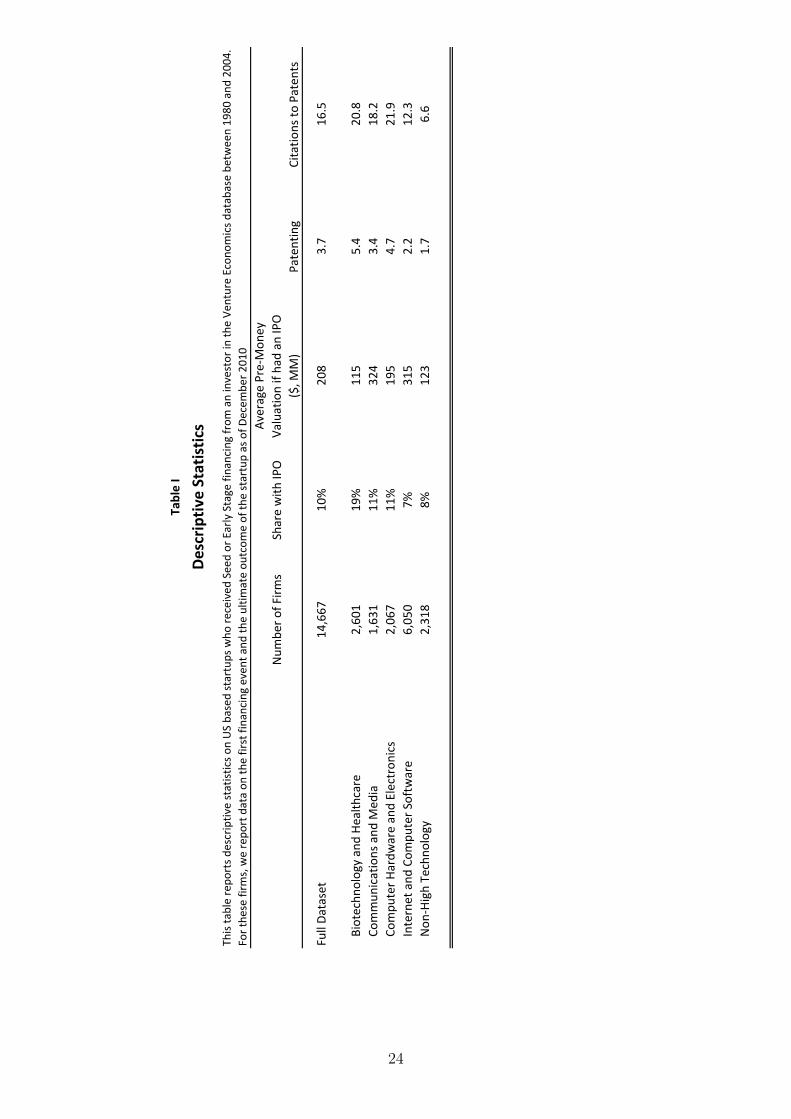
As can be seen from Table 1, there are 14,667 firms that meet our criteria of US-based
startups that received their first early stage financing between 1980 and 2004. The probability
that the firm has an IPO is 10% in the overall sample, but varies from 7% for Internet and
Software startups to 19% for startups in the biotechnology and health care sectors.
2This dataset was formerly known as VentureXpert.
8
As noted in Section II. above, a key way of distinguishing whether worse firms or riskier
firms are being funded in hot markets is that their ex post distribution of outcomes is different.
That is, although both risky and worse investments will lead to fewer successes (and hence a
lower probability of an IPO in the context of our sample), risky investments would imply that
conditional on an IPO, firms funded in hot markets will have a higher economic return than
those funded in cold markets. On the other hand, worse investments would imply that even
conditional on an IPO, firms funded in hot markets had lower value that those funded in cold
markets. In order to examine this claim, a key measure we use is the pre-money valuation at
IPO for firms that eventually had an IPO.3 This data was collected from SDC’s IPO database
and when missing, directly from firms’ SEC filings. As can be seen from Table 1, the average
pre-money valuation for a firm in our sample that had an IPO was $200 M. However, this
varied from over $300 M for Internet and Communications startups to just over $ 100 M for
biotechnology and health care startups.
In order to determine whether the bigger successes were purely financial or also present in
‘real outcomes’, we also examine two measures of firm innovation. The first is a raw count
of patents granted to the firm that were filed in the 3 years following its first funding. The
second measure is the cumulative number of citations to these patents, up to three years from
the patents being granted.4 Both these measures were collected by hand-matching the names
of the firms that IPOed to assignees in the US Patent and Trademark Office (USPTO) patent
database maintained by the NBER. This data set has patent-level records with information
on the filing and grant dates for all patents in the US as well as information on citations to
prior art made by each patent. Matching firms in our sample to the patent database therefore
3Note that the pre-money valuation is the value of the firm before accounting for the new money cominginto the firm at the IPO. Since firms will raise different amounts of money in the IPO, the pre-money allows amore clear-cut comparison of value across firms.
4While the three year windows are somewhat arbitrary, they are chosen so as to minimize the number ofyears that would be dropped from the analysis (given about a 2-3 year delay in the granting of patents fromthe time they are filed).
9
allows us to calculate their patenting in the 3 years immediately following their first funding
and the subsequent citations those patents received in the three years following their grant.
This facilitates the study of the innovations by the startups while they were still private. As
can be seen from Table 1, the average number of patents filed is 3.7 and the average number
of citations is 16.5, but there is again significant variation in both patenting and citation rates
across industry sectors.
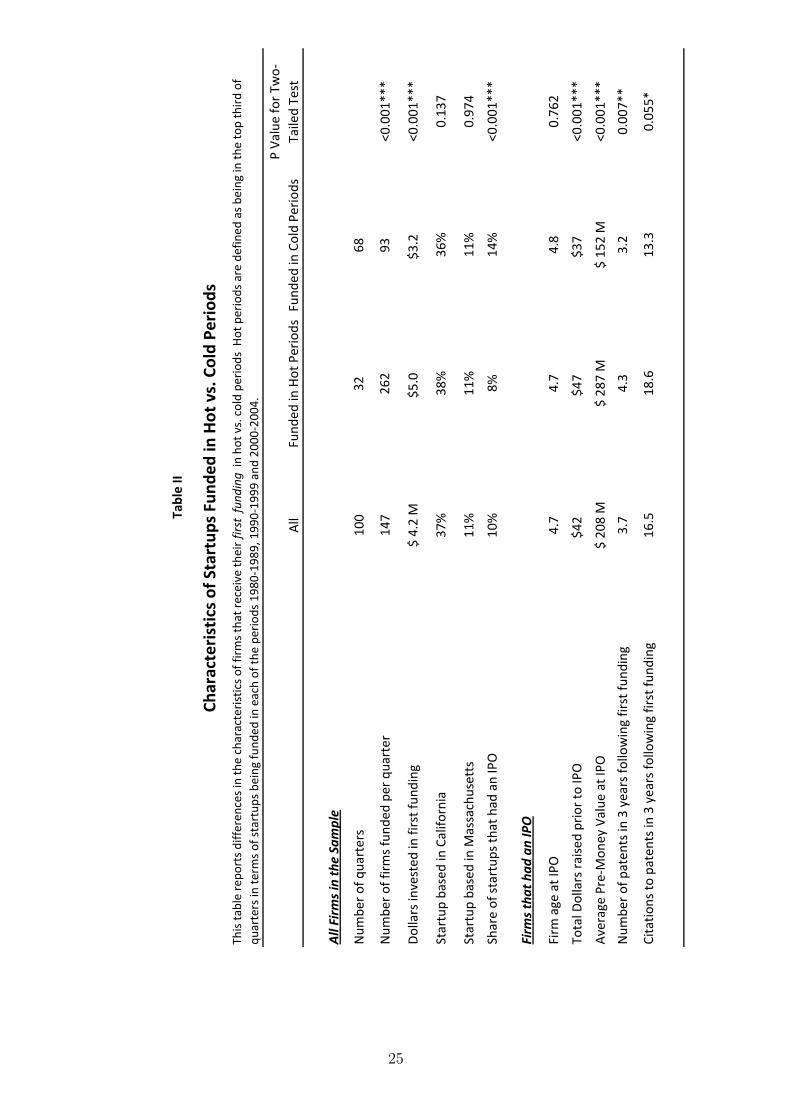
In Table 2, we provide descriptive statistics that show the main patterns in the data. The
descriptive statistics highlight the basic pattern we test in the following section. We find that
startups funded in ‘hot’ quarters were less likely to IPO, despite raising more money in their
first round of funding. Successful firms funded in hot markets raise more money prior to their
IPO, and interestingly, take almost the same time from first funding to IPO. Conditional on
going public, however, firms funded in ‘hot’ markets are valued more on the day of the IPO
and have more patents and citations to their patents.
IV. Regression Results
A. Riskier investments or Worse Investments?
In Tables 3 and 4, we turn to firm-level regressions to examine the relationship between the
financing environment in a the quarter a firm received its first financing, and the ultimate
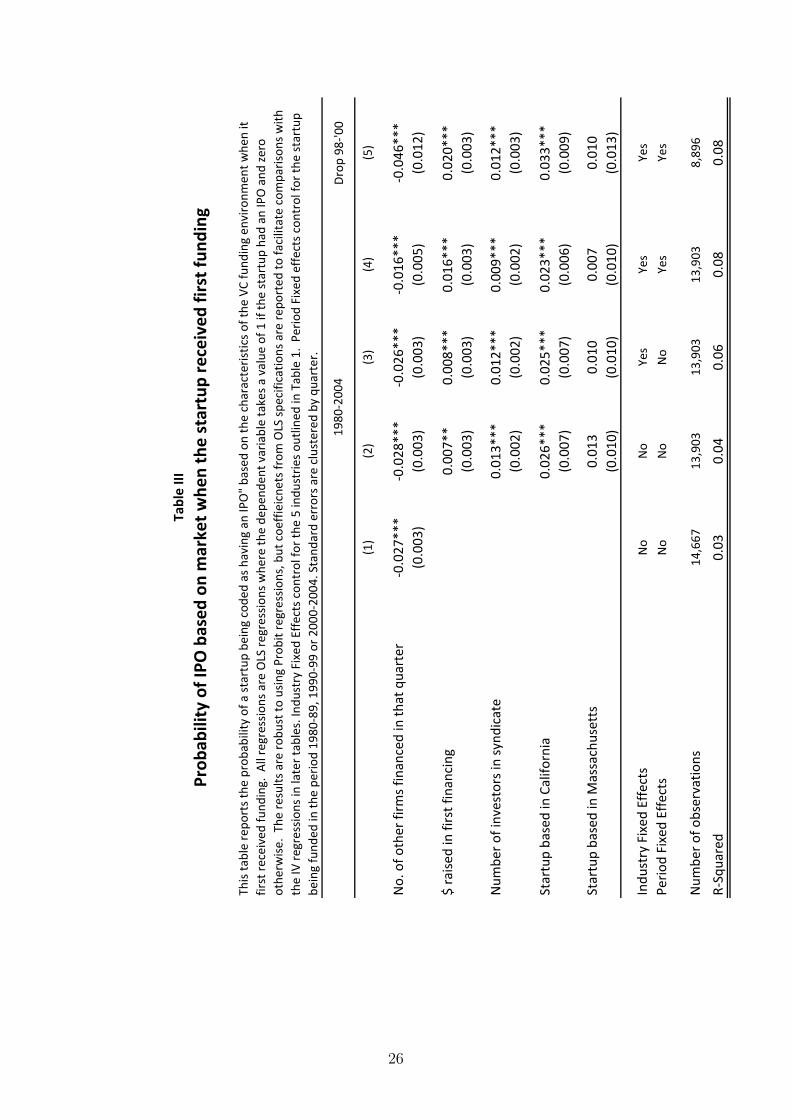
outcome for that firm. Table 3 reports estimates from OLS regressions where the dependent
variable is binary and takes the value 1 if the firm had an IPO.5 The estimations take the form:
Yi = β1OTHFINt + β2Xi + φj + τT + εi (1)
5We have reported the results from OLS regressions, in order to facilitate comparisons with the IV regressionsin following tables. The results are robust to running the regressions as probit models.
10
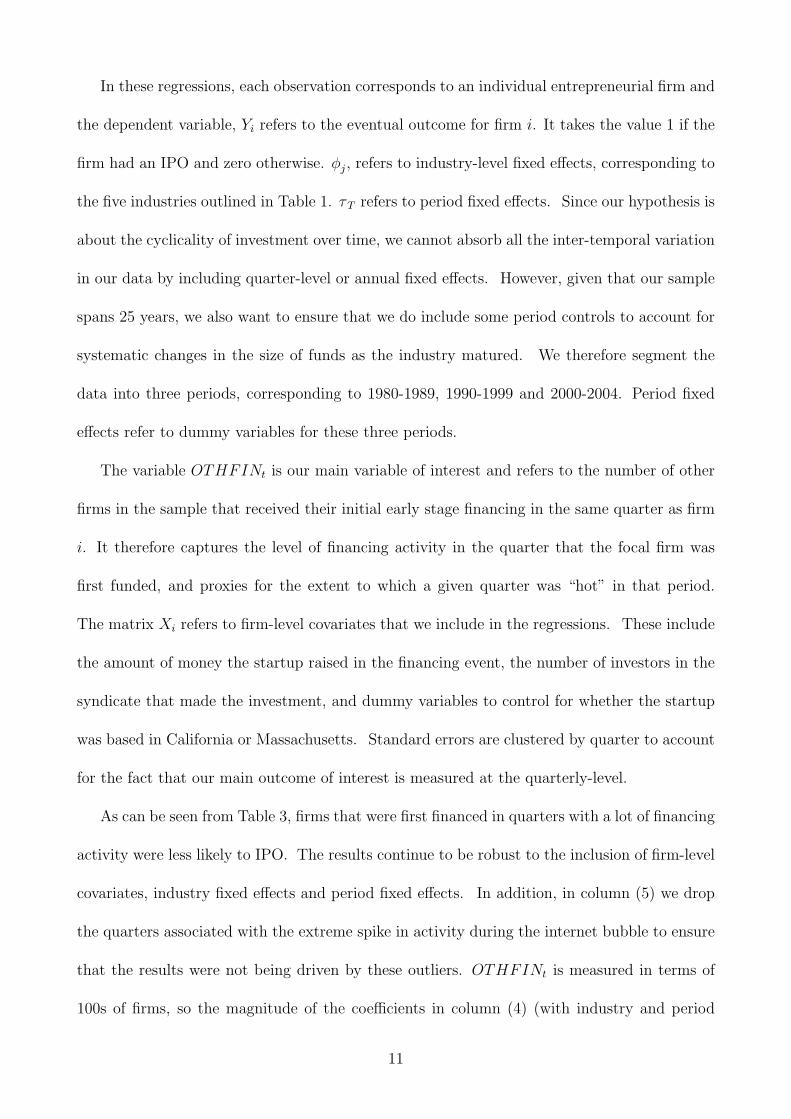
In these regressions, each observation corresponds to an individual entrepreneurial firm and
the dependent variable, Yi refers to the eventual outcome for firm i. It takes the value 1 if the
firm had an IPO and zero otherwise. φj, refers to industry-level fixed effects, corresponding to
the five industries outlined in Table 1. τT refers to period fixed effects. Since our hypothesis is
about the cyclicality of investment over time, we cannot absorb all the inter-temporal variation
in our data by including quarter-level or annual fixed effects. However, given that our sample
spans 25 years, we also want to ensure that we do include some period controls to account for
systematic changes in the size of funds as the industry matured. We therefore segment the
data into three periods, corresponding to 1980-1989, 1990-1999 and 2000-2004. Period fixed
effects refer to dummy variables for these three periods.
The variable OTHFINt is our main variable of interest and refers to the number of other
firms in the sample that received their initial early stage financing in the same quarter as firm
i. It therefore captures the level of financing activity in the quarter that the focal firm was
first funded, and proxies for the extent to which a given quarter was “hot” in that period.
The matrix Xi refers to firm-level covariates that we include in the regressions. These include
the amount of money the startup raised in the financing event, the number of investors in the
syndicate that made the investment, and dummy variables to control for whether the startup
was based in California or Massachusetts. Standard errors are clustered by quarter to account
for the fact that our main outcome of interest is measured at the quarterly-level.
As can be seen from Table 3, firms that were first financed in quarters with a lot of financing
activity were less likely to IPO. The results continue to be robust to the inclusion of firm-level
covariates, industry fixed effects and period fixed effects. In addition, in column (5) we drop
the quarters associated with the extreme spike in activity during the internet bubble to ensure
that the results were not being driven by these outliers. OTHFINt is measured in terms of
100s of firms, so the magnitude of the coefficients in column (4) (with industry and period
11
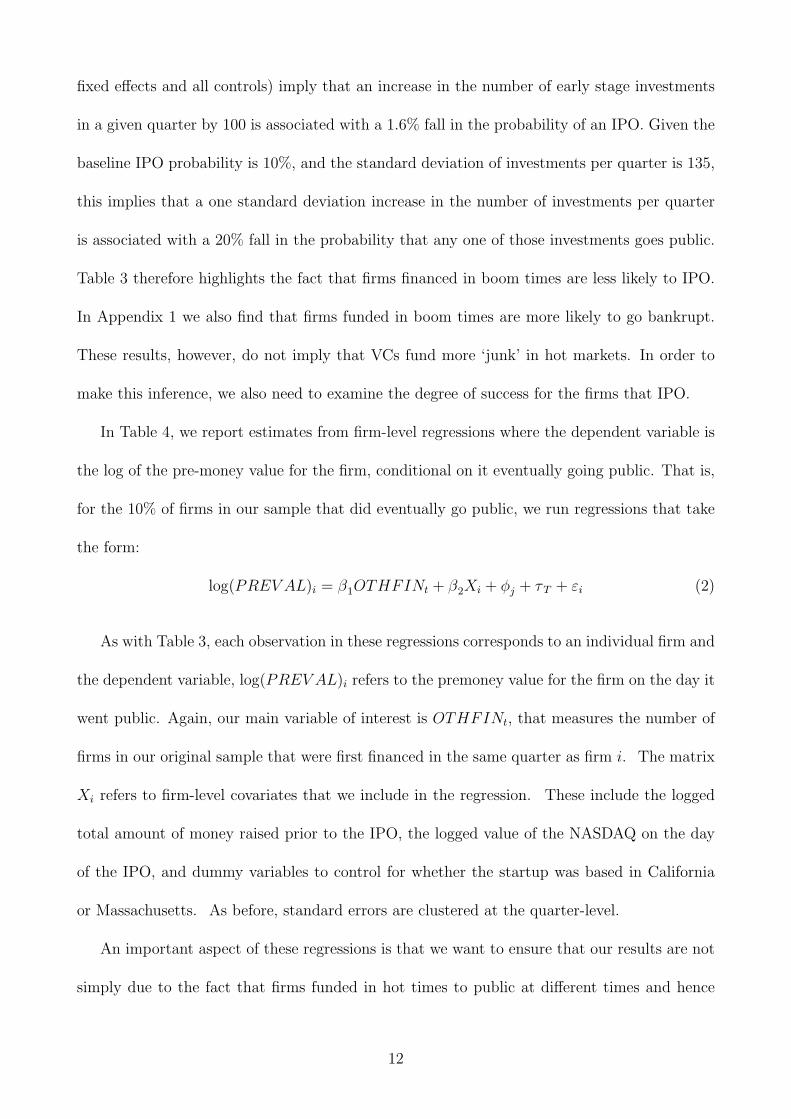
fixed effects and all controls) imply that an increase in the number of early stage investments
in a given quarter by 100 is associated with a 1.6% fall in the probability of an IPO. Given the
baseline IPO probability is 10%, and the standard deviation of investments per quarter is 135,
this implies that a one standard deviation increase in the number of investments per quarter
is associated with a 20% fall in the probability that any one of those investments goes public.
Table 3 therefore highlights the fact that firms financed in boom times are less likely to IPO.
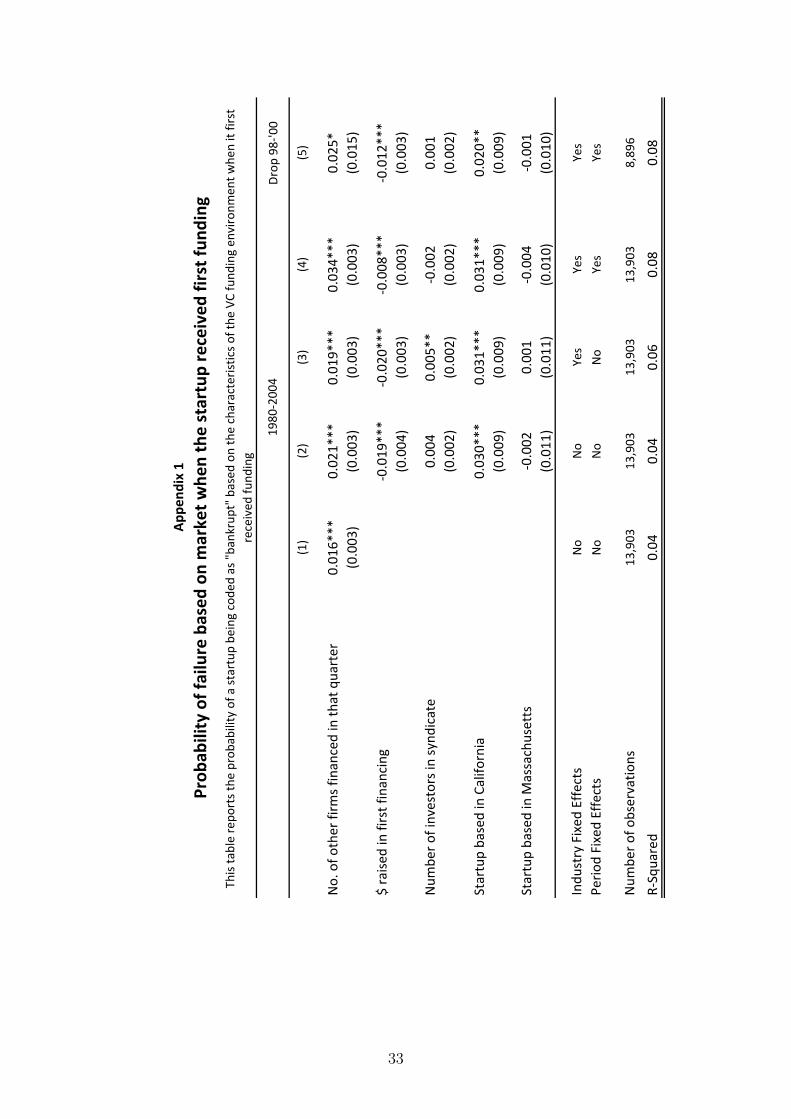
In Appendix 1 we also find that firms funded in boom times are more likely to go bankrupt.
These results, however, do not imply that VCs fund more ‘junk’ in hot markets. In order to
make this inference, we also need to examine the degree of success for the firms that IPO.
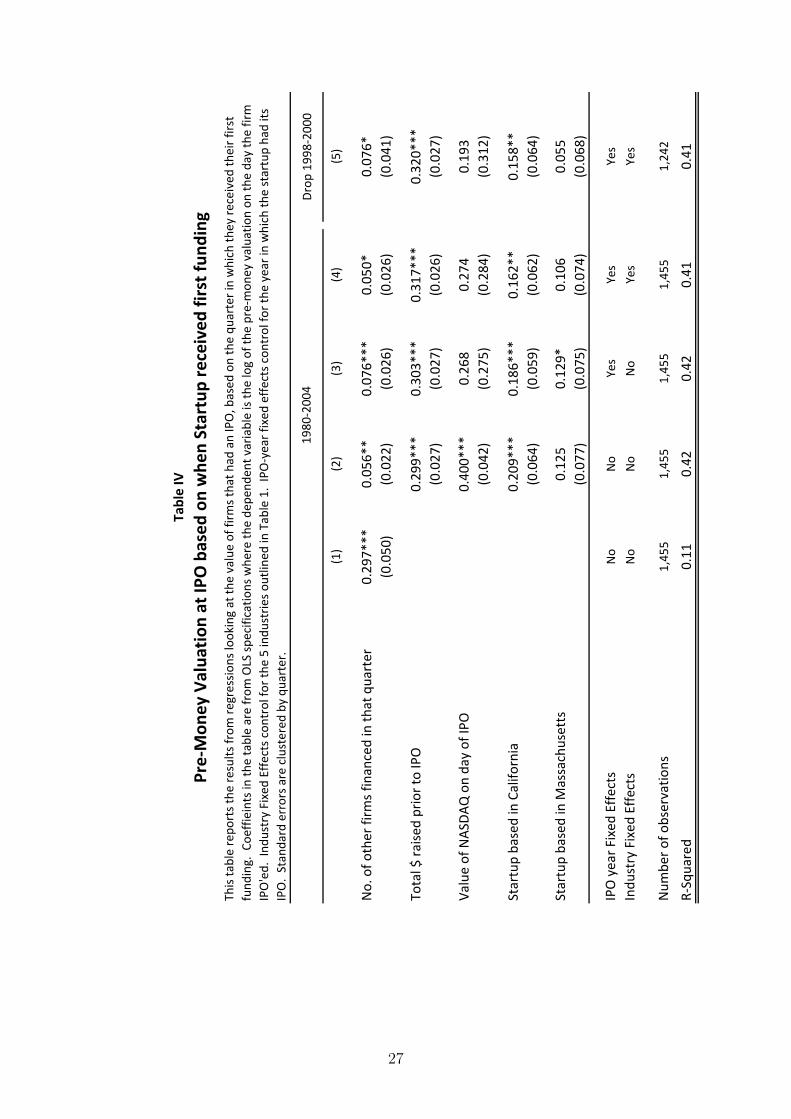
In Table 4, we report estimates from firm-level regressions where the dependent variable is
the log of the pre-money value for the firm, conditional on it eventually going public. That is,
for the 10% of firms in our sample that did eventually go public, we run regressions that take
the form:
log(PREV AL)i = β1OTHFINt + β2Xi + φj + τT + εi (2)
As with Table 3, each observation in these regressions corresponds to an individual firm and
the dependent variable, log(PREV AL)i refers to the premoney value for the firm on the day it
went public. Again, our main variable of interest is OTHFINt, that measures the number of
firms in our original sample that were first financed in the same quarter as firm i. The matrix
Xi refers to firm-level covariates that we include in the regression. These include the logged
total amount of money raised prior to the IPO, the logged value of the NASDAQ on the day
of the IPO, and dummy variables to control for whether the startup was based in California
or Massachusetts. As before, standard errors are clustered at the quarter-level.
An important aspect of these regressions is that we want to ensure that our results are not
simply due to the fact that firms funded in hot times to public at different times and hence
12
face a systematically different threshold of going public. In order to address this concern, we
include IPO-year fixed effects in our regressions. That is, for firms that had an IPO in the
same year, we look at whether those funded in hot markets were likely to have bigger premoney
values, controlling for the amount of money they raised.
As can be seen from Table 4, conditional on going public and controlling for the year in
which they IPO, firms funded in quarters with a lot of funding activity have a higher valuation
on the day of their IPO. This result is robust to controlling for the value of the NASDAQ on
the day of the IPO, as well as the amount of money raised by the firm till that point. The
coefficient on column (4) (with industry and IPO year fixed effects and all controls) implies
that a one standard deviation increase in the funding activity in a given quarter is associated
with a 7%, or $ 15 million increase in the value of a firm (from $208 M to $223 M) if it goes
public.
Our results suggest that VCs fund riskier firms in quarters with more financing activity.
Although these firms have a lower probability of going public, conditional on an IPO, they are
more valuable.
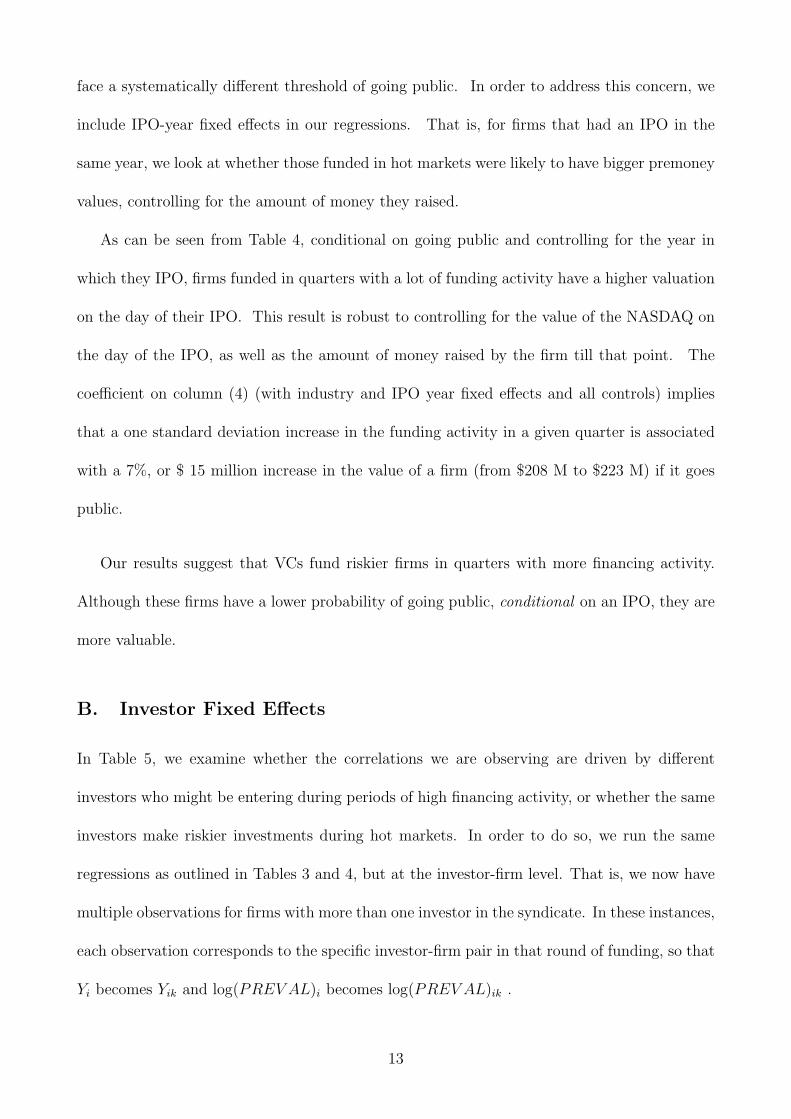
B. Investor Fixed Effects
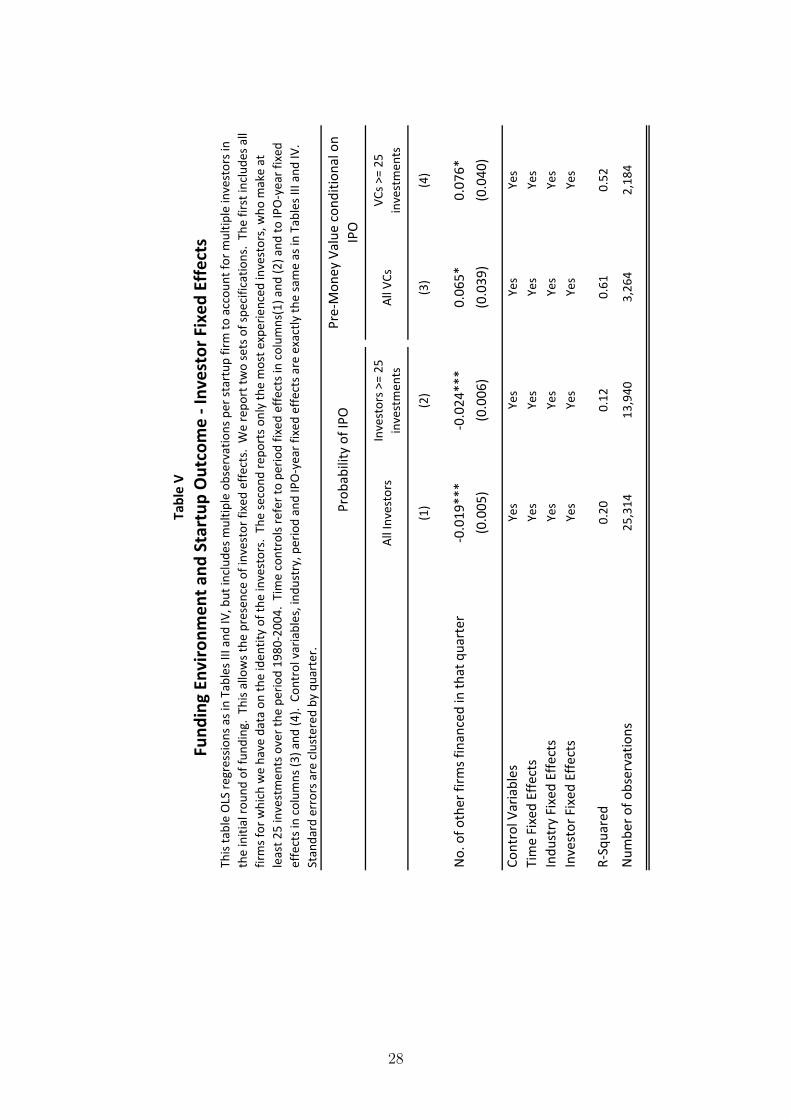
In Table 5, we examine whether the correlations we are observing are driven by different
investors who might be entering during periods of high financing activity, or whether the same
investors make riskier investments during hot markets. In order to do so, we run the same
regressions as outlined in Tables 3 and 4, but at the investor-firm level. That is, we now have
multiple observations for firms with more than one investor in the syndicate. In these instances,
each observation corresponds to the specific investor-firm pair in that round of funding, so that
Yi becomes Yik and log(PREV AL)i becomes log(PREV AL)ik .
13
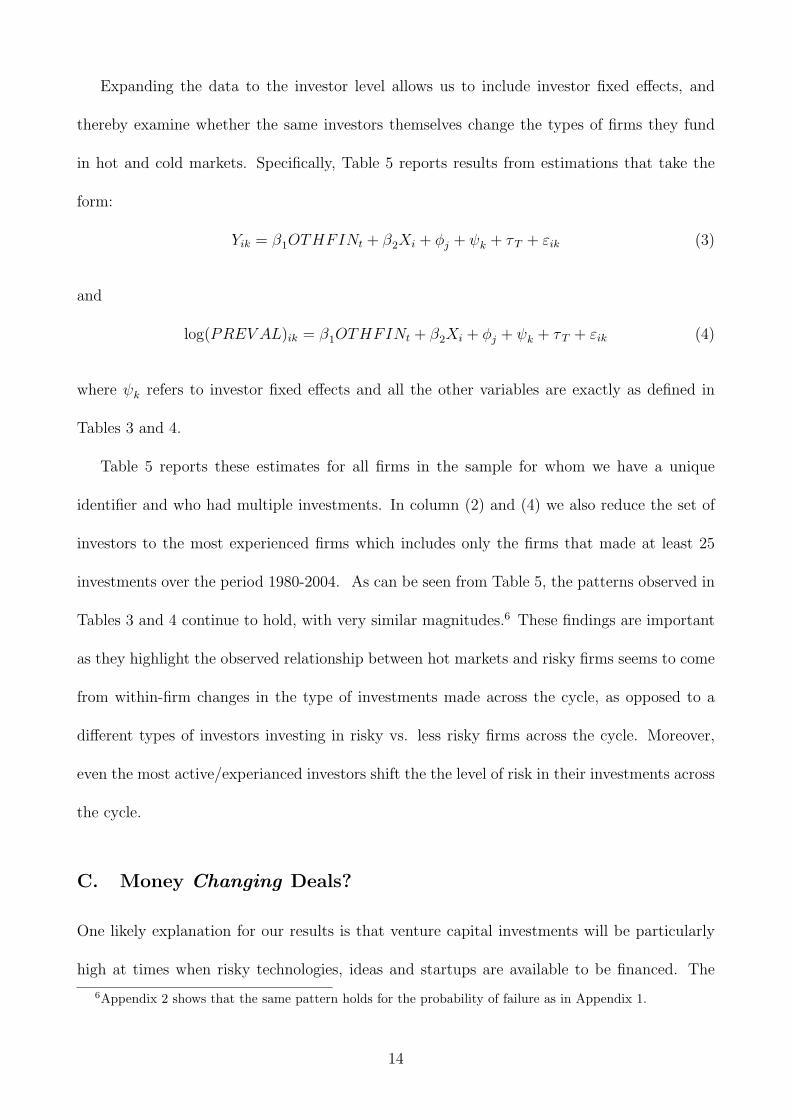
Expanding the data to the investor level allows us to include investor fixed effects, and
thereby examine whether the same investors themselves change the types of firms they fund
in hot and cold markets. Specifically, Table 5 reports results from estimations that take the
form:
Yik = β1OTHFINt + β2Xi + φj + ψk + τT + εik (3)
and
log(PREV AL)ik = β1OTHFINt + β2Xi + φj + ψk + τT + εik (4)
where ψk refers to investor fixed effects and all the other variables are exactly as defined in
Tables 3 and 4.
Table 5 reports these estimates for all firms in the sample for whom we have a unique
identifier and who had multiple investments. In column (2) and (4) we also reduce the set of
investors to the most experienced firms which includes only the firms that made at least 25
investments over the period 1980-2004. As can be seen from Table 5, the patterns observed in
Tables 3 and 4 continue to hold, with very similar magnitudes.6 These findings are important
as they highlight the observed relationship between hot markets and risky firms seems to come
from within-firm changes in the type of investments made across the cycle, as opposed to a
different types of investors investing in risky vs. less risky firms across the cycle. Moreover,
even the most active/experianced investors shift the the level of risk in their investments across
the cycle.
C. Money Changing Deals?
One likely explanation for our results is that venture capital investments will be particularly
high at times when risky technologies, ideas and startups are available to be financed. The
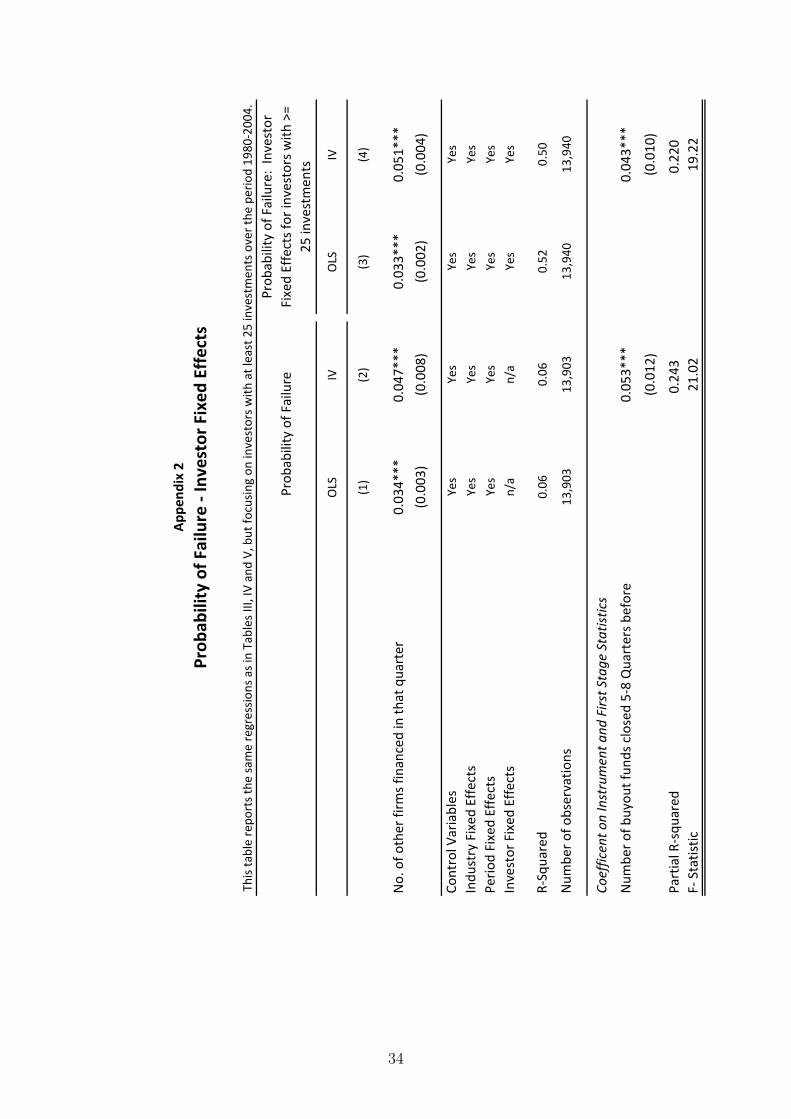
6Appendix 2 shows that the same pattern holds for the probability of failure as in Appendix 1.
14
arrival of new technologies attracts investment and these new technologies are more likely to be
risky investments. In addition to this explanation, however, Nanda and Rhodes-Kropf (2011)
provide a theoretical model linking financial market activity to more risky investments. In their
model, the increase in financing activity also lowers financing risk, which allows investors to
experiment more effectively, and hence take on riskier, more innovative investments. According
to this view, the flood of money associated with the presence of heated investment activity
may actually cause VCs to change the type of investments they are willing to make – towards
more risky, innovative startups in the market.
In order to examine the extent to which this second mechanism is also at play, we exploit a
particular feature of the venture industry, which is that the investors in venture capital funds
(the limited partners) tend to allocate capital to the private equity asset class as a whole.
This leads fundraising by venture and buyout funds to be associated. Our assumption (for
the exclusion restriction to be satisfied) is that limited partner decisions to allocate to buyout
funds are uncorrelated with the opportunity set in venture capital. This seem reasonable since
buyout funds focus on turnarounds of existing companies while early stage investors focus on
new technologies and opportunities. If so, our instrumental variables approach should capture
that part of the investments that are due to changes in capital availability that are unrelated
to the investment opportunities available at the time for venture capital funds. Lagged buy-
out fundraising is used as an instrument to further remove the instrument from current VC
opportunities and to account for the fact that venture funds take 1-3 years to fully invest the
capital in their funds.
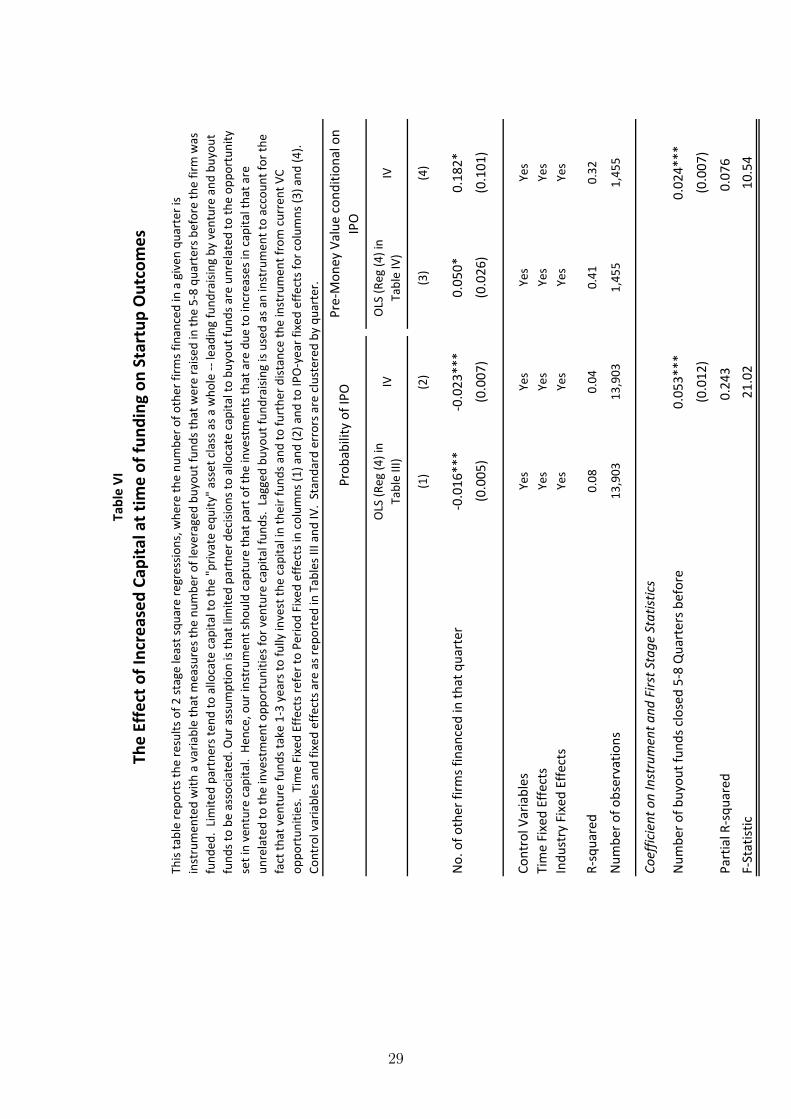
We therefore run two-stage-least-squares regressions, where the variable OTHFINt in equa-
tions (1) and (2) is treated as endogenous and a variable that calculates the number of buyout
funds closed 5-8 quarters before t is used to instrument for OTHFINt. These results are re-
ported in Table 6 columns (2) and (4). In columns (1) and (3) we report the coefficients from
15
comparable OLS regressions for easy comparison. As can be seen from the bottom of Table 6,
the regressions have a strong first stage, and pass the F-test for possible weak instruments.
The magnitudes of the IV results move in a particular direction that highlight the nature
of the endogeneity present. Comparing column (1) to column (2) in Table 6 we see that the
coefficients on the IV are more negative than the OLS. This implies that increased capital
makes firms less likely to IPO, and furthermore that this relationship is stronger than that due
to an increase in the number of investments.7 At the same time, comparing columns (3) and
columns (4) of Table 6 we see that the IV coefficients are more positive than the OLS implying
that conditional on going public, increased capital increases the premoney value at the time of
the IPO, and again more so than just an increase in the number of investments. That is, IV
regressions accentuate our finding that risky firms are funded when capital is abundant. In line
with the findings in other work, they suggest that active investing times are also times when
investment opportunities are better. These better investment opportunities may, on average,
have a higher likelihood of going public at a good valuation. Increased capital, however,
pushes investors to make riskier investments. They are more likely to fail, but if they succeed,
they can be even more valuable than good, but less risky investments. This is the why the IV
coefficients are both more negative and more positive than their respective OLS coefficients.
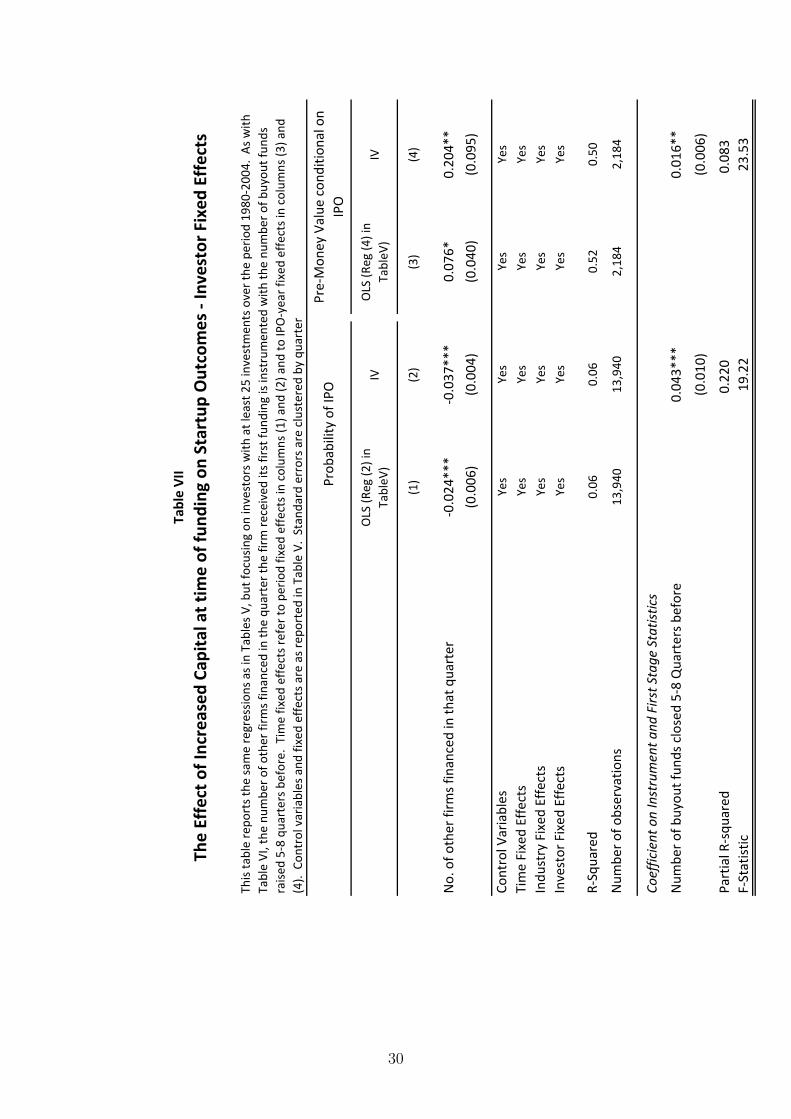
In Table 7, we report the result of the same regressions, but run at the investor-firm level
and including investor fixed effects. The results continue to hold, implying that the high level
of investment activity leads VCs to change the type of investments that they make, towards
more risky startups that may have a higher probability of failure, but may also have bigger
successes.
These are fascinating results because they imply a much larger role for financial markets
in the innovative process that previously thought. Rather than money simply flowing toward
7Appendix 2 also shows that increased capital makes firms more likely to fail, and this relationship is strongerthan that due to an increase in the number of investments.
16
good ideas and away from bad, the results in Tables 6 and 7 imply that a flood of money into
the venture community can actual increase the riskiness of the projects funded. The question
then is, is this just a shift to riskier projects or actually to more innovative ones?
D. “Risky” vs “Novel” Investments
Thus far, the results we have reported in Tables 3-7 are based on financial measures of success.
That is, firms funded in hot markets are less likely to IPO (and more likely to fail), but are
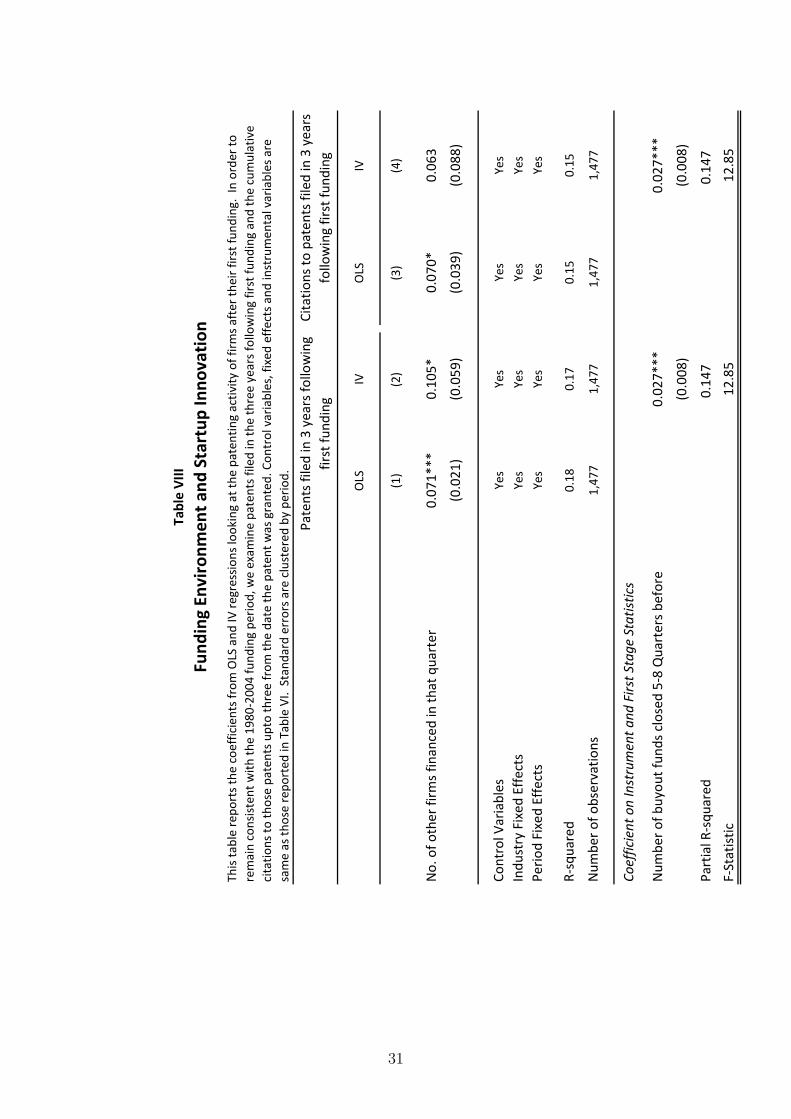
valued higher on the day of their IPO. In Tables 8 and 9, we extend the estimation framework we
used to study valuation to real outcomes associated with firm-level innovation. That is, we ask
whether these are purely more risky investments in financial terms or whether the investments
VCs make in hot markets are associated with more novel technologies, or innovative firms.
Following a long literature in economics (for example Jaffe et al. (1993)), we use firm-
level patenting as our measure of innovation. While patenting is only one measure of firm-
innovation, it is a very relevant measure of innovation in our sample of high-tech firms. Over
two-thirds of the firms that IPOed filed at least one patent in the three years following their
first investment. Moreover, patent citations have been shown to correlate closely with both
the quality of inventions as well as their economic effects (Hall et al. (2005)).
In Tables 8 and 9, we re-run the estimations reported in Tables 6 and 7, but with the
number of patents and number patent citations as the dependent variable. Table 8 shows
that firms funded in hot markets had a 20% higher rate of patenting, and that there was weak
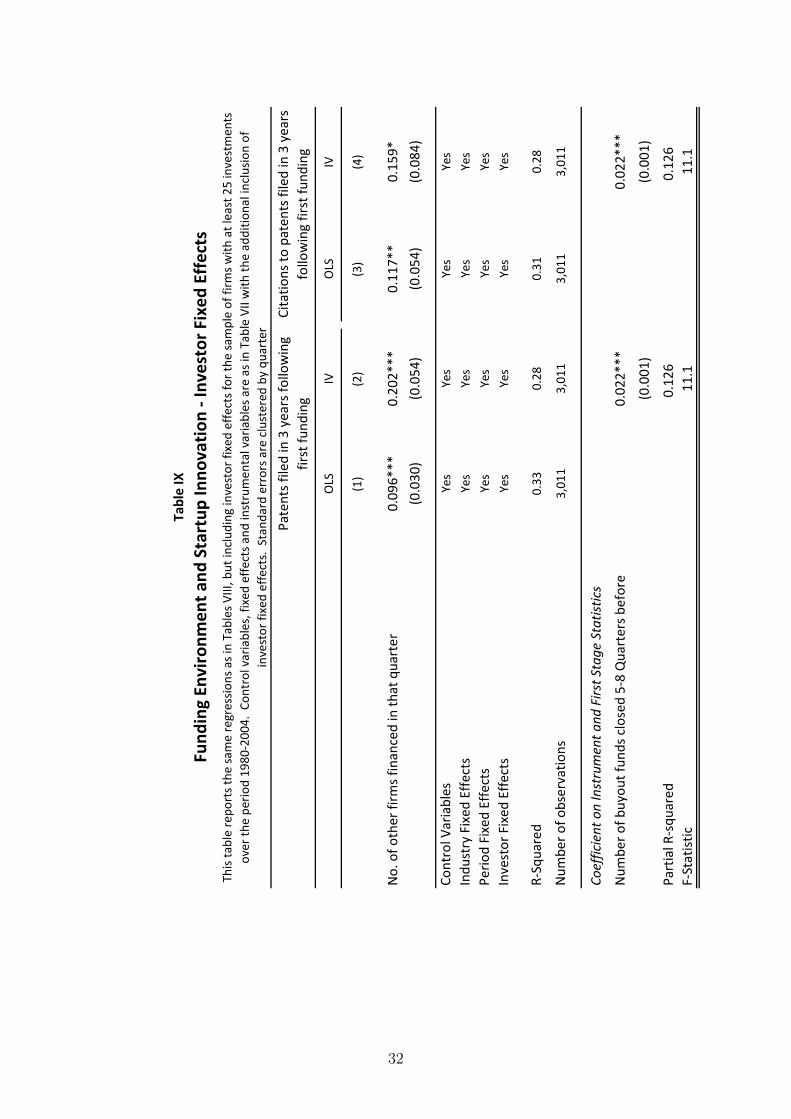
evidence that these patents were also more highly cited. In Table 9, we include investor fixed
effects and report the estimates for the most active investors, who made at least 25 investments
in our sample period. The results of these regressions are significantly stronger, suggesting that
the most experienced investors are particularly likely to change their investments towards more
novel, innovative startups in periods of high financing activity.
17

Consistent with our finding in previous tables, our coefficients on the IV are higher than
the comparable OLS coefficients. This suggests that increased capital leads to more novel
investments and this relationship is stronger than that due to increases in the number of
investments.8
V. Conclusions
New firms that surround the creation and commercialization of new technologies have the
potential to have profound effects on the economy (Aghion and Howitt (1992), Foster et al.
(2008)). The creation of these new firms and their funding is highly cyclical (Gompers et al.
(2008)). Conventional wisdom associates the top of these cycles either with negative attributes
(a left shift in the distribution of projects) or with better investment opportunities (a right
shift in the distribution of projects).
However, the evidence in our paper suggests another, possibly simultaneous, phenomenon.
We find that firms that are funded in ‘hot’ times are more likely to fail but simultaneously create
more value if they succeed. This pattern of a “twist” in the distribution of outcomes (rather
than simply a shift) could arise if more novel firms are funded in hot times. Our results provide
a new but intuitive way to think about the differences in project choice across the investment
cycle. Since the financial results we present cannot distinguish between more innovative versus
simply riskier investments, we also present direct evidence on level of patenting by firms funded
at different times in the cycle. Our results suggest that in addition to being valued higher on
the day of their IPO, successful firms that are funded in hot markets had more patents and
received more citations in the initial years following their first funding than firms funded in
less heady times.
8i.e. the portion of the investments that are unrelated to lagged buyout fundraising activity are less relatedto patenting and patent citations.
18
Our IV results suggest that part of these findings may be driven by the fact that potentially
new inventions cause the arrival of more funding and create a ‘hot’ environment. However they
also highlight that changes capital that are unrelated to the investment opportunities seem to
exacerbate our results, suggesting that one of the attributes of hot markets is that it makes
investors more willing to experiment and thereby fund novel investments. This finding is
consistent with Nanda and Rhodes-Kropf (2011), who demonstrate how increased funding in
the venture capital market can actually rationally alter the type of investments investors are
willing to fund toward a more experimental, innovative project. According to this view, the
abundance of capital associated with investment cycles may not just be a response to the
arrival of new technologies, but may in fact play a critical role in driving the creation of new
technologies. That is, the abundance of capital may change the type of firm investors are
willing to finance in these times. Financial market investment cycles may therefore create
innovation cycles.
Our findings suggest many avenues for future research which consider the impact of the
cycle on innovation, venture capital and the development of new companies. Many of the
classic findings in venture capital could be extended to examine how they are impacted by the
cycle. For example, the interaction of product markets and firm strategy (Hellmann and Puri
(2000)), persistence (Kaplan and Schoar (2005)), grandstanding (Gompers (1996)), the effect
of networks (Hochberg et al. (2007)), or the question of the jockey or the horse (Kaplan et al.
(2009)), all may depend on the cycle in a fascinating way.
19
References
Aghion, Philippe, and Peter Howitt. “A Model of Growth through Creative Destruction.”
Econometrica 60 (1992), pp. 323–351.
Bengtsson, Ola, and Berk Sensoy. “Investor Abilities and Financial Contracting: Evidence
from Venture Capital.” Journal of Financial Intermediation 20 (2011), pp. 477–502.
Brown, James R., Steven M. Fazzari, and Bruce C. Petersen. “Financing Innovation and
Growth: Cash Flow, External Equity, and the 1990s R&D Boom.” The Journal of Finance
66 (2009), pp. 151–185.
Foster, Lucia, John Haltiwanger, and Chad Syverson. “Reallocation, Firm Turnover and Ef-
ficiency: Selection on Productivity or Profitability.” The American Economic Review 98
(2008), pp. 394–425.
Gompers, Paul, Anna Kovner, Josh Lerner, and David Scharfstein. “Venture capital investment
cycles: The impact of public markets.” Journal of Financial Economics 87 (2008), pp. 1–23.
Gompers, Paul, and Josh Lerner. The Venture Capital Cycle. Cambridge, MA and London:
MIT Press (2004).
Gompers, Paul A. “Grandstanding in the Venture Capital Industry.” Journal of Financial
Economics 42 (1996), pp. 133–156.
Gupta, Udayan. Done Deals: Venture Capitalists tell their stories. Boston, MA: Harvard
Business School Press (2000).
Hall, Bronwyn, Adam Jaffe, and Manuel Trajtenberg. “Market Value and Patent Citations.”
Rand Journal of Economics 36 (2005), pp. 16–38.
20
Hellmann, Thomas. “A Theory of Strategic Venture Investing.” Journal of Financial Eco-
nomics 64 (2002), pp. 285–314.
Hellmann, Thomas, and Manju Puri. “The Interaction between Product Market and Financing
Strategy: The Role of Venture Capital.” Review of Financial Studies 13 (2000), pp. 959–984.
Hellmann, Thomas, and Manju Puri. “Venture Capital and the Professionalization of Start-Up
Firms: Empirical Evidence.” Journal of Finance 57 (2002), pp. 169–197.
Hochberg, Yael V., Alexander Ljungqvist, and Yang Lu. “Whom You Know Matters: Venture
Capital Networks and Investment Performance.” Journal of Finance 62 (2007), pp. 251–301.
Jaffe, Adam B., Manuel Trajtenberg, and Rebecca Henderson. “Geographic localization of
knolwedge spillovers as evidenced by patent citations.” Quarterly Journal of Economics 108
(1993), pp. 577–598.
Kaplan, Steven, and Antoinette Schoar. “Private Equity Performance: Returns, Persistence
and Capital Flows.” Journal of Finance 60 (2005), pp. 1791–1823.
Kaplan, Steven, Berk Sensoy, and Per Stromberg. “Should Investors Bet on the Jockey or
the Horse? Evidence from the Evolution of Firms from Early Business Plans to Public
Companies.” Journal of Finance 64 (2009).
Kindleberger, Charles. Manias, Panics, and Crashes: A History of Financial Crises. New
York: Basic Books, revised and enlarged, 1989, 3rd ed 1996 edition (1978).
Kortum, Samuel, and Josh Lerner. “Assessing the impact of venture capital on innovation.”
Rand Journal of Economics 31 (2000), pp. 674–92.
Lerner, Josh, Morten Sorensen, and Per Stromberg. “Private Equity and Long-Run Investment:
The Case of Innovation.” Journal of Finance 66 (2011), pp. 445–477.
21
Li, Dongmei. “Financial Constraints, R&D Investment, and Stock Returns.” Forthcoming in
The Review of Financial Studies (2012).
Metrick, Andrew, and Ayako Yasuda. Venture Capital and the Finance of Innovation. Hoboken,
NJ: John Wiley & Sons, Inc (2010).
Mollica, Marcos, and Luigi Zingales. “The impact of venture capital on innovation and the
creation of new businesses.” University of Chicago working paper (2007).
Nanda, Ramana, and Matthew Rhodes-Kropf. “Financing Risk and Innovation.” Harvard
University working paper (2011).
Pastor, Lubos, and Pietro Veronesi. “Rational IPO waves.” Journal of Finance 60 (2005), pp.
1713–1757.
Perez, Carlota. Technological Revolutions and Financial Capital. Edward Elgar (2002).
Sahlman, William. “Risk and Reward in Venture Capital.” Harvard Business School Note
811-036 (2010), pp. 1–37.
Samila, Sampsa, and Olav Sorenson. “Venture capital, entrepreneurship and economic growth.”
Review of Economics and Statistics 93 (2011), pp. 338–349.
Scharfstein, David, and Jeremy Stein. “Herd behavior and investment.” American Economic
Review 80 (1990), pp. 465–479.
Sorensen, Morton. “How smart is smart money? An empirical two-sided matching model of
venture capital.” Journal of Finance 62 (2007), pp. 2725–62.
Stangler, Dane. “The economic future just happened.” Ewing Marion Kauffman Foundation
working paper (2009).
22

Tian, Xuan, and Tracy Yue Wang. “Tolerance for Failure and Corporate Innovation.” working
paper Indiana University (2011).
23
Num
ber o
f Firm
sShare with
IPO
Average Pre‐Mon
ey
Valuation if had an
IPO
($, M
M)
Patenting
Citatio
ns to
Paten
ts
Full Da
taset
14,667
10%
208
3.7
16.5
Biotechn
ology and He
althcare
2,60
119
%11
55.4
20.8
Commun
ications and
Med
ia1,63
111
%32
43.4
18.2
Compu
ter H
ardw
are and Electron
ics
2,06
711
%19
54.7
21.9
Internet and
Com
puter S
oftw
are
6,05
07%
315
2.2
12.3
Non
‐High Techno
logy
2,31
88%
123
1.7
6.6
This table repo
rts d
escriptiv
e statistics o
n US based startups who
received
Seed or Early Stage financing from
an investor in
the Ve
nture Econ
omics d
atabase be
tween 19
80 and
200
4.
For the
se firm
s, we repo
rt data on
the first financing even
t and
the ultim
ate ou
tcom
e of th
e startup as of D
ecem
ber 2
010
Descriptiv
e Statistics
Table I
Tab
le1:
24
All
Fund
ed in
Hot Periods
Fund
ed in
Cold Pe
riods
P Va
lue for T
wo‐
Tailed Test
All Firm
s in the Sample
Num
ber o
f quarters
100
3268
Num
ber o
f firm
s fun
ded pe
r quarter
147
262
93<0.001
***
Dollars invested
in first fun
ding
$ 4.2 M
$5.0
$3.2
<0.001
***
Startup based in Califo
rnia
37%
38%
36%
0.13
7
Startup based in M
assachusetts
11%
11%
11%
0.97
4
Share of startups th
at had
an IPO
10%
8%14
%<0.001
***
Firm
s tha
t had
an IPO
Firm
age at IPO
4.7
4.7
4.8
0.76
2
Total D
ollars ra
ised prior to IPO
$42
$47
$37
<0.001
***
Average Pre‐Mon
ey Value
at IPO
$ 20
8 M
$ 28
7 M
$ 15
2 M
<0.001
***
Num
ber o
f paten
ts in
3 years fo
llowing first fu
nding
3.7
4.3
3.2
0.00
7**
Citatio
ns to
paten
ts in
3 years fo
llowing first fu
nding
16.5
18.6
13.3
0.05
5*
This table repo
rts d
ifferen
ces in the characteristics o
f firm
s that receive th
eir first fund
ing in
hot vs. cold pe
riods H
ot periods are defined
as b
eing
in th
e top third
of
quarters in
term
s of startup
s being
fund
ed in
each of th
e pe
riods 198
0‐19
89, 199
0‐19
99 and
200
0‐20
04.
Characteristics o
f Startup
s Fun
ded in Hot vs. Cold Pe
riods
Table II
Tab
le2:
25
Drop
98‐'00
(1)
(2)
(3)
(4)
(5)
No. of o
ther firm
s financed in th
at quarter
‐0.027
***
‐0.028
***
‐0.026
***
‐0.016
***
‐0.046
***
(0.003
)(0.003
)(0.003
)(0.005
)(0.012
)
$ raise
d in first financing
0.00
7**
0.00
8***
0.01
6***
0.02
0***
(0.003
)(0.003
)(0.003
)(0.003
)
Num
ber o
f investors in
synd
icate
0.01
3***
0.01
2***
0.00
9***
0.01
2***
(0.002
)(0.002
)(0.002
)(0.003
)
Startup based in Califo
rnia
0.02
6***
0.02
5***
0.02
3***
0.03
3***
(0.007
)(0.007
)(0.006
)(0.009
)
Startup based in M
assachusetts
0.01
30.01
00.00
70.01
0(0.010
)(0.010
)(0.010
)(0.013
)
Indu
stry Fixed
Effe
cts
No
No
Yes
Yes
Yes
Perio
d Fixed Effects
No
No
No
Yes
Yes
Num
ber o
f observatio
ns14
,667
13,903
13,903
13,903
8,89
6
R‐Squared
0.03
0.04
0.06
0.08
0.08
Table III
Prob
ability of IPO
based
on market w
hen the startup received
first fun
ding
This table repo
rts the
probability of a startup be
ing code
d as having an
IPO" based on
the characteristics o
f the
VC fund
ing en
vironm
ent w
hen it
first re
ceived
fund
ing. A
ll regressio
ns are OLS re
gressio
ns whe
re th
e de
pend
ent v
ariable takes a
value
of 1
if th
e startup had an
IPO and
zero
othe
rwise
. The results are ro
bust to
usin
g Prob
it regressio
ns, but coe
ffieicnets from OLS sp
ecificatio
ns are re
ported
to facilitate comparison
s with
the IV re
gressio
ns in
later tables. Indu
stry Fixed
Effe
cts c
ontrol fo
r the
5 indu
strie
s outlined
in Table 1. Pe
riod Fixed effects c
ontrol fo
r the
startup
being fund
ed in
the pe
riod 19
80‐89, 199
0‐99
or 2
000‐20
04. Stand
ard errors are clustered
by qu
arter.
1980
‐200
4
Tab
le3:
26
Drop
199
8‐20
00
(1)
(2)
(3)
(4)
(5)
No. of o
ther firm
s financed in th
at quarter
0.29
7***
0.05
6**
0.07
6***
0.05
0*0.07
6*(0.050
)(0.022
)(0.026
)(0.026
)(0.041
)
Total $ ra
ised prior to IPO
0.29
9***
0.30
3***
0.31
7***
0.32
0***
(0.027
)(0.027
)(0.026
)(0.027
)
Value of NAS
DAQ on day of IPO
0.40
0***
0.26
80.27
40.19
3(0.042
)(0.275
)(0.284
)(0.312
)
Startup based in Califo
rnia
0.20
9***
0.18
6***
0.16
2**
0.15
8**
(0.064
)(0.059
)(0.062
)(0.064
)
Startup based in M
assachusetts
0.12
50.12
9*0.10
60.05
5(0.077
)(0.075
)(0.074
)(0.068
)
IPO year F
ixed
Effe
cts
No
No
Yes
Yes
Yes
Indu
stry Fixed
Effe
cts
No
No
No
Yes
Yes
Num
ber o
f observatio
ns1,45
51,45
51,45
51,45
51,24
2
R‐Squared
0.11
0.42
0.42
0.41
0.41
Table IV
Pre‐Mon
ey Valua
tion at IP
O based
on whe
n Startup received
first fun
ding
This table repo
rts the
results from
regressio
ns looking at th
e value of firm
s that h
ad an IPO, based
on the qu
arter in which th
ey re
ceived
their first
fund
ing. Coe
ffieints in the table are from
OLS sp
ecificatio
ns whe
re th
e de
pend
ent v
ariable is the log of th
e pre‐mon
ey valuatio
n on
the day the firm
IPO'ed. Ind
ustry Fixed Effects c
ontrol fo
r the
5 indu
strie
s outlined
in Table 1. IPO‐year fixed
effe
cts c
ontrol fo
r the
year in which th
e startup had its
IPO. Standard errors a
re clustered
by qu
arter.
1980
‐200
4
Tab
le4:
27
All Investors
Investors >
= 25
investmen
tsAll V
CsVC
s >= 25
investmen
ts
(1)
(2)
(3)
(4)
No. of o
ther firm
s financed in th
at quarter
‐0.019
***
‐0.024
***
0.06
5*0.07
6*(0.005
)(0.006
)(0.039
)(0.040
)
Control V
ariables
Yes
Yes
Yes
Yes
Time Fixed Effects
Yes
Yes
Yes
Yes
Indu
stry Fixed
Effe
cts
Yes
Yes
Yes
Yes
Investor Fixed
Effe
cts
Yes
Yes
Yes
Yes
R‐Squared
0.20
0.12
0.61
0.52
Num
ber o
f observatio
ns25
,314
13,940
3,26
42,18
4
Table V
Fund
ing En
vironm
ent a
nd Startup
Outcome ‐ Investor F
ixed
Effects
This table OLS re
gressio
ns as in Tables III and
IV, but includ
es m
ultip
le observatio
ns per startup firm to
accou
nt fo
r multip
le investors in
the initial ro
und of fu
nding. This a
llows the
presence of investor fixed effects. W
e repo
rt tw
o sets of spe
cifications. The first includ
es all
firms for which we have data on
the iden
tity of th
e investors. The
second
repo
rts o
nly the most e
xperienced
investors, who
make at
least 2
5 investmen
ts over the
period 19
80‐200
4. Tim
e controls refer to pe
riod fixed
effe
cts in columns(1) and
(2) and
to IPO‐year fixed
effects in columns (3
) and
(4). Con
trol variables, ind
ustry, period and IPO‐year fixed
effe
cts a
re exactly th
e same as in
Tables III and IV.
Standard errors a
re clustered
by qu
arter.
Prob
ability of IPO
Pre‐Mon
ey Value
con
ditio
nal on
IPO
Tab
le5:
28
OLS (R
eg (4
) in
Table III)
IVOLS (R
eg (4
) in
Table IV)
IV
(1)
(2)
(3)
(4)
No. of o
ther firm
s financed in th
at quarter
‐0.016
***
‐0.023
***
0.05
0*0.18
2*
(0.005
)(0.007
)(0.026
)(0.101
)
Control V
ariables
Yes
Yes
Yes
Yes
Time Fixed Effects
Yes
Yes
Yes
Yes
Indu
stry Fixed
Effe
cts
Yes
Yes
Yes
Yes
R‐squared
0.08
0.04
0.41
0.32
Num
ber o
f observatio
ns13
,903
13,903
1,45
51,45
5
Coefficient on Instrument a
nd First S
tage
Statistics
Num
ber o
f buyou
t fun
ds closed 5‐8 Quarters b
efore
0.05
3***
0.02
4***
(0.012
)(0.007
)
Partial R
‐squ
ared
0.24
30.07
6F‐Statistic
21.02
10.54
The Effect of Increased
Cap
ital at tim
e of fu
nding on
Startup
Outcomes
Table VI
This table repo
rts the
results of 2
stage least squ
are regressio
ns, w
here th
e nu
mbe
r of o
ther firm
s financed in a given
quarter is
instrumen
ted with
a variable that m
easures the
num
ber o
f leveraged
buyou
t fun
ds th
at were raise
d in th
e 5‐8 qu
arters before the firm was
fund
ed. Limite
d partne
rs te
nd to
allocate capita
l to the "priv
ate eq
uity" asset class as a
who
le ‐‐ leading fund
raising
by venture and bu
yout
fund
s to be
associated. Our assum
ption is that limite
d partne
r decision
s to allocate capita
l to bu
yout fu
nds a
re unrelated
to th
e op
portun
ity
set in venture capital. Hen
ce, our instrumen
t sho
uld capture that part o
f the
investmen
ts th
at are due
to increases in capital that a
re
unrelated to th
e investmen
t opp
ortunitie
s for ven
ture capita
l fun
ds. Lagged
buyou
t fun
draisin
g is used
as a
n instrumen
t to accoun
t for th
e fact th
at ven
ture fu
nds take 1‐3 years to fully invest th
e capital in their fun
ds and
to fu
rthe
r distance th
e instrumen
t from current VC
oppo
rtun
ities. Time Fixed Effects refer to
Period Fixed effects in columns (1
) and
(2) and
to IPO‐year fixed
effe
cts for colum
ns (3
) and
(4).
Control variables and
fixed effects a
re as rep
orted in Tables III and IV. Standard errors a
re clustered
by qu
arter.
Prob
ability of IPO
Pre‐Mon
ey Value
con
ditio
nal on
IPO
Tab
le6:
29
OLS (R
eg (2
) in
TableV
)IV
OLS (R
eg (4
) in
TableV
)IV
(1)
(2)
(3)
(4)
No. of o
ther firm
s financed in th
at quarter
‐0.024
***
‐0.037
***
0.07
6*0.20
4**
(0.006
)(0.004
)(0.040
)(0.095
)
Control V
ariables
Yes
Yes
Yes
Yes
Time Fixed Effects
Yes
Yes
Yes
Yes
Indu
stry Fixed
Effe
cts
Yes
Yes
Yes
Yes
Investor Fixed
Effe
cts
Yes
Yes
Yes
Yes
R‐Squared
0.06
0.06
0.52
0.50
Num
ber o
f observatio
ns13
,940
13,940
2,18
42,18
4
Coefficient on Instrument a
nd First S
tage
Statistics
Num
ber o
f buyou
t fun
ds closed 5‐8 Quarters b
efore
0.04
3***
0.01
6**
(0.010
)(0.006
)
Partial R
‐squ
ared
0.22
00.08
3F‐Statistic
19.22
23.53
Table VII
The Effect of Increased
Cap
ital at tim
e of fu
nding on
Startup
Outcomes ‐ Investor Fixed
Effects
This table repo
rts the
same regressio
ns as in Tables V, but fo
cusin
g on
investors w
ith at least 25 investmen
ts over the
period 19
80‐200
4. A
s with
Table VI, the
num
ber o
f other firm
s financed in th
e qu
arter the
firm
received
its first fun
ding
is instrumen
ted with
the nu
mbe
r of b
uyou
t fun
ds
raise
d 5‐8 qu
arters before. Tim
e fixed
effe
cts refer to
period fixed
effe
cts in columns (1
) and
(2) and
to IPO‐year fixed
effe
cts in columns (3
) and
(4). Con
trol variables and
fixed effects a
re as rep
orted in Table V. Standard errors a
re clustered
by qu
arter
Prob
ability of IPO
Pre‐Mon
ey Value
con
ditio
nal on
IPO
Tab
le7:
30
OLS
IVOLS
IV
(1)
(2)
(3)
(4)
No. of o
ther firm
s financed in th
at quarter
0.07
1***
0.10
5*0.07
0*0.06
3
(0.021
)(0.059
)(0.039
)(0.088
)
Control V
ariables
Yes
Yes
Yes
Yes
Indu
stry Fixed
Effe
cts
Yes
Yes
Yes
Yes
Perio
d Fixed Effects
Yes
Yes
Yes
Yes
R‐squared
0.18
0.17
0.15
0.15
Num
ber o
f observatio
ns1,477
1,477
1,477
1,477
Coefficient on Instrument a
nd First S
tage
Statistics
Num
ber o
f buyou
t fun
ds closed 5‐8 Quarters b
efore
0.02
7***
0.02
7***
(0.008
)(0.008
)
Partial R
‐squ
ared
0.14
70.14
7F‐Statistic
12.85
12.85
Table VIII
Fund
ing En
vironm
ent a
nd Startup
Inno
vatio
n
This table repo
rts the
coe
fficien
ts from
OLS and
IV re
gressio
ns looking at th
e patenting activity
of firm
s after th
eir first fun
ding. In order to
remain consisten
t with
the 1980
‐2004 fund
ing pe
riod, we exam
ine patents filed in th
e three years following first fu
nding and the cumulative
citatio
ns to
those patents u
pto three from
the date th
e patent was granted
. Con
trol variables, fixed
effe
cts a
nd instrumen
tal variables are
same as th
ose repo
rted
in Table VI. Stand
ard errors are clustered
by pe
riod.
Patents filed in 3 years fo
llowing
first fu
nding
Citatio
ns to
paten
ts filed in 3 years
following first fu
nding
Tab
le8:
31
OLS
IVOLS
IV
(1)
(2)
(3)
(4)
No. of o
ther firm
s financed in th
at quarter
0.09
6***
0.20
2***
0.11
7**
0.15
9*(0.030
)(0.054
)(0.054
)(0.084
)
Control V
ariables
Yes
Yes
Yes
Yes
Indu
stry Fixed
Effe
cts
Yes
Yes
Yes
Yes
Perio
d Fixed Effects
Yes
Yes
Yes
Yes
Investor Fixed
Effe
cts
Yes
Yes
Yes
Yes
R‐Squared
0.33
0.28
0.31
0.28
Num
ber o
f observatio
ns3,011
3,011
3,011
3,011
Coefficient on Instrument a
nd First S
tage
Statistics
Num
ber o
f buyou
t fun
ds closed 5‐8 Quarters b
efore
0.02
2***
0.02
2***
(0.001
)(0.001
)
Partial R
‐squ
ared
0.12
60.12
6F‐Statistic
11.1
11.1
Table IX
Fund
ing En
vironm
ent a
nd Startup
Inno
vatio
n ‐ Investor F
ixed
Effects
This table repo
rts the
same regressio
ns as in Tables VIII, but includ
ing investor fixed effects for th
e sample of firm
s with
at least 25 investmen
ts
over th
e pe
riod 1980
‐2004. Con
trol variables, fixed
effe
cts a
nd instrumen
tal variables are as in Table VII w
ith th
e additio
nal inclusio
n of
investor fixed effects. Stand
ard errors are clustered
by qu
arter
Patents filed in 3 years fo
llowing
first fu
nding
Citatio
ns to
paten
ts filed in 3 years
following first fu
nding
Tab
le9:
32
Drop
98‐'00
(1)
(2)
(3)
(4)
(5)
No. of o
ther firm
s financed in th
at quarter
0.01
6***
0.02
1***
0.01
9***
0.03
4***
0.02
5*(0.003
)(0.003
)(0.003
)(0.003
)(0.015
)
$ raise
d in first financing
‐0.019
***
‐0.020
***
‐0.008
***
‐0.012
***
(0.004
)(0.003
)(0.003
)(0.003
)
Num
ber o
f investors in
synd
icate
0.00
40.00
5**
‐0.002
0.00
1(0.002
)(0.002
)(0.002
)(0.002
)
Startup based in Califo
rnia
0.03
0***
0.03
1***
0.03
1***
0.02
0**
(0.009
)(0.009
)(0.009
)(0.009
)
Startup based in M
assachusetts
‐0.002
0.00
1‐0.004
‐0.001
(0.011
)(0.011
)(0.010
)(0.010
)
Indu
stry Fixed
Effe
cts
No
No
Yes
Yes
Yes
Perio
d Fixed Effects
No
No
No
Yes
Yes
Num
ber o
f observatio
ns13
,903
13,903
13,903
13,903
8,89
6
R‐Squared
0.04
0.04
0.06
0.08
0.08
Appe
ndix 1
Prob
ability of failure based
on market w
hen the startup received
first fun
ding
This table repo
rts the
probability of a startup be
ing code
d as "bankrupt" based on
the characteristics o
f the
VC fund
ing en
vironm
ent w
hen it first
received
fund
ing
1980
‐200
4
Tab
le10
:
33
OLS
IVOLS
IV
(1)
(2)
(3)
(4)
No. of o
ther firm
s financed in th
at quarter
0.03
4***
0.04
7***
0.03
3***
0.05
1***
(0.003
)(0.008
)(0.002
)(0.004
)
Control V
ariables
Yes
Yes
Yes
Yes
Indu
stry Fixed
Effe
cts
Yes
Yes
Yes
Yes
Perio
d Fixed Effects
Yes
Yes
Yes
Yes
Investor Fixed
Effe
cts
n/a
n/a
Yes
Yes
R‐Squared
0.06
0.06
0.52
0.50
Num
ber o
f observatio
ns13
,903
13,903
13,940
13,940
Coefficent o
n Instrument a
nd First S
tage
Statistics
Num
ber o
f buyou
t fun
ds closed 5‐8 Quarters b
efore
0.05
3***
0.04
3***
(0.012
)(0.010
)
Partial R
‐squ
ared
0.24
30.22
0F‐ Statistic
21.02
19.22
Appe
ndix 2
Prob
ability of Failure ‐ Investor Fixed
Effects
This table repo
rts the
same regressio
ns as in Tables III, IV and
V, but fo
cusin
g on
investors w
ith at least 25 investmen
ts over the
period 19
80‐200
4.
Prob
ability of Failure
Prob
ability of Failure: Investor
Fixed Effects for investors w
ith >=
25 investmen
ts
Tab
le11
:
34