Embed Size (px)
Citation preview

1
Diversified Industrials – Specialty Distribution I Q4 2017
Investment Banking I Industry Spotlight
2
Diversified Industrials – Specialty Distribution I Industry Spotlight
Q4 2017
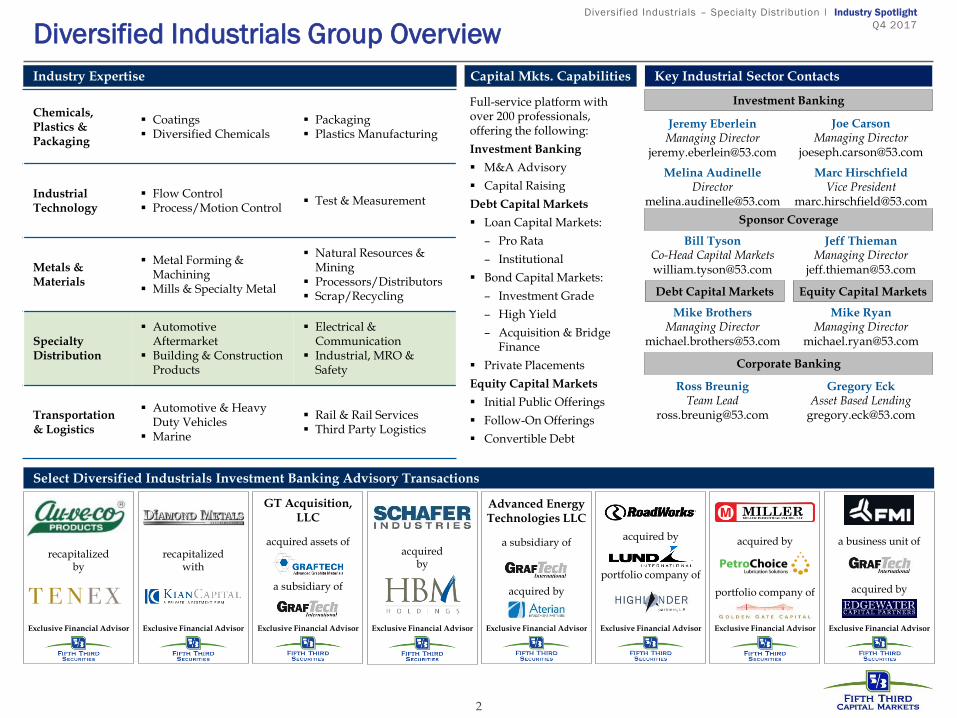
Key Industrial Sector Contacts
Investment Banking
Debt Capital Markets Equity Capital Markets
Mike Brothers Managing Director
Mike Ryan Managing Director
Corporate Banking
Industry Expertise Capital Mkts. Capabilities
Full-service platform with over 200 professionals, offering the following:
Investment Banking
M&A Advisory
Capital Raising
Debt Capital Markets
Loan Capital Markets:
– Pro Rata
– Institutional
Bond Capital Markets:
– Investment Grade
– High Yield
– Acquisition & Bridge Finance
Private Placements
Equity Capital Markets
Initial Public Offerings
Follow-On Offerings
Convertible Debt
Sponsor Coverage
Bill Tyson Co-Head Capital Markets [email protected]
Jeff Thieman Managing Director
Diversified Industrials Group Overview
Jeremy Eberlein Managing Director
Select Diversified Industrials Investment Banking Advisory Transactions
Joe Carson Managing Director
Marc Hirschfield Vice President
Melina Audinelle Director
Chemicals, Plastics & Packaging
Coatings Diversified Chemicals
Packaging Plastics Manufacturing
Industrial Technology
Flow Control Process/Motion Control
Test & Measurement
Metals & Materials
Metal Forming & Machining
Mills & Specialty Metal
Natural Resources & Mining
Processors/Distributors Scrap/Recycling
Specialty Distribution
Automotive Aftermarket
Building & Construction Products
Electrical & Communication
Industrial, MRO & Safety
Transportation & Logistics
Automotive & Heavy Duty Vehicles
Marine
Rail & Rail Services Third Party Logistics
acquired by
portfolio company of
acquired by
portfolio company of
a business unit of
acquired by
Advanced Energy Technologies LLC
a subsidiary of
acquired by
acquired by
acquired assets of
a subsidiary of
GT Acquisition, LLC
recapitalized with
Exclusive Financial Advisor Exclusive Financial Advisor Exclusive Financial Advisor Exclusive Financial Advisor Exclusive Financial Advisor Exclusive Financial Advisor Exclusive Financial Advisor Exclusive Financial Advisor
recapitalized by
Ross Breunig Team Lead
Gregory Eck Asset Based Lending
3
Diversified Industrials – Specialty Distribution I Industry Spotlight
Q4 2017
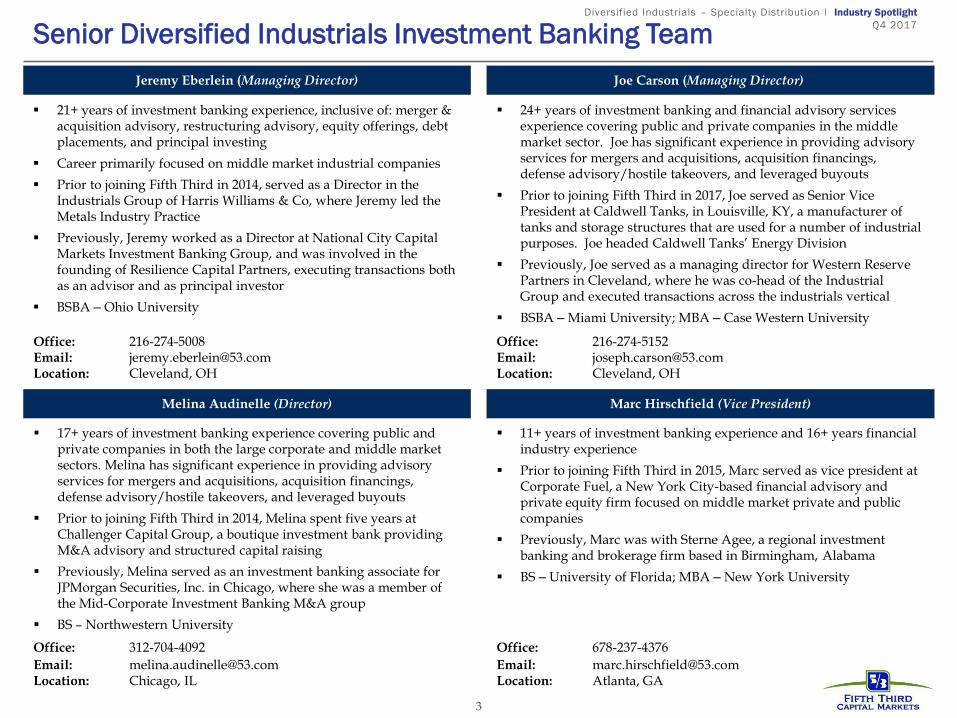
Senior Diversified Industrials Investment Banking Team
21+ years of investment banking experience, inclusive of: merger & acquisition advisory, restructuring advisory, equity offerings, debt placements, and principal investing
Career primarily focused on middle market industrial companies
Prior to joining Fifth Third in 2014, served as a Director in the Industrials Group of Harris Williams & Co, where Jeremy led the Metals Industry Practice
Previously, Jeremy worked as a Director at National City Capital Markets Investment Banking Group, and was involved in the founding of Resilience Capital Partners, executing transactions both as an advisor and as principal investor
BSBA – Ohio University
11+ years of investment banking experience and 16+ years financial industry experience
Prior to joining Fifth Third in 2015, Marc served as vice president at Corporate Fuel, a New York City-based financial advisory and private equity firm focused on middle market private and public companies
Previously, Marc was with Sterne Agee, a regional investment banking and brokerage firm based in Birmingham, Alabama
BS – University of Florida; MBA – New York University
Jeremy Eberlein (Managing Director)
Marc Hirschfield (Vice President)
Joe Carson (Managing Director)
24+ years of investment banking and financial advisory services experience covering public and private companies in the middle market sector. Joe has significant experience in providing advisory services for mergers and acquisitions, acquisition financings, defense advisory/hostile takeovers, and leveraged buyouts
Prior to joining Fifth Third in 2017, Joe served as Senior Vice President at Caldwell Tanks, in Louisville, KY, a manufacturer of tanks and storage structures that are used for a number of industrial purposes. Joe headed Caldwell Tanks’ Energy Division
Previously, Joe served as a managing director for Western Reserve Partners in Cleveland, where he was co-head of the Industrial Group and executed transactions across the industrials vertical
BSBA – Miami University; MBA – Case Western University
Melina Audinelle (Director)
17+ years of investment banking experience covering public and private companies in both the large corporate and middle market sectors. Melina has significant experience in providing advisory services for mergers and acquisitions, acquisition financings, defense advisory/hostile takeovers, and leveraged buyouts
Prior to joining Fifth Third in 2014, Melina spent five years at Challenger Capital Group, a boutique investment bank providing M&A advisory and structured capital raising
Previously, Melina served as an investment banking associate for JPMorgan Securities, Inc. in Chicago, where she was a member of the Mid-Corporate Investment Banking M&A group
BS – Northwestern University
Office: 216-274-5008 Email: [email protected] Location: Cleveland, OH
Office: 216-274-5152 Email: [email protected] Location: Cleveland, OH
Office: 312-704-4092
Email: [email protected] Location: Chicago, IL
Office: 678-237-4376
Email: [email protected] Location: Atlanta, GA
4
Diversified Industrials – Specialty Distribution I Industry Spotlight
Q4 2017
Highlighted FTS Advisory Transaction
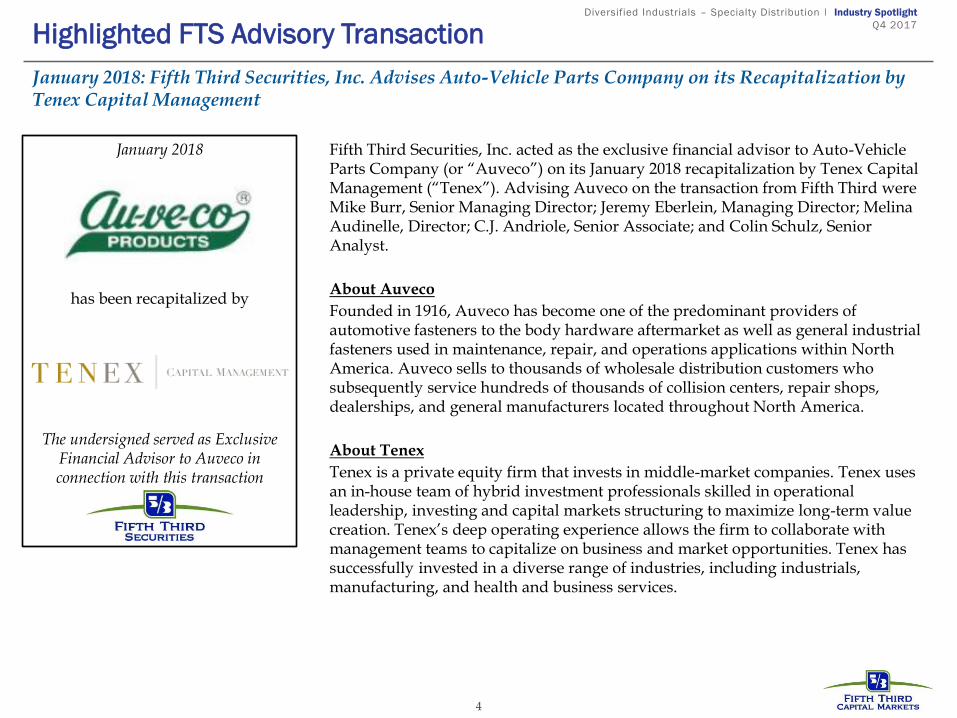
January 2018: Fifth Third Securities, Inc. Advises Auto-Vehicle Parts Company on its Recapitalization by Tenex Capital Management
Fifth Third Securities, Inc. acted as the exclusive financial advisor to Auto-Vehicle Parts Company (or “Auveco”) on its January 2018 recapitalization by Tenex Capital Management (“Tenex”). Advising Auveco on the transaction from Fifth Third were Mike Burr, Senior Managing Director; Jeremy Eberlein, Managing Director; Melina Audinelle, Director; C.J. Andriole, Senior Associate; and Colin Schulz, Senior Analyst.
About Auveco
Founded in 1916, Auveco has become one of the predominant providers of automotive fasteners to the body hardware aftermarket as well as general industrial fasteners used in maintenance, repair, and operations applications within North America. Auveco sells to thousands of wholesale distribution customers who subsequently service hundreds of thousands of collision centers, repair shops, dealerships, and general manufacturers located throughout North America.
About Tenex
Tenex is a private equity firm that invests in middle-market companies. Tenex uses an in-house team of hybrid investment professionals skilled in operational leadership, investing and capital markets structuring to maximize long-term value creation. Tenex’s deep operating experience allows the firm to collaborate with management teams to capitalize on business and market opportunities. Tenex has successfully invested in a diverse range of industries, including industrials, manufacturing, and health and business services.
January 2018
has been recapitalized by
The undersigned served as Exclusive Financial Advisor to Auveco in connection with this transaction
5
Diversified Industrials – Specialty Distribution I Industry Spotlight
Q4 2017
Highlighted FTS Advisory Transaction
January 2018: Fifth Third Securities, Inc. Advises Diamond Metals Distribution, LLC on its Recapitalization with Kian Capital
January 2018
has been recapitalized with
The undersigned served as Exclusive Financial Advisor to Diamond in connection with this transaction
Fifth Third Securities, Inc. acted as the exclusive financial advisor to Diamond Metals Distribution, LLC (“Diamond”) on its January 2018 recapitalization with Kian Capital (“Kian”). Advising Diamond on the transaction from Fifth Third were Jeremy Eberlein, Managing Director; C.J. Andriole, Senior Associate; and Colin Schulz, Senior Analyst.
About Diamond
Diamond is a Cleveland, Ohio based steel service center with customers that include tool and die shops, mold shops, machine shops, and general metalworking manufacturers. Diamond provides value-added services, such as production saw cutting, flame cutting, pre-squared finishing, and grinding and milling services to tool steels, hot and cold rolled steels, powdered metals, and alloy plates and rounds.
About Kian
With offices in Atlanta, GA and Charlotte, NC, Kian is a private investment firm that makes mezzanine debt and equity investments in leading lower middle-market companies across a broad range of industries, typically providing between $5 million and $20 million of capital per transaction. Kian partners with management teams and independent sponsors to build and grow successful, high-quality businesses. Kian’s team has deep expertise across the capital structure, including control private equity, mezzanine debt and leveraged senior debt, which enables Kian to be flexible, value-added partners to help support the long-term objectives of business owners.
6
Diversified Industrials – Specialty Distribution I Industry Spotlight
Q4 2017
(30%)
(10%)
10%
30%
50%
Dec-16 Mar-17 Jun-17 Sep-17 Dec-17
Automotive Aftermarket Building & ConstructionElectrical & Communication Industrial, MRO & SafetyS&P 500
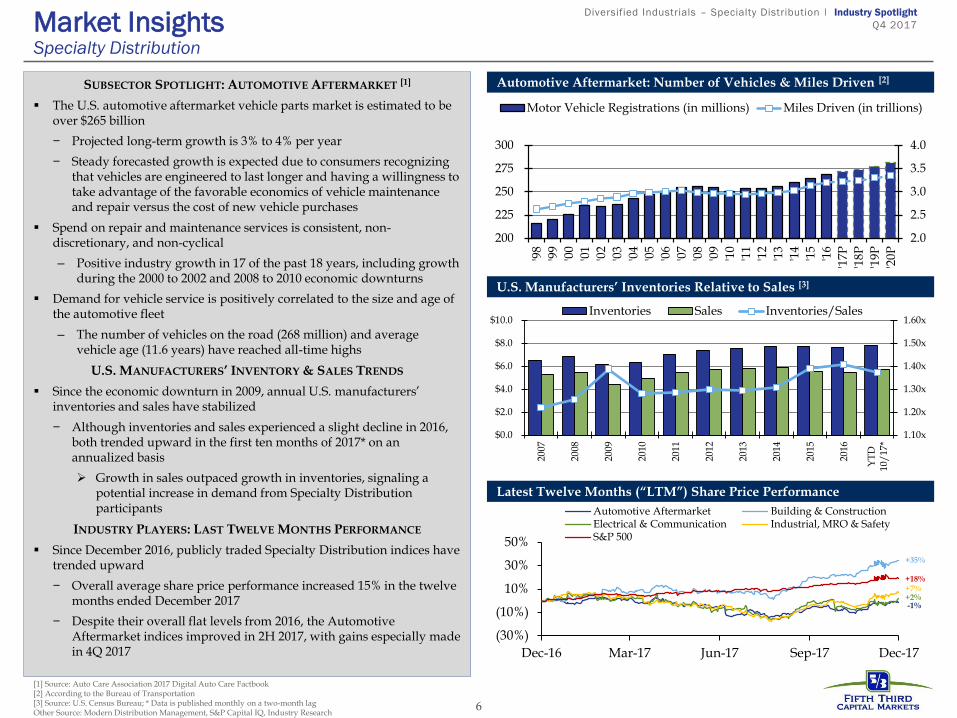
Latest Twelve Months (“LTM”) Share Price Performance
+2%
Automotive Aftermarket: Number of Vehicles & Miles Driven [2]
U.S. Manufacturers’ Inventories Relative to Sales [3]
Market Insights Specialty Distribution
+7%
[1] Source: Auto Care Association 2017 Digital Auto Care Factbook [2] According to the Bureau of Transportation [3] Source: U.S. Census Bureau; * Data is published monthly on a two-month lag Other Source: Modern Distribution Management, S&P Capital IQ, Industry Research
-1%
+35%
+18%
SUBSECTOR SPOTLIGHT: AUTOMOTIVE AFTERMARKET [1]
The U.S. automotive aftermarket vehicle parts market is estimated to be over $265 billion
− Projected long-term growth is 3% to 4% per year
− Steady forecasted growth is expected due to consumers recognizing that vehicles are engineered to last longer and having a willingness to take advantage of the favorable economics of vehicle maintenance and repair versus the cost of new vehicle purchases
Spend on repair and maintenance services is consistent, non-discretionary, and non-cyclical
– Positive industry growth in 17 of the past 18 years, including growth during the 2000 to 2002 and 2008 to 2010 economic downturns
Demand for vehicle service is positively correlated to the size and age of the automotive fleet
– The number of vehicles on the road (268 million) and average vehicle age (11.6 years) have reached all-time highs
U.S. MANUFACTURERS’ INVENTORY & SALES TRENDS
Since the economic downturn in 2009, annual U.S. manufacturers’ inventories and sales have stabilized
− Although inventories and sales experienced a slight decline in 2016, both trended upward in the first ten months of 2017* on an annualized basis
Growth in sales outpaced growth in inventories, signaling a potential increase in demand from Specialty Distribution participants
INDUSTRY PLAYERS: LAST TWELVE MONTHS PERFORMANCE
Since December 2016, publicly traded Specialty Distribution indices have trended upward
− Overall average share price performance increased 15% in the twelve months ended December 2017
− Despite their overall flat levels from 2016, the Automotive Aftermarket indices improved in 2H 2017, with gains especially made in 4Q 2017
2.0
2.5
3.0
3.5
4.0
'98
'99
'00
'01
'02
'03
'04
'05
'06
'07
'08
'09
'10
'11
'12
'13
'14
'15
'16
'17P
'18P
'19P
'20P
200
225
250
275
300
Motor Vehicle Registrations (in millions) Miles Driven (in trillions)
1.10x
1.20x
1.30x
1.40x
1.50x
1.60x
$0.0
$2.0
$4.0
$6.0
$8.0
$10.0
2007
2008
2009
2010
2011
2012
2013
2014
2015
2016
YT
D10
/17
*
Inventories Sales Inventories/Sales
7
Diversified Industrials – Specialty Distribution I Industry Spotlight
Q4 2017
(50%)
0%
50%
100%
150%
Dec-12 Dec-13 Dec-14 Dec-15 Dec-16 Dec-17
Automotive Aftermarket Building & Construction
Electrical & Communication Industrial, MRO & Safety
S&P 500
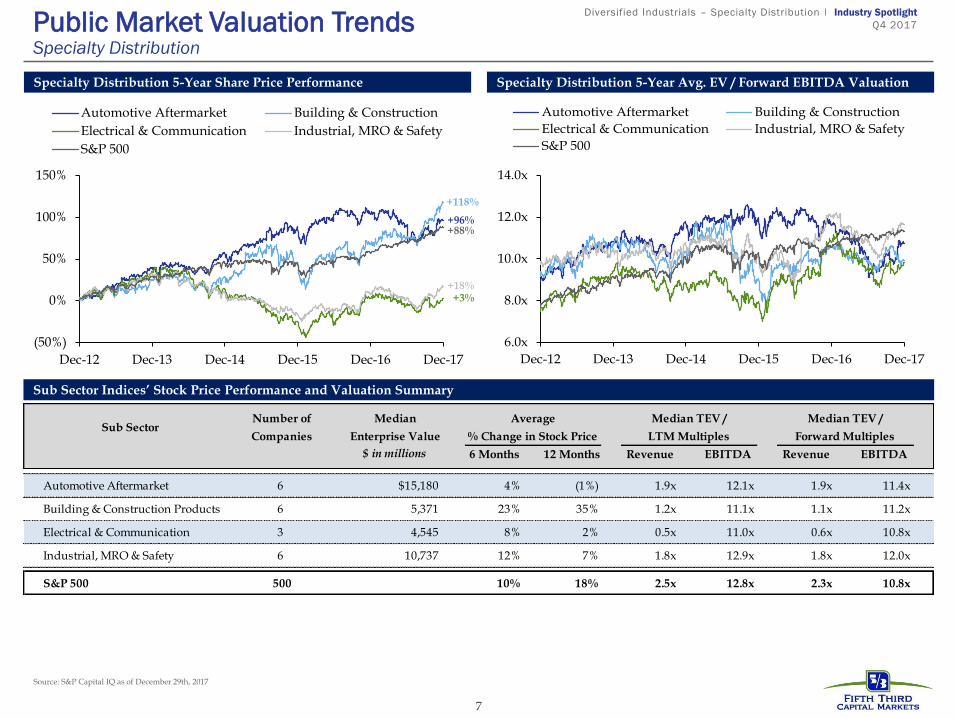
Sub Sector Indices’ Stock Price Performance and Valuation Summary
Specialty Distribution 5-Year Share Price Performance Specialty Distribution 5-Year Avg. EV / Forward EBITDA Valuation
Public Market Valuation Trends Specialty Distribution
Source: S&P Capital IQ as of December 29th, 2017
+96% +88%
+118%
+18% +3%
6.0x
8.0x
10.0x
12.0x
14.0x
Dec-12 Dec-13 Dec-14 Dec-15 Dec-16 Dec-17
Automotive Aftermarket Building & Construction
Electrical & Communication Industrial, MRO & Safety
S&P 500
Sub SectorNumber of
Companies
Median
Enterprise Value
Average
% Change in Stock Price
Median TEV /
LTM Multiples
Median TEV /
Forward Multiples
$ in millions 6 Months 12 Months Revenue EBITDA Revenue EBITDA
Automotive Aftermarket 6 $15,180 4% (1%) 1.9x 12.1x 1.9x 11.4x
Building & Construction Products 6 5,371 23% 35% 1.2x 11.1x 1.1x 11.2x
Electrical & Communication 3 4,545 8% 2% 0.5x 11.0x 0.6x 10.8x
Industrial, MRO & Safety 6 10,737 12% 7% 1.8x 12.9x 1.8x 12.0x
S&P 500 500 10% 18% 2.5x 12.8x 2.3x 10.8x
8
Diversified Industrials – Specialty Distribution I Industry Spotlight
Q4 2017
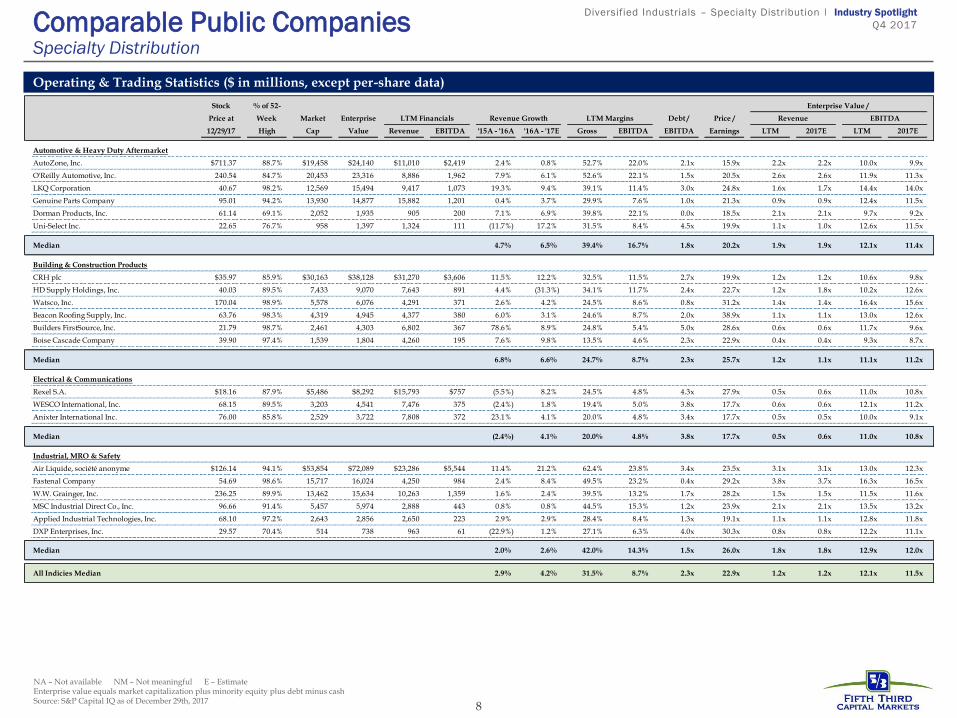
Operating & Trading Statistics ($ in millions, except per-share data)
NA – Not available NM – Not meaningful E – Estimate Enterprise value equals market capitalization plus minority equity plus debt minus cash Source: S&P Capital IQ as of December 29th, 2017
Comparable Public Companies Specialty Distribution
Stock % of 52- Enterprise Value /
Price at Week Market Enterprise LTM Financials Revenue Growth LTM Margins Debt / Price / Revenue EBITDA
12/29/17 High Cap Value Revenue EBITDA '15A - '16A '16A - '17E Gross EBITDA EBITDA Earnings LTM 2017E LTM 2017E
Automotive & Heavy Duty Aftermarket
AutoZone, Inc. $711.37 88.7% $19,458 $24,140 $11,010 $2,419 2.4% 0.8% 52.7% 22.0% 2.1x 15.9x 2.2x 2.2x 10.0x 9.9x
O'Reilly Automotive, Inc. 240.54 84.7% 20,453 23,316 8,886 1,962 7.9% 6.1% 52.6% 22.1% 1.5x 20.5x 2.6x 2.6x 11.9x 11.3x
LKQ Corporation 40.67 98.2% 12,569 15,494 9,417 1,073 19.3% 9.4% 39.1% 11.4% 3.0x 24.8x 1.6x 1.7x 14.4x 14.0x
Genuine Parts Company 95.01 94.2% 13,930 14,877 15,882 1,201 0.4% 3.7% 29.9% 7.6% 1.0x 21.3x 0.9x 0.9x 12.4x 11.5x
Dorman Products, Inc. 61.14 69.1% 2,052 1,935 905 200 7.1% 6.9% 39.8% 22.1% 0.0x 18.5x 2.1x 2.1x 9.7x 9.2x
Uni-Select Inc. 22.65 76.7% 958 1,397 1,324 111 (11.7%) 17.2% 31.5% 8.4% 4.5x 19.9x 1.1x 1.0x 12.6x 11.5x
Median 4.7% 6.5% 39.4% 16.7% 1.8x 20.2x 1.9x 1.9x 12.1x 11.4x
Building & Construction Products
CRH plc $35.97 85.9% $30,163 $38,128 $31,270 $3,606 11.5% 12.2% 32.5% 11.5% 2.7x 19.9x 1.2x 1.2x 10.6x 9.8x
HD Supply Holdings, Inc. 40.03 89.5% 7,433 9,070 7,643 891 4.4% (31.3%) 34.1% 11.7% 2.4x 22.7x 1.2x 1.8x 10.2x 12.6x
Watsco, Inc. 170.04 98.9% 5,578 6,076 4,291 371 2.6% 4.2% 24.5% 8.6% 0.8x 31.2x 1.4x 1.4x 16.4x 15.6x
Beacon Roofing Supply, Inc. 63.76 98.3% 4,319 4,945 4,377 380 6.0% 3.1% 24.6% 8.7% 2.0x 38.9x 1.1x 1.1x 13.0x 12.6x
Builders FirstSource, Inc. 21.79 98.7% 2,461 4,303 6,802 367 78.6% 8.9% 24.8% 5.4% 5.0x 28.6x 0.6x 0.6x 11.7x 9.6x
Boise Cascade Company 39.90 97.4% 1,539 1,804 4,260 195 7.6% 9.8% 13.5% 4.6% 2.3x 22.9x 0.4x 0.4x 9.3x 8.7x
Median 6.8% 6.6% 24.7% 8.7% 2.3x 25.7x 1.2x 1.1x 11.1x 11.2x
Electrical & Communications
Rexel S.A. $18.16 87.9% $5,486 $8,292 $15,793 $757 (5.5%) 8.2% 24.5% 4.8% 4.3x 27.9x 0.5x 0.6x 11.0x 10.8x
WESCO International, Inc. 68.15 89.5% 3,203 4,541 7,476 375 (2.4%) 1.8% 19.4% 5.0% 3.8x 17.7x 0.6x 0.6x 12.1x 11.2x
Anixter International Inc. 76.00 85.8% 2,529 3,722 7,808 372 23.1% 4.1% 20.0% 4.8% 3.4x 17.7x 0.5x 0.5x 10.0x 9.1x
Median (2.4%) 4.1% 20.0% 4.8% 3.8x 17.7x 0.5x 0.6x 11.0x 10.8x
Industrial, MRO & Safety
Air Liquide, société anonyme $126.14 94.1% $53,854 $72,089 $23,286 $5,544 11.4% 21.2% 62.4% 23.8% 3.4x 23.5x 3.1x 3.1x 13.0x 12.3x
Fastenal Company 54.69 98.6% 15,717 16,024 4,250 984 2.4% 8.4% 49.5% 23.2% 0.4x 29.2x 3.8x 3.7x 16.3x 16.5x
W.W. Grainger, Inc. 236.25 89.9% 13,462 15,634 10,263 1,359 1.6% 2.4% 39.5% 13.2% 1.7x 28.2x 1.5x 1.5x 11.5x 11.6x
MSC Industrial Direct Co., Inc. 96.66 91.4% 5,457 5,974 2,888 443 0.8% 0.8% 44.5% 15.3% 1.2x 23.9x 2.1x 2.1x 13.5x 13.2x
Applied Industrial Technologies, Inc. 68.10 97.2% 2,643 2,856 2,650 223 2.9% 2.9% 28.4% 8.4% 1.3x 19.1x 1.1x 1.1x 12.8x 11.8x
DXP Enterprises, Inc. 29.57 70.4% 514 738 963 61 (22.9%) 1.2% 27.1% 6.3% 4.0x 30.3x 0.8x 0.8x 12.2x 11.1x
Median 2.0% 2.6% 42.0% 14.3% 1.5x 26.0x 1.8x 1.8x 12.9x 12.0x
All Indicies Median 2.9% 4.2% 31.5% 8.7% 2.3x 22.9x 1.2x 1.2x 12.1x 11.5x
9
Diversified Industrials – Specialty Distribution I Industry Spotlight
Q4 2017
$587
$700 $704$664
$612 $641 $618
$688 $715 $733 $739
'06 '07 '08 '09 '10 '11 '12 '13 '14 '15 '16
Cu
mu
lati
ve
Dry
Po
wd
er
($ i
n b
illi
on
s)
2017
2016
2015
2014
2013
2012
2011
2010
2009
Overhang by Vintage
$0
$200
$400
$600
$800
$1,000
$1,200
$1,400
$1,600
$1,800
'00 '01 '02 '03 '04 '05 '06 '07 '08 '09 '10 '11 '12 '13 '14 '15 '16 '17
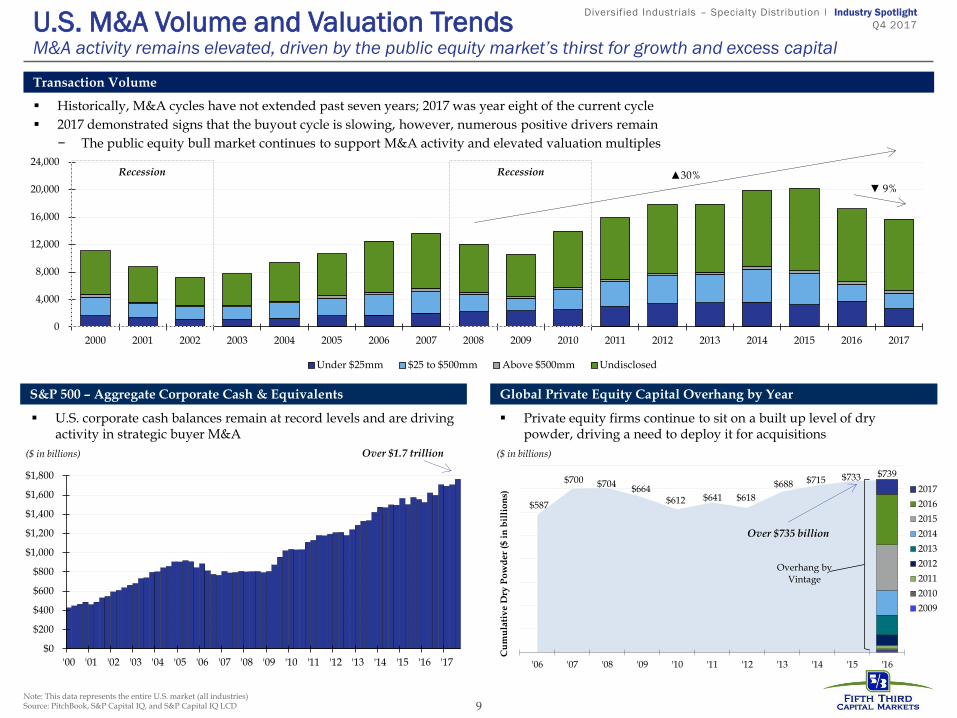
U.S. corporate cash balances remain at record levels and are driving activity in strategic buyer M&A
Historically, M&A cycles have not extended past seven years; 2017 was year eight of the current cycle
2017 demonstrated signs that the buyout cycle is slowing, however, numerous positive drivers remain
− The public equity bull market continues to support M&A activity and elevated valuation multiples
Note: This data represents the entire U.S. market (all industries) Source: PitchBook, S&P Capital IQ, and S&P Capital IQ LCD
0
4,000
8,000
12,000
16,000
20,000
24,000
2000 2001 2002 2003 2004 2005 2006 2007 2008 2009 2010 2011 2012 2013 2014 2015 2016 2017
Under $25mm $25 to $500mm Above $500mm Undisclosed
Transaction Volume
Recession Recession
▼ 9% ▲30%
S&P 500 – Aggregate Corporate Cash & Equivalents
Over $1.7 trillion
Global Private Equity Capital Overhang by Year
Private equity firms continue to sit on a built up level of dry powder, driving a need to deploy it for acquisitions
Over $735 billion
U.S. M&A Volume and Valuation Trends M&A activity remains elevated, driven by the public equity market’s thirst for growth and excess capital
($ in billions) ($ in billions)
10
Diversified Industrials – Specialty Distribution I Industry Spotlight
Q4 2017
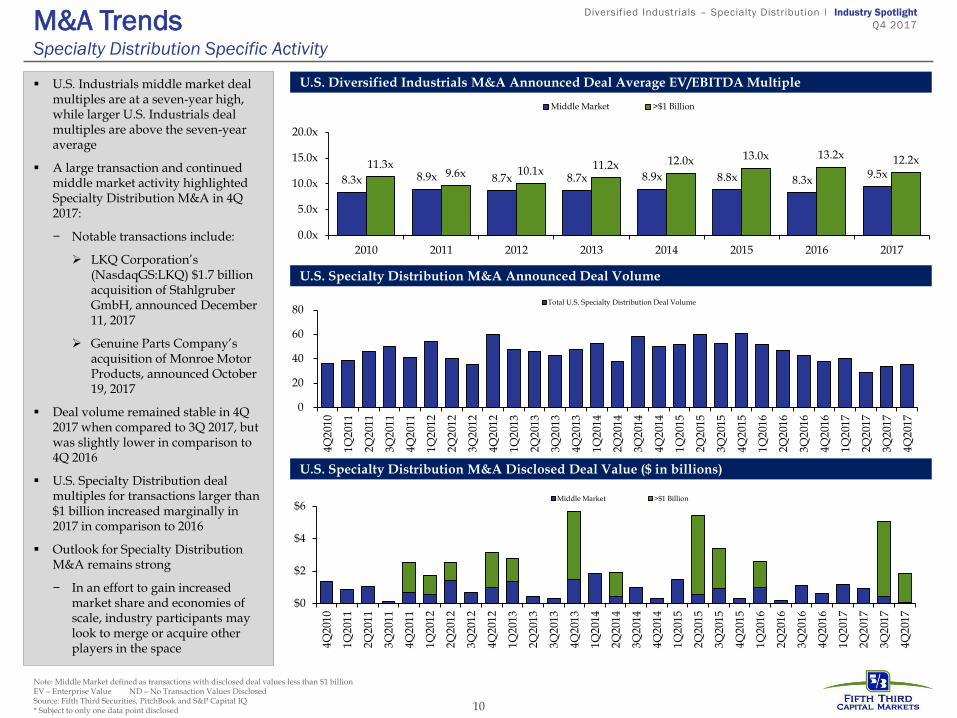
U.S. Diversified Industrials M&A Announced Deal Average EV/EBITDA Multiple U.S. Industrials middle market deal
multiples are at a seven-year high, while larger U.S. Industrials deal multiples are above the seven-year average
A large transaction and continued middle market activity highlighted Specialty Distribution M&A in 4Q 2017:
− Notable transactions include:
LKQ Corporation’s (NasdaqGS:LKQ) $1.7 billion acquisition of Stahlgruber GmbH, announced December 11, 2017
Genuine Parts Company’s acquisition of Monroe Motor Products, announced October 19, 2017
Deal volume remained stable in 4Q 2017 when compared to 3Q 2017, but was slightly lower in comparison to 4Q 2016
U.S. Specialty Distribution deal multiples for transactions larger than $1 billion increased marginally in 2017 in comparison to 2016
Outlook for Specialty Distribution M&A remains strong
− In an effort to gain increased market share and economies of scale, industry participants may look to merge or acquire other players in the space
U.S. Specialty Distribution M&A Announced Deal Volume
U.S. Specialty Distribution M&A Disclosed Deal Value ($ in billions)
Note: Middle Market defined as transactions with disclosed deal values less than $1 billion EV – Enterprise Value ND – No Transaction Values Disclosed Source: Fifth Third Securities, PitchBook and S&P Capital IQ * Subject to only one data point disclosed
M&A Trends Specialty Distribution Specific Activity
$0
$2
$4
$6
4Q
201
0
1Q
201
1
2Q
201
1
3Q
201
1
4Q
201
1
1Q
201
2
2Q
201
2
3Q
201
2
4Q
201
2
1Q
201
3
2Q
201
3
3Q
201
3
4Q
201
3
1Q
201
4
2Q
201
4
3Q
201
4
4Q
201
4
1Q
201
5
2Q
201
5
3Q20
15
4Q
201
5
1Q
201
6
2Q
201
6
3Q
201
6
4Q
201
6
1Q
201
7
2Q
201
7
3Q
201
7
4Q
201
7
Middle Market >$1 Billion
0
20
40
60
80
4Q
201
0
1Q
201
1
2Q
201
1
3Q
201
1
4Q
201
1
1Q
201
2
2Q
201
2
3Q
201
2
4Q
201
2
1Q
201
3
2Q
201
3
3Q
201
3
4Q
201
3
1Q
201
4
2Q20
14
3Q20
14
4Q
201
4
1Q
201
5
2Q
201
5
3Q
201
5
4Q
201
5
1Q
201
6
2Q
201
6
3Q
201
6
4Q
201
6
1Q
201
7
2Q
201
7
3Q
201
7
4Q
201
7
Total U.S. Specialty Distribution Deal Volume
8.3x 8.9x 8.7x 8.7x 8.9x 8.8x 8.3x9.5x
11.3x9.6x 10.1x 11.2x 12.0x 13.0x 13.2x 12.2x
0.0x
5.0x
10.0x
15.0x
20.0x
2010 2011 2012 2013 2014 2015 2016 2017
Middle Market >$1 Billion
11
Diversified Industrials – Specialty Distribution I Industry Spotlight
Q4 2017
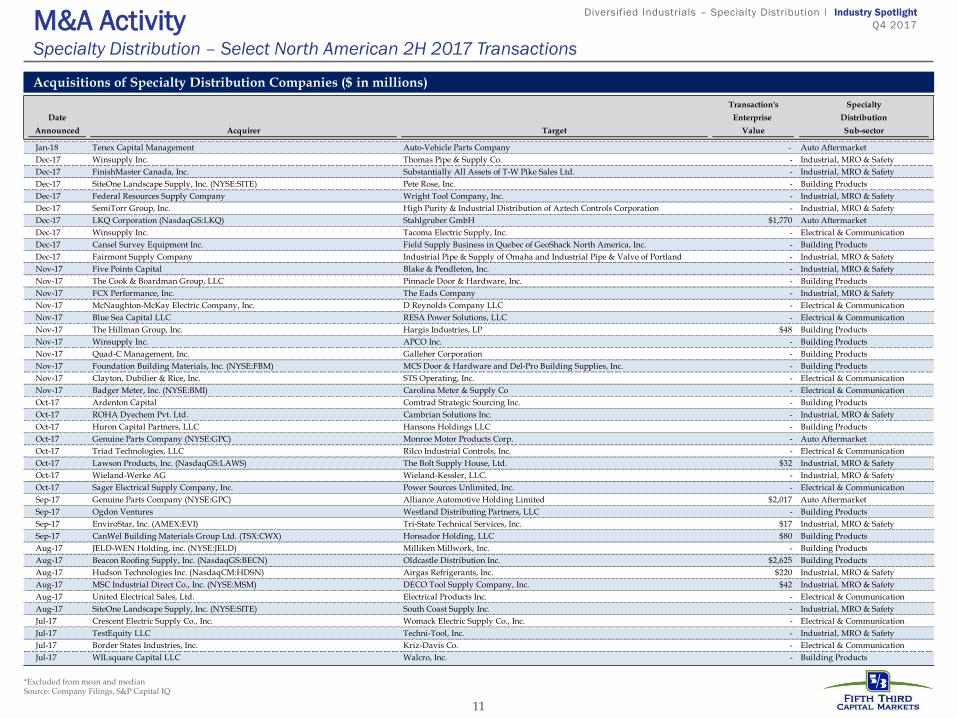
Acquisitions of Specialty Distribution Companies ($ in millions)
M&A Activity Specialty Distribution – Select North American 2H 2017 Transactions
*Excluded from mean and median Source: Company Filings, S&P Capital IQ
Transaction's Specialty Implied
Date Enterprise Distribution Enterprise Value / LTM
Announced Acquirer Target Value Sub-sector
Jan-18 Tenex Capital Management Auto-Vehicle Parts Company - Auto Aftermarket Confidential
Dec-17 Winsupply Inc. Thomas Pipe & Supply Co. - Industrial, MRO & Safety
Dec-17 FinishMaster Canada, Inc. Substantially All Assets of T-W Pike Sales Ltd. - Industrial, MRO & Safety
Dec-17 SiteOne Landscape Supply, Inc. (NYSE:SITE) Pete Rose, Inc. - Building Products
Dec-17 Federal Resources Supply Company Wright Tool Company, Inc. - Industrial, MRO & Safety
Dec-17 SemiTorr Group, Inc. High Purity & Industrial Distribution of Aztech Controls Corporation - Industrial, MRO & Safety
Dec-17 LKQ Corporation (NasdaqGS:LKQ) Stahlgruber GmbH $1,770 Auto Aftermarket
Dec-17 Winsupply Inc. Tacoma Electric Supply, Inc. - Electrical & Communication
Dec-17 Cansel Survey Equipment Inc. Field Supply Business in Quebec of GeoShack North America, Inc. - Building Products
Dec-17 Fairmont Supply Company Industrial Pipe & Supply of Omaha and Industrial Pipe & Valve of Portland - Industrial, MRO & Safety
Nov-17 Five Points Capital Blake & Pendleton, Inc. - Industrial, MRO & Safety
Nov-17 The Cook & Boardman Group, LLC Pinnacle Door & Hardware, Inc. - Building Products
Nov-17 FCX Performance, Inc. The Eads Company - Industrial, MRO & Safety
Nov-17 McNaughton-McKay Electric Company, Inc. D Reynolds Company LLC - Electrical & Communication
Nov-17 Blue Sea Capital LLC RESA Power Solutions, LLC - Electrical & Communication
Nov-17 The Hillman Group, Inc. Hargis Industries, LP $48 Building Products
Nov-17 Winsupply Inc. APCO Inc. - Building Products
Nov-17 Quad-C Management, Inc. Galleher Corporation - Building Products
Nov-17 Foundation Building Materials, Inc. (NYSE:FBM) MCS Door & Hardware and Del-Pro Building Supplies, Inc. - Building Products
Nov-17 Clayton, Dubilier & Rice, Inc. STS Operating, Inc. - Electrical & Communication
Nov-17 Badger Meter, Inc. (NYSE:BMI) Carolina Meter & Supply Co - Electrical & Communication
Oct-17 Ardenton Capital Comtrad Strategic Sourcing Inc. - Building Products
Oct-17 ROHA Dyechem Pvt. Ltd. Cambrian Solutions Inc. - Industrial, MRO & Safety
Oct-17 Huron Capital Partners, LLC Hansons Holdings LLC - Building Products
Oct-17 Genuine Parts Company (NYSE:GPC) Monroe Motor Products Corp. - Auto Aftermarket
Oct-17 Triad Technologies, LLC Rilco Industrial Controls, Inc. - Electrical & Communication
Oct-17 Lawson Products, Inc. (NasdaqGS:LAWS) The Bolt Supply House, Ltd. $32 Industrial, MRO & Safety
Oct-17 Wieland-Werke AG Wieland-Kessler, LLC. - Industrial, MRO & Safety
Oct-17 Sager Electrical Supply Company, Inc. Power Sources Unlimited, Inc. - Electrical & Communication
Sep-17 Genuine Parts Company (NYSE:GPC) Alliance Automotive Holding Limited $2,017 Auto Aftermarket
Sep-17 Ogdon Ventures Westland Distributing Partners, LLC - Building Products
Sep-17 EnviroStar, Inc. (AMEX:EVI) Tri-State Technical Services, Inc. $17 Industrial, MRO & Safety
Sep-17 CanWel Building Materials Group Ltd. (TSX:CWX) Honsador Holding, LLC $80 Building Products
Aug-17 JELD-WEN Holding, inc. (NYSE:JELD) Milliken Millwork, Inc. - Building Products
Aug-17 Beacon Roofing Supply, Inc. (NasdaqGS:BECN) Oldcastle Distribution Inc. $2,625 Building Products
Aug-17 Hudson Technologies Inc. (NasdaqCM:HDSN) Airgas Refrigerants, Inc. $220 Industrial, MRO & Safety
Aug-17 MSC Industrial Direct Co., Inc. (NYSE:MSM) DECO Tool Supply Company, Inc. $42 Industrial, MRO & Safety
Aug-17 United Electrical Sales, Ltd. Electrical Products Inc. - Electrical & Communication
Aug-17 SiteOne Landscape Supply, Inc. (NYSE:SITE) South Coast Supply Inc. - Industrial, MRO & Safety
Jul-17 Crescent Electric Supply Co., Inc. Womack Electric Supply Co., Inc. - Electrical & Communication
Jul-17 TestEquity LLC Techni-Tool, Inc. - Industrial, MRO & Safety
Jul-17 Border States Industries, Inc. Kriz-Davis Co. - Electrical & Communication
Jul-17 WILsquare Capital LLC Walcro, Inc. - Building Products
12
Diversified Industrials – Specialty Distribution I Industry Spotlight
Q4 2017
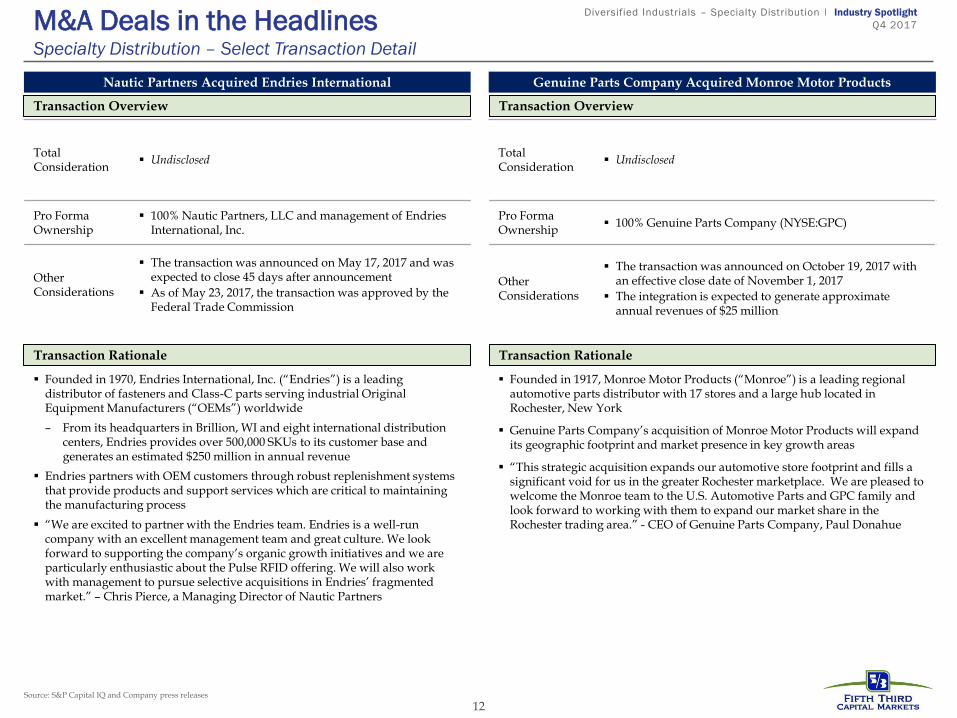
Total Consideration
Undisclosed
Pro Forma Ownership
100% Genuine Parts Company (NYSE:GPC)
Other Considerations
The transaction was announced on October 19, 2017 with an effective close date of November 1, 2017
The integration is expected to generate approximate annual revenues of $25 million
M&A Deals in the Headlines Specialty Distribution – Select Transaction Detail
Total Consideration
Undisclosed
Pro Forma Ownership
100% Nautic Partners, LLC and management of Endries International, Inc.
Other Considerations
The transaction was announced on May 17, 2017 and was expected to close 45 days after announcement
As of May 23, 2017, the transaction was approved by the Federal Trade Commission
Transaction Overview Transaction Overview
Transaction Rationale Transaction Rationale
Founded in 1970, Endries International, Inc. (“Endries”) is a leading distributor of fasteners and Class-C parts serving industrial Original Equipment Manufacturers (“OEMs”) worldwide
– From its headquarters in Brillion, WI and eight international distribution centers, Endries provides over 500,000 SKUs to its customer base and generates an estimated $250 million in annual revenue
Endries partners with OEM customers through robust replenishment systems that provide products and support services which are critical to maintaining the manufacturing process
“We are excited to partner with the Endries team. Endries is a well-run company with an excellent management team and great culture. We look forward to supporting the company’s organic growth initiatives and we are particularly enthusiastic about the Pulse RFID offering. We will also work with management to pursue selective acquisitions in Endries’ fragmented market.” – Chris Pierce, a Managing Director of Nautic Partners
Founded in 1917, Monroe Motor Products (“Monroe”) is a leading regional automotive parts distributor with 17 stores and a large hub located in Rochester, New York
Genuine Parts Company’s acquisition of Monroe Motor Products will expand its geographic footprint and market presence in key growth areas
“This strategic acquisition expands our automotive store footprint and fills a significant void for us in the greater Rochester marketplace. We are pleased to welcome the Monroe team to the U.S. Automotive Parts and GPC family and look forward to working with them to expand our market share in the Rochester trading area.” - CEO of Genuine Parts Company, Paul Donahue
Source: S&P Capital IQ and Company press releases
Genuine Parts Company Acquired Monroe Motor Products Nautic Partners Acquired Endries International
13
Diversified Industrials – Specialty Distribution I Industry Spotlight
Q4 2017
Overall U.S. Private Equity Deal Flow ($ in billions)
U.S. Specialty Distribution Private Equity Deal Flow ($ in billions)
U.S. Specialty Distribution Private Equity Exits ($ in millions)
*4Q17 preliminary PitchBook data ND – No Transaction Values Disclosed Source: Fifth Third Securities, PitchBook
Private Equity Activity Specialty Distribution
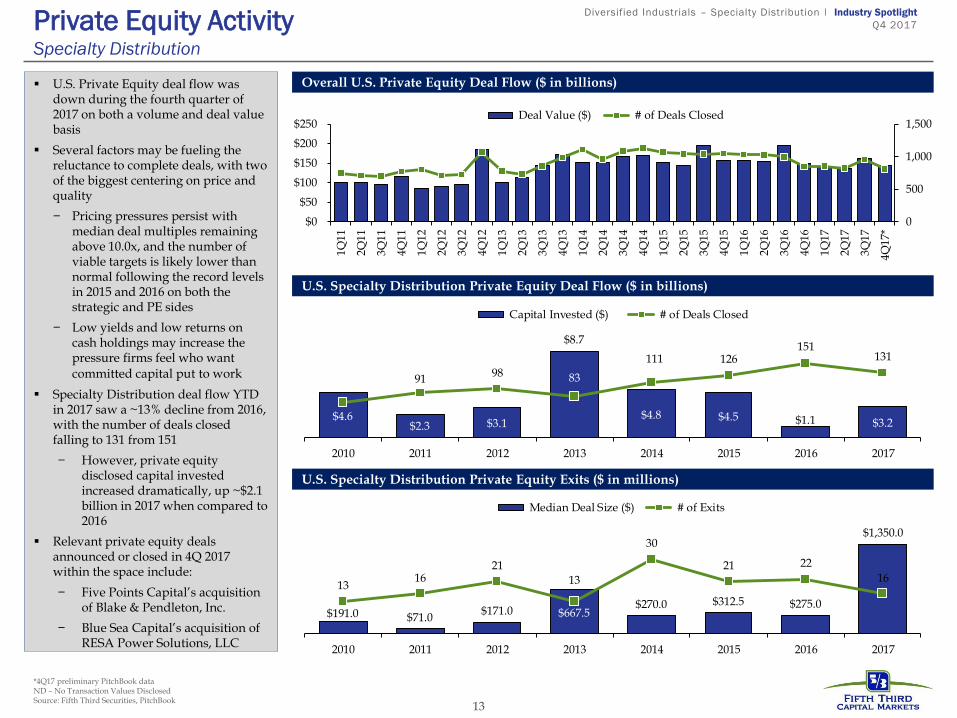
U.S. Private Equity deal flow was down during the fourth quarter of 2017 on both a volume and deal value basis
Several factors may be fueling the reluctance to complete deals, with two of the biggest centering on price and quality
− Pricing pressures persist with median deal multiples remaining above 10.0x, and the number of viable targets is likely lower than normal following the record levels in 2015 and 2016 on both the strategic and PE sides
− Low yields and low returns on cash holdings may increase the pressure firms feel who want committed capital put to work
Specialty Distribution deal flow YTD in 2017 saw a ~13% decline from 2016, with the number of deals closed falling to 131 from 151
− However, private equity disclosed capital invested increased dramatically, up ~$2.1 billion in 2017 when compared to 2016
Relevant private equity deals announced or closed in 4Q 2017 within the space include:
− Five Points Capital’s acquisition of Blake & Pendleton, Inc.
− Blue Sea Capital’s acquisition of RESA Power Solutions, LLC
$4.6 $2.3 $3.1
$8.7
$4.8 $4.5 $1.1 $3.2
7291
98 83
111 126151
131
2010 2011 2012 2013 2014 2015 2016 2017
Capital Invested ($) # of Deals Closed
$191.0 $71.0$171.0 $667.5
$270.0 $312.5 $275.0
$1,350.0
1316
21
13
30
21 22
16
2010 2011 2012 2013 2014 2015 2016 2017
Median Deal Size ($) # of Exits
0
500
1,000
1,500
$0
$50
$100
$150
$200
$250
1Q
11
2Q11
3Q11
4Q
11
1Q
12
2Q
12
3Q
12
4Q
12
1Q
13
2Q
13
3Q
13
4Q
13
1Q
14
2Q
14
3Q
14
4Q
14
1Q
15
2Q
15
3Q
15
4Q
15
1Q
16
2Q
16
3Q
16
4Q
16
1Q
17
2Q17
3Q17
4Q
17*
Deal Value ($) # of Deals Closed
14
Diversified Industrials – Specialty Distribution I Industry Spotlight
Q4 2017
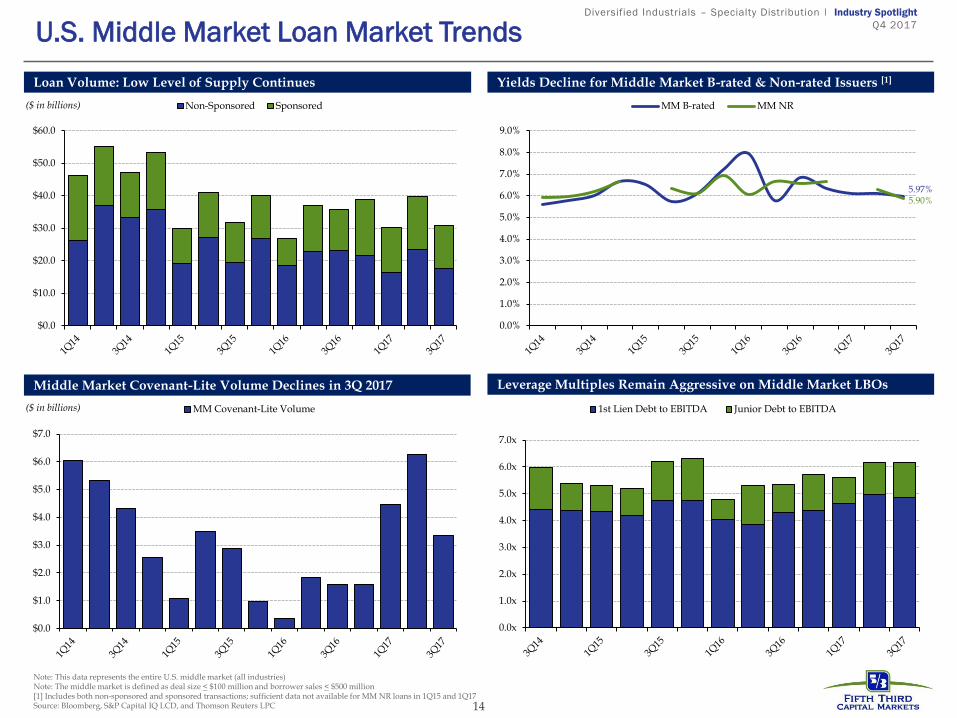
Note: This data represents the entire U.S. middle market (all industries) Note: The middle market is defined as deal size < $100 million and borrower sales < $500 million [1] Includes both non-sponsored and sponsored transactions; sufficient data not available for MM NR loans in 1Q15 and 1Q17 Source: Bloomberg, S&P Capital IQ LCD, and Thomson Reuters LPC
U.S. Middle Market Loan Market Trends
Loan Volume: Low Level of Supply Continues Yields Decline for Middle Market B-rated & Non-rated Issuers [1]
Middle Market Covenant-Lite Volume Declines in 3Q 2017 Leverage Multiples Remain Aggressive on Middle Market LBOs
$0.0
$10.0
$20.0
$30.0
$40.0
$50.0
$60.0
Non-Sponsored Sponsored($ in billions)
0.0%
1.0%
2.0%
3.0%
4.0%
5.0%
6.0%
7.0%
8.0%
9.0%
MM B-rated MM NR
5.97%
5.90%
$0.0
$1.0
$2.0
$3.0
$4.0
$5.0
$6.0
$7.0
MM Covenant-Lite Volume($ in billions)
0.0x
1.0x
2.0x
3.0x
4.0x
5.0x
6.0x
7.0x
1st Lien Debt to EBITDA Junior Debt to EBITDA
15
Diversified Industrials – Specialty Distribution I Industry Spotlight
Q4 2017 Pro Rata Market Update: 3Q 2017 Bank Terms Remain Relatively Unchanged Over Prior Quarter
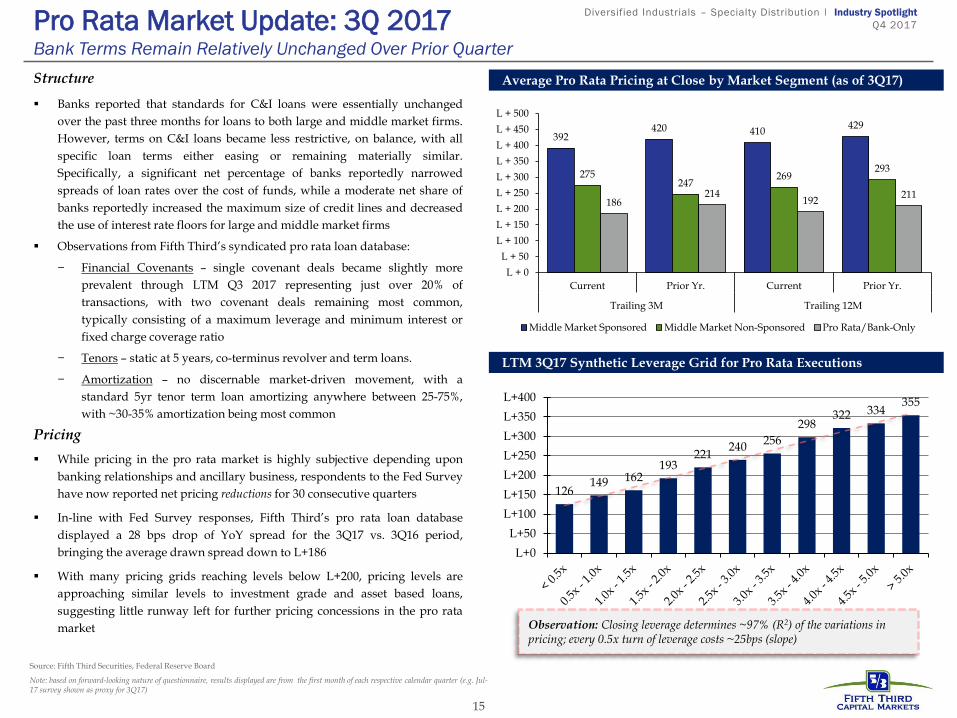
Structure
Banks reported that standards for C&I loans were essentially unchanged
over the past three months for loans to both large and middle market firms.
However, terms on C&I loans became less restrictive, on balance, with all
specific loan terms either easing or remaining materially similar.
Specifically, a significant net percentage of banks reportedly narrowed
spreads of loan rates over the cost of funds, while a moderate net share of
banks reportedly increased the maximum size of credit lines and decreased
the use of interest rate floors for large and middle market firms
Observations from Fifth Third’s syndicated pro rata loan database:
− Financial Covenants – single covenant deals became slightly more
prevalent through LTM Q3 2017 representing just over 20% of
transactions, with two covenant deals remaining most common,
typically consisting of a maximum leverage and minimum interest or
fixed charge coverage ratio
− Tenors – static at 5 years, co-terminus revolver and term loans.
− Amortization – no discernable market-driven movement, with a
standard 5yr tenor term loan amortizing anywhere between 25-75%,
with ~30-35% amortization being most common
Pricing
While pricing in the pro rata market is highly subjective depending upon
banking relationships and ancillary business, respondents to the Fed Survey
have now reported net pricing reductions for 30 consecutive quarters
In-line with Fed Survey responses, Fifth Third’s pro rata loan database
displayed a 28 bps drop of YoY spread for the 3Q17 vs. 3Q16 period,
bringing the average drawn spread down to L+186
With many pricing grids reaching levels below L+200, pricing levels are
approaching similar levels to investment grade and asset based loans,
suggesting little runway left for further pricing concessions in the pro rata
market
Source: Fifth Third Securities, Federal Reserve Board
Note: based on forward-looking nature of questionnaire, results displayed are from the first month of each respective calendar quarter (e.g. Jul-17 survey shown as proxy for 3Q17)
Average Pro Rata Pricing at Close by Market Segment (as of 3Q17)
LTM 3Q17 Synthetic Leverage Grid for Pro Rata Executions
126 149 162
193 221
240 256
298 322 334
355
L+0
L+50
L+100
L+150
L+200
L+250
L+300
L+350
L+400
Observation: Closing leverage determines ~97% (R2) of the variations in pricing; every 0.5x turn of leverage costs ~25bps (slope)
392420 410
429
275247
269293
186214
192211
L + 0
L + 50
L + 100
L + 150
L + 200
L + 250
L + 300
L + 350
L + 400
L + 450
L + 500
Current Prior Yr. Current Prior Yr.
Trailing 3M Trailing 12M
Middle Market Sponsored Middle Market Non-Sponsored Pro Rata/Bank-Only
16
Diversified Industrials – Specialty Distribution I Industry Spotlight
Q4 2017
0%
10%
20%
30%
40%
50%
60%
70%
80%
90%
100%
Gen. Corp. Purp. Amend & Extends DIP/Exit Fin. M&A Other
Asset Based Lending Market Update
ABL Volume and Deal Count ($ billions)
ABL Average Pro Rata Pricing
Source: Thomson Reuters LPC
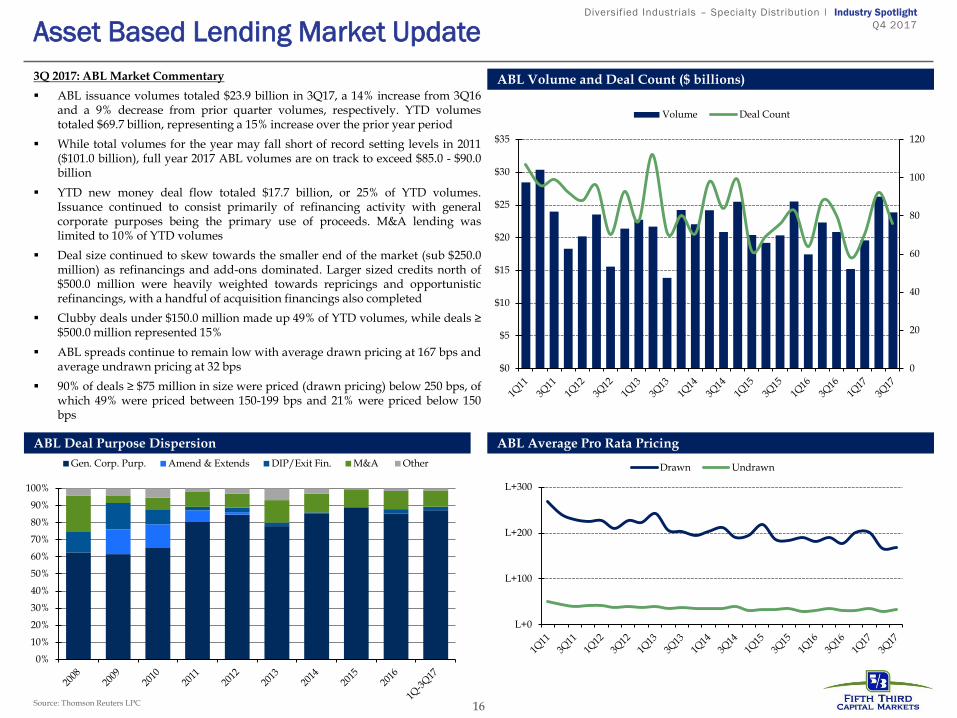
3Q 2017: ABL Market Commentary
ABL issuance volumes totaled $23.9 billion in 3Q17, a 14% increase from 3Q16 and a 9% decrease from prior quarter volumes, respectively. YTD volumes totaled $69.7 billion, representing a 15% increase over the prior year period
While total volumes for the year may fall short of record setting levels in 2011 ($101.0 billion), full year 2017 ABL volumes are on track to exceed $85.0 - $90.0 billion
YTD new money deal flow totaled $17.7 billion, or 25% of YTD volumes. Issuance continued to consist primarily of refinancing activity with general corporate purposes being the primary use of proceeds. M&A lending was limited to 10% of YTD volumes
Deal size continued to skew towards the smaller end of the market (sub $250.0 million) as refinancings and add-ons dominated. Larger sized credits north of $500.0 million were heavily weighted towards repricings and opportunistic refinancings, with a handful of acquisition financings also completed
Clubby deals under $150.0 million made up 49% of YTD volumes, while deals ≥ $500.0 million represented 15%
ABL spreads continue to remain low with average drawn pricing at 167 bps and average undrawn pricing at 32 bps
90% of deals ≥ $75 million in size were priced (drawn pricing) below 250 bps, of which 49% were priced between 150-199 bps and 21% were priced below 150 bps
ABL Deal Purpose Dispersion
L+0
L+100
L+200
L+300
Drawn Undrawn
0
20
40
60
80
100
120
$0
$5
$10
$15
$20
$25
$30
$35
Volume Deal Count
17
Diversified Industrials – Specialty Distribution I Industry Spotlight
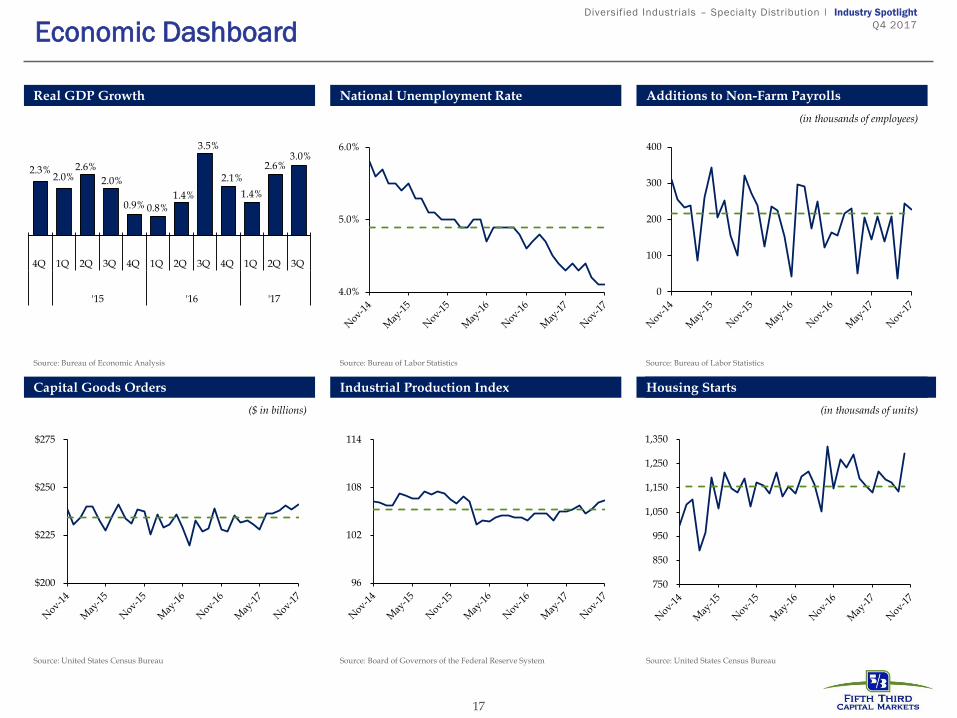
Q4 2017 Economic Dashboard
Industrial Production Index Capital Goods Orders Housing Starts
Source: Board of Governors of the Federal Reserve System
($ in billions)
Source: United States Census Bureau
National Unemployment Rate Real GDP Growth Additions to Non-Farm Payrolls
Housing Starts
Source: Bureau of Economic Analysis Source: Bureau of Labor Statistics Source: Bureau of Labor Statistics
Source: United States Census Bureau
(in thousands of employees)
(in thousands of units)
$200
$225
$250
$275
96
102
108
114
2.3%2.0%
2.6%
2.0%
0.9% 0.8%1.4%
3.5%
2.1%
1.4%
2.6%3.0%
4Q 1Q 2Q 3Q 4Q 1Q 2Q 3Q 4Q 1Q 2Q 3Q
'15 '16 '170
100
200
300
400
750
850
950
1,050
1,150
1,250
1,350
4.0%
5.0%
6.0%
18
Diversified Industrials – Specialty Distribution I Industry Spotlight
Q4 2017 Notes & Definitions
S&P 500 Index- A broad index that includes American Companies. EBITDA- A company's earnings before interest, taxes, depreciation, and amortization, is an accounting measure calculated using a company's net earnings, before interest expenses, taxes, depreciation and amortization are subtracted, as a proxy for a company's current operating profitability. Dry Powder- Refers to cash reserves kept on hand to cover future obligations or to purchase assets. GDP- Gross domestic product is the market value of the goods and services produced by labor and property located in the United States Consumer Sentiment Index- The University of Michigan Consumer Sentiment Index is a consumer confidence index published monthly by the University of Michigan. The index is normalized to have a value of 100 in December 1964 National Unemployment Rate- the percentage of the total labor force that is unemployed but actively seeking employment and willing to work. Non-Farm Payroll- Nonfarm payroll employment is a compiled name for goods, construction and manufacturing companies in the US. It does not include farm workers, private household employees, non-profit organization employees, or government employees . It is an economic indicator released monthly by the United States Department of Labor as part of a comprehensive report on the state of the labor market. Housing Starts- are the number of new residential construction projects that have begun during any particular month. The Economist- offers authoritative insight and opinion on international news, politics, business, finance, science, technology and the connections between them LBO -- leveraged buyout (LBO) is the acquisition of another company using a significant amount of borrowed money to meet the cost of acquisition. The assets of the company being acquired are often used as collateral for the loans, along with the assets of the acquiring company. Industrial Production Index (IPI)- is an economic indicator published by the Federal Reserve Board of the United States that measures the real production output of manufacturing, mining, and utilities Capital Goods Orders. Covenant-lite loans- means that debt is being issued, both personally and commercially, to borrowers with less restrictions on collateral, payment terms, and level of income. IRR-Internal Rate of Return.
About Fifth Third Capital Markets
Fifth Third Capital Markets is the marketing name under which Fifth Third Bank and its subsidiary, Fifth Third Securities, Inc., provide certain securities and investment banking products and services. Banking products and services are offered by Fifth Third Bank. Securities products and services are offered by licensed securities representatives of Fifth Third Securities, Inc., who may be employees of Fifth Third Bank. Important notice This document has been prepared by Fifth Third Bank (“Fifth Third”) or one of its subsidiaries for the sole purpose of providing a proposal to the parties to whom it is addressed in order that they may evaluate the capabilities of Fifth Third to supply the proposed services. It is not intended to provide specific investment advice or investment recommendations and does not constitute either a commitment to enter into a specific transaction or an offer or solicitation, with respect to the purchase or sale of any security. The information contained in this document has been compiled by Fifth Third and includes material which may have been obtained from information provided by various sources and discussions with management but has not been verified or audited. This document also contains confidential material proprietary to Fifth Third. Except in the general context of evaluating our capabilities, no reliance may be placed for any purposes whatsoever on the contents of this document or on its completeness. No representation or warranty, express or implied, is given and no responsibility or liability is or will be accepted by or on behalf of Fifth Third or by any of its subsidiaries, members, employees, agents or any other person as to the accuracy, completeness or correctness of the information contained in this document or any other oral information made available and any such liability is expressly disclaimed. This document and its contents are confidential and may not be reproduced, redistributed or passed on, directly or indirectly, to any other person in whole or in part without our prior written consent.. Fifth Third Capital Markets is a wholly owned subsidiary of Fifth Third Bank offering investment banking++, debt capital markets+, bond capital markets++, equity capital markets++, financial risk management+, and fixed income sales and trading++. Fifth Third Bank provides access to investments and investment services through various subsidiaries, including Fifth Third Securities. Fifth Third Securities is the trade name used by Fifth Third Securities, Inc., member FINRA/SIPC, a registered broker-dealer and registered investment advisor registered with the U.S. Securities and Exchange Commission (SEC). Registration does not imply a certain level of skill or training. Securities and investments offered through Fifth Third Securities, Inc. and insurance products: + Services and activities offered through Fifth Third Bank ++ Services and activities offered through Fifth Third Securities, Inc © Fifth Third Bank 2018
19
Are Not FDIC Insured Offer No Bank Guarantee May Lose Value
Are Not Insured By Any Federal Government Agency Are Not A Deposit
19


![Investment Banking I Industry Spotlight · 2020-01-10 · 5 Tech-Enabled Business Services I Industry Spotlight Q3 2018 Public Market Valuation Trends [1] In this chart, the blue](https://img.pdfslide.us/doc/110x75/5e44ff080035021ef24b30df/investment-banking-i-industry-spotlight-2020-01-10-5-tech-enabled-business-services.jpg)