Embed Size (px)
Citation preview

This document is downloaded from DR‑NTU (https://dr.ntu.edu.sg)Nanyang Technological University, Singapore.
Investigations of grid‑connected wind powersystem : low voltage ride through and powerquality issues
Zhang, Shao
2011
Zhang, S. (2011). Investigations of grid‑connected wind power system : low voltage ridethrough and power quality issues. Doctoral thesis, Nanyang Technological University,Singapore.
https://hdl.handle.net/10356/46297
https://doi.org/10.32657/10356/46297
Downloaded on 03 Feb 2022 07:39:27 SGT

Investigations of Grid-Connected Wind Power System – Low
Voltage Ride Through and Power Quality Issues
Zhang Shao
School of Electrical & Electronic Engineering
A thesis submitted to the Nanyang Technological University
in partial fulfillment of the requirement for the degree of
Doctor of Philosophy
2011

Acknowledgement
i
Acknowledgements
First of all, I would like to express my sincere appreciation to my dedicated supervisor,
Dr. K.J. Tseng, for the consistent guidance and encouragement he has provided
throughout my research in Nanyang Technological University. His patience and kindness
are greatly appreciated. His constructive insights and profound knowledge have helped to
shape my research skills. His pleasant personality and understanding have inspired me
through difficult times. I have learnt from him a lot not only about the scientific research,
but also the professional ethics.
I am also deeply thankful to Prof. Choi San Shing, Dr. Don Mahinda Vilathgamuwa, Dr.
Luo Fang Lin, Dr. Loh Poh Chiang, Dr. Ali Iftekhar Maswood, and Dr. HAQUE
Mohammed Hamidul for their knowledge, guidance, fruitful discussions throughout my
study and research in Nanyang Technological University. I am greatly indebted to their
broad interests, high enthusiasms for research and exemplary academic standards.
I would like to thank all the technical staff in the Power Electronics Research Laboratory:
Mr. Chua Tiam Lee, Ms. Lee-Loh Chin Khim, Ms. Tan-Goh Jie Jiuan, and Mr. Teo Tiong
Seng; in the Laboratory for Clean Energy Research: Mr Thomas Foo, Ms Nge Tak Heng,
for their technical support in the equipment usage and the software installation. I would
like to extend my appreciation to Ms. Koh Lee Min and Ms. Chew Sim Annie for their
continuous consideration.
I also wish to express my thanks to my laboratory fellows and friends, especially to Dr.
Wang Xiaoyu, Dr. Zhang Chi, Mr. Nguyen Trong Duy, Mr. Wang Mingqiang, Ms. Yao
Dailin for their friendly assistance in my research and everyday life. The financial
assistance offered by Nanyang Technological University is gratefully acknowledged.
Special thanks are dedicated to my wife Huang Lei for her consistent encouragement. I
offer my deepest gratitude to my family and particularly to my parents in law and parents
for their love, understanding and support.

Summary
ii
Summary
This thesis presents an investigation on system architecture, control and analysis of wind
turbine generators to improve grid integration performance. First of all, the main grid
connection requirements have been reviewed in terms of safety operation of transmission
systems as well as the wind turbine configurations. Due to these requirements, there have
been conscious efforts made by wind turbine manufacturers to design grid compatible
wind turbines, which are able to improve turbine operating performance and eliminate
negative impacts on the utility, with features such as strong fault ride-through capability,
flexible voltage regulation and good power quality performance. All these expectations
provided the motivation to carry out the research described in this thesis.
Doubly-fed induction generator (DFIG) wind turbine technology has been extensively
applied by many turbine manufacturers due to the low cost of its partial-scale power
electronics converter. However, enhancing ride-through capability under grid fault events
has been worldwide recognized as a challenging problem of the DFIG-based wind
generation systems. The operating principle and numerical simulation of DFIG-based
wind turbine are thus reviewed, which give the fundamentals to analyze the essential
behaviors during grid faults. Consequently, a ride-through enhancing solution is proposed
based on series compensation principle. The compensator is in series with the stator
windings of the DFIG in order to eliminate the impacts caused by grid voltage faults.
Furthermore, an advanced ride-through control scheme based on ramp-function injection
voltage is developed to significantly reduce the energy capacity requirement of the series
compensator, which in turn reduces the capital cost. The performance of the developed
architecture has been verified in simulation.
Compared to DFIG, full scale power electronics converter based wind generators such as
those using permanent magnet synchronous generators (PMSG), exhibit superior ride-
through and grid support performances. The PMSG will likely be the mainstream turbine
generator in most new installations in the next decade. In the PMSG configuration, the
power electronics play the crucial function of power interface and buffer to bridge the
PMSG and the utility. This project proposes an integration of a three-switch buck-type
rectifier and a grid-side Z-source inverter for the application of PMSG wind turbine,

Summary
iii
which aims to produce a robust design of wind power generation system. The modulation
technique, analysis and demonstration of this topology have been studied in details in this
project. Subsequently, the design methodology, the simulation studies, and the
experimental verification of a PMSG wind turbine based on this new power converter are
presented. The proposed generator-side control strategy is optimized from the
fundamentals of the Id=0 control and the unity power factor control. In addition, voltage-
oriented control is used for the grid-side inverter to decouple active and reactive power
control while extracting the maximum wind power by adjusting the shoot-through
duration of the Z-source network. The numerical simulation and experimental results
have verified the proposed control schemes.
Regardless of DFIG or PMSG, wind power capacity will have a significant percentage of
the worldwide electricity demand in the next decade, especially in western European
countries. Consequently, grid connected wind power will be significant enough to affect
the operation of utility in terms of voltage regulation and frequency control. Thus there is
a need to devise reliable methods to accurately quantify the impacts so as to obtain the
most appropriate and economical solution to mitigate the negative impacts. Hence,
another original contribution of this thesis is a statistics-based analysis method for the
purpose of assessing the impact on voltage quality caused by large wind power generation.
Herein, voltage deviation has been calculated using the probabilistic models of wind
power production and grid Thevenin impedance. An index called the significance level of
the voltage deviation α has been developed to provide a probabilistic measure of the
voltage quality performance. By considering the contributing factor from each of the grid
states that constitute α, possible solution methods to improve voltage quality can be
obtained. A case study has been included to illustrate the effectiveness of the proposed
method.

Table of Contents
iv
Table of Contents
Acknowledgements ............................................................................................................. i
Summary ............................................................................................................................ ii
Table of Contents .............................................................................................................. iv
List of Figures ................................................................................................................. viii
List of Tables .................................................................................................................... xii
List of Abbreviations ...................................................................................................... xiii
List of Principal Symbols ................................................................................................ xv
CHAPTER 1 INTRODUCTION ..................................................................................... 1
1.1 Motivation ................................................................................................................ 1
1.2 Objectives ................................................................................................................. 4
1.3 Major contributions of the thesis .............................................................................. 5
1.4 Organization of the thesis ......................................................................................... 7
CHAPTER 2 LITERATURE REVIEW ........................................................................ 9
2.1 Introduction .............................................................................................................. 9
2.2 Wind market development ........................................................................................ 9
2.3 The advances in wind turbine technology .............................................................. 12
2.3.1 Fixed rotor speed wind turbine ....................................................................... 13
2.3.2 Partial variable speed wind turbine ................................................................. 15
2.3.3 Variable speed wind turbine ........................................................................... 16
2.4 Review on types of generator machines ................................................................. 16
2.4.1 Doubly fed induction generator type .............................................................. 16
2.4.2 Permanent magnet synchronous generator type .............................................. 18
2.4.3 Synchronous generator type ............................................................................ 19
2.4.4 Squirrel cage induction generator type ........................................................... 20
2.4.5 Switched reluctance generator type ................................................................ 22
2.4.6 Summary of the wind power configurations ................................................... 22
2.5 Grid regulation for wind turbines/plants ................................................................ 24
2.5.1 Ride-through ability of wind turbine .............................................................. 25
2.5.2 Control of voltage and reactive power ............................................................ 27
2.5.3 Active power and frequency regulation .......................................................... 30

Table of Contents
v
2.5.4 Power quality issues ........................................................................................ 31
2.6 The potential challenges for grid-connected wind turbines .................................... 33
2.6.1 Fault ride-through enhancement for DFIG wind turbine ................................ 33
2.6.2 Power architecture improvement for PMSG wind turbine ............................. 36
2.6.3 Potential methods to quantify wind power impacts ........................................ 38
2.7 Conclusion .............................................................................................................. 40
CHAPTER 3 RIDE-THROUGH ENHANCEMENT OF DFIG WIND TURBINES
BASED ON SERIES VOLTAGE COMPENSATION ................................................ 42
3.1 Introduction ............................................................................................................ 42
3.2 Fundamentals of DFIG wind turbine ...................................................................... 43
3.2.1 Mathematical model of DFIG ......................................................................... 43
3.2.2 Field oriented control of DFIG ....................................................................... 45
3.3 A series compensator based ride-through enhancement for DFIG ......................... 53
3.4 Essential behavior of DFIG during grid fault ......................................................... 55
3.4.1 Phasor diagram during normal operation ........................................................ 55
3.4.2 Phasor diagram during grid fault condition .................................................... 57
3.4.3 Key factors on the DFIG fault operation ........................................................ 60
3.4.4 Advantages and disadvantages of DFIG ......................................................... 61
3.5 General control principle of the series compensator .............................................. 62
3.5.1 Voltage sag detection ...................................................................................... 62
3.5.2 Reference voltage generation for series compensator ..................................... 67
3.5.3 Advantages and Disadvantages of DFIG-Series compensator ....................... 68
3.6 Improved ride-through control of DFIG-Series compensator ................................ 69
3.7 Simulation results for DFIG ................................................................................... 72
3.7.1 Simulation results for DFIG during normal operation .................................... 73
3.7.2 Simulation results for DFIG during faults ...................................................... 76
3.7.3 Performance of DFIG ...................................................................................... 78
3.8 Simulation results for series compensated DFIG ................................................... 79
3.8.1 Simulation results for series compensated DFIG during normal operation .... 79
3.8.2 Simulation results for series compensated DFIG during faults ...................... 79
3.8.3 Performance of series compensated DFIG ...................................................... 83
3.9 Conclusion .............................................................................................................. 84
CHAPTER 4 MODULATION AND ANALYSIS OF THREE-SWITCH BUCK-
TYPE RECTIFIER BASED Z-SOURCE INVERTER ............................................... 85

Table of Contents
vi
4.1 Introduction ............................................................................................................ 85
4.2 Derivation of the proposed topology for PMSG turbine ........................................ 85
4.2.1 Principle of Z-Source inverter ......................................................................... 85
4.2.2 Principle of indirect matrix converter ............................................................. 86
4.2.3 Derivation of the three-switch buck-type rectifier based Z-Source inverter .. 87
4.3 Operation and Modulation of three-switch rectifier based Z-Source inverter ........ 90
4.3.1 Space vector modulation ................................................................................. 90
4.3.2 Control of indirect matrix converter ............................................................... 92
4.3.3 Modulation of the developed converter .......................................................... 93
4.4 Circuit analysis of the developed Z-Source inverter .............................................. 94
4.4.1 Equivalent circuit analysis .............................................................................. 95
4.4.2 Obtainable voltage transfer ratio ..................................................................... 98
4.5 Simulation and experimental verification ............................................................... 99
4.5.1 Simulation results ............................................................................................ 99
4.5.2 Experimental results ...................................................................................... 102
4.6 Comparison of simulation and experimental results ............................................ 105
4.7 Conclusions .......................................................................................................... 106
CHAPTER 5 DESIGN OF A ROBUST PMSG TURBINE SYSTEM BASED ON
THE DEVELOPED TOPOLOGY ............................................................................... 107
5.1 Introduction .......................................................................................................... 107
5.2 Generator-side (PMSG) control principle ............................................................ 108
5.2.1 Unity power factor control of PMSG ............................................................ 109
5.2.2 Id=0 control of PMSG................................................................................... 109
5.2.3 Optimized control strategy of PMSG ............................................................ 110
5.3 System control scheme considering turbine characteristics ................................. 112
5.3.1 Maximum power point tracking .................................................................... 112
5.3.2 Control of power delivered into grid ............................................................. 114
5.4 Design consideration of the passive components ................................................. 115
5.4.1 Parameters design of the Z-Source network ................................................. 115
5.4.2 Parameters design of the generator-side filter ............................................... 116
5.5 Simulation and experimental verification ............................................................. 117
5.5.1 Simulation results .......................................................................................... 117
5.5.2 Experimental results ...................................................................................... 124
5.5.3 Comparison of simulation and experimental results ..................................... 128

Table of Contents
vii
5.5.4 Comparison with other topology ................................................................... 129
5.6 Conclusion ............................................................................................................ 130
CHAPTER 6 STATISTICAL VOLTAGE QUALITY ASSESSMENT METHOD
FOR GRIDS WITH WIND POWER GENERATION .............................................. 131
6.1 Introduction .......................................................................................................... 131
6.2 Preliminary considerations ................................................................................... 131
6.2.1 Network description ...................................................................................... 131
6.2.2 Impact on the PCC voltage ........................................................................... 133
6.3 Probabilistic analysis of PCC voltage deviation................................................... 134
6.3.1 Probabilistic model of wind power generation ............................................. 135
6.3.2 Grid Thevenin equivalent impedance probabilistic model ........................... 138
6.3.3 Probabilistic voltage deviation ...................................................................... 139
6.4 Significant level of voltage deviation ................................................................... 140
6.5 Case study ............................................................................................................. 142
6.5.1 Wind power distribution ............................................................................... 143
6.5.2 Grid Thevenin impedance ............................................................................. 144
6.5.3 Voltage deviations probability ...................................................................... 145
6.5.4 Screening network states ............................................................................... 149
6.5.5 Additional comparison with other Methods .................................................. 150
6.6 Conclusion ............................................................................................................ 152
CHAPTER 7 CONCLUSIONS AND RECOMMENDATIONS .............................. 153
7.1 Conclusions .......................................................................................................... 153
7.2 Recommendations ................................................................................................ 155
AUTHOR’S PUBLICATIONS ..................................................................................... 157
BIBLIOGRAPHY .......................................................................................................... 159
APPENDICES ................................................................................................................ 169
Appendix A: Laplace transform ................................................................................. 169
Appendix B: Wind power probability calculation ...................................................... 171

List of Figures
viii
List of Figures
Fig.2.1 World total installed wind power capacity ........................................................... 10
Fig.2.2 Country share of total capacity in 2009 ............................................................... 10
Fig.2.3 Projected total installed wind capacity 1997-2020 .............................................. 11
Fig.2.4 A fundamental wind turbine configuration .......................................................... 12
Fig.2.5 Fixed speed wind turbine with squirrel cage induction generator ....................... 13
Fig.2.6 Fixed speed turbine configuration with permanent magnet synchronous generator
........................................................................................................................................... 14
Fig.2.7 Wind turbine configuration with variable rotor resistances ................................. 15
Fig.2.8 Wind turbine configuration based on DFIG ......................................................... 16
Fig.2.9 PMSG wind turbine with DC chopper ................................................................. 18
Fig.2.10 PMSG wind turbine with back-to-back converter ............................................. 19
Fig.2.11 Wind turbine configuration with synchronous generator ................................... 19
Fig.2.12 Variable speed turbine with squirrel cage induction generator .......................... 21
Fig.2.13 Squirrel cage induction generator based turbine with simple power converter . 21
Fig.2.14 Wind turbine configuration with switched reluctance generator ....................... 22
Fig.2.15 Typical fault ride-through requirement of wind farm ........................................ 26
Fig.2.16 More stringent fault ride-through requirements of wind farm ........................... 26
Fig.2.17 Single line diagram of a grid connected wind generation system ...................... 27
Fig.2.18 Power factor requirement for wind farm integrated to grid ............................... 29
Fig.2.19 DFIG ride-through enhancement with crowbar circuit ...................................... 34
Fig.3.1 A wind generation system based on doubly fed induction generator .................. 42
Fig.3.2 Vector diagram of the DFIG ................................................................................ 43
Fig.3.3 Equivalent circuit of a DFIG in the reference frame rotating at .................... 44
Fig.3.4 Vector control scheme for the rotor-side converter ............................................. 48
Fig.3.5 Grid voltage vector orientation for the grid-side inverter .................................... 49
Fig.3.6 Grid-side converter arrangement .......................................................................... 49
Fig.3.7 Vector control scheme for the grid-side converter ............................................... 51
Fig.3.8 Power transfer coefficient pC versus Tip-speed ratio .................................... 52
Fig.3.9 System control diagram of the DFIG based wind turbine .................................... 53
Fig.3.10 Single-line diagram of the DFIG based wind turbine connected to grid. .......... 53
Fig.3.11 Г-form equivalent circuit of the DFIG in the static frame ................................. 55
Fig.3.12 Phase diagram of DFIG during normal operation .............................................. 57

List of Figures
ix
Fig.3.13 Phase diagram of DFIG during grid fault .......................................................... 58
Figure 3.14 Simplified phase diagram of DFIG during a full voltage dip and a partial
voltage dip with the phase shift ..................................................................................... 59
Fig.3.15 The magnitude and angle-jump of stator voltage impact on the rotor current ... 60
Fig.3.16 Determination of the maximum allowed voltage drop on the PCC under the
maximum rotor current Ir,max ............................................................................................. 65
Fig.3.17 The maximum allowed PCC voltage drop boundaries along with different pre-
fault rotor current angle θ0 ................................................................................................. 66
Fig.3.18 Phase diagram of series voltage compensation under grid faults ...................... 67
Fig.3.19 The series voltage Vsc related to fault PCC voltages Vpcc under different rotor
current limitation ............................................................................................................... 67
Fig.3.20 Wind turbine power characteristics used in the simulation ............................... 73
Fig.3.21 DFIG operating performance under different wind speeds ................................ 74
Fig.3.22 The steady-state stator and rotor voltage/current waveforms ............................ 75
Fig.3.23 Stator/rotor voltages and currents in the conventional DFIG system ................ 76
Fig.3.24 Feasible ride-through region of the conventional DFIG system under three-
phase balanced fault .......................................................................................................... 77
Fig.3.25 Fault voltage phase shift impacts on the ride-through performance in the original
DFIG system ...................................................................................................................... 78
Fig.3.26 Ride-through performance of the DFIG system with the series compensation
method ............................................................................................................................... 82
Fig.3.27 Zoom-in of the voltage compensation during transient fault ............................. 82
Fig.3.28 The relationship of the rotor peak current/ DC link capacitance of the series
compensator versus the compensation time ∆T ................................................................. 83
Fig.3.29 The control of the reactive current of the grid-side converter during the fault
period ................................................................................................................................. 83
Fig.4.1 DC Z-Source network diagram ............................................................................ 86
Fig.4.2 Topology of a three-phase indirect matrix converter ........................................... 86
Fig.4.3 Integration of IMC and Z-Source network ........................................................... 87
Fig.4.4 Simplification of one-leg in the front-end converter ............................................ 88
Fig.4.5 Two derivatives of the proposed IMC based Z-Source inverter .......................... 89
Fig.4.6 Input current space vector modulation of the front-end rectifier ......................... 90
Fig.4.7 Space vector representation of the back-end inverter .......................................... 91
Fig.4.8 Switching modes synthesis of the IMC ................................................................ 92
Fig.4.9 Switching sequence for the developed Z-Source topology .................................. 94
Fig.4.10 Reduced circuit of the developed Z-Source inverter .......................................... 94
Fig.4.11 Equivalent circuit modes of the developed Z-Source inverter ........................... 95

List of Figures
x
Fig.4.12 Operating waveforms of the Z-Source inverters ................................................ 98
Fig.4.13 Simulation results of output voltage and current with shoot-through .............. 100
Fig.4.14 Simulation results of DC-link voltage and current waveforms with shoot-
through ............................................................................................................................. 101
Fig.4.15 Simulation results of input voltage and current waveforms with shoot-through
......................................................................................................................................... 101
Fig.4.16 Photograph of the prototype of three-switch buck-type Z-Source inverter ..... 102
Fig.4.17 Experimental results of DC-link voltage and current waveforms without shoot-
through ............................................................................................................................. 103
Fig.4.18 Experimental results of output voltage and current waveforms without shoot-
through ............................................................................................................................. 103
Fig.4.19 Experimental results of DC-link voltage and current waveforms with shoot-
through ............................................................................................................................. 104
Fig.4.20 Experimental results of output voltage and current waveforms with shoot-
through ............................................................................................................................. 104
Fig.4.21 Experimental results of input voltage and current waveforms with shoot-through
......................................................................................................................................... 105
Fig.5.1 Proposed PMSG based wind generation system ................................................ 107
Fig.5.2 Three-switch buck-type rectifier based Z-Source inverter for PMSG ............... 108
Fig.5.3 Equivalent circuit and phasor diagram of the PMSG ......................................... 108
Fig.5.4 The turbine power output versus the generator speed under different wind speeds
......................................................................................................................................... 112
Fig.5.5 System control diagram of the developed PMSG wind generation system ....... 113
Fig.5.6 Simulation results of the PMSG-side operating profiles .................................... 118
Fig.5.7 Simulation results of the grid-side operating profiles ........................................ 120
Fig.5.8 Comparison of efficiency of PMSG under different control principles ............. 121
Fig.5.9 Comparison of the converter power ratings under different control principles . 121
Fig.5.10 Simulation results of PMSG voltage and current waveforms in the proposed
system .............................................................................................................................. 123
Fig.5.11 Simulation results of PMSG voltage and current waveforms in the conventional
diode-fronted system ....................................................................................................... 123
Fig.5.12 Simulation results of PMSG voltage and current waveforms in the back-to-back
converter system .............................................................................................................. 124
Fig.5.13 Experimental setup of the proposed system ..................................................... 124
Fig.5.14 Experimental results of generator reference and actual speeds, the shoot-through
duty-cycle D and active power output ............................................................................. 125
Fig.5.15 Steady-state experimental waveforms of voltage and current of PMSG with
unity power factor method ............................................................................................... 126

List of Figures
xi
Fig.5.16 Steady-state experimental waveforms of voltage and current of PMSG with the
Id=0 control ..................................................................................................................... 127
Fig.5.17 Experimental waveforms of voltage and current in the conventional diode front-
end system. ...................................................................................................................... 127
Fig.5.18 Experimental results of reliable operation of the proposed system. ................ 128
Fig.6.1 Diagram of wind generation system .................................................................. 132
Fig.6.2 A typical discrete probability distribution of wind speed .................................. 136
Fig.6.3 Probabilistic derivation ...................................................................................... 137
Fig.6.4 Network elements in grid ................................................................................... 138
Fig.6.5 The base-case network model used in the study ................................................ 142
Fig.6.6 Wind speed probability distribution ................................................................... 143
Fig.6.7 Discrete probability distribution of wind power: rated power 300MW ............. 144
Fig.6.8 Probabilistic distribution of ΔV ......................................................................... 146
Fig.6.9 Significant level α vs P: with and without accelerated G3 repair ...................... 149
Fig.6.10 Comparison between the probability density distribution of wind speed obtained
from MCS and proposed method .................................................................................... 151
Fig.6.11 Comparison between the probability density distribution of wind power
obtained from MCS and proposed method ...................................................................... 151

List of Tables
xii
List of Tables
Table 2.1 Characteristics summary of wind turbine configurations ................................. 23
Table 3.1 DFIG parameters .............................................................................................. 72
Table 4.1 Parameters of the three-switch buck-type rectifier based Z-Source inverter ... 99
Table 5.1 System Parameters of the Proposed Systems ................................................. 117
Table 5.2 Comparison between the back-to-back converter and the developed converter
......................................................................................................................................... 130
Table 6.1 Component Reliability Data ........................................................................... 144
Table 6.2 Thevenin Impedance of Grid at Various States and the Associated Probability
(Base MVA = 1000) ........................................................................................................ 145
Table 6.3 Grid States and Probability when |ΔV| >0.1 ................................................... 147
Table 6.4 Comparison of voltage deviation ΔV obtained from the conventional load flow
study and from the proposed probabilistic method ......................................................... 148
Table 6.5 Computational Time Comparison .................................................................. 150

List of Abbreviations
xiii
List of Abbreviations
AC Alternative current
AVR Automatic voltage regulator
D Duty-cycle
DC Direct current
DFIG Doubly-fed induction generator
EMF Electromotive force
ESS Energy storage system
FACT Flexible AC transmission systems
FFT Fast Fourier transform
GSC Grid side converter
GSI Grid side inverter
HVDC High voltage direct current
IEC International electrotechnical committee
IMC Indirect matrix converter
KCL Kirchhoff's current law
m Modulation index
MCS Monte Carlo simulation
MPPT Maximum power point tracking
PCC Point of common coupling
pdf Probability density function
PF Power factor
PLF Probabilistic load flow
PLL Phase-locked loop

List of Abbreviations
xiv
PMSG Permanent magnet synchronous generators
PWM Pulse width modulation
rms Root mean square
RSC Rotor side converter
SCIG Squirrel cage induction generator
SCR Silicon controlled rectifier
SDP Switching device power
SPWM Sinusoidal pulse width modulation
SRG Switched reluctance generator
SVM Space vector modulation
THD Total harmonic distortion
TSO Transmission system operators
TSR Tip-speed ratio
VSI Voltage source inverter
WECC Western Electricity Coordinating Council
WRIG Wound rotor induction generator
WTG Wind turbine generator
WWEA World Wind Energy Association

List of Principal Symbols
xv
List of Principal Symbols
Cin Capacitance of the input LC filter
Cp Power coefficient of wind turbine
E The equivalent Thevenin voltage
f(v) The Probability density function of wind speed
Fv The probability distribution of wind speed
Ir Rotor current
ird Rotor current component in ds-axis
irq Rotor current component in qs-axis
IS Stator current
isd Stator current component in ds-axis
isq Stator current component in qs-axis
Lin Inductance of the input LC filter
Lm Mutual inductance
Lr Rotor total magnetic inductance
Lrl Leakage inductance of the rotor windings
LS Stator total magnetic inductance
Lsl Leakage inductance of the stator windings
p Machine pole pairs
P Active power
Q Reactive power
R Resistance
v Wind speed
vin Cut-in wind speed

List of Principal Symbols
xvi
vout The cut-out wind speed
vr The rated wind speed
Vpn The voltage on the fictitious DC-link
Vr Rotor voltage
Vrd Rotor voltage component on ds-axis
Vrq Rotor voltage component on qs-axis
VS Stator voltage
Vsd Stator voltage component on ds-axis
Vsq Stator voltage component on qs-axis
VThreshold The maximum voltage error allowed on the PCC
ΔV Voltage deviation
X Impendence
Z The equivalent Thevenin impedance
α Significance level of voltage deviation
γ R/X ratio
δ The torque angle
λ Tip-speed-ratio
λpm The permanent magnetic flux
ρ Air density (kg/m3)
Ψ Magnetic flux
ωe Synchronous angular speed
ωr Rotor speed of wind turbine

Chapter 1 Introduction
1
CHAPTER 1
INTRODUCTION
1.1 Motivation
The twin problems of global warming and exhaustion of fossil fuels have seen an increase
in the usage of renewable energy, such as wind energy, solar energy and biofuel in recent
years. Especially, wind power generation has experienced a very fast development in the
last decade [1]. By the end of 2009, the worldwide capacity of wind power generators has
been as large as 159.2 gigawatts [2]. Obviously, the installing capacity of wind power
generators will continue to increase in the countries with abundant wind potential.
Consequently, it can be expected that capacity of wind power production will be a
significant amount of energy produced by large conventional power plants. Actually,
several countries and regions have presented this situation. For instance, in Western
Denmark, Schlesswig-Holstein in Germany, and Navarra in Spain, the wind power
capacity has reached the limit which can have a significant impact on the operation of the
connected transmission system [3]. Hence, the influence of wind turbines on the power
quality of grid network is becoming an important issue due to the rapid increase of wind
power penetration.
Among all the influences caused by grid-connected wind turbine, the main impacts are
focused on voltage profiles, energy loss, frequency control, power quality improvement
and system restoration practices in case of faults [4]. For instance, the increased use of
wind turbines for generating electricity makes frequency control more challenging, due to
the intermittent nature of wind conditions. In addition, the problem of harmonized
integration becomes even challenging as the level of wind power penetration increases.
Not only are the voltages at various locations affected, but also the power flow, power
system dynamics, transient stability, and reliability [5]. Denmark has been a pioneer in
the large-scale connection of wind farms to the grid. Due to these impacts, they have to
temporarily shut down some wind turbines especially under conditions of strong wind and
low load demand. The purpose is to reduce the negative impacts caused by high wind

Chapter 1 Introduction
2
power penetration. However, this is not an optimal solution to deal with the increasing
wind power production from all over the world.
In addition, more and more stringent rules for grid connected wind turbines have been
released by transmission system operators (TSO) in order to ensure the grid remains
stable and reliable. According to the codes released by Energinet, E.ON, and WECC [6],
the technical requirements have been defined with respect to frequency control, voltage
regulation, fault ride-through ability and power quality improvements. For instance, in the
past, wind turbines are allowed to disconnect from the connected grid system under
conditions of system faults. However, the situation has to be changed in view of large
wind power penetration into the transmission systems. Hence under new grid codes, wind
turbines are required to maintain connection during grid faults in terms of system stability
operation [7]. Moreover, wind turbines are now required to provide reactive power to
restore grid voltage during fault conditions according to the latest grid codes in western
European countries. Therefore, wind turbines are now generally demanded to serve as
generation plants with high reliability and strong grid support, not unlike the conventional
coal, oil and gas fired power plants.
Wind generation system is basically equivalent to variable speed pump/fan drive system
operation in regenerative mode. Hence, there would be a large amount of wind generation
systems, which can be transferred from various drive systems. But different types of wind
turbines would have different grid integration performances. Better integration
performance is expected from modern turbines since power electronics are widely used
[8]. The power electronics are able to produce better dynamic response, faster fault
monitoring, and quicker reaction operation. Power electronics were minimally used in the
Danish concept of wind turbine two decades ago [9]. It does not actively regulate the
terminal voltage because of the absence of reactive power production. Thus it inherently
exhibits poor grid support characteristics. So it is required to install additional reactive
power equipment to meet the power grid specifications. However, there are always costs
associated with the installation and operation of supplementary devices, which makes this
option less attractive [10].
Consequently, partial-scale power electronics converter was utilized in the doubly-fed
induction generator (DFIG) based wind turbine. More than 50% of the installed turbines

Chapter 1 Introduction
3
in the last decade are of this configuration. By appropriately controlling the converters in
this concept, it becomes possible to locally maintain the power factor or the voltage on
the point of common coupling (PCC). However, the DFIG is very sensitive to network
disturbances and is inadequate to satisfy with the latest ride-through requirements
imposed by grid operators, especially during severe grid fault events [11] occurring near
the turbines. In order to meet fault ride-through requirements, it is needed to explore
feasible and efficient solutions to enhance the ride-through ability of this kind of turbine,
and to keep these turbines connected to the grid utilities.
Compared to DFIG, full scale power electronics converter based wind generators such as
those using permanent magnet synchronous generators (PMSG), exhibit superior ride-
through and grid support performances. According to predictions by the Danish wind
consultation company MAKE, the PMSG will be the mainstream turbine generator in
most new installations in the next decade (barring any unexpected upsurge in the price of
permanent magnetic materials). In the PMSG configuration, the power electronics play
the crucial function of power interface and buffer to bridge the PMSG and the utility.
Hence, to seek more efficient and robust power electronics converters would be one of the
potential research topics for the development of the modern grid compatible wind
turbines.
Regardless of DFIG or PMSG, wind power capacity will have a significant percentage of
the worldwide electricity demand in the next decade, especially in western European
countries [12]. Consequently, wind power will affect on the operation of utility in terms
of voltage regulation, frequency control and so on. Hence, there is a need to devise
reliable method(s) to accurately quantify the impacts so that the most appropriate and
economical solution to mitigate the impacts can be obtained.
Bearing all these in mind, wind turbine will be required to have capabilities of
maintaining good voltage control, frequency regulation, reactive power support, and fault
ride-through ability. So it would be timely to develop a reliable wind generation system
with improved grid connection characteristics and integration performances. It should
also efficiently reduce ancillary impacts of large wind power penetration in order to
enhance operation reliability of wind energy connected grid utilities. This research is
motivated by the quest for enhancing grid integration of the existed turbine configurations

Chapter 1 Introduction
4
especially in their ride-through capability, investigating efficient and reliable modern
wind turbine architecture, modeling challenges of grid impacts caused by increasing wind
power penetration, and thereby analyzing feasible operation and improvement for wind
turbines to confront the aforementioned negative impacts.
1.2 Objectives
The objectives of this research project are listed below:
Objective 1: Fault ride-through enhancement of the DFIG based wind turbine
It is well-known that the DFIG is sensitive to network disturbances, especially severe grid
faults. The crowbar technology is usually utilized to help ride through grid faults in the
conventional DFIG turbine. The new more stringent grid codes not only require the
generators to ride through faults, but also demand the generators to provide reactive
current during faults. However, if the crowbar is activated, the generator is out of control,
which in turn, is impossible to control the reactive current. Hence, the conventional
crowbar solution will not be able to satisfy the latest grid requirements. To develop
advanced ride-through technology is one of the potential research topics to improve grid
integration performance of DFIG.
The main objective of this research is to enhance the ride-through ability of DFIG based
wind turbines since a large number of this kind of turbine has been installed in the past.
Objective 2: Design of a robust power architecture for PMSG based wind turbine
Compared to DFIG, the PMSG based wind turbine has better grid integration
performance since full-scale power electronics converter is utilized. An AC-DC-AC
converter, named as back-to-back converter is usually used to bridge the AC generator
and the AC network. However, the disadvantage of this converter is the high risk of
bridge shoot-through besides a high number of switching devices. Moreover, the risk of
shoot-through phenomenon may be increasing rapidly along with the increase of power
ratings. Hence, it is necessary to develop a power electronics architecture which can serve
as a reliable power interface between PMSG and grid utility. The control scheme for the

Chapter 1 Introduction
5
developed topology will also need to be developed with the concern of wind power
characteristic to obtain maximum power point tracking (MPPT). The dynamic control
behavior should be studied in order to verify the feasibility of this architecture for PMSG.
The main objective of this research is to develop a reliable power architecture and thereby
develop the generator control and grid integration scheme for the PMSG turbine.
Objective 3: Development of voltage quality assessment method for grids with wind
power penetration
Regardless of DFIG or PMSG, wind power generation will meet a significant percentage
of the worldwide electricity demand in the next decade. Large wind power injection is
able to affect the connected power transmission system. The main impacts are voltage
profile, frequency regulation and system stability. It is necessary to analyze the essential
causes of these issues. Modeling and analysis of these impacts can help to propose
potential methods for alleviating/mitigating the corresponding impacts.
Hence, the main objective of this research is to devise reliable methods, which can
quantify accurately the impacts of the characteristics of wind farm, transmission network
and grid topology. From the analysis of the derived methods, they can be helpful to guide
design and planning of modern wind farms and thereby make wind turbines satisfy with
stringent grid regulations.
1.3 Major contributions of the thesis
The major contributions documented in this thesis are given below.
1. A feasible ride-through enhancement of DFIG based wind turbine
The proposed ride-through solution is inspired by power quality improvement devices,
i.e., series compensator. The compensator is in series with the stator windings of DFIG in
order to reinforce the fault ride-through capability. Firstly the control fundamentals of the
conventional DFIG have been reviewed and thereby the essential behavior of DFIG under
grid faults has been analyzed in detail via system phasor diagram. Then the general
control scheme for the series compensator is provided. Furthermore, an improved control

Chapter 1 Introduction
6
scheme based on ramp-function injection voltage has been developed to significantly
reduce the energy capacity of series compensator, which in turn reduce the capital cost.
The performance of the designed architecture has been verified in simulation.
2. Modulation, analysis and verification of three-switch rectifier based Z-Source inverter
for full power converter in WTG applications
The operating principle of an integration of a three-switch buck-type rectifier and a Z-
Source inverter has been investigated and the related modulation strategy has been given.
The equivalent circuit analysis of the proposed converter is given for an in-depth
understanding of its essential behavior. The simulation studies and experimental results
have verified the buck-boost characteristic of the developed converter. All these studies
are desired to integrate the developed converter for full power converter based wind
turbine application, such as those based on PMSG.
3. Design of a robust PMSG wind turbine based on three-switch rectifier based Z-Source
inverter topology
The design methodology, the simulation studies, and the experimental verification of the
integrated generator-side buck-type rectifier and grid-side Z-Source inverter based PMSG
wind generation system have been presented. Based on the developed modulation scheme
of the integrated topology, the generator-side control strategy has been proposed, which is
optimized from the fundamentals of the Id=0 control and unity power factor method. The
voltage-oriented control has been adapted for the Z-Source inverter to decouple active
and reactive power control while extracting the maximum wind power by adjusting the
shoot-through duration of the Z-Source network.
4. A voltage quality assessment method for grids with wind power penetration has been
proposed in this thesis
A statistics-based analysis method has been proposed for the purpose of assessing the
impact on voltage quality caused by wind power generation. Voltage deviation has been
computed using the probabilistic models of wind power production and grid Thevenin
impedance. An index called significance level of the voltage deviation α has been
developed to provide a probabilistic measure of the voltage quality performance. By
considering the contributing factor from each of the grid states that constitute α, possible

Chapter 1 Introduction
7
solution methods to improve voltage quality can be obtained. A case study example has
been included to illustrate the effectiveness of the proposed method.
1.4 Organization of the thesis
Given below is a brief introduction of what is covered in each chapter:
Chapter 1 presents the objectives and contributions of this research after describing the
motivation of our work. The organization of this thesis then follows.
Chapter 2 gives the literature review of worldwide wind power market, wind turbine
configurations, corresponding grid connection requirements and potential challenges of
wind power technology. The turbine configurations are described in terms of different
generators and the main grid connection demands are then considered in terms of safety
operation of transmission systems. The challenges of wind power technology provided a
guide to define the research objectives.
Chapter 3 proposes a potential ride-through solution for the DFIG to deal with grid faults.
A compensation device is in series with the stator windings of DFIG in order to reinforce
the fault ride-through capability. The improved ride-through control scheme for the DFIG
and series compensation is developed to reduce the energy capacity of the series
compensator. The performance of the designed architecture is verified in simulation.
Chapter 4 describes complete modulation principle of an integration of a three-switch
buck-type rectifier and a Z-Source inverter. The equivalent circuit analysis is given as
well. The simulation studies and experimental results have verified the modulation of the
developed topology. The developed topology is suitable to apply in the full power
converter based wind turbines, such as those based on PMSG.
Chapter 5 introduces a robust PMSG wind turbine based on the aforementioned converter
topology described in Chapter 4. The proposed generator-side control strategy of the
generator-side converter is optimized from the fundamentals of the Id=0 control and unity
power factor method. The voltage-oriented control of the grid-side converter is adapted to

Chapter 1 Introduction
8
decouple active and reactive power control. The simulation and experimental results have
verified the proposed wind generation system.
Chapter 6 presents the modeling approach for the voltage impact caused by high wind
power penetration. A probabilistic method is used to analyze the voltage issue with the
consideration of wind uncertainty and reliability of elements in the transmission system. It
provides a way to quantify the severity of voltage impacts caused by wind power
injection. A case study has been carried out and described in this chapter.
Chapter 7 provides the concluding remarks of this thesis together with the
recommendations for future research.

Chapter 2 Literature Review
9
CHAPTER 2
LITERATURE REVIEW
2.1 Introduction
Nowadays, wind energy is a major renewable energy source to integrate into the grid. The
worldwide total installed wind turbine capacity is up to 160 gigawatt at the end of 2009
when the global financial and economical crisis started. However, the crisis seemed to
have no negative impact on the general development of the wind sector worldwide. Many
governments sent clear signals that they wanted to accelerate wind deployment in their
countries and indicated that investment in wind and other renewable technologies is an
answer to the financial crisis as well as to the still ongoing energy crisis.
Along with the increasing wind power penetration into grid, the interconnection
requirements for grid connected wind farms are generally formulated in order to maintain
the operation performance of the connected power utilities. In the past, there is little need
to consider impacts caused by wind power penetration due its low percentage of the total
network capacity. However, the related impacts will be becoming very serious due to
rapid increasing wind power penetration into grid without auxiliary solutions.
In this chapter, wind energy technology will be reviewed in terms of various types of
generators and the related power electronics. Then grid regulations for grid-connected
turbines are reviewed with the aim to address the potential challenges for exciting wind
turbines. Consequently, the potential research directions and contents of the following
chapters can be clarified based on the detailed review of the current solutions for these
challenges.
2.2 Wind market development
In spite of the global economic crisis, the wind capacity worldwide at the end of 2009
reached 159.2 GW after attaining 120.9 GW in 2008. Figure 2.1 illustrates the worldwide

Chapter 2 Literature Review
10
wind power capacity during the last decade from the World Wind Energy Association
(WWEA) [13]. The projected wind capacity at the end of 2010 will be up to 203.5 GW.
The strong increase of wind capacity means wind based renewable energy has been paid
much attention all over the world. In fact, they have recognized that wind energy is an
important alternative to address the environment and climate change issues, which seem
to be more and more serious in the recent years.
Fig.2.1 World total installed wind power capacity
Fig.2.2 Country share of total capacity in 2009
From the WWEA, Figure 2.2 shows the country share of the wind capacity in 2009 [13].
Many western countries, such as United States, Germany and Spain, have major
percentage of the worldwide wind capacity. However, in the recent years, especially in
2009, the wind industry has achieved significant development in the Asian countries, such

Chapter 2 Literature Review
11
as China and India. At the end of 2009, China became the second largest country behind
the United States to utilize wind energy. The total wind capacity of China and India have
attained more than one fourth of the world total capacity. Hence, it can be expected that
the wind industry in Asia will continue to grow rapidly in the next decade along with the
strong economy of those countries.
Figure 2.3 shows the total installed wind capacity in 1997-2020. As predicted by the
WWEA, the total installed wind capacity at the end of the next decade will reach 1,900
GW, which has a significant increase compared to the current capacity. Although wind
capacity is only 2% of the worldwide electricity demand in 2010, the percentage will be
increased rapidly in the next several years. In some European countries, the wind capacity
has already reached more than 10% of the domestic electricity demand at the end of 2010.
For instance, the wind capacity in Denmark has reached the point where it can have a
significant impact on the operation characteristics of the transmission system. The
situation would be much more serious when high wind conditions where 100% of the
wind power may be generated under relative low load condition. In addition, similar
situation would be met in India because of its relatively weak power grids. The wind
power penetration attains levels high enough to affect the power quality and stability of
the grids.
(Year)
2010 20201997
(MW)
Fig.2.3 Projected total installed wind capacity 1997-2020
Consequently, the countries with the high wind capacity percentage have been much
earlier to consider the grid connection issues than other countries. For instance, Denmark,
Germany and Spain are three countries that have established their respective grid codes to
Chapter 2 Literature Review
12
regulate the wind power penetration into the transmission network. Hence, the various
codes for grid connection of wind turbines should be investigated in order to advance the
development of wind conversion system. It is worthy to point out that the operation
performances of different configurations of wind turbines directly affect the operation of
the connected power transmission system. Hence, it is necessary to review the advances
in wind turbine technology, which will be presented in the next section.
2.3 The advances in wind turbine technology
In recent 2 decades, generation capacity of wind turbines has increased from tens‟
kilowatts to more than 3 MW, while even larger wind turbines are being designed [14].
Furthermore, a number of different generator concepts have been developed and tested.
For the electrical system of wind turbines, some manufacturers have started to use
asynchronous generator with wound rotor in their wind turbine design, while others have
replaced the conventional induction generator by a synchronous generator. This
development has introduced the use of power electronics as an interface in their design
and led to the variable speed wind turbine. This is designed to pursue maximum
aerodynamic efficiency over a wide range of wind speed, to reduce the mechanical stress
in the gearbox and to improve the controllability of the active and reactive power which is
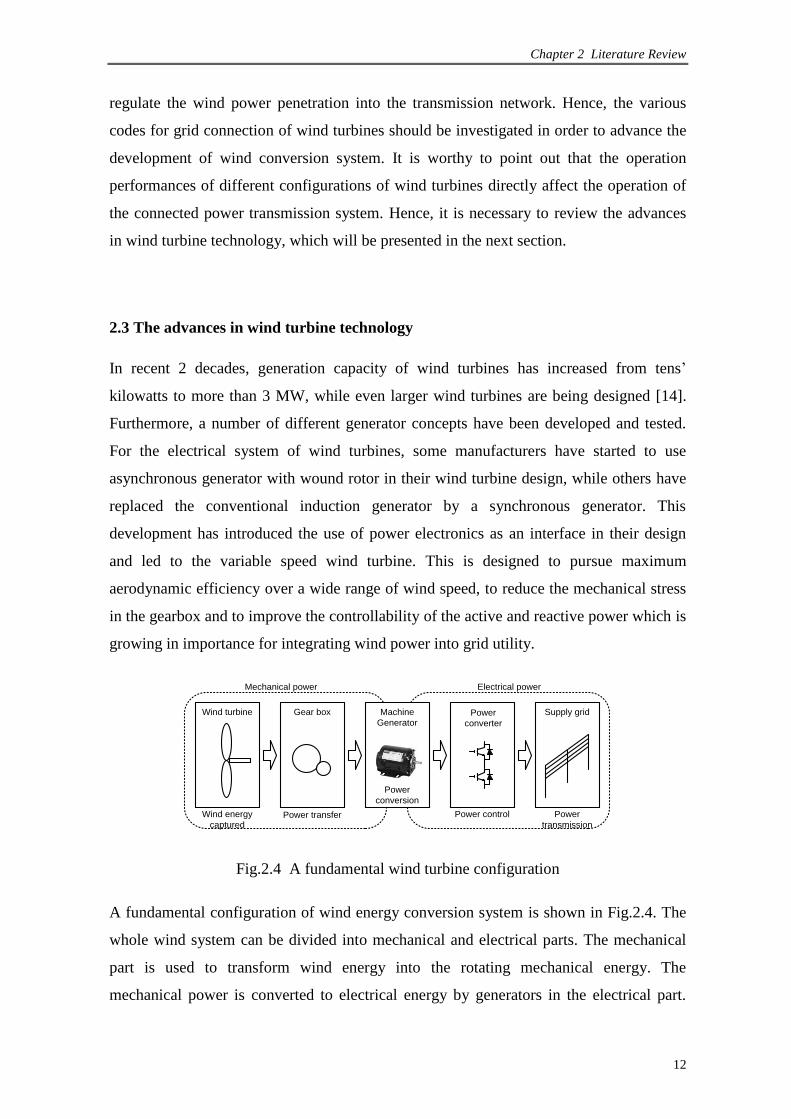
growing in importance for integrating wind power into grid utility.
Wind energy
captured
Wind turbine
Power transfer
Gear box
Power
conversion
Machine
Generator
Power control
Power
converter
Power
transmission
Supply grid
Mechanical power Electrical power
Fig.2.4 A fundamental wind turbine configuration
A fundamental configuration of wind energy conversion system is shown in Fig.2.4. The
whole wind system can be divided into mechanical and electrical parts. The mechanical
part is used to transform wind energy into the rotating mechanical energy. The
mechanical power is converted to electrical energy by generators in the electrical part.

Chapter 2 Literature Review
13
There are many kinds of generators which can be applied in the wind system, such as DC
generator, permanent magnet synchronous generator, multi-pole synchronous machine,
and induction machine. Reasonably, the variable speed wind turbine has a lot of
advantages over the fixed ones in terms of wind power capture efficiency, reducing
mechanical stress of gearbox, and so on. So wind turbine can be designed to generate
electricity as much as possible based on variable speed conversion concept.
The characteristic of wind turbine can be adapted to estimate power transferred efficiency
from wind power into the rotating mechanical power. The most commonly used wind
turbine configurations can be categorized into the following concepts: fixed speed wind
turbine, partial-variable speed wind turbine, and variable speed wind turbine. The main
differences between these designs concern the generating system and wind energy
captured efficiency in relation to generator rotor speed. The detail will be discussed in the
next sections.
2.3.1 Fixed rotor speed wind turbine
The fixed speed wind turbine has the advantage of being simple, robust and reliable, and
easy to maintain. Traditionally, the constant speed wind turbines were coupled to squirrel
cage induction generator (SCIG) or wound-field synchronous generator. This
configuration also known as the Danish concept that was very popular in 1980‟s [15]. In
the fixed speed wind turbines, the generator is directly connected to the grid. The
frequency of the grid determines the rotational speed of the generator rotor. Generally, the
generator speed depends on the number of pole pairs and the frequency of the grid.
Consequently, the wind turbine is the fixed speed controlled machine with asynchronous
cage induction generator directly connected to the grid via a transformer as shown in
Fig.2.5.
Gen
Soft
starterSCIG
Gearbox Capacitor
bank
Grid
Fig.2.5 Fixed speed wind turbine with squirrel cage induction generator
Chapter 2 Literature Review
14
In this configuration, a reactive power compensator is required to reduce (or even
eliminate) the reactive power demand from generator to the grid. Normally it is realized
by continuously switching capacitor banks following the production levels (5-25 steps).
Additional, a soft starter is incorporated in order to smooth grid connection and reduce
inrush current (as high as 5-7 times of rating current). The asynchronous generator
„naturally‟ limits power production in strong wind or gusts. It restricts the speed of the
system to the frequency of the power grid, so that the rotor cannot turn faster when the
wind blows stronger.
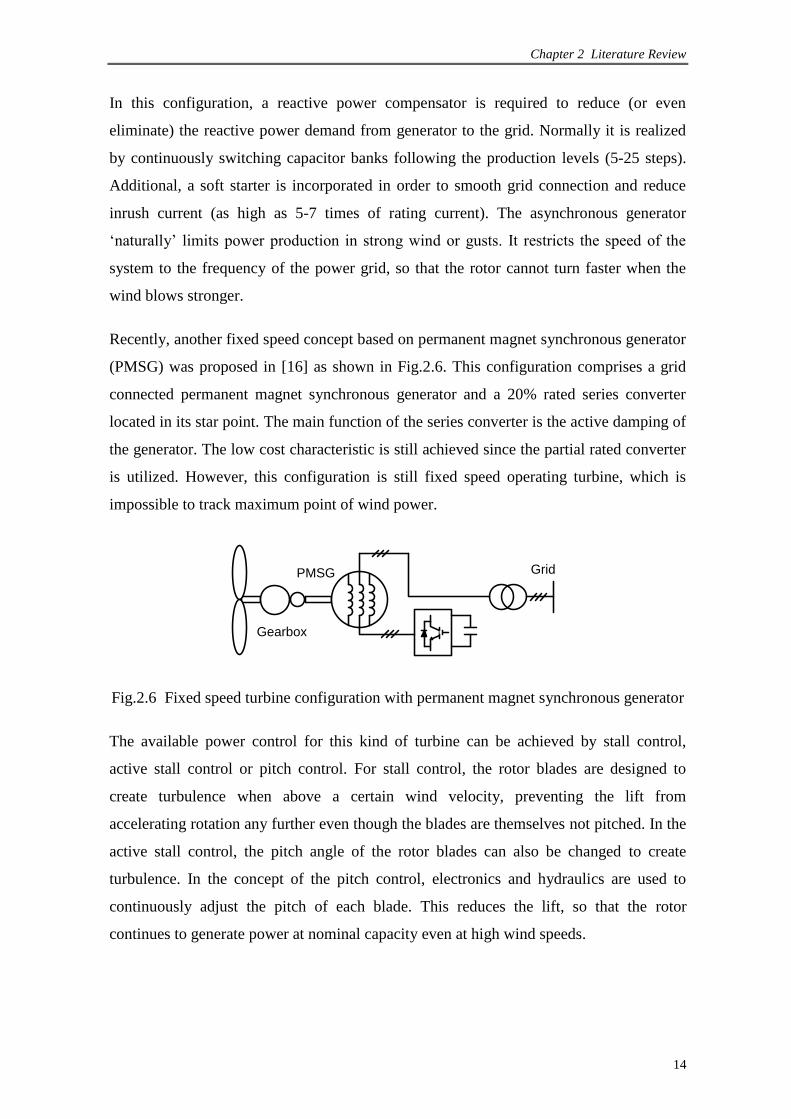
Recently, another fixed speed concept based on permanent magnet synchronous generator
(PMSG) was proposed in [16] as shown in Fig.2.6. This configuration comprises a grid
connected permanent magnet synchronous generator and a 20% rated series converter
located in its star point. The main function of the series converter is the active damping of
the generator. The low cost characteristic is still achieved since the partial rated converter
is utilized. However, this configuration is still fixed speed operating turbine, which is
impossible to track maximum point of wind power.
PMSG
Gearbox
Grid
Fig.2.6 Fixed speed turbine configuration with permanent magnet synchronous generator
The available power control for this kind of turbine can be achieved by stall control,
active stall control or pitch control. For stall control, the rotor blades are designed to
create turbulence when above a certain wind velocity, preventing the lift from
accelerating rotation any further even though the blades are themselves not pitched. In the
active stall control, the pitch angle of the rotor blades can also be changed to create
turbulence. In the concept of the pitch control, electronics and hydraulics are used to
continuously adjust the pitch of each blade. This reduces the lift, so that the rotor
continues to generate power at nominal capacity even at high wind speeds.
Chapter 2 Literature Review
15
There are some challenges for this kind of wind turbine. First of all, as the wind power
fluctuations happen, it is inevitable to affect turbine mechanical torque fluctuations and
further into electrical power fluctuations. These can cause voltage fluctuations with the
connection of a weak grid. The unbalance between reactive power demand of generator
and the reactive power of capacitance banks would result in the corresponding voltage
fluctuations. On the other hand, the mechanical torque fluctuations would increase the
mechanical stress of mechanical devices. It may require a stronger mechanical
construction to absorb high mechanical stress. A mechanical stress calculation method for
the fixed speed wind turbine was reported in [17].
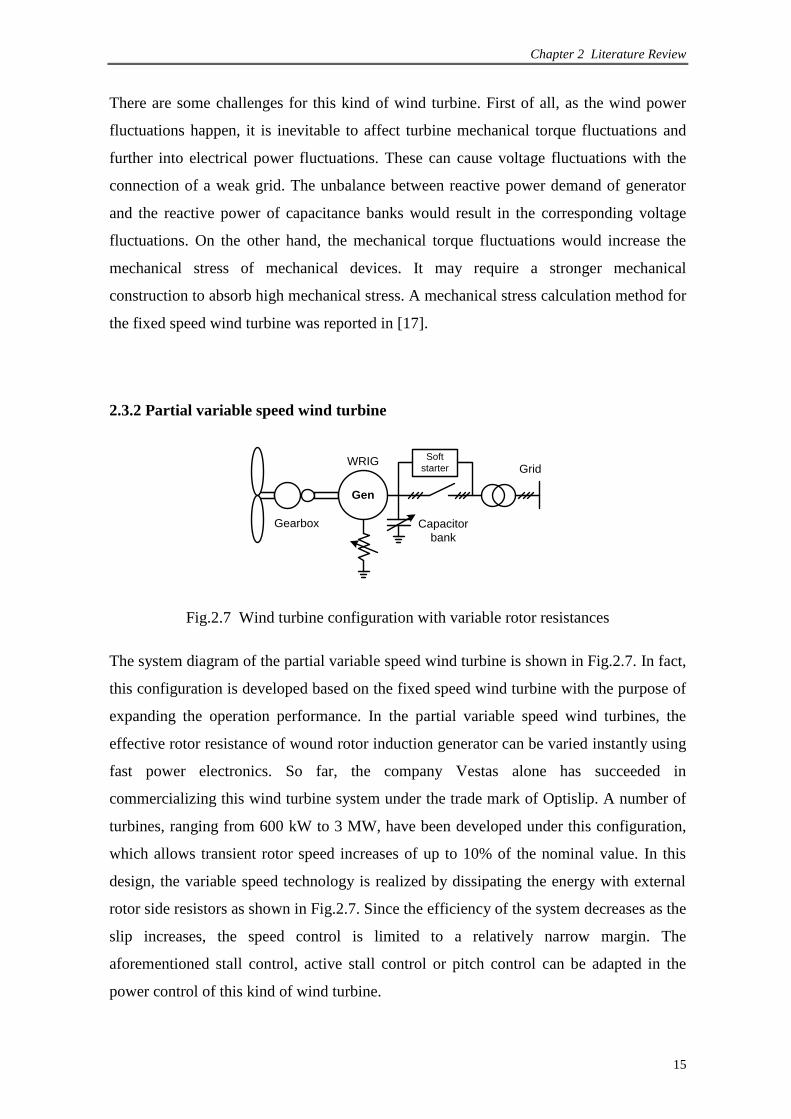
2.3.2 Partial variable speed wind turbine
Gen
Soft
starterWRIG
Gearbox Capacitor
bank
Grid
Fig.2.7 Wind turbine configuration with variable rotor resistances
The system diagram of the partial variable speed wind turbine is shown in Fig.2.7. In fact,
this configuration is developed based on the fixed speed wind turbine with the purpose of
expanding the operation performance. In the partial variable speed wind turbines, the
effective rotor resistance of wound rotor induction generator can be varied instantly using
fast power electronics. So far, the company Vestas alone has succeeded in
commercializing this wind turbine system under the trade mark of Optislip. A number of
turbines, ranging from 600 kW to 3 MW, have been developed under this configuration,
which allows transient rotor speed increases of up to 10% of the nominal value. In this
design, the variable speed technology is realized by dissipating the energy with external
rotor side resistors as shown in Fig.2.7. Since the efficiency of the system decreases as the
slip increases, the speed control is limited to a relatively narrow margin. The
aforementioned stall control, active stall control or pitch control can be adapted in the
power control of this kind of wind turbine.
Chapter 2 Literature Review
16
2.3.3 Variable speed wind turbine
In order to overcome the drawbacks of fixed speed wind turbine, variable speed wind
turbine based on power electronics can be made to run at desired speed, so that wind
turbine can be operated efficiently at a wide range of wind speeds. In variable speed wind
turbines, there are several possible combinations of power electronics topologies and
machine types for application, such as doubly fed induction machine including wound
rotor induction machine with partial-scale power converter, permanent magnet generator
with full-scale power converter, synchronous generator with full-scale power converter,
cage rotor induction generator with full-scale power converter. In addition, some special
machines can be applied in wind generation systems as well [18, 19]. A review of these
combinations is given here.
2.4 Review on types of generator machines
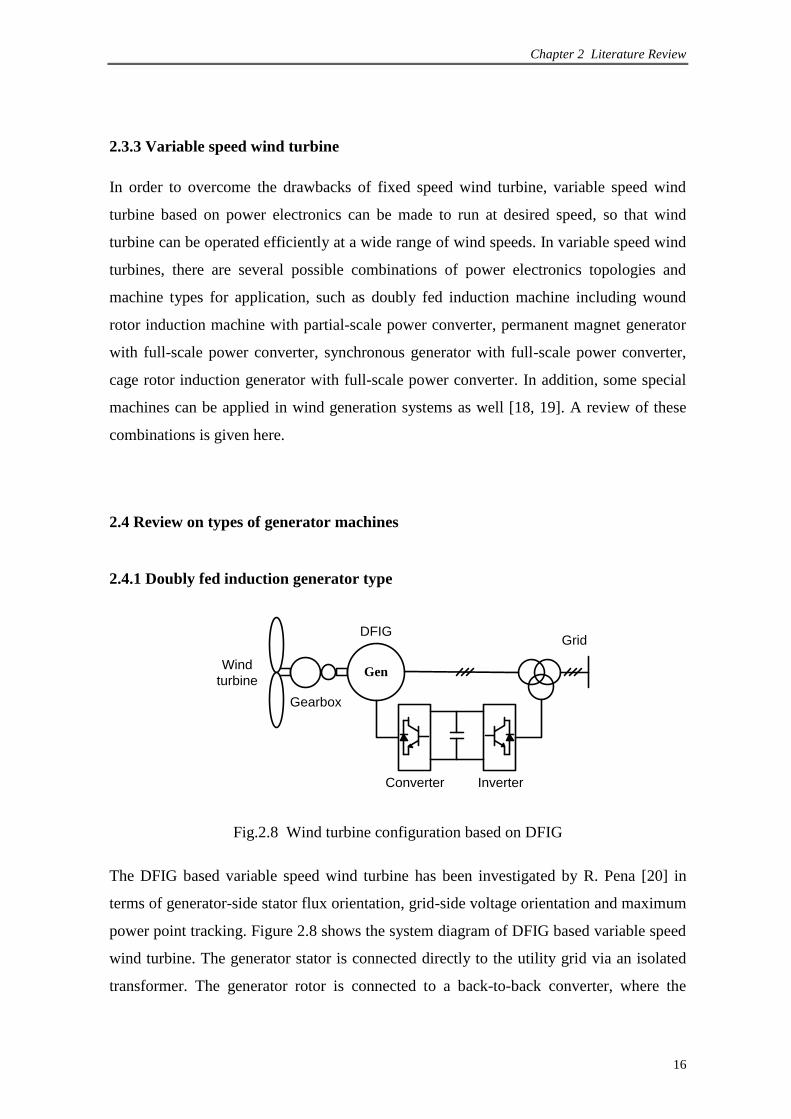
2.4.1 Doubly fed induction generator type
Gen
DFIG
Gearbox
Grid
Wind
turbine
Converter Inverter
Fig.2.8 Wind turbine configuration based on DFIG
The DFIG based variable speed wind turbine has been investigated by R. Pena [20] in
terms of generator-side stator flux orientation, grid-side voltage orientation and maximum
power point tracking. Figure 2.8 shows the system diagram of DFIG based variable speed
wind turbine. The generator stator is connected directly to the utility grid via an isolated
transformer. The generator rotor is connected to a back-to-back converter, where the

Chapter 2 Literature Review
17
rotor-side converter is used to control the rotor current of the generator and the grid-side
converter is utilized to control the DC-link voltage and its grid-side power factor. Only
slip power is processed by the power electronics converter since the control of the DFIG
is tied to the rotor windings, where the purpose of the converter is to synchronize the rotor
current with respect to the stator reference of the DFIG. Hence, the smaller the slip speed
range the smaller is the power electronics converter, which in turn, to reduce the capital
cost of wind turbines. This is one of the significant advantages of the DFIG based wind
turbine.
Another advantage using DFIG is the ability to output more than its rated power without
becoming overheated. It is able to transfer maximum power over a wind speed range in
both sub- and super-synchronous speed. Hence, the DFIG as wind turbine generator is
suitable for high power application in the MW level.
Field orientation control can be utilized to control the DFIG. Reference [21] applied a
control method using a rotating reference frame fixed on the gap flux of the DFIG and
thereby independently control the active and reactive power of DFIG. The estimation
method of the gap flux included built-in machine flux sensor and mathematic calculation
along with rotor and stator parameters. Consequently, the control performance of this
method is very sensitive to the real-time estimation of the gap flux.
To address this problem, a stator-flux vector orientation of the DFIG was introduced in
[20]. All the calculation equations would be transferred to the stator side flux. The torque
equation would be simple with least coupling variables. The flux expressions would be
decided by only one variable in order to simplify the calculation of the corresponding flux.
A decoupled control between the electrical torque and the rotor excitation current would
be easy to obtain. Furthermore, an indirect stator-flux orientation strategy had been
reported in [22]. It was demonstrated that conditions of stator flux field orientation and
line voltage orientation are equivalent if the stator side power factor is controlled at unity
level. Under such a condition, the stator flux modulus is not a free output variable, but
rather it was a function of the produced electromagnetic torque. The torque tracking was
then extended to the speed tracking problem in the presence of an unknown constant load
torque, using a passivity-based approach.
Chapter 2 Literature Review
18
The operation speed range of the DFIG based turbine is much wider than that of the
aforementioned Optislip concept. Most importantly, the efficiency of the DFIG concept is
much higher than that of Optislip since the Optislip design needs to burn off some energy
in the rotor-side resistors. However, its main disadvantages are the application of slip
rings and the protection issues under grid faults, which will be addressed later.
2.4.2 Permanent magnet synchronous generator type
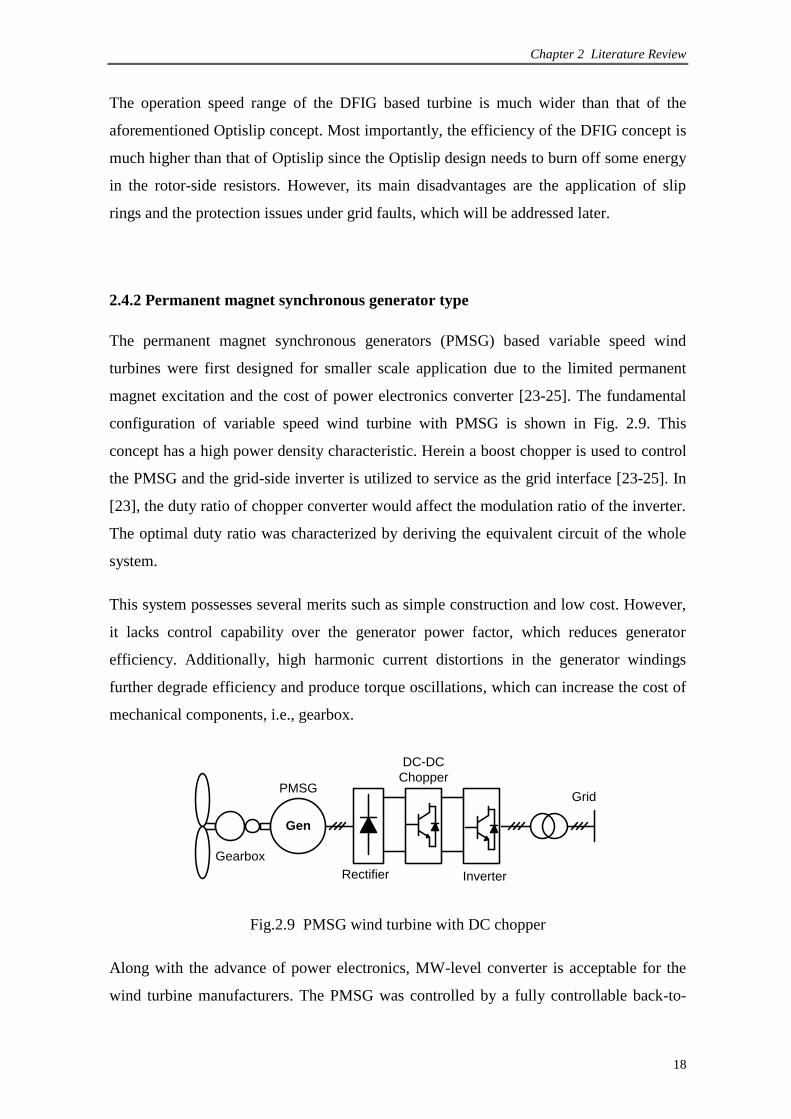
The permanent magnet synchronous generators (PMSG) based variable speed wind
turbines were first designed for smaller scale application due to the limited permanent
magnet excitation and the cost of power electronics converter [23-25]. The fundamental
configuration of variable speed wind turbine with PMSG is shown in Fig. 2.9. This
concept has a high power density characteristic. Herein a boost chopper is used to control
the PMSG and the grid-side inverter is utilized to service as the grid interface [23-25]. In
[23], the duty ratio of chopper converter would affect the modulation ratio of the inverter.
The optimal duty ratio was characterized by deriving the equivalent circuit of the whole
system.
This system possesses several merits such as simple construction and low cost. However,
it lacks control capability over the generator power factor, which reduces generator
efficiency. Additionally, high harmonic current distortions in the generator windings
further degrade efficiency and produce torque oscillations, which can increase the cost of
mechanical components, i.e., gearbox.
Gen
PMSG
Gearbox
Grid
Rectifier
DC-DC
Chopper
Inverter
Fig.2.9 PMSG wind turbine with DC chopper
Along with the advance of power electronics, MW-level converter is acceptable for the
wind turbine manufacturers. The PMSG was controlled by a fully controllable back-to-
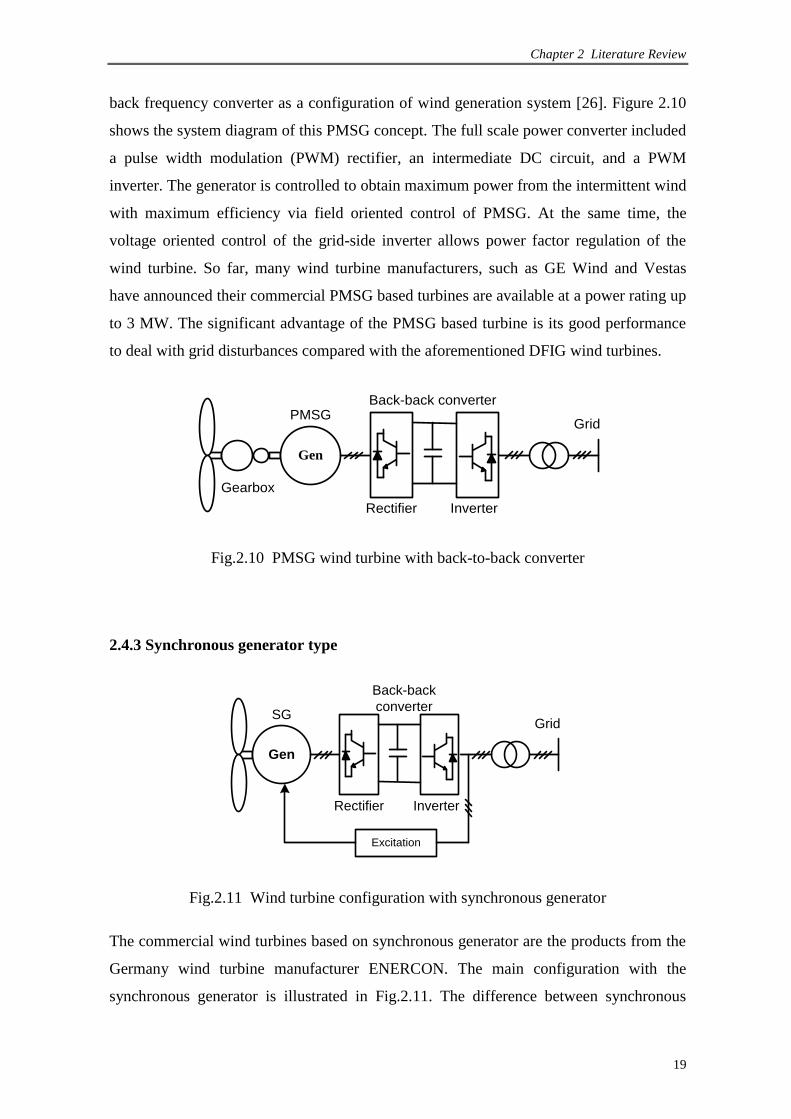
Chapter 2 Literature Review
19
back frequency converter as a configuration of wind generation system [26]. Figure 2.10
shows the system diagram of this PMSG concept. The full scale power converter included
a pulse width modulation (PWM) rectifier, an intermediate DC circuit, and a PWM
inverter. The generator is controlled to obtain maximum power from the intermittent wind
with maximum efficiency via field oriented control of PMSG. At the same time, the
voltage oriented control of the grid-side inverter allows power factor regulation of the
wind turbine. So far, many wind turbine manufacturers, such as GE Wind and Vestas
have announced their commercial PMSG based turbines are available at a power rating up
to 3 MW. The significant advantage of the PMSG based turbine is its good performance
to deal with grid disturbances compared with the aforementioned DFIG wind turbines.
Gen
PMSG
Gearbox
Grid
Back-back converter
InverterRectifier
Fig.2.10 PMSG wind turbine with back-to-back converter
2.4.3 Synchronous generator type
Gen
SGGrid
Back-back
converter
InverterRectifier
Excitation
Fig.2.11 Wind turbine configuration with synchronous generator
The commercial wind turbines based on synchronous generator are the products from the
Germany wind turbine manufacturer ENERCON. The main configuration with the
synchronous generator is illustrated in Fig.2.11. The difference between synchronous

Chapter 2 Literature Review
20
generator and PMSG is the type of excitation. Since there is an independent excited
circuit in synchronous generator, the terminal voltage of the generator can be regulated as
desired. This generator is suitable to apply in large scale wind turbine.
The control principle of the synchronous generator would be similar to that of the
permanent magnet generator except for an extra excitation circuit. The grid-side inverter
allowed the control of active power and reactive power respectively. The generator-side
rectifier is used for electromagnetic torque regulation [27]. In addition, the full-scale
power converter to the grid enables the system to control active power and reactive power
very fast, which in turn, to have a good grid connection characteristic. However, it is
inevitable to increase the whole cost of wind turbine system according to the full scale
power electronics converter, compared to the DFIG wind turbine.
In this concept, the turbine main rotor is coupled to the generator input shaft, eliminating
the need for a gearbox, and the reliability can be improved compared with the geared
turbines since the mechanical gearbox is the main component reducing the system
reliability. In fact, the faults of the mechanical gearbox in the turbines are the most critical
from the fault survey in Sweden during 1997~2005 [28], because the downtime per
failure of the gearbox is high compared to the other components. Hence, the gearless
operation is the significant advantage of this turbine. In addition, the direct-drive
generator has reduced the overall size, has lower maintenance cost, has a flexible control
method and quick response to wind fluctuations, and load variation [9] as compared to a
conventional gearbox-coupled wind turbine generator.
However, the generator has to have many pole pairs in order to generate power at such a
low rotation speed, which in turn, increase the size and expense of the generator. So far,
this turbine configuration would be most expensive among all the available wind turbine
configurations. However, synchronous generator including PMSG is the only type to
implement gearless operation among the excited wind turbine generators since it is easy
to realize multiple poles design.
2.4.4 Squirrel cage induction generator type
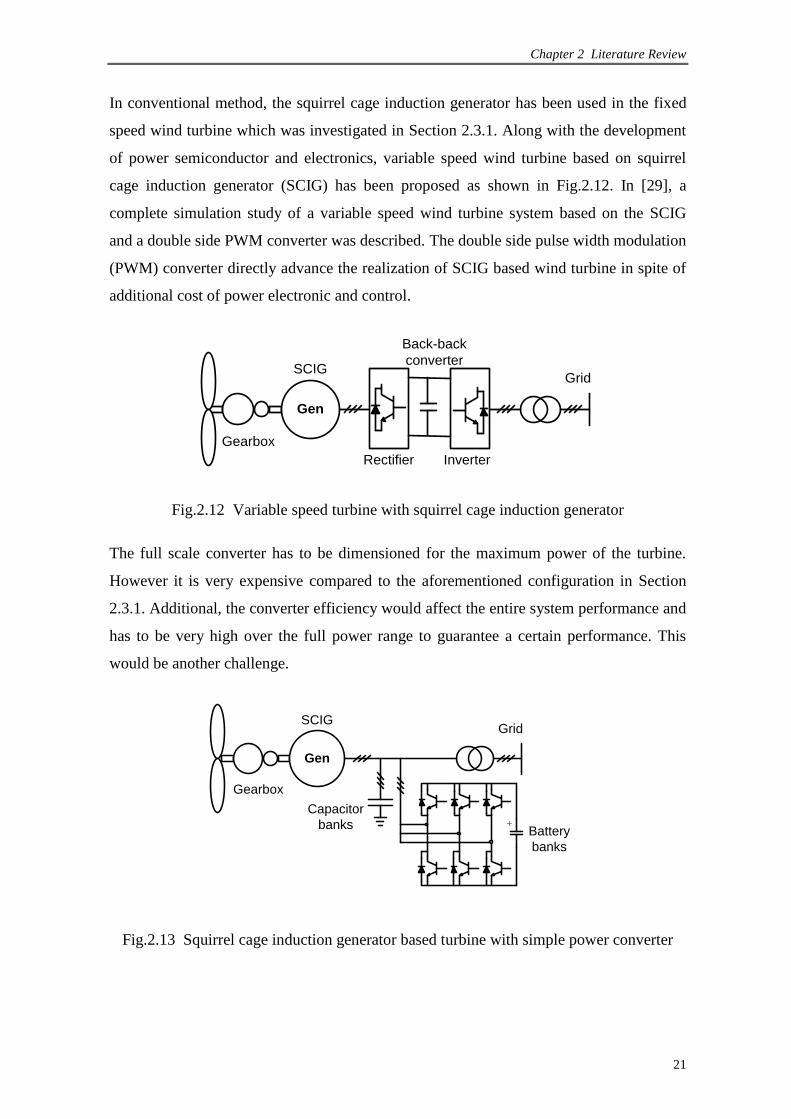
Chapter 2 Literature Review
21
In conventional method, the squirrel cage induction generator has been used in the fixed
speed wind turbine which was investigated in Section 2.3.1. Along with the development
of power semiconductor and electronics, variable speed wind turbine based on squirrel
cage induction generator (SCIG) has been proposed as shown in Fig.2.12. In [29], a
complete simulation study of a variable speed wind turbine system based on the SCIG
and a double side PWM converter was described. The double side pulse width modulation
(PWM) converter directly advance the realization of SCIG based wind turbine in spite of
additional cost of power electronic and control.
Gen
SCIG
Gearbox
Grid
Back-back
converter
InverterRectifier
Fig.2.12 Variable speed turbine with squirrel cage induction generator
The full scale converter has to be dimensioned for the maximum power of the turbine.
However it is very expensive compared to the aforementioned configuration in Section
2.3.1. Additional, the converter efficiency would affect the entire system performance and
has to be very high over the full power range to guarantee a certain performance. This
would be another challenge.
Gen
SCIG
Gearbox
Grid
Battery
banks
Capacitor
banks
Fig.2.13 Squirrel cage induction generator based turbine with simple power converter

Chapter 2 Literature Review
22
In [30-32], the full scale back-to-back converter was replaced by a number of capacitance
banks and relative low rating reactive power compensator. The corresponding scheme of
this configuration is depicted in Fig.2.13. An algorithm was used to optimize the demand
of capacitance capacity in order to provide enough reactive power for excitation. The
interaction control between capacitance banks and reactive power compensator was
developed to satisfy variable speed operation characteristics of wind turbine.
2.4.5 Switched reluctance generator type
Gen
SRGGearbox Grid
Control system
Rotor
position Phase
synchronization
Fig.2.14 Wind turbine configuration with switched reluctance generator
Switched reluctance generator (SRG) has several attributes which make it ideally suited
for wind energy schemes [33]. The system diagram is shown in Fig. 2.14. It includes
extreme robustness, high efficiency of energy conversion, ability to work over very large
speed ranges and control simplicity.
The detailed control strategies of the switched reluctance generator were presented to
control the wind power production in [34]. Two converters would be assigned to control
generator- and grid-side power factor, respectively. The function of grid-side converter in
this scheme would be similar to other types of generators, such as, induction generators,
synchronous generator [35]. The maximum power point tracking method was present in
[36] by introducing the magnetization curve of the switched reluctance machine.
2.4.6 Summary of the wind power configurations
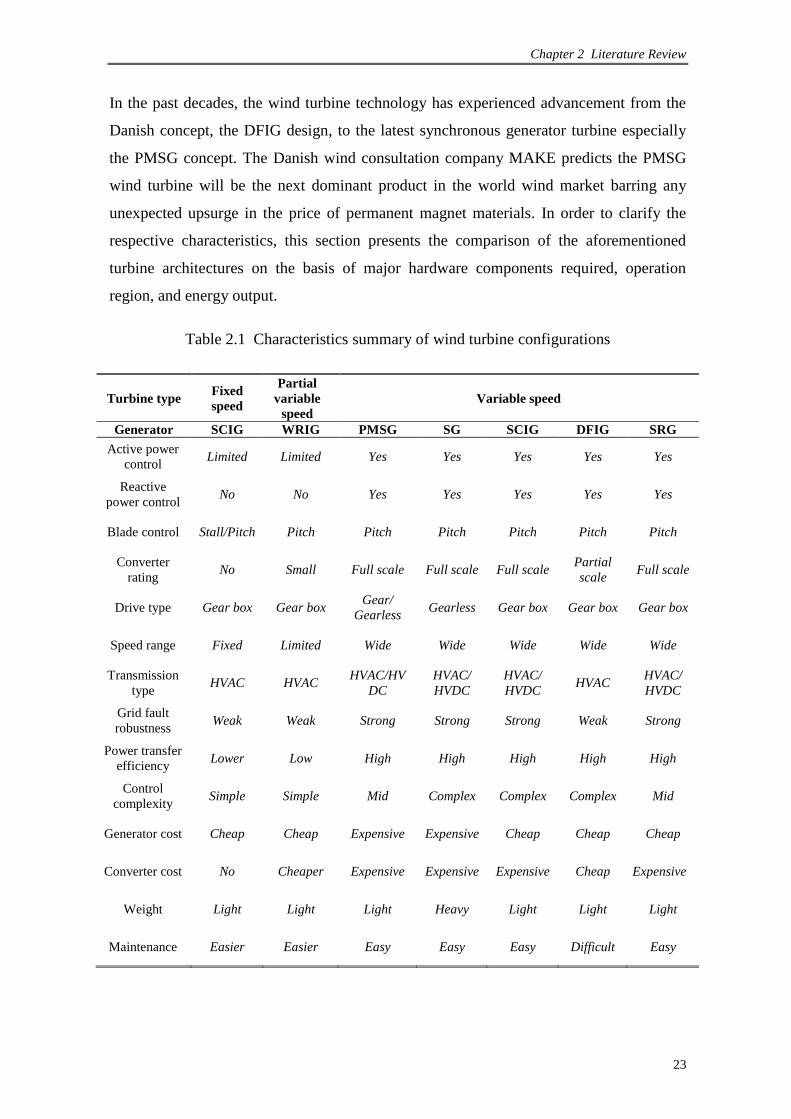
Chapter 2 Literature Review
23
In the past decades, the wind turbine technology has experienced advancement from the
Danish concept, the DFIG design, to the latest synchronous generator turbine especially
the PMSG concept. The Danish wind consultation company MAKE predicts the PMSG
wind turbine will be the next dominant product in the world wind market barring any
unexpected upsurge in the price of permanent magnet materials. In order to clarify the
respective characteristics, this section presents the comparison of the aforementioned
turbine architectures on the basis of major hardware components required, operation
region, and energy output.
Table 2.1 Characteristics summary of wind turbine configurations
Turbine type Fixed
speed
Partial
variable
speed
Variable speed
Generator SCIG WRIG PMSG SG SCIG DFIG SRG
Active power
control Limited Limited Yes Yes Yes Yes Yes
Reactive
power control No No Yes Yes Yes Yes Yes
Blade control Stall/Pitch Pitch Pitch Pitch Pitch Pitch Pitch
Converter
rating No Small Full scale Full scale Full scale
Partial
scale Full scale
Drive type Gear box Gear box Gear/
Gearless Gearless Gear box Gear box Gear box
Speed range Fixed Limited Wide Wide Wide Wide Wide
Transmission
type HVAC HVAC
HVAC/HV
DC
HVAC/
HVDC
HVAC/
HVDC HVAC
HVAC/
HVDC
Grid fault
robustness Weak Weak Strong Strong Strong Weak Strong
Power transfer
efficiency Lower Low High High High High High
Control
complexity Simple Simple Mid Complex Complex Complex Mid
Generator cost Cheap Cheap Expensive Expensive Cheap Cheap Cheap
Converter cost No Cheaper Expensive Expensive Expensive Cheap Expensive
Weight Light Light Light Heavy Light Light Light
Maintenance Easier Easier Easy Easy Easy Difficult Easy

Chapter 2 Literature Review
24
In [37], several different generator systems for wind turbines, namely the DFIG with three
stage gearbox, the direct drive synchronous generator, the direct drive PMSG, and the
DFIG with single stage gearbox, are presented to compare, based on cost and annual
energy yield for a given wind climate. The DFIG with three stage gearbox is the cheapest
solution because of standard components. Paper [38] compared the three main wind
turbine types: fixed speed induction turbine, DFIG turbine and PMSG with full scale
power converter in terms of the corresponding requirements for conventional power plant,
such as power factor control, reactive power regulation, stability improvement and so on.
As consideration of these characteristics, a summary of wind turbines configurations is
shown in Table 2.1. Each operation performance is presented in order to clarify the
corresponding characteristics.
2.5 Grid regulation for wind turbines/plants
In the early years of commercial wind power, wind energy was only a small percent of
total grid capacity. Also, wind turbines were normally connected at the medium-voltage
level collections. Thus there was no need for special sets of rules to regulate operation.
Like other distributed power generators, wind turbines were merely expected to be neutral
players. In other words, it is not required to consume or produce much reactive power and
allow switching off wind turbines as quickly as possible if there are any problems in
networks, such as, short circuit, voltage swells or sags, or deviation in frequency.
However, the share of wind power in individual grids grew rapidly in the recent years,
and thereby wind power currently made up a large amount of electricity demand in some
regions during strong wind seasons. As the size of wind farms increased, their
connections to high-voltage and extra high-voltage grids will became more common. For
instance, some offshore wind farms will be planned to connect at these levels. In addition,
sparsely populated areas generally do not have strong grid utilities, although a lot of wind
power may be available in such areas.
Hence, manufacturers of wind turbines and grid operators face technical challenges of
grid compatible turbines. For the past few years, they have been working with research
institutes to develop new control systems for wind turbines in order to come up with more

Chapter 2 Literature Review
25
and more stringent rules for grid connected wind turbines. According to the codes
released by Energinet, E.On Netz (E.ON), Western Electricity Coordinating Council
(WECC) [6], the technical requirements have been defined for the grid connected wind
turbines. The common requirements in most of grid codes can be classified into the
following issues: ride-through ability of wind turbine, control of voltage and reactive
power, active power and frequency regulation, and power quality issues. The
aforementioned four issues will be investigated in the following sections.
2.5.1 Ride-through ability of wind turbine
There is ambition to integrate a large amount of wind power into grid and to increase the
share of energy consumption that is produced by wind turbines. The disconnection of
wind turbines after a fault in the network may provoke the loss of the load. Especially,
this could be extremely dangerous where there is a large concentration of wind power
system close to the fault point. Hence, the interaction between the grid and the turbine
becomes increasingly important in the power system safety operation [4]. This can be
understood as follows. When all wind turbines would be disconnected in case of a grid
failure, these wind turbine generators will, unlike conventional power plants, not be able
to support the voltage and the frequency of the grid during and immediately following the
grid failure. This would cause major problems for the systems stability. Hence, it is
worldwide recognized that the turbines should remain connected to the grid in case of a
failure in order to enable large-scale application of wind energy without compromising
system stability. They should supply active and reactive power for frequency and voltage
support immediately after the fault has been cleared, which is normally within a fraction
of a second.
Due to this requirement, system operators in many countries have recently established
transmission and distribution system grid codes that specify the range of voltage
conditions for which wind turbines must remain connected to the power system. These
are commonly referred to as the fault ride-through specifications.
In July 2004, the wind-farm transmission grid code was released in the Republic of
Ireland. The fault ride-through requirements for wind turbines connected to the Irish
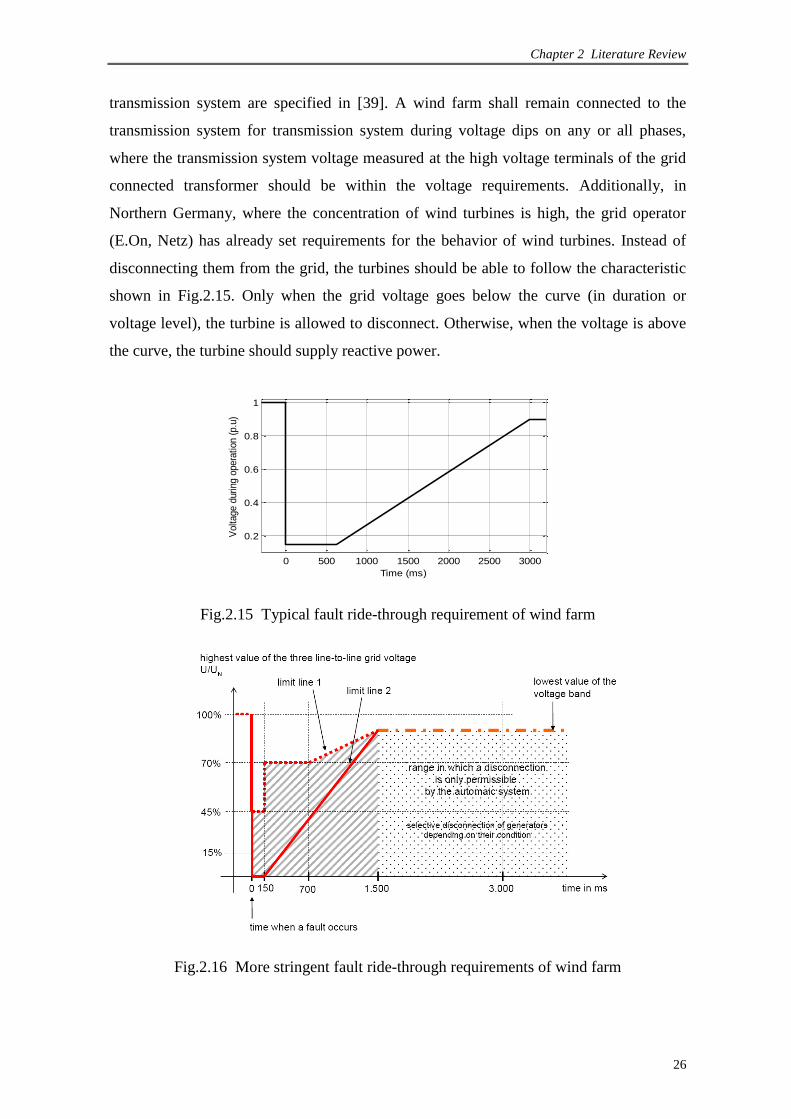
Chapter 2 Literature Review
26
transmission system are specified in [39]. A wind farm shall remain connected to the
transmission system for transmission system during voltage dips on any or all phases,
where the transmission system voltage measured at the high voltage terminals of the grid
connected transformer should be within the voltage requirements. Additionally, in
Northern Germany, where the concentration of wind turbines is high, the grid operator
(E.On, Netz) has already set requirements for the behavior of wind turbines. Instead of
disconnecting them from the grid, the turbines should be able to follow the characteristic
shown in Fig.2.15. Only when the grid voltage goes below the curve (in duration or
voltage level), the turbine is allowed to disconnect. Otherwise, when the voltage is above
the curve, the turbine should supply reactive power.
0 500 1000 1500 2000 2500 3000
0.2
0.4
0.6
0.8
1
Time (ms)
Voltage d
uring o
pera
tion (
p.u
)
Fig.2.15 Typical fault ride-through requirement of wind farm
Fig.2.16 More stringent fault ride-through requirements of wind farm

Chapter 2 Literature Review
27
Most recently, the E.ON has updated its grid code for wind farm ride through requirement
as illustrated in Fig.2.16 since the rapid increase of wind power penetration. Three-phase
balanced faults should not lead to the disconnection of the wind turbines from the grid
above the red solid line (limit line 2) shown in Fig.2.16. Below the limit line 2, the turbine
is allowed to disconnect from the grid. From Fig.2.16, the grid operators have demanded
wind turbine capable to ride through zero voltage within several hundred milliseconds.
Active power output must resume immediately following fault clearing and be increased
with a gradient of at least 20% of the rated power per second. The active power increase
can take place at 5% of the rated power per second within the area between the red dot
(limit line 1) and solid lines (limit line 2). Moreover, the additional reactive current has to
be supplied by the generating plant during a voltage dip to support the grid voltage. The
reactive current is proportional to the severity of voltage sags. The purpose of injecting
reactive current is to assist the grid on recovering its rated voltage.
2.5.2 Control of voltage and reactive power
Wind farms are often installed in remote areas and therefore reactive power has to be
transported over long distances resulting in power losses. Recent grid codes demand from
wind farms to provide reactive output regulation in response to power system voltage
variations, as for the conventional power plants. Hence, reactive power control is
important for wind farms and network. Since the reactive power injection to the network
is dependent on the network short-circuit capacity and impedance, the requirements of
reactive power control are related to the network characteristics.
G
E V
R+jX
Grid
P+jQ
Fig.2.17 Single line diagram of a grid connected wind generation system
To explain the importance of the reactive power control, a simplified power system model
with a generator at the sending end, a power transmission line and a grid-side bus named

Chapter 2 Literature Review
28
point of common coupling (PCC) at the receiving end are shown in Fig. 2.17. Let E and V
be the voltage at the sending and receiving end, respectively. The power line has a
resistance R and a reactance X. P and Q are the transmitted active and reactive power at
the receiving end. The voltage deviation between the sending end and the receiving end is
E
XQRP
E
jQPjXRVEV
))(( (2.1)
In most network, RX and hence,
VQ (2.2)
From (2.2), the magnitude of the voltage deviation is controlled by the reactive power
exchange. The reactive power flow between the generation and the load in the power
system must be balanced in order to avoid large voltage excursion.
When a fault happens, there is a voltage drop along the network circuit proportional to
fault current and to distance from the substation. Wind farms are usually located in
remote locations, the distance to the substation may be very long and the connection may
be radial. In this case the impedance is often quite large and thereby the voltage drop is
significant. However, the regulator in the substation may not be able to recover the
voltage at the connection of the wind farm without exceeding its voltage limits. Therefore,
voltage control capability of the wind farm is very useful to keep the voltage profile along
the system.
Voltage regulation and reactive power control are fundamentals in the distribution of
electric energy. As depicted in (2.2), the voltage deviation across a transmission line
determines the reactive power flow in the line or vice versa. Thus, for a given active
power output, the conventional generator‟s Automatic Voltage Regulator (AVR) is used
to determine its terminal voltage magnitude in order to supply or absorb to the
transmission system the desired amount of reactive power. A mismatch between the
supply and demand of reactive power results in a change in the system voltage. For
instance, if the supply of lagging reactive power is less than the demand, a decrease in the
system voltage results. Otherwise, if the supply of lagging reactive power is more than the
demand, there is an increase in system voltage. There are stringent requirements on the

Chapter 2 Literature Review
29
extent to which the system voltage can be allowed to deviate from its nominal values [40]
( 10 % for low voltage networks and 5 % for medium or high voltage networks).
1.0
0.2
0.5
0.33-0.33
overexcitedunderexcited
Active power PF=0.95
PF=-0.95
Option 1
Option 2
Fig.2.18 Power factor requirement for wind farm integrated to grid
Some codes prescribe that the transmission system operator may define a set-point value
for voltage or power factor or reactive power at the wind farm‟s connection point. Since
there are strict requirements on the extent to which the system voltage can be allowed to
deviate from its nominal values, several countries have already clarified these issues in
their grid codes [41]. For instance, E.ON interconnection agreements require wind farm
operator to maintain power factor (PF) between 0.95 leading and 0.95 lagging [40] which
is presented in Fig.2.18. When the generating unit is providing low active power, the
power factor may deviate from unity because it can support additional leading or lagging
currents due to the reactive power demanded by the utility. When the generating unit is
working under the nominal condition, the power factor must be kept close to unity
otherwise there will be excessive currents. On the other hand, as the reactive power is
locally generated and consumed locally, the current through all upstream devices and the
power losses in the network can be reduced. Hence, the wind farm should have the
capability to control the voltage and the reactive power at the connection point. This is
essential to ensure secure operation of the system.
For instance, some grid codes prescribe that wind farms should support the grid by
generating reactive power during a network fault, to support and faster restore the grid
voltage. The E.ON requires wind farms to support grid voltage with additional reactive

Chapter 2 Literature Review
30
current during a voltage dip, or increased reactive power consumption in the event of a
voltage swell. The voltage control must take place within 20 ms after fault recognition by
providing additional reactive current on the low voltage side of the wind turbine
transformer amounting to at least 2% of the rated current for each percent of the voltage
dip. A reactive power output of at least 100 % of the rated current must be possible if
necessary. The above applies outside a 10% dead band around nominal voltage.
According to the Spanish grid code, wind power plants are required to stop drawing
reactive power within 100 ms of a voltage drop and to be able to inject reactive power
within 150 ms of grid recovery. Finally, Great Britain and Ireland specify in their grid
codes that wind farms must produce their maximum reactive current during a voltage dip
caused by a network fault.
2.5.3 Active power and frequency regulation
In the conventional grid codes, active power control requirement is defined as an ability
to adjust the active power output with respect to the frequency deviations and the orders
coming from the transmission system operators (TSO). It is well-known that a mismatch
between the generation and load for active power is a change in the rotational energy
stored in the rotating mass of the generators: a drift in the system frequency. A surplus in
generation creates a frequency increase, and a shortage in generation leads to a decrease
of the frequency. Hence, all the generating equipments in an electric system are designed
to operate within a stringent frequency margin. Grid codes specify all generating plants
should be also able to operate within a frequency range around the nominal frequency
[42-44]. The strictest continuous operation limit for frequency appears in the British code
(47.5-52 Hz). It is obvious that the most extreme frequency limits 46.5 Hz and 53.5 Hz
are for E.ON offshore.
The goal of these new rules is to move beyond treating wind turbines as passive
generators that are ideally „neutral‟ and merely latch on to the „actual‟ grid structure.
However, nowadays, they are to be used as active elements in transmission and
distribution grids. Their technical properties should allow them, for instance, to react
appropriately to changes in active power and frequency or to overloads in certain lines in
order to increase the quality of power supply instead of being a burden.

Chapter 2 Literature Review
31
On the other hand, considerably larger variations of power production may occur at and
after extreme wind conditions. The power output of a wind farm can vary rapidly and lead
to additional imbalances between production and consumption in the system. It would
deteriorate the frequency control in the wind power connected transmission systems.
In Germany, E.ON and Vattenfall have come up with grid connection guidelines for their
zones, and the VDN has also created a set of rules as an independent association. In
addition, a number of other countries in Europe and elsewhere are currently developing
similar rules for their own situations. According to the German code, when frequency
exceeds the value 50.2 Hz, wind farms must reduce their active power with a 0.4 pu/Hz
gradient (40% of the available power of wind plant). The British code requires that wind
farms larger than 50 MW to have a frequency control device capable of supplying
primary and secondary frequency control, as well as over-frequency control. It is
remarkable that it also prescribes tests, which validate that wind farms indeed have the
capability of the demanded frequency response. In Spanish grid code, wind farm must be
able to give active power increase or decrease active power output proportional to the
frequency deviation at the connection point. The frequency control must work as a droop
controller of which values vary between 0.02 and 0.06 pu based on wind power plant
ratings. Speed of the response will be adjustable 10% of the rated capacity in 250 ms.
These rules for grid connections mainly concern power limitations for individual wind
turbines or entire wind farms, such as increasing or reducing output at preset increments
in certain situations, or specifications of the output factors that wind farms must provide.
In this way, standby power can be provided over periods of minutes or seconds.
2.5.4 Power quality issues
Power quality issues are addressed especially for wind turbines connected to the medium
voltage grid utility. Some grid codes, such as Denmark and Ireland have established the
corresponding requirements at the transmission level. Two main standards named by EN
50160 and International Electrotechnical Commission (IEC) 61000-X-X are used to
define the power quality parameters. The fast variations in voltage, short term flicker

Chapter 2 Literature Review
32
severity, long term flicker severity and the total harmonic distortion (THD) would be
specified in these standards.
The IEC initiated the standardization on the power quality for wind turbine since 1995 as
part of the wind-turbine standardization, and ultimately in 1998 IEC issued a draft IEC-
61400-21 standard for “power-quality requirements for Grid Connected Wind Turbines”.
The methodology of that IEC standard consists of the following three considerations.
The first one is the flicker analysis. The IEC-61400-21 specifies a method that uses
current and voltage time series measured at the wind-turbine terminals to simulate the
voltage fluctuations on a fictitious grid with no source of voltage fluctuations other than
the wind turbine switching operation. The second one regards switching operations.
Voltage and current transients are measured during the switching operations of the wind
turbine (startup at cut-in wind speed and startup at rated wind speed). The last one is the
harmonic analysis, which is carried out by the fast Fourier transform (FFT) algorithm.
Rectangular windows of eight cycles of fundamental frequency width, with no gap and no
overlapping between successive windows, are applied. Furthermore, the current THD is
calculated up to 50th harmonic order.
Recently, high-frequency harmonics and inter-harmonics are treated in the IEC 61000-4-7
and IEC 61000-3-6. The methods for summing harmonics and inter-harmonics in the IEC
61000-3-6 are applicable to wind turbines. In order to obtain a correct magnitude of the
frequency components, the use of a well-defined window width, according to the IEC
61000-4-7, Amendment 1, is of a great importance. Modern forced-commutated inverters
used in variable-speed wind turbines produce not only harmonics but also inter-harmonics,
i.e., harmonics that are not a multiple of 50 Hz. Since the switching frequency of the
inverter is not constant but varies, the harmonics will also vary. Consequently, since the
switching frequency is arbitrary, the harmonics are also arbitrary. Sometimes they are a
multiple of 50 Hz, and sometimes they are not.
Such sets of rules, guidelines can be used to predict the response of entire wind farms
before they have even been installed. This information then serves as the basis for
negotiations of grid connection agreements between operators of wind farms and grid
operators.

Chapter 2 Literature Review
33
2.6 The potential challenges for grid-connected wind turbines
According to the grid requirements presented in Section 2.5, the ideal wind turbine should
have a good ride-through characteristic to deal with any grid disturbances and faults; be
able to provide good grid support, such as reactive current for voltage regulation; have
flexible active power regulation, harmonics-free characteristic and high reliability,
especially for offshore wind turbines.
2.6.1 Fault ride-through enhancement for DFIG wind turbine
The latest grid codes have clarified the low voltage ride through ability of the grid
connected wind turbine in Section 2.5.1. When the network suffers a fault, the turbine is
required to keep connection, and most importantly, the reactive current is demanded to
inject into the network according to the latest grid codes. The aim is to help the network
voltage recovery.
The power electronics converter used in DFIG is only 20%~30% of the generator rating,
which is determined by the speed operating range of DFIG. This is the significant
advantage of DFIG turbines. Hence, more than 50% of the installed turbines in the last
decade are using the DFIG configuration. However, since the stator windings of DFIG are
directly connected to the grid utility via a three-phase transformer, the performance of
DFIG is very sensitive to any grid disturbances, such as voltage sags, swells. Thus severe
voltage sags and the resulting stator flux place a significant electrical stress on the rotor-
side converter and thereby increase mechanical stress on the gearbox as well [37, 45].
Consequently, the DFIG fails to satisfy with the aforementioned ride-through
requirements if no additional protection is adapted. To cater the latest grid requirement, it
is necessary to develop ride-through strategies for DFIG.

Chapter 2 Literature Review
34
Fig.2.19 DFIG ride-through enhancement with crowbar circuit
Wind generation system is basically equivalent to variable speed pump/fan drive system
operation in regenerative mode. Fault studies on induction motor drives [46] are potential
to transfer to solve the problem faced in DFIG system. In the literature, several solutions
have been proposed to improve ride-through capability of DFIG. Using serial dynamic
braking resistors applied to the stator windings during a voltage sag [47] has been shown
to be able to reduce torque and current spikes in the DFIG, and thereby prevent rotor-side
converter damage during voltage sag conditions. Two improvements of the rotor circuit
by introducing either a silicon controlled rectifier (SCR) rotor crowbar circuit [48-50] or a
three-phase rectifier and adjustable resistive load [51] have demonstrated enhancement in
the DFIG ride-through capability. Figure 2.19 shows the crowbar circuit for DFIG ride-
through enhancement. The selection of the crowbar resistance is the key factor to
reinforce the ride-through capability of DFIG. Too small a resistance will fail to limit the
rotor-side spike current during fault transients, but too large resistance can also cause the
overvoltage phenomenon on the rotor-side converter. Both of these two cases will
degrade the ride-through performance of crowbar method for DFIG. Recently a
combination of crowbar circuit and series dynamic resistor has been installed in the rotor
circuit of DFIG, which exhibits good protection during grid faults, especially
unsymmetrical disturbances compared to the conventional crowbar [52]. In addition, an
improved rotor side control principle has been shown to protect the rotor-side converter
while DFIG terminal voltage is stepped down to nearly 30% of nominal [53, 54]. This
solution, however, requires large capacity of current in the rotor converter and cannot deal
with the severe voltage sags, such as zero-voltage ride-through. The integration of a short-
term energy storage device in a DFIG design has also shown the improvement of ride-
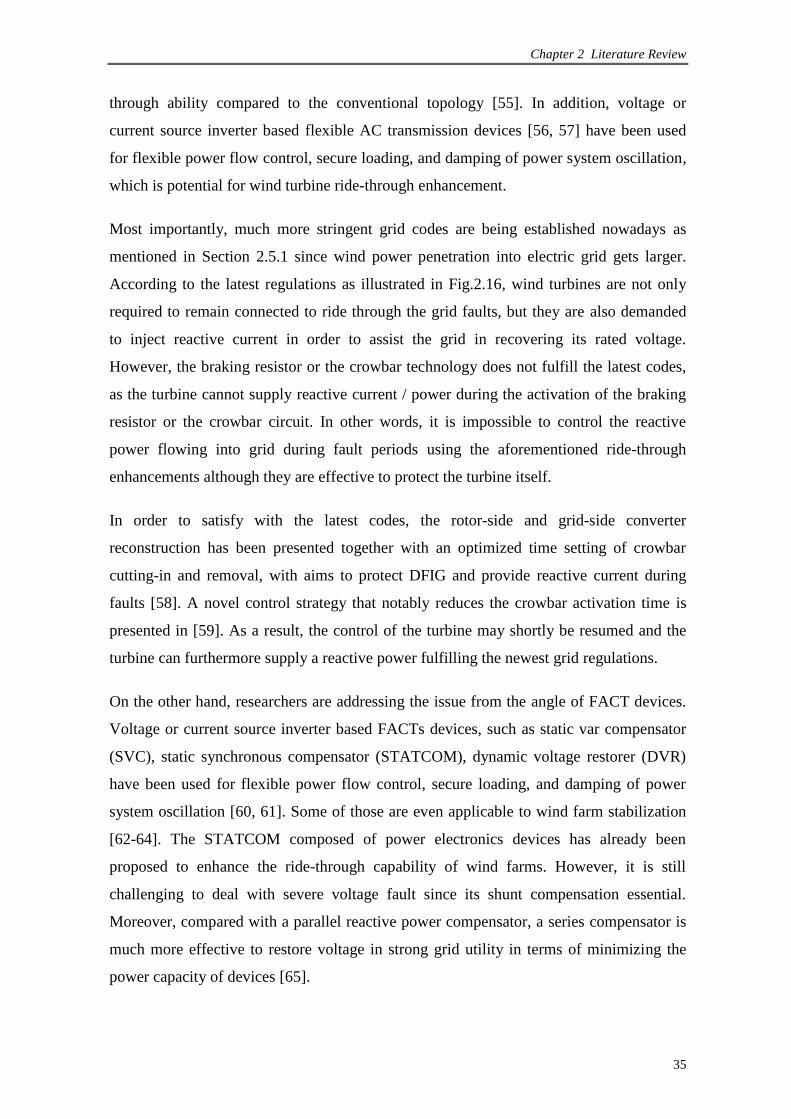
Chapter 2 Literature Review
35
through ability compared to the conventional topology [55]. In addition, voltage or
current source inverter based flexible AC transmission devices [56, 57] have been used
for flexible power flow control, secure loading, and damping of power system oscillation,
which is potential for wind turbine ride-through enhancement.
Most importantly, much more stringent grid codes are being established nowadays as
mentioned in Section 2.5.1 since wind power penetration into electric grid gets larger.
According to the latest regulations as illustrated in Fig.2.16, wind turbines are not only
required to remain connected to ride through the grid faults, but they are also demanded
to inject reactive current in order to assist the grid in recovering its rated voltage.
However, the braking resistor or the crowbar technology does not fulfill the latest codes,
as the turbine cannot supply reactive current / power during the activation of the braking
resistor or the crowbar circuit. In other words, it is impossible to control the reactive
power flowing into grid during fault periods using the aforementioned ride-through
enhancements although they are effective to protect the turbine itself.
In order to satisfy with the latest codes, the rotor-side and grid-side converter
reconstruction has been presented together with an optimized time setting of crowbar
cutting-in and removal, with aims to protect DFIG and provide reactive current during
faults [58]. A novel control strategy that notably reduces the crowbar activation time is
presented in [59]. As a result, the control of the turbine may shortly be resumed and the
turbine can furthermore supply a reactive power fulfilling the newest grid regulations.
On the other hand, researchers are addressing the issue from the angle of FACT devices.
Voltage or current source inverter based FACTs devices, such as static var compensator
(SVC), static synchronous compensator (STATCOM), dynamic voltage restorer (DVR)
have been used for flexible power flow control, secure loading, and damping of power
system oscillation [60, 61]. Some of those are even applicable to wind farm stabilization
[62-64]. The STATCOM composed of power electronics devices has already been
proposed to enhance the ride-through capability of wind farms. However, it is still
challenging to deal with severe voltage fault since its shunt compensation essential.
Moreover, compared with a parallel reactive power compensator, a series compensator is
much more effective to restore voltage in strong grid utility in terms of minimizing the
power capacity of devices [65].

Chapter 2 Literature Review
36
Bearing all these in mind, a series compensator based ride-through architecture for DFIG
and its advanced control will be investigated in Chapter 3 to cater the latest grid
regulations.
2.6.2 Power architecture improvement for PMSG wind turbine
As predicted by the Danish wind consultation company MAKE in 2010, the PMSG will
be the next mainstream generator technology barring any unexpected upsurge in price of
permanent magnet materials. The worldwide wind turbine manufacturers, such as Vestas,
GE Wind, and Siemens have been interested in the design and application of PMSG based
wind turbines.
PMSG is much more popular because of its higher efficiency, high-power density, and
robust rotor structure. The simple and robust low speed rotor design with no separate
excitation or cooling system results in minimum wear, reduced maintenance requirements,
lower life cycle costs, and a long lifetime. Most importantly, PMSG exhibits good ride-
through and grid support performance because of applying the full scale converter
compared with DFIG. The full converter wind turbine is the most flexible wind turbine
technology from an LVRT point of view, as the active and reactive power output can be
controlled using the converters [66]. So far, Vestas announces its PMSG ride-through
technology named as „GridStreamer‟, which is able to meet the ride-through requirements.
Another significant advantage of PMSG turbine is the possibility of gearless operation. In
[67], the problem to adapt a standard permanent-magnet synchronous machine to a direct-
drive application is presented. A complete design of a low-speed direct drive permanent-
magnet generator for wind application is depicted in [68].
It is well-known that PMSG is fed by a full scale power electronics converter whether the
gear or gearless structure is adopted. Therefore, the power electronics converter plays a
significant role in the PMSG turbines. A current-source converter is employed as the
bridge between the generator and the grid for high-power wind energy conversion
systems [69]. In [70], two current-source inverters are in series to bridge the axial flux
generator and grid, which aims for MW level wind turbine application. However, the
current-source converter normally introduces a lot of harmonics without advanced

Chapter 2 Literature Review
37
filtering technologies, and thereby deteriorates power quality of the connected utilities.
Hence, considering the power quality requirements, voltage-source converter with pulse
width modulation (PWM) technology is more and more popular for PMSG applications,
thanks to the advance of power electronics in recent years. Figure 2.9 and 2.10 presented
two typical power architectures for PMSG application.
As illustrated in Fig.2.9, the PMSG is fed by a diode rectifier cascaded with a DC chopper.
This system possesses merits such as simple construction and low cost. However, it lacks
control capability over the generator power factor, which reduces generator efficiency.
Additionally, high harmonic current distortions in the generator windings further degrade
efficiency and produce torque oscillations. To address this problem, the PMSG is
connected to the grid by means of a fully controlled frequency converter, which consists
of a PWM rectifier, an intermediate DC stage and a PWM inverter, as shown in Fig.2.10.
With this configuration the generator-side converter can completely regulate the generator
in terms of speed, power factor and electromagnetic torque. However, the configuration
reliability is relatively low due to the potential existence of shoot-through states arising
from gate-drive failures. Thus there is motivation to overcome the aforementioned
limitations.
Recently, research on the three-switch buck-type rectifier has focused on grid-side current
quality improvement [71, 72], design and implementation [73], and parallel operation
[74]. On the other hand, current research on Z-Source inverters has focused on modeling
and control [75, 76], PWM strategy [77], Multi-level implementation [78], application
and performance improvement [79, 80], and other variants of the Z-Source network [81-
83]. However, detailed design of a PMSG grid interface system based on the integration
of the three-switch rectifier and the Z-Source inverter has not been reported.
The motivation to use Z-Source inverter for feeding good-quality power into grid comes
from the highly reliable operation of the topology. The Z-Source inverter does not have
the short-circuit risk associated with conventional inverter topologies. Moreover, fewer
harmonics are presented in the Z-Source inverter compared with the conventional inverter
due to the elimination of the commutation dead-time. In addition, the three-switch
rectifier also has high reliability characteristics compared to the conventional bridge
rectifier. There is no shoot-through phenomenon in the rectifier. This is a very important

Chapter 2 Literature Review
38
issue in PMSG application since short-circuit of PMSG would rapidly result in over-
current in the stator windings. Therefore, if any of three switches is shorted or
malfunctioning, the PWM rectifier can still be operated as a normal diode rectifier after
detecting the fault-event. Hence, the integration configuration can overcome the
aforementioned drawbacks of existing configurations, and provides high reliability, low
capital cost, and harmonic-free characteristics in both generator and grid sides.
The proposed architecture for PMSG and its control in this thesis has been developed
with the above issues in mind. First of all, it is necessary to explore the integration
topology named as the three-switch buck-type rectifier with Z-Source inverter in terms of
modulation, circuit analysis and validation before doing the system-level integration for
PMSG based wind turbine. A unified modulation for both the machine-side and grid-side
converters will be given in order to prevent the negative interaction between the two
converters. To achieve variable speed operation of PMSG, the buck-boost capability is
required for the developed topology. Hence, equivalent circuit analysis of the
aforementioned topology will be provided to study the voltage transfer ratio, which gives
fundamentals for variable speed PMSG turbine.
In this thesis, the modulation, analysis and demonstration of the three-switch buck-type
rectifier with Z-Source inverter will be introduced in Chapter 4 with aims to clarify the
proposed topology and essential behavior. Then the design methodology, the simulation
studies and experimental validation of the proposed architecture for PMSG wind
application will be presented in Chapter 5.
2.6.3 Potential methods to quantify wind power impacts
As mentioned in Section 2.2, wind power capacity will have a significant percentage of
the worldwide electricity demand in the next decade, such as in western European
countries. It can be predicted that the output power of wind farm will be large enough to
affect the voltage regulation of the connected utility as mentioned in Section 2.5.2.
These developments clearly indicate the need to search for effective solutions to alleviate
any of the negative impacts the wind generators may have on the grid so that the benefit
of the renewable energy source can be maximized. For example, a possible solution is to
Chapter 2 Literature Review
39
incorporate energy storage devices into the network [84]. However, this or any other
solution will incur additional cost to the system. Thus, there is a need to devise reliable
method(s) to accurately quantify the impacts so that the most appropriate and economical
solution to mitigate the impacts can be obtained. It is noted that voltage quality is
essentially dependent on the amount of wind power injection and the effective impedance
characteristics of the external network connected to the wind generators. Hence, it will be
necessary to consider together both the injected power and network impedance
characteristics when assessing the impacts of wind generation on network voltage.
Toward this end, deterministic analysis approaches have been proposed in [85, 86]. As
the methods involve relatively simple calculations, they require low computation time.
The deterministic approaches assume known loads, generation and network conditions.
Often only maximum/minimum wind generation conditions at extreme network
conditions are considered, without taking into consideration the likelihood of their
occurrence. The solution methods obtained to control network voltage may therefore be
unnecessarily expensive or complex, as they would only be used for events or instances
which may have very low probability of occurrence. It is perhaps in recognition of this
observation that for general application study on power quality, new standards such as
that discussed in [87, 88] prescribes voltage quality performance measured in statistical
terms. The industry trend is indicating that statistical and probabilistic approaches are
gaining in importance in voltage quality assessment study.
Recognizing the shortcoming of deterministic methods, the authors of [89] suggested the
use of discrete Markov modeling technique to describe wind speed. Voltage profile at
selected buses can be obtained through conventional load flow study by applying the
derived wind power to a given distribution network. The voltage profile can also be
described in probabilistic manner. However, the authors still considered the wind farm
connected network to be essentially a deterministic system. In practice, this assumption is
unlikely to be valid because network status changes as loads and generation levels vary.
The authors of [90] have also derived an alternative probabilistic model to study the
impact on external system, due to an aggregate of wind-powered induction generators
with fluctuating input mechanical power. Reference [91] proposed a simpler
computational method in which the mean values of the wind farm output power and
external load level are used to evaluate the voltage profile at the point of common

Chapter 2 Literature Review
40
coupling. Again the authors in [90] and [91] have used a deterministic Thevenin
equivalent model to represent the external network. Finally reference [92] proposed to
treat the injected wind power in a statistical manner, where network voltage is evaluated
using probabilistic load flow (PLF) solution technique. Similarly, reference [93]
considered operational uncertainties (including e.g. daily time varying load, stochastic
wind power generation, varying network reconfiguration) to assess voltage quality using
PLF study. Thus both methods in [92, 93] will require extensive input data which may not
be readily available. The computational burden of the technique can be expected to be
high.
The method proposed in this thesis has been developed with the above issues in mind.
The proposed method calculates the impact of wind power penetration on network
voltage in a statistical manner: the wind power injection and the state of the connected
grid are described in terms of probabilistic distributions. The detailed analysis will be
explained in Chapter 6.
2.7 Conclusion
This chapter has reviewed the existing wind turbine configurations and current grid codes
for wind power penetration. Among the aforementioned turbine configurations, the DFIG
has a poor ride-through performance, which is inadequate to satisfy the ride-through
requirements if no protection is provided. However, more than 50% of the installed
turbines in the last decade are based on the DFIG configuration. To make these turbines
to still comply with the new grid codes, it is very important to reinforce its ride-through
characteristic. Hence, this will be one of the research directions in this thesis.
Compared with DFIG, PMSG exhibits good ride-through and grid support performance
because of application of the full scale power converter. As predicted by the Danish wind
consultation company MAKE, the PMSG will likely be the dominant technology in the
next decade. It is well-known that power electronics converter plays a significant role in
the PMSG turbine in terms of system integration, reliability and power quality. Therefore,
investigating advanced power architecture is one of the key tasks for PMSG based
turbines.

Chapter 2 Literature Review
41
Regardless of DFIG or PMSG, wind power capacity will have a significant percentage of
the worldwide electricity demand in the next decade. Consequently, wind power will
significantly affect the operation of utility in terms of voltage regulation, frequency
control and so on. Thus, there is a need to devise reliable methods to accurately quantify
the impacts so that the most appropriate and economical solution to mitigate the impacts
can be obtained. Hence, one of the potential researches is to develop a feasible voltage
quality analysis for large wind power penetrated networks, which aims to eliminate the
related negative impacts.
All these three directions have been investigated and analyzed in this project and will be
described in details in the subsequent chapters respectively.
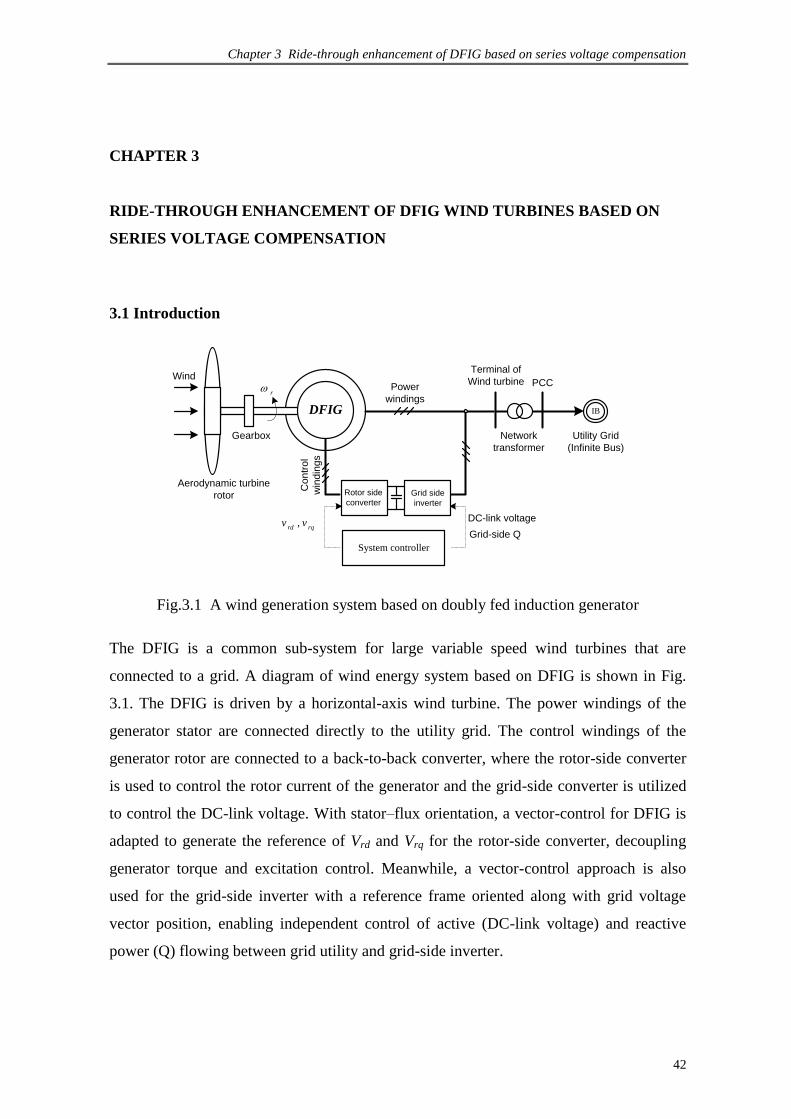
Chapter 3 Ride-through enhancement of DFIG based on series voltage compensation
42
CHAPTER 3
RIDE-THROUGH ENHANCEMENT OF DFIG WIND TURBINES BASED ON
SERIES VOLTAGE COMPENSATION
3.1 Introduction
DFIG
Wind
Aerodynamic turbine
rotor
Gearbox Network
transformer
PCC
Terminal of
Wind turbine
IB
Utility Grid
(Infinite Bus)
Rotor side
converter
r
System controller
rqrdvv ,
Grid-side Q
Power
windings
Co
ntr
ol
win
din
gs
Grid side
inverter
DC-link voltage
Fig.3.1 A wind generation system based on doubly fed induction generator
The DFIG is a common sub-system for large variable speed wind turbines that are
connected to a grid. A diagram of wind energy system based on DFIG is shown in Fig.
3.1. The DFIG is driven by a horizontal-axis wind turbine. The power windings of the
generator stator are connected directly to the utility grid. The control windings of the
generator rotor are connected to a back-to-back converter, where the rotor-side converter
is used to control the rotor current of the generator and the grid-side converter is utilized
to control the DC-link voltage. With stator–flux orientation, a vector-control for DFIG is
adapted to generate the reference of Vrd and Vrq for the rotor-side converter, decoupling
generator torque and excitation control. Meanwhile, a vector-control approach is also
used for the grid-side inverter with a reference frame oriented along with grid voltage
vector position, enabling independent control of active (DC-link voltage) and reactive
power (Q) flowing between grid utility and grid-side inverter.

Chapter 3 Ride-through enhancement of DFIG based on series voltage compensation
43
Since the control of the DFIG is tied to the rotor windings, only slip power is processed
by the power electronics converter, where the purpose of the converter is to synchronize
the rotor current with respect to the stator reference of the DFIG. However, since the
stator windings of DFIG are directly connected to the utility grid via a three-phase
transformer, the performance of DFIG is very sensitive to any grid disturbances, such as
voltage sags and swells. It is therefore necessary to explore ride-through enhancements
for DFIG based turbines.
Several ride-through enhancement solutions have been reviewed in Chapter 2. To address
the potential challenges of existing ride-through methods as mentioned in Section 2.6.1,
an integration of a series voltage compensator in the stator of the DFIG to reinforce its
fault ride-through capability is introduced in this chapter. Prior to introducing the control
of series compensator, the control of DFIG system is firstly presented to give the
fundamentals for its ride-through analysis. Then the essential behavior of the DFIG
during the fault condition is analyzed using system phasor diagram. Subsequently, the
general control scheme for the series compensation system in case of grid faults is
presented. However, the conventional control scheme would result in the high cost of the
ride-through method. Hence, to reduce the cost of series voltage compensator, this chapter
also proposes a customized control solution to regulate the series voltage compensator.
This is the significant contribution of this series compensator based ride-through method.
3.2 Fundamentals of DFIG wind turbine
3.2.1 Mathematical model of DFIG
s
s
sd
sq
r
r
r
r
s
sd
sq
e
p
r
Fig.3.2 Vector diagram of the DFIG

Chapter 3 Ride-through enhancement of DFIG based on series voltage compensation
44
This section investigates the control of DFIG, which gives fundamentals for the ride-
through analysis. Vector diagram of the DFIG is shown in Fig.3.2. The ss and
rr frames are the stationary two-phase frames referenced to the stator and rotor
windings, respectively. As referred to the stator windings, the rr frame is a rotating
frame with the angular speed r . Compared to the ss frame, the ss qd frame is
referred to a rotating frame when it is rotating at the angular speed . If the is chosen
as the synchronous speed e , the synchronous ss qd frame is obtained. Therefore, the
equivalent circuit of a DFIG expressed in the reference frame ( ss qd frame) rotating at
a speed of is shown in Fig.3.3 [94]. As it is shown in the stator reference frame, the
stator and rotor flux linkage vectors can be expressed as,
smrrr
rmsss
ILIL
ILIL
(3.1)
Where, slms LLL and rlmr LLL are the stator and rotor total magnetic
inductances. slL and rlL are the leakage inductances of the stator windings and rotor
windings respectively, and mL is the mutual inductance. The stator voltage vector in the
rotating reference frame is given as
rrr
rrr
ss
sss
jdt
dIRV
jdt
dIRV
)(
(3.2)
sV
rV
s
r
sRrR
rlLslL
mL
sj
rrj
)(
sI
rI
Fig.3.3 Equivalent circuit of a DFIG in the reference frame rotating at
Putting the vectors in (3.2) into the ss qd synchronous frame, (3.2) is rewritten as

Chapter 3 Ride-through enhancement of DFIG based on series voltage compensation
45
sd
sq
sqssq
sqsd
sdssd
dt
diRu
dt
diRu
(3.3)
Where, sdu and squ are the sd - and sq -axis components according to the rotated vector
sV
, respectively. sdi and sqi are the stator current components in ss qd frame.
Again, the stator and rotor flux linkage vectors in (3.1) can be also rewritten in the
synchronous frame as
sqmrqrrq
sdmrdrrd
rqmsqssq
rdmsdssd
iLiL
iLiL
iLiL
iLiL
(3.4)
Where, rdi and rqi are the rotor current components on ss qd frame, respectively.
3.2.2 Field oriented control of DFIG
In order to apply the field oriented control for a DFIG, a d-q transformation is required,
which has been introduced in Section 3.2.1. The scheme presented in this section uses
stator flux oriented control for the rotor-side converter and grid voltage oriented control is
used to control the grid-side converter.
A. Control of the rotor-side converter
For high power machine, the stator resistance is usually neglected and the amplitude and
rotating speed of the stator flux are constant due to the fixed grid voltage. Therefore,
stator flux orientation gives orientation with the stator voltage for the MW level wind
turbines.

Chapter 3 Ride-through enhancement of DFIG based on series voltage compensation
46
The realization of the stator flux orientation will be carried out as follow. The d-axis is
assumed to be aligned to stator flux, and the stator current coming out of the stator
windings is considered positive. In the synchronous d-q reference frame ( ss qd ) as
illustrated in Fig. 3.3, the speed of the reference frame is chosen equal to the stator
flux rotated speed e (consistent with the grid frequency). Thus,
0sq
sd const
(3.5)
On the other hand, the stator active and reactive power outputs of the DFIG can be
expressed under the synchronous reference frame as,
)(2
3
)(2
3
sqsdsdsqs
sqsqsdsds
iuiuQ
iuiuP
(3.6)
Substituting (3.3), (3.4) and (3.5) into (3.6), (3.6) can be rewritten as
)(2
3
2
3
rd
m
sdsde
s
ms
rqsde
s
ms
iLL
LQ
iL
LP
(3.7)
From (3.7), it is easy to identify the active power and reactive power via the rotor side
current in the given rotated reference frame. The stator flux oriented vector control
strategy is used to achieve the decoupled control of the real and reactive power.
In order to control the rotor-side current, the rotor voltage vector in the rotating reference
frame from Fig.3.3 is given by,
rrr
rrr jdt
dIRV
)( (3.8)
According to the axis transformation in Fig.3.2, the corresponding ss qd axis expression
can be derived as

Chapter 3 Ride-through enhancement of DFIG based on series voltage compensation
47
rdre
rq
rqrrq
rqrerd
rdrrd
dt
diRu
dt
diRu
)(
)(
(3.9)
Where, rdu and rqu are the sd and sq axis values according to the rotating vector rV
,
respectively. rdi and rqi are the rotor currents on the sd and sq axis.
From (3.4) and (3.5), the stator current ds- and qs-axis components can be derived as
rq
s
msq
s
rdmsdsd
iL
Li
L
iLi
(3.10)
Substituting (3.10) into (3.4), the rotor flux ds- and qs-axis components can be rewritten as
rqrrq
sd
s
mrdrrd
iL
L
LiL
(3.11)
Where, )(1 2rsm LLL .
Again, substituting rd and rq in (3.11) into (3.9), the rotor voltage in (3.9) can be
expressed in terms of the rotor currents
sd
s
mrerdrre
rq
rrqrrq
rqrrerd
rrdrrd
L
LiL
dt
diLiRu
iLdt
diLiRu
)()(
)(
(3.12)
From (3.12), it is found that there is cross coupling between the ds- and qs-axis due to the
presence of the rotational EMF terms. The current loop dynamics along the ds- and qs-axis
can be made independent by compensating for these terms in the control loops. Figure
3.4 shows the block diagram for the rotor-side converter to realize the field oriented
control of DFIG. The stator flux estimation block is used to extract the stator flux, angle
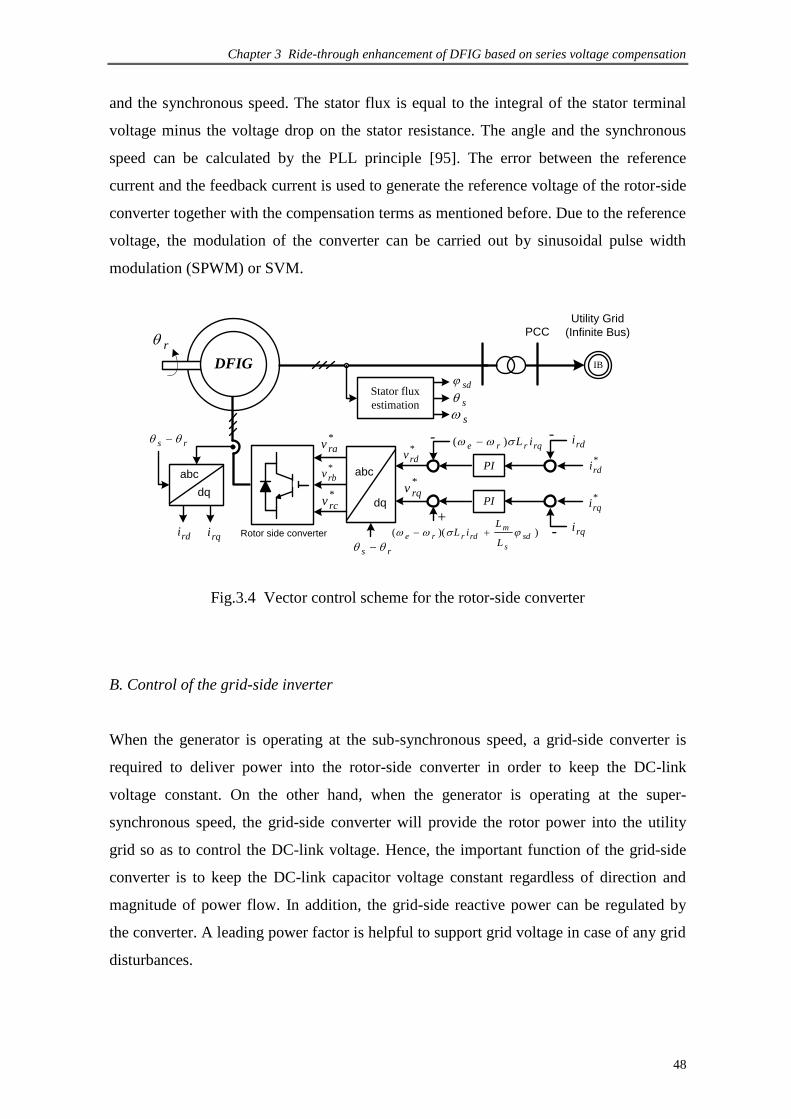
Chapter 3 Ride-through enhancement of DFIG based on series voltage compensation
48
and the synchronous speed. The stator flux is equal to the integral of the stator terminal
voltage minus the voltage drop on the stator resistance. The angle and the synchronous
speed can be calculated by the PLL principle [95]. The error between the reference
current and the feedback current is used to generate the reference voltage of the rotor-side
converter together with the compensation terms as mentioned before. Due to the reference
voltage, the modulation of the converter can be carried out by sinusoidal pulse width
modulation (SPWM) or SVM.
DFIG
PCC
IB
Utility Grid
(Infinite Bus)
Rotor side converter
r
Stator flux
estimation
sd
s
s
rdi rqi
abc
dq
abc
dq
rs *rav
*rbv
*rcv
-
rs
*rdv
*rqv
+
PI
rqrre iL )(
))(( sd
s
mrdrre
L
LiL
PI
-
-
rdi
rqi
*rdi
*rqi
Fig.3.4 Vector control scheme for the rotor-side converter
B. Control of the grid-side inverter
When the generator is operating at the sub-synchronous speed, a grid-side converter is
required to deliver power into the rotor-side converter in order to keep the DC-link
voltage constant. On the other hand, when the generator is operating at the super-
synchronous speed, the grid-side converter will provide the rotor power into the utility
grid so as to control the DC-link voltage. Hence, the important function of the grid-side
converter is to keep the DC-link capacitor voltage constant regardless of direction and
magnitude of power flow. In addition, the grid-side reactive power can be regulated by
the converter. A leading power factor is helpful to support grid voltage in case of any grid
disturbances.

Chapter 3 Ride-through enhancement of DFIG based on series voltage compensation
49
s
s
sd
sq
r
gridV
s
s
Fig.3.5 Grid voltage vector orientation for the grid-side inverter
A grid voltage vector oriented control strategy is utilized in the control of the grid-side
converter, which allows decoupled control of the DC-link voltage and grid-side reactive
power regulation. The voltage vector is oriented along the d-axis as shown in Fig.3.5.
Herein, the grid voltage is aligned with the d-axis synchronous speed. Hence, the active
and reactive power dealt with the grid-side converter can be calculated by
qdg
ddg
ivQ
ivP
2
3
2
3
(3.13)
The energy stored in the DC link capacitor is the integral of power difference between the
power delivered by the rotor-side converter and the power flowing into grid by the grid-
side converter. Hence, from (3.13), the d-axis current controls the DC link voltage and
reactive power is controlled using the q-axis current.
dcCA
B C
dcV
sav
sbv
scv
LRva
vb
vc
ia
ic
ib
Fig.3.6 Grid-side converter arrangement
Figure 3.6 shows the arrangement of the grid-side converter. L and R are the grid-side
inductance and resistance respectively. The converter is connected to the grid through the

Chapter 3 Ride-through enhancement of DFIG based on series voltage compensation
50
transformer as the DC-link is operated at a relative lower voltage level. The voltage
equations across the inductances and resistances are expressed as follow,
c
b
a
c
b
a
c
b
a
sc
sb
sa
v
v
v
i
i
i
dt
dL
i
i
i
R
v
v
v
(3.14)
With the transformation into a d-q synchronous frame as shown in Fig.3.5, the d- and q-
axis voltage components can be written from (3.14) as
qdsqqsq
dqsddsd
vLiidt
dLRiv
vLiidt
dLRiv
(3.15)
Since the d-axis of the reference frame is aligned with the grid voltage vector, the q-axis
component of the grid voltage is zero. The grid-side converter is required to supply the
voltage as follow, which is rewritten from (3.15),
dsqqq
sdqsddd
Liidt
dLRiv
vLiidt
dLRiv
)(
)(
(3.16)
From (3.16), there is cross coupling between the d- and q-axis due to the presence of the
rotational EMF terms. The current loop dynamics along the d- and q-axis can be made
independent by compensating for these terms in the control loops. Figure 3.7 shows the
block diagram for the grid-side converter. The stator voltage calculation block is used to
extract the stator voltage magnitude, angle and the corresponding angular speed. The
angle and the synchronous speed can be calculated by the PLL principle as
aforementioned. The error between the reference DC-link voltage and the corresponding
feedback serves as the reference current of the inner current loop. The d- and q-axis
components are utilized to control the DC-link voltage and the grid-side reactive current,
respectively. The reference voltage of the grid-side converter is obtained by combining
the outputs of the inner current loop and the aforementioned compensation terms.

Chapter 3 Ride-through enhancement of DFIG based on series voltage compensation
51
PCC
IB
Utility Grid
(Infinite Bus)
Grid side converter
Stator
voltage
calculator
sdV
s
s
di qi
abc
dq
abc
dq
s *sav
*sbv
*scv
-
s
*1sdv
*1sqv
+
PI
sdqe vLi
PI
-
-
di
qi
*qi
-
de Li
PI
*dcV
dcV
-
Fig.3.7 Vector control scheme for the grid-side converter
C. System control diagram considering turbine’s characteristic
For a horizontal-axis wind turbine, the captured wind power is a function of wind speed
and can be expressed as [96]:
pW CAvP 3
2
1 (3.17)
Where, WP is the wind power production of wind turbine. is the air density
(3/ mkg )(At C015 and 1 atm, 3/225.1 mkg ), A is the cross-sectional area of wind
turbine (2m ) ( 2rA with wind turbine radius of r ), and v is wind speed (m/s). pC is
the power coefficient of wind turbine.
For a given wind speed, the power transferred coefficient pC is a function of the rate at
which the wind turbine turns. If the turbine turns too slowly, the coefficient drops off
since the blades are letting too much wind pass by unaffected. In contrast, if the turbine
turns too fast, the coefficient is reduced as the turbulence caused by one blade
increasingly affects the blade that follows. The usual way to illustrate pC is to present it
as a function of turbine‟s tip-speed ratio (TSR). The tip-speed-ratio of wind turbine can
be defined as:

Chapter 3 Ride-through enhancement of DFIG based on series voltage compensation
52
v
rr (3.18)
Where, r is the rotating angular speed of wind turbine which can be expressed by
mr k . Here m is the generator angular speed. Normally there is a gear box
between wind turbine blades and generator. The gear box ratio is k .
A non-linear relationship between pC and can be obtained experimentally for any
given wind turbine as shown in Fig.3.8. The rotor speed of the generator would be
proportional to the wind speed in order to achieve maximum wind power.
2 4 6 8 10 12 14 16 180
0.05
0.1
0.15
0.2
0.25
0.3
0.35
0.4
0.45
0.5
Tip-speed-ratio
Pow
er
transfe
r coeff
icie
nt
Cp
Fig.3.8 Power transfer coefficient pC versus Tip-speed ratio
In order to maximize the wind power extraction, the relation between wind speed and
wind power is written in a look-up table, which serves as the reference for the rotor-side
converter. Due to the optimized wind power, the torque reference provided by the turbine
can be expressed as,
ropt
we PT /* (3.19)
Where, opt
wP is the maximum wind power according to the optimized tip-speed ratio.

Chapter 3 Ride-through enhancement of DFIG based on series voltage compensation
53
PCC
IB
Utility Grid
(Infinite Bus)rDFIG
PWM
Rotor-side
vector
control
PWM
Grid-side
vector
control
Measured
wind speed
*rqi *
dcV
*qi
dcV
Optimal tracking control
Fig.3.9 System control diagram of the DFIG based wind turbine
Figure 3.9 shows the system control diagram of DFIG to track the maximum power point
of wind power. Due to the real-time measured wind speed, the theoretical maximum wind
power captured and optimized rotor speed can be calculated by (3.17) and (3.18),
respectively. Consequently, the torque reference can be calculated from (3.19) as well.
Under the stator-flux oriented control, the rotor-side q-axis current component, rqi , is
proportional to the torque, and thereby the rqi reference can be obtained from the torque
reference. Hence, the vector control of DFIG can be implemented with the current
references in the stator-flux oriented frame, which has been illustrated in Fig.3.4.
3.3 A series compensator based ride-through enhancement for DFIG
DFIG
Ge
arb
ox PCC
Vw
RSC GSI
SW1
VPCC
Vs
Is
DCAC
Utility Grid
Fig.3.10 Single-line diagram of the DFIG based wind turbine connected to grid.

Chapter 3 Ride-through enhancement of DFIG based on series voltage compensation
54
The general schematic arrangement of the proposed DFIG architecture is shown in
Fig.3.10, which aims to enhance ride-through capability. Compared to the conventional
DFIG system in Fig.3.1, the difference in the proposed structure is the utilization of a
series compensator. From Fig.3.10, the series compensator is made up of a three-phase
transformer and a power electronics converter with DC-link energy storage devices. The
primary side of the series transformer is installed between the DFIG stator terminal and
the PCC. The secondary side of the transformer is connected with the power electronics
converter, which is used to generate a certain voltage during grid faults.
The principle of the series compensator is as follow. In the normal condition, the series
compensator is bypassed by the power semiconductor switch SW1 (as shown in Fig.3.10)
in order to eliminate the stator side impedance, which in turn, reduces system losses. As
fast as monitoring the PCC voltage beyond the certain limitation, the series compensator
is being in function by turning off the SW1. The function of the series compensator is to
keep the stator voltage as constant when the PCC voltage suffers voltage sag during grid
fault period. The advantage of the series compensated solution is to make the DFIG
turbine insensitive to the grid-side disturbances. Moreover, the rotor-side converter is still
in normal operation to regulate the power output of DFIG during fault periods with the
help of series compensator. Thus this characteristic is not available in the conventional
crowbar solution since the rotor-side converter has to be shut down during the crowbar
activation. It is worthy to point out the high cost of the series compensator is the
significant limitation of the series compensation solution compared to the crowbar
method. In order to address this challenge, an improved control of DFIG-series
compensator will be discussed in Section 3.6 with the aim to reduce the cost of the series
compensator.
On the other hand, the conventional grid connected DFIG system is sensitive to the grid
variants such as voltage sags and swells as aforementioned. There will be overcurrent /
overvoltage phenomenon in the rotor-side converter during grid fault periods. Herein the
essential behavior of DFIG during grid faults will be investigated in the next section by
using phasor diagram analysis.

Chapter 3 Ride-through enhancement of DFIG based on series voltage compensation
55
3.4 Essential behavior of DFIG during grid fault
For the convenience of phasor diagram analysis, the T-form circuit of DFIG shown in
Figure 3.3 is desired to transform into the Г-form equivalent circuit. It is worthy to point
out that the γ=Ls/Lm is nearly equal to 1 for the power rating of generator larger than
100KW [97]. Consequently, the T-form equivalent circuit of DFIG is transformed to the
Г-form equivalent circuit as illustrated in Fig.3.11. The phase diagram analysis will be
carried out in the next section based on the Г-form equivalent circuit.
sv
sR rRlrLlsL
sL
rrj
spE
1 2E
rv
si
ri
mi
+-
Fig.3.11 Г-form equivalent circuit of the DFIG in the static frame
3.4.1 Phasor diagram during normal operation
In the DFIG based wind turbine, the stator windings are directly connected to the grid
utility via a step-up transformer, and thereby the stator voltage is imposed by the grid.
The rotor windings voltage is controlled by a rotor-side converter and is used to perform
the machine control. Hence, in the normal operation, the stator voltage phasor sv
is a
rotating vector of the constant magnitude Vs that rotates at the synchronous speed ωs
tjss
seVv
(3.20)
From Fig.3.11, the stator voltage can be expressed as
1EiRv sss
(3.21)
Where spE
1 and p=d/dt. )( sstj
ss eIi
is the stator current phasor.

Chapter 3 Ride-through enhancement of DFIG based on series voltage compensation
56
Again, the rotor voltage can be also expressed as
rrrrrrr jijXiREv
1 (3.22)
Where Xr=ωs(Lls+Llr). rrj
is the rotating EMF. Herein we denote rrjEE
12 as
the rotor-side total EMF, which is shown in Fig.3.11.
For a high power generator, the stator resistance Rs is neglected and thereby the back
EMF spE
1 is directly equal to the grid voltage. Since the Lm is much larger than Lls
and Llr, the r
is nearly equal to s
due to the (3.1). Then the rotating EMF rrj
in
(3.22) can be simplified as
dtvjjj srsrrr
(3.23)
Then substituting sv
in (3.20) into (3.23), (3.23) can be rewritten as
stj
s
s
rrr vseVj s
)1(
(3.24)
Where s=(ωs-ωr)/ωs is the slip speed.
Due to (3.20)~(3.22), Figure 3.12 presents the phase diagram of the DFIG under normal
grid condition. Herein, the stator voltage phasor sv
is selected as the reference vector and
the wind speed is assumed to be constant at that moment. Consequently, the constant
wind power captured by the DFIG is considered. Based on the reference vector, the stator
current phasor si
can be determined when the steady-state power factor of DFIG is fixed.
The s is the power factor angle, as shown in Fig.3.12. Due to (3.21), the back EMF 1E
on the stator windings can be figured out. The magnetizing current mi
is always lagging
900 to the back EMF if the magnetizing resistance is neglected. According to KCL, the
rotor current phasor ri
can be obtained from the stator current phasor si
and the
magnetizing current phasor mi
. Finally, based on (3.22) and (3.23), the rotor voltage
phasor rv
can be determined as illustrated in Fig.3.12.

Chapter 3 Ride-through enhancement of DFIG based on series voltage compensation
57
vs
is
im
Rsis
E1
Rrir
Xrir
vr
ir
0
φs
E2
= sE1
1)1( Esj rr
Fig.3.12 Phase diagram of DFIG during normal operation
It can be seen from Fig.3.12 that the magnitude of rv
supplied by the rotor-side converter
is approximately proportional to the slip speed if the voltage drop on the rotor impedance
is neglected. For instance, the amplitude of the rotor voltage is only one fifth the stator
voltage if the slip speed is 0.2 pu. For high power generators, the voltage drop on the
stator resistor is quite small compared to the voltage on the PCC. Hence, it is acceptable
to neglect the resistance in the phasor diagram for simplicity.
3.4.2 Phasor diagram during grid fault condition
This section will analyze the operating behavior of the DFIG during a fault event. Three-
phase balance faults are concerned in this section. In practical systems, it is well-known
that the voltage drops on the PCC are determined by the grid fault condition and its
transmission characteristics. Consequently, when a fault occurred near the PCC, the
magnitude of voltage on the PCC is inevitable to drop significantly as well as the change
of the phase angle. In order to analyze the operating behavior of DFIG, the PCC voltage
during fault period is assumed to be vs,1 as illustrated in Fig.3.13. The subscript „1‟ means
the variables during fault periods.
From Fig.3.13, during the fault period, the stator voltage is dropt from the nominal value
vs to vs,1 with the phase angle shift φ1. Herein the stator resistance is neglected for
simplicity. Consequently the stator side electromotive force (EMF) E1 as shown in
Fig.3.11 is directly equal to the fault period PCC voltage vs,1. At the beginning of the fault,
the magnetizing current im is impossible to damp so quickly since large mutual inductance
itself. So the im is considered as the same at that moment. Thereby the rotor flux r
is still

Chapter 3 Ride-through enhancement of DFIG based on series voltage compensation
58
same as the pre-fault value. Hence the rotating EMF rrj
in the rotor still refers to the
pre-fault value as expressed in (3.23). Finally the rotor voltage phasor rv
can be figured
as shown in Fig.3.13. The rotor back EMF 2E
during fault periods is much larger than
that in the normal operation since the rotating EMF rrj
is still kept at the pre-fault
value.
Normally the rotor voltage is only a small fraction of the stator voltage, such as 0.3 pu.
But the rrj
is much larger than this value. Moreover, the rotor current phasor ri
can
also be determined by the rotor resistance and inductance as similar as Fig.3.11.
Considering the small leakage inductance Xr and rotor resistance Rr, the rotor current will
be much larger than the normal value, which is large enough to damage the rotor-side
converter. In addition, the stator current phasor si
can be obtained based on the rotor
current phasor and the magnetizing current phasor. The aforementioned procedure has
been presented in Fig.3.13.
vs
is
im
Rsis
E1
-(1-s)E1
sE1
Rrir
Xrir
vr
ir
0
vs,1
ir,1
Rrir,1
Xrir,1
is,1
E2
φ1
1)1( Esj rr
Fig.3.13 Phase diagram of DFIG during grid fault
From Fig.3.13, the rotating EMF rrj
in the rotor is the main source that makes the
DFIG difficult to ride through severe grid faults. As presented in (3.23), the
aforementioned rotating EMF is determined by the generator speed and the rotor flux.
Thus the rotor flux is decided by the magnetizing current. Due to the large mutual
inductance in the large power DFIG, the voltage on the mutual inductor can be
immediately changed, however, the current in the inductor does not change
instantaneously. This is the essential behavior of the DFIG while the grid fault happens.

Chapter 3 Ride-through enhancement of DFIG based on series voltage compensation
59
vs
vs,2
E1
E2
rrj
2E
rrj
rrj
vs,1
Figure 3.14 Simplified phase diagram of DFIG during a full voltage dip and a partial
voltage dip with the phase shift
The following part will address which kind of voltage drops that cause the worst
operation of the DFIG. Neglecting the resistance of DFIG, the phasor diagram during
normal grid condition can be simplified by the dot-lines in Fig.3.14 from Fig.3.13. When
the grid suffers a fault, the PCC voltage sv
is dropt to 1,sv
. The rotor total EMF 2E
is
increased from the normal value rrs jv
to rrs jv
1,, which is illustrated in Fig.3.14. If
vs,1 is equal to zero, the rotor voltage increment ΔE1 is equal to Vs, the pre-fault rotor
voltage. Currently the researchers are considering the vs,1 =0, as the worst operation of
DFIG.
Both the magnitude and phase angle of the stator voltage can be changed while a fault
happens. Normally the phase-angle jump on the PCC is determined by the X/R ratios of
the source and the fault path [98] while a fault happens near the PCC. As far as is known,
the phase-angle jump during fault period has not been paid attention in the investigation
of DFIG ride-through. For instance, if the fault stator voltage is illustrated as vs,2 in
Fig.3.14, where is the phase-angle shift. It can be found that the phase-angle jump also
contribute to the rotor voltage increment ΔE2,
cos2 222
22 ssss VVVVE (3.25)
From (3.25), when )2(cos 21
ss VV , the ΔE2 is larger than the ΔE1, and thereby the
phase-angle jump will cause a larger rotor current than that caused by the full voltage dip.
Figure 3.15 illustrates the rotor current response considering the magnitude of the stator
voltage together with the angle-jump. Although the amplitude of the stator voltage has not
been reduced to zero, the phase-angle jump of the stator voltage can also result in the
even worse overcurrent in the rotor than that in the condition of the full voltage dip.

Chapter 3 Ride-through enhancement of DFIG based on series voltage compensation
60
-90-60
-300
3060
90
00.2
0.40.6
0.81
0
1
2
3
4
5
6
Thetas (degree)
|Vs| (p.u)
|Ir| (
p.u
)
0.5
1
1.5
2
2.5
3
3.5
4
4.5
5
Fig.3.15 The magnitude and angle-jump of stator voltage impact on the rotor current
3.4.3 Key factors on the DFIG fault operation
This section will address the key factors which significantly contribute on the over-
current/voltage in the rotor. The factors can be separated in terms of the stator and rotor
circuit, respectively.
⑴ The stator resistance/ braking resistance
From Fig.3.11, the E1 will not be equal to the stator voltage if the voltage drop across the
stator resistance is large enough. Therefore, at the fault instant, the E1 is not reduced so
largely to affect the electrical behavior of the rotor circuit. Normally the stator resistance
is quite small, especially in high power application. Hence, an additional stator braking
resistance can be inserted in the stator circuit during the fault period to enhance the ride-
through capability of the generator.
⑵ The rotor resistance / crowbar
From the viewpoint of rotor circuit, the overvoltage is mainly caused by the rotating EMF
rrj
. The rotor speed can be considered as a constant at the fault instant. The rotor flux
r
is also kept at the same value because of the larger mutual inductance Lm. In order to
balance the rrj
, an additional rotor resistance is usually involved. This is the so-call

Chapter 3 Ride-through enhancement of DFIG based on series voltage compensation
61
crowbar method. The additional resistance is used to limit the rotor current in order to
avoid the overcurrent in the rotor. However, the additional resistance should not be too
large to further increase the terminal voltage of the rotor-side converter.
⑶ Demagnetizing current concept
The rotor flux should be damping immediately in order to avoid the overvoltage in the
rotor. Hence, a demagnetizing current can be generated by the rotor-side converter in
order to damp the rotor flux as fast as possible, and thereby partly enhance the ride-
through capability of the DFIG.
3.4.4 Advantages and disadvantages of DFIG
Section 2.4 has reviewed the characteristics of the main types of wind turbine generators,
and the advantages of DFIG based wind turbine can be listed as:
1. Partial power rating electronics converter: The employed power electronics
converter is only required to deal with the slip power of DFIG. Hence, the cost
of the converter/inverter can be significantly reduced. Typically the converter
rating is 20~30% of the total power rating of the system.
2. Variable speed operation: Compared to the fixed speed wind turbines, the
variable speed operation makes DFIG wind turbine possible to maximize
power point tracking of wind power under different wind profiles, which in
turn, improve the utilization of wind turbine.
3. Flexible power factor control: Power factor control can be implemented at
lower cost because the DFIG system (four-quadrant converter and induction
machine) basically operates similar to a synchronous generator. The rotor
converter has to provide only excitation energy/power.
4. Decoupled control of active and reactive power: compared to silicon-
controlled rectifier, the DFIG with a four-quadrant converter in the rotor
circuit enables decoupled control of active and reactive power of the generator.

Chapter 3 Ride-through enhancement of DFIG based on series voltage compensation
62
Besides the aforesaid advantages of DFIG wind turbine, there are still several limitations
of DFIG wind turbine in terms of its poor fault ride-through ability, mechanical
commutators and wearable brushes (regular maintenance required), bulky mechanical
gearbox for speed coordination, and so on.
To address the poor ride-through ability, a series compensated solution for DFIG ride-
through enhancement will be studied in the following sections.
3.5 General control principle of the series compensator
In order to eliminate the transient variants of the stator voltage caused by the step-down
PCC voltage during grid faults, the series voltage compensation architecture shown in
Fig.3.10 is desired to inject an appropriate scv
in the face of an up-stream voltage
disturbance. The following section will study how to command the injected voltage scv
.
During the normal grid voltage, the series compensator is held in an idle state to keep the
losses to a minimum. The SW1 (shown in Fig.3.10) is always kept ON to bypass the
series compensation system. Once any voltage sag is detected the series compensator
switches into active state to operate as fast as possible and inject the required AC voltage
to the PCC.
Herein the main considerations for the control of the series compensator are consisted of
real-time determination of the start and end of series compensation, voltage reference
generation.
3.5.1 Voltage sag detection
The accuracy of the voltage sag detection significantly impact on the operating
performance of the series compensator. Due to power quality enhancement for sensitive
load application, the voltage sag detection method used is based on the root mean square
(rms) value of the error vector, which allows for detection of symmetrical and

Chapter 3 Ride-through enhancement of DFIG based on series voltage compensation
63
asymmetrical sags, as well as the associated phase jump [99]. Hence, the detection
formula for starting the series compensation is given by
Thresholdpccerror Vv ,
(3.26)
Here, the rms value of the voltage vector error on the PCC is
pccplypccrefpccerror vvv ,sup,,
(3.27)
Where VThreshold is the maximum voltage error allowed on the PCC, where the wind
turbine can still ride through by itself. Herein, pccrefv ,
is the nominal PCC voltage and
pccplyv ,sup
is the real-time measured PCC voltage. The pccrefv ,
is equal to the pccplyv ,sup
before faults happen.
From (3.26), while the VThreshold is chosen as 0, the series compensator is immediately
turned on when any slight sags happen. However, the wind turbine is not exactly like a
sensitive power load. It is unnecessary to compensate the stator terminal voltage back to
the pre-fault value when PCC voltage suffers slight sag. This is because the rotor-side
converter usually has some amount of power margin for overcurrent/overvoltage
operation. Hence, we will investigate how to select the appropriate VThreshold in the
following paragraphs.
In the conventional DFIG wind turbine, the rotor-side converter usually employs the
IGBT as the semiconductor switching device. Its continuous current rating is determined
by the steady-state load, while the overload capability could be exploited during transient.
In theory, the maximum current switched by the device can be the peak pulse rating, as
long as the junction temperature reached in the IGBT is permissible and the V-I switching
trajectory is within the safe operating area (SOA). The pulse current rating of an IGBT is
typically 100% higher than the continuous current rating. Therefore, the control objective
of this study is to constrain the instantaneous rotor current below Ir,max, which is the
maximum allowed rotor current by the device‟s rating.
Herein, the PCC voltage vpcc,0 is changed to vpcc,1 after suffering a grid fault and thereby
the stator terminal voltage is also changed from vpcc,0 to vpcc,1. Therefore, the pre-fault

Chapter 3 Ride-through enhancement of DFIG based on series voltage compensation
64
stator and rotor voltage equations of (3.21) and (3.22) are rewritten after ignoring the
stator resistance as
0,10, Ev pcc
(3.28)
And rrrrrrr jijXiREv
0,0,0,10, (3.29)
The stator and rotor voltages during the fault period can be expressed as
1,11, Evpcc
(3.30)
And rrrrrrr jijXiREv
1,1,1,11, (3.31)
Where, the subscript 0 and 1 in (3.28) ~ (3.31) depict the pre-fault and fault values,
respectively. The rotating EMF rrj
of rotor circuit can be considered as constant
during fault occurrence as shown in (3.23).
Substituting rrj
from (3.23) into (3.29) and (6.31), then
0,0,0, )( pccrrrr vsijXRv (3.32)
0,1,1,1, )1()( pccrrrpccr vsijXRvv
(3.33)
Considering the rotor voltage generated by the converter as same during fault period, then
the pre-fault and fault rotor currents can be derived as,
))(( 0,1,1,0, rrrrpccpcc iijXRvv
(3.34)
Compared to the Xr, the Rr can be neglected, and the (3.34) can be simplified as
)( 0,1,1,0, rrrpccpcc iijXvv
(3.35)
Herein the voltage and current phasors in the pre-fault and fault condition are
crrvpccpcc
rrpcc
IiVvFault
Iivfaulte
max,1,11,
000,0
0,
,:
,01:Pr
(3.36)

Chapter 3 Ride-through enhancement of DFIG based on series voltage compensation
65
Where, 00, 01pccv
is set as the reference phasor, 0 can be arbitrary value from 0 to 2π.
]2,0[ v is the phase angle of the fault PCC voltage.
c is also arbitrary value from 0 to
2π.
is
im
-(1-s)E1
sE1
vr
0
Voltage drop
boundary
Vpcc,1
Maximum
Boundary
Initial rotor
current
boundary
ir,max
ir,0
Vpcc,0
v
c0
Fig.3.16 Determination of the maximum allowed voltage drop on the PCC under the
maximum rotor current Ir,max
Substituting (3.36) into (3.35), the boundary of the maximum allowed voltage drop on the
PCC can be constructed with the maximum rotor current Ir,max. Figure 3.16 illustrates the
phasor diagram of PCC voltage and rotor current under this situation. From Fig.3.16, if
the rotor current reached the boundary of the limitation, Ir,max, the stator voltage is then
changed from vpcc,0 to vpcc,1 due to (3.35). Herein the vpcc,1 is the maximum allowed
voltage drop on the PCC. With the different c , we can plot the boundary of the
maximum allowed voltage drop on the PCC as shown in Fig.3.16. Hence, if the fault PCC
voltage is at the right-side of the aforementioned boundary (the shadow area), the rotor
current will never exceed the maximum current limitation Ir,max.
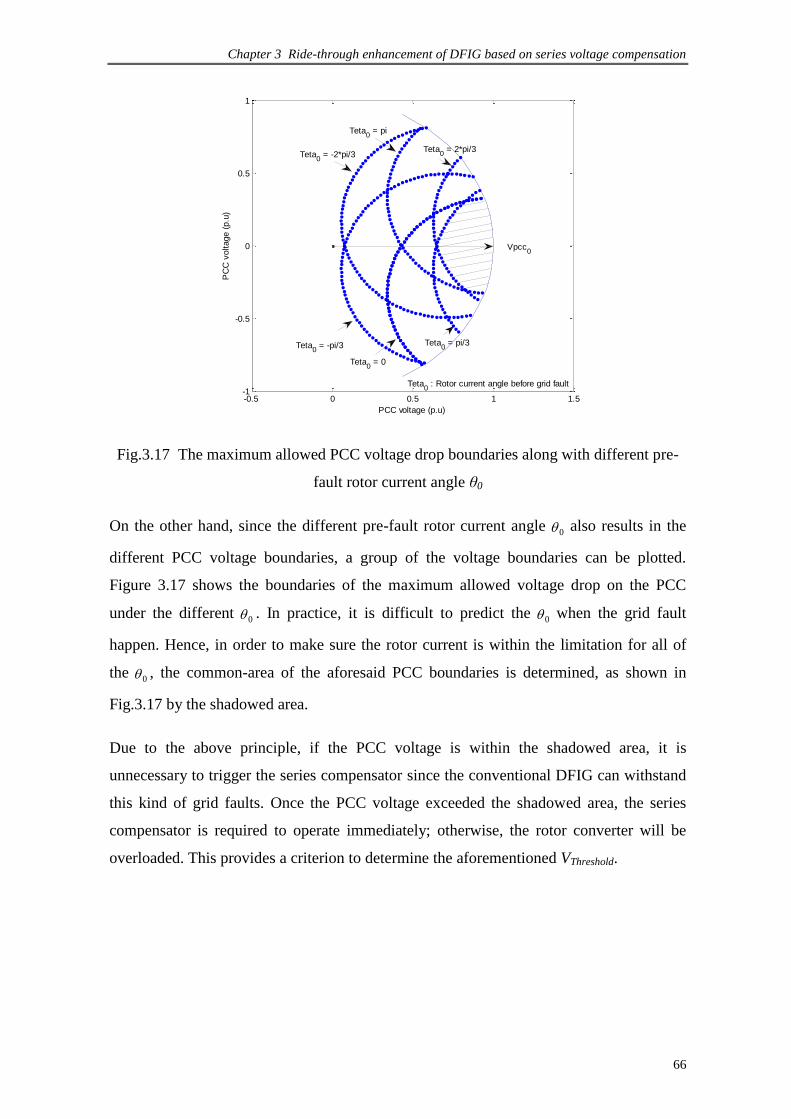
Chapter 3 Ride-through enhancement of DFIG based on series voltage compensation
66
-0.5 0 0.5 1 1.5-1
-0.5
0
0.5
1
PCC voltage (p.u)
PC
C v
oltage (
p.u
)
Teta0 = pi
Teta0 = -2*pi/3
Teta0 = 2*pi/3
Teta0 = -pi/3
Teta0 = 0
Teta0 = pi/3
Vpcc0
Teta0 : Rotor current angle before grid fault
Fig.3.17 The maximum allowed PCC voltage drop boundaries along with different pre-
fault rotor current angle θ0
On the other hand, since the different pre-fault rotor current angle 0 also results in the
different PCC voltage boundaries, a group of the voltage boundaries can be plotted.
Figure 3.17 shows the boundaries of the maximum allowed voltage drop on the PCC
under the different 0 . In practice, it is difficult to predict the
0 when the grid fault
happen. Hence, in order to make sure the rotor current is within the limitation for all of
the 0 , the common-area of the aforesaid PCC boundaries is determined, as shown in
Fig.3.17 by the shadowed area.
Due to the above principle, if the PCC voltage is within the shadowed area, it is
unnecessary to trigger the series compensator since the conventional DFIG can withstand
this kind of grid faults. Once the PCC voltage exceeded the shadowed area, the series
compensator is required to operate immediately; otherwise, the rotor converter will be
overloaded. This provides a criterion to determine the aforementioned VThreshold.

Chapter 3 Ride-through enhancement of DFIG based on series voltage compensation
67
3.5.2 Reference voltage generation for series compensator
Vpcc,0
is
im
Rsis
E1
-(1-s)E1
sE1
Rrir
Xrir
vr
ir
0
vpcc,1
vsc
φ1
Fig.3.18 Phase diagram of series voltage compensation under grid faults
Once the (3.26) is satisfied, the series compensator is kicked into function. In ideal
operation, the series compensator is desired to fully balance the voltage deviation on the
PCC in order to maintain the voltage on the stator as the pre-fault value. Figure 3.18
presents the phasor diagram of this operation. The other variables in the phasor diagram
can still stay at the same place as the pre-sag occasion. The pre-fault voltage on the PCC
is vpcc,0, and the fault voltage is vpcc,1. The reference of the series compensator is the
voltage difference between vpcc,0 and vpcc,1 if we assume the ideal series transformer with
1:1 ratio.
0
0.5
1 -30
-20
-10
0
10
20
30
0
0.5
1
Tetav (degree)
|Vpcc,1
|
|Vsc|
0
0.1
0.2
0.3
0.4
0.5
0.6
0.7
0.8
0.9
1
-30
-20
-10
0
10
20
30
0
0.5
1
0
0.5
1
Tetav (degree)
|Vpcc,1
|
|Vsc|
0
0.1
0.2
0.3
0.4
0.5
0.6
0.7
0.8
0.9
1
(a) Ir,max=1 pu (b) Ir,max=2 pu
Fig.3.19 The series voltage Vsc related to fault PCC voltages Vpcc under different rotor
current limitation

Chapter 3 Ride-through enhancement of DFIG based on series voltage compensation
68
Consequently, the voltage rating of the series compensator under different rotor current
limitations Ir,max can be plotted, as illustrated in Fig.3.19. It can be seen that the large PCC
voltage drop is required to inject a high voltage from the series compensator. However,
the series compensator is unnecessary to switch in and out frequently with the larger rotor
current limitation as shown in Fig.3.19(b). In practice, the slight sag will have a relatively
larger possibility to occur than the more severe sags. The appropriate selection for turning
on and off the series compensation is important for the overall system performance.
3.5.3 Advantages and Disadvantages of DFIG-Series compensator
The main purpose of series compensator is to help DFIG ride-through grid faults and
thereby enhance the ride-through ability of DFIG based wind turbine. A summary of the
characteristics of the series compensated DFIG is listed as below:
1. The series compensator is desired to compensate the voltage sag or swell of grid
utility and thereby maintain the DFIG stator terminal voltage as normal under
such fault conditions, which in turn, avoid the overcurrent phenomenon in the
rotor circuit of DFIG. The significant advantage of the series compensated DFIG
is able to protect the rotor-side partial power rating converter, which is easy to
be damaged in the conventional DFIG system during severe grid faults.
2. In theory, the series compensated DFIG is potential to deal with any kinds of
grid faults, such as symmetrical and unsymmetrical faults. Herein, the
symmetrical fault condition will be studied in the thesis.
Besides the aforementioned advantages, the cost of the series compensator is the main
challenge of the series compensated DFIG system. Normally, the series compensator is
required to deal with active power as well as reactive power delivery, which is determined
by the stator current phasor and sag voltage phasor on the PCC. The large active power
current requires the series compensator has a large energy storage capacity, which in turn,
results in the bulky volume of energy storage devices as well as high cost of the series
compensator. To overcome the aforesaid constraint, an improved control scheme for the
series compensator will be analyzed in the next section.

Chapter 3 Ride-through enhancement of DFIG based on series voltage compensation
69
3.6 Improved ride-through control of DFIG-Series compensator
Based on the aforementioned analysis in section 3.5, the ideal solution for the DFIG
based wind turbine during a voltage dip would be a system that isolates the wind turbine
from the voltage dip. The series compensator can provide this kind of function. However,
the main drawback of the series compensator application is its high cost, compared to the
crowbar protection. Moreover, the longer the voltage dip is, the larger the compensator
energy storage capacity is required. Therefore, it will even increase the cost of the whole
system. All of these inspire to seek solutions to reduce the capacity of the series
compensator. In this section, a potential solution is introduced to reduce the energy
capacity of the series compensator.
The previous section contributes to analyze the voltage rating of the series compensator.
The energy capacity of the series compensator will be analyzed in this section. The DFIG
rotor current response related to the stator voltage is introduced in [100] as,
ds
m
ss
sss
s
m
dr iL
Lv
sLRsLi
22 )(2
1
(3.37)
qs
m
ss
sss
ss
m
qr iL
Lv
sLRs
LRs
Li
22 )(2
1
(3.38)
Where dri and qri are the rotor-side d- and q-axis components in the synchronous frame,
respectively.
According to (3.37) and (3.38), the transfer function between the rotor current and the
stator voltage can be considered as a second-order model. While the generator suffered a
grid fault, it seems the system occur a step-function input. Under the step-function of
stator voltage, there is a significant oscillation on the rotor current response since the
system damping coefficient, )( sss LR is nearly zero. With inverse Laplace transform
and sss LR , the time-domain rotor current response under grid fault can be
described as,

Chapter 3 Ride-through enhancement of DFIG based on series voltage compensation
70
))(cos(1)( 0ttL
kV
L
Vti s
ms
s
ms
sdr
(3.39)
)](sin[)( 0ttL
kVti s
ms
sqr
(3.40)
Where, k is the voltage drop severity. The detailed derivation of (3.39) and (3.40) are
presented in Appendix A.
The system response caused by linear ramp-function is usually smaller than that caused
by step-function. This inspires to change the stator voltage from the step-function to
ramp-function by injecting a ramp voltage from the series compensator. Hence, the
improved control scheme for the series compensator can be arranged as follow.
It is assumed that the DFIG is operating at the normal grid voltage pccfaultprev ,
until a
fault happen at time t0, and the PCC voltage pccfaultv ,
during fault is returned to the
normal value pccfaultpostv ,
at time t1 after fault is removed. The pccfaultpostv ,
may be not
same as the pccfaultprev ,
since the network topology can be changed after fault clearance.
Consequently, as fast as the detection of the voltage drop on the PCC is beyond the limit
in (3.26), we apply a voltage vector of the series compensator as,
],[)(1)(
],[0
000,
00
TtttTttvv
Ttttv
pccfaultpccfaultpresc
(3.41)
And
],[)(1)(
],[0
111,
11
TtttTttvv
Ttttv
pccfaultpostpccfaultsc (3.42)
Where, T is the operating duration of the series compensator after detecting a grid fault.
By compensating the voltage as expressed in (3.41) and (3.42), the stator voltage can be
smoothed without any step-changes in terms of the amplitude and angle while the PCC
voltage suffers a step change by the severe fault. In other words, the ramp-function
voltage generated by the series compensator makes the stator voltage of DFIG as a ramp-

Chapter 3 Ride-through enhancement of DFIG based on series voltage compensation
71
function. The following paragraphs will explain how to select the T .
When the voltage in (3.41) and (3.42) is injected, the DFIG stator terminal voltage is a
ramp-function during grid fault. Thereby the rotor current response is calculated based on
the inverse Laplace transformation,
))(sin(
1)( 0
0 ttTT
tt
L
kV
L
Vti s
sms
s
ms
sdr
(3.43)
))(cos(11
)( 0ttTL
kVti s
sms
sqr
(3.44)
The detailed derivation of (3.43) and (3.44) has been presented in Appendix A as well. In
order to make (3.43) and (3.44) smaller than (3.39) and (3.40) respectively, the constraint
are sT 1 and sT 2 . Hence, the T is better to choose as
s
T
2 (3.45)
From (3.45), the T is chosen as several cycles of the system frequency, which aims to
limit the rotor current oscillation during fault periods. The larger T is, the smaller the
rotor current oscillation will be. However, the large T will result in large energy
capacity of the series compensator, since the DC-link capacity of the series compensator
can be calculated by
dtivVCE s
Tt
tsc
0
0
2
2
1 (3.46)
Where V is the maximum allowable voltage variation of the DC-link capacitor of the
series compensator. C is the related capacitance. From (3.46), while the ssc iv is positive,
the series compensator will absorb power to charge the DC-link capacitor. Otherwise, the
capacitor will be discharged to provide the network real power. On the other hand, the
size of the capacitor can be reduced by shorting the T while the ssc iv is fixed.
However, the determination of the T has been presented in (3.45).
Due to the series compensation concept, the original controller of the rotor-side converter

Chapter 3 Ride-through enhancement of DFIG based on series voltage compensation
72
can still work without any damage during the fault period. The reactive power generated
by the stator windings and the grid-side converter is still under control, which is helpful to
recover the PCC voltage. This is unavailable with the crowbar solution. Hence the
proposed architecture can provide a better characteristic to satisfy with the latest grid
requirements.
3.7 Simulation results for DFIG
A detailed computer simulation of the DFIG based wind generation system is carried out
in Matlab/Simulink as well as the ride-through demonstration of the proposed series
compensator concept. Table 3.1 presents a list of numerical values of DFIG parameters,
which is used in the simulation. The system operating waveforms from the simulations
are presented in this section.
Table 3.1 DFIG parameters
Items Value
Rated power 1.5 MW
Rated frequency 50 Hz
Stator voltage 575 V
Stator resistance 0.007 p.u
Rotor resistance 0.005 p.u
Mutual inductance 2.9 p.u
Stator leakage inductance 0.17 p.u
Rotor leakage inductance 0.16 p.u
Number of pole pairs 3
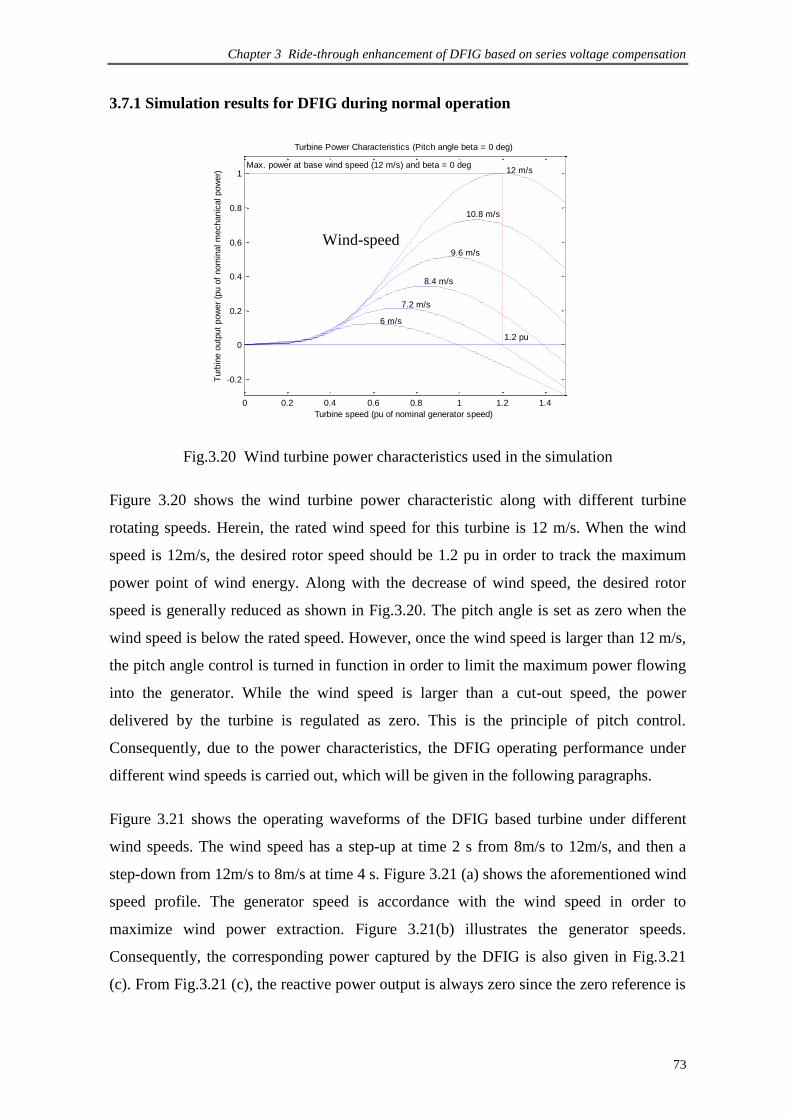
Chapter 3 Ride-through enhancement of DFIG based on series voltage compensation
73
3.7.1 Simulation results for DFIG during normal operation
0 0.2 0.4 0.6 0.8 1 1.2 1.4
-0.2
0
0.2
0.4
0.6
0.8
1
1.2 pu
Max. power at base wind speed (12 m/s) and beta = 0 deg
6 m/s
7.2 m/s
8.4 m/s
9.6 m/s
10.8 m/s
12 m/s
Turbine speed (pu of nominal generator speed)
Turb
ine o
utp
ut
pow
er
(pu o
f nom
inal m
echanic
al pow
er)
Turbine Power Characteristics (Pitch angle beta = 0 deg)
Fig.3.20 Wind turbine power characteristics used in the simulation
Figure 3.20 shows the wind turbine power characteristic along with different turbine
rotating speeds. Herein, the rated wind speed for this turbine is 12 m/s. When the wind
speed is 12m/s, the desired rotor speed should be 1.2 pu in order to track the maximum
power point of wind energy. Along with the decrease of wind speed, the desired rotor
speed is generally reduced as shown in Fig.3.20. The pitch angle is set as zero when the
wind speed is below the rated speed. However, once the wind speed is larger than 12 m/s,
the pitch angle control is turned in function in order to limit the maximum power flowing
into the generator. While the wind speed is larger than a cut-out speed, the power
delivered by the turbine is regulated as zero. This is the principle of pitch control.
Consequently, due to the power characteristics, the DFIG operating performance under
different wind speeds is carried out, which will be given in the following paragraphs.
Figure 3.21 shows the operating waveforms of the DFIG based turbine under different
wind speeds. The wind speed has a step-up at time 2 s from 8m/s to 12m/s, and then a
step-down from 12m/s to 8m/s at time 4 s. Figure 3.21 (a) shows the aforementioned wind
speed profile. The generator speed is accordance with the wind speed in order to
maximize wind power extraction. Figure 3.21(b) illustrates the generator speeds.
Consequently, the corresponding power captured by the DFIG is also given in Fig.3.21
(c). From Fig.3.21 (c), the reactive power output is always zero since the zero reference is
Wind-speed
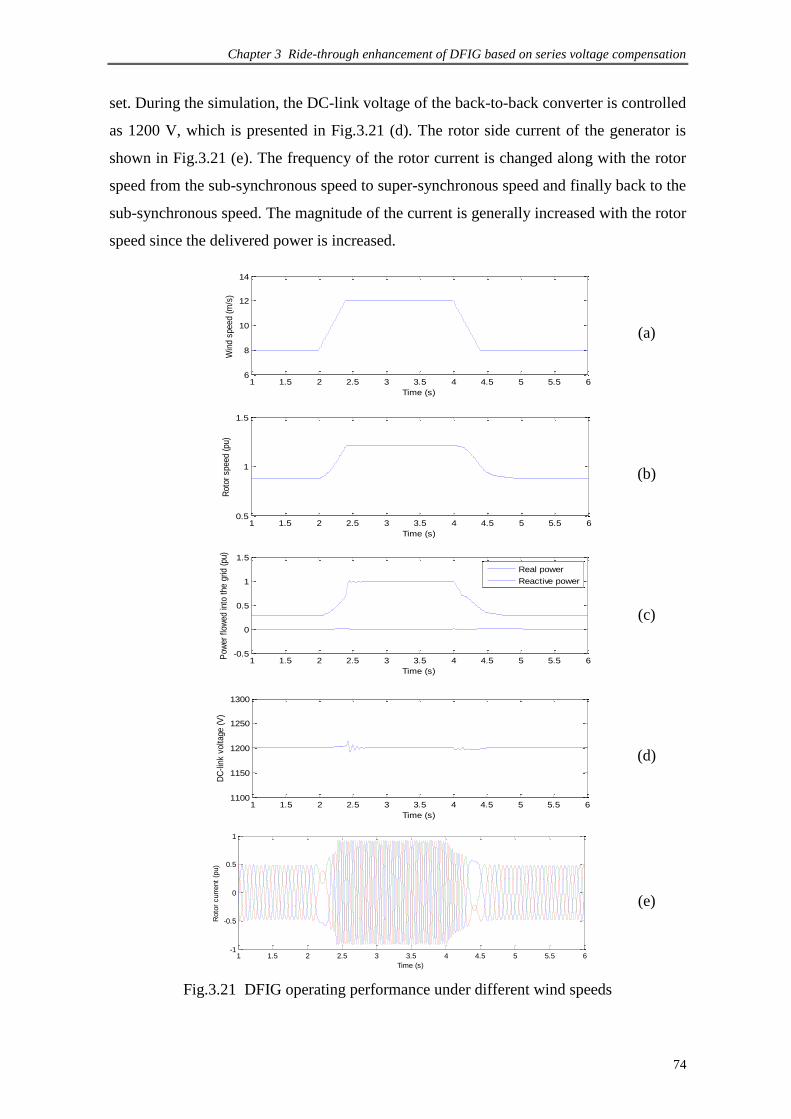
Chapter 3 Ride-through enhancement of DFIG based on series voltage compensation
74
set. During the simulation, the DC-link voltage of the back-to-back converter is controlled
as 1200 V, which is presented in Fig.3.21 (d). The rotor side current of the generator is
shown in Fig.3.21 (e). The frequency of the rotor current is changed along with the rotor
speed from the sub-synchronous speed to super-synchronous speed and finally back to the
sub-synchronous speed. The magnitude of the current is generally increased with the rotor
speed since the delivered power is increased.
1 1.5 2 2.5 3 3.5 4 4.5 5 5.5 66
8
10
12
14
Time (s)
Win
d s
peed (
m/s
)
(a)
1 1.5 2 2.5 3 3.5 4 4.5 5 5.5 60.5
1
1.5
Time (s)
Roto
r speed (
pu)
(b)
1 1.5 2 2.5 3 3.5 4 4.5 5 5.5 6-0.5
0
0.5
1
1.5
Time (s)
Pow
er
flow
ed in
to t
he g
rid (
pu)
Real power
Reactive power
(c)
1 1.5 2 2.5 3 3.5 4 4.5 5 5.5 61100
1150
1200
1250
1300
Time (s)
DC
-lin
k v
oltage (
V)
(d)
1 1.5 2 2.5 3 3.5 4 4.5 5 5.5 6
-1
-0.5
0
0.5
1
Time (s)
Roto
r curr
ent
(pu)
(e)
Fig.3.21 DFIG operating performance under different wind speeds
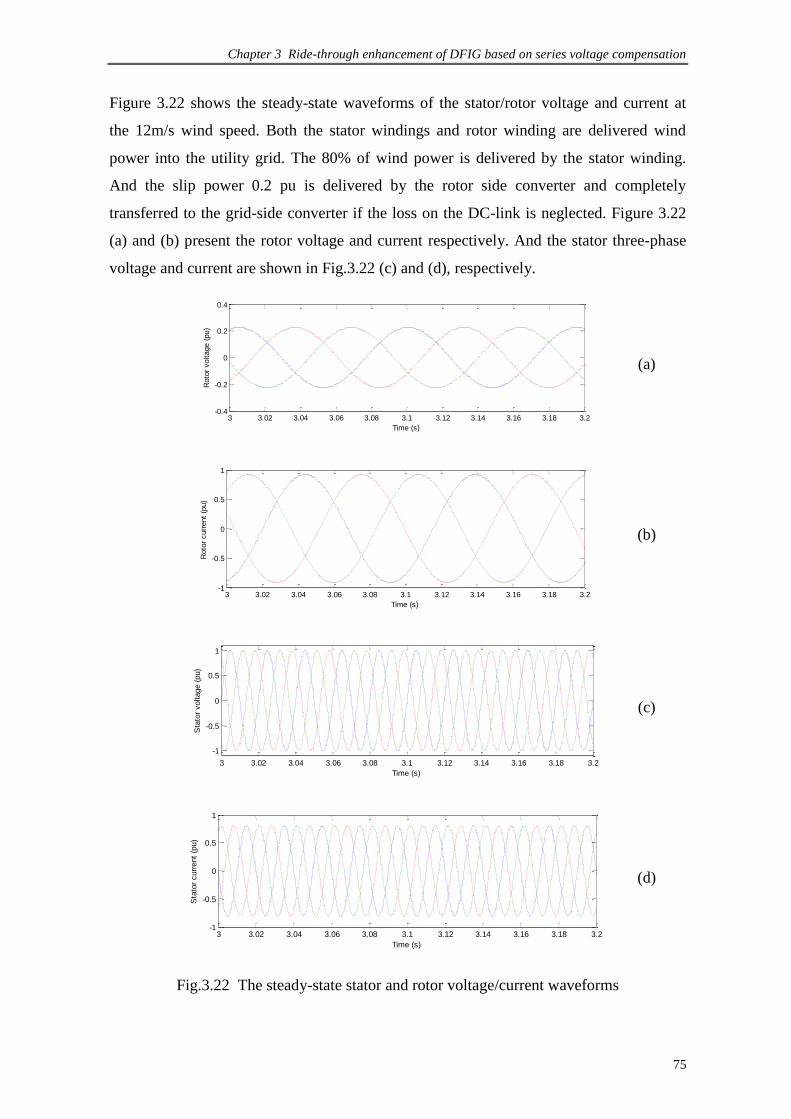
Chapter 3 Ride-through enhancement of DFIG based on series voltage compensation
75
Figure 3.22 shows the steady-state waveforms of the stator/rotor voltage and current at
the 12m/s wind speed. Both the stator windings and rotor winding are delivered wind
power into the utility grid. The 80% of wind power is delivered by the stator winding.
And the slip power 0.2 pu is delivered by the rotor side converter and completely
transferred to the grid-side converter if the loss on the DC-link is neglected. Figure 3.22
(a) and (b) present the rotor voltage and current respectively. And the stator three-phase
voltage and current are shown in Fig.3.22 (c) and (d), respectively.
3 3.02 3.04 3.06 3.08 3.1 3.12 3.14 3.16 3.18 3.2-0.4
-0.2
0
0.2
0.4
Time (s)
Roto
r voltage (
pu)
(a)
3 3.02 3.04 3.06 3.08 3.1 3.12 3.14 3.16 3.18 3.2-1
-0.5
0
0.5
1
Time (s)
Roto
r curr
ent
(pu)
(b)
3 3.02 3.04 3.06 3.08 3.1 3.12 3.14 3.16 3.18 3.2
-1
-0.5
0
0.5
1
Time (s)
Sta
tor
voltage (
pu)
(c)
3 3.02 3.04 3.06 3.08 3.1 3.12 3.14 3.16 3.18 3.2-1
-0.5
0
0.5
1
Time (s)
Sta
tor
curr
ent
(pu)
(d)
Fig.3.22 The steady-state stator and rotor voltage/current waveforms
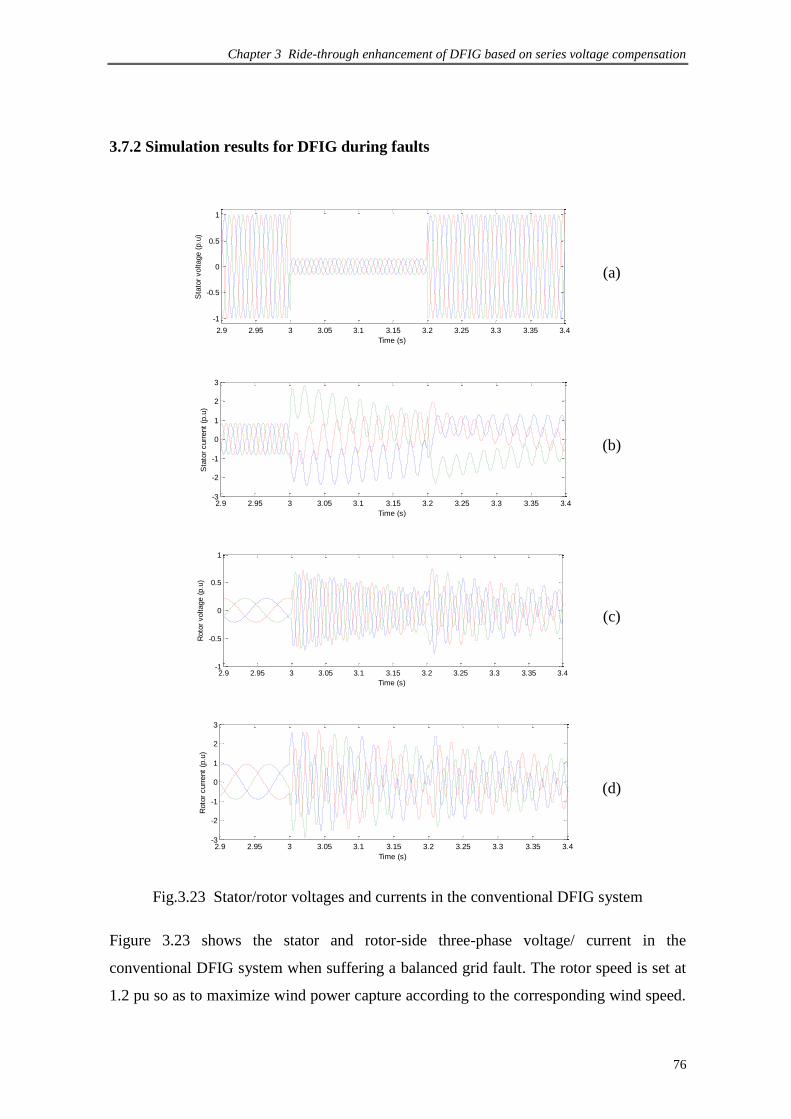
Chapter 3 Ride-through enhancement of DFIG based on series voltage compensation
76
3.7.2 Simulation results for DFIG during faults
2.9 2.95 3 3.05 3.1 3.15 3.2 3.25 3.3 3.35 3.4
-1
-0.5
0
0.5
1
Time (s)
Sta
tor
voltage (
p.u
)
(a)
2.9 2.95 3 3.05 3.1 3.15 3.2 3.25 3.3 3.35 3.4-3
-2
-1
0
1
2
3
Time (s)
Sta
tor
curr
ent
(p.u
)
(b)
2.9 2.95 3 3.05 3.1 3.15 3.2 3.25 3.3 3.35 3.4-1
-0.5
0
0.5
1
Time (s)
Roto
r voltage (
p.u
)
(c)
2.9 2.95 3 3.05 3.1 3.15 3.2 3.25 3.3 3.35 3.4-3
-2
-1
0
1
2
3
Time (s)
Roto
r curr
ent
(p.u
)
(d)
Fig.3.23 Stator/rotor voltages and currents in the conventional DFIG system
Figure 3.23 shows the stator and rotor-side three-phase voltage/ current in the
conventional DFIG system when suffering a balanced grid fault. The rotor speed is set at
1.2 pu so as to maximize wind power capture according to the corresponding wind speed.

Chapter 3 Ride-through enhancement of DFIG based on series voltage compensation
77
At time 3 to 3.2 s, the DFIG suffers a grid fault, which results in 85% voltage drop and no
phase shift on the stator-side PCC. From Fig.3.23, the transient maximum currents of the
stator and rotor windings appeared at the moment of voltage changes. At that time, the
rotor current suffers a severe overcurrent, which is up to 3 times larger than the nominal
value. It can be seen from Fig.3.23(c) that the rotor voltage is larger than the rated value,
which is normally 0.3 pu. Hence, the rotor-side converter will be damaged if the stator
voltage suffers this severe fault, however, the operator demands the DFIG should have the
ability to ride through this kind of grid faults.
-0.2 -0.1 0 0.1 0.20
0.2
0.4
0.6
0.8
1
Slip speed (p.u)
Sta
tor
voltage (
p.u
)
Fig.3.24 Feasible ride-through region of the conventional DFIG system under three-
phase balanced fault
As mentioned in Section 3.6, the rotor-side converter is able to afford the transient current
up to 2 pu since the semiconductor device characteristics. Herein, we assume the
maximum rotor current limit is set as 2 p.u , applied in the following simulation.
Figure 3.24 shows the maximum allowed voltage drop on the PCC under three-phase
balanced fault, where the rotor current is not beyond the limitation. The phase shift of the
PCC voltage is set as zero. From Fig.3.24, the stator voltage of the original DFIG system
is allowed to drop to as low as 0.5 p.u, and the rotor current does not exceed the limitation
of 2 p.u. In addition, the larger generator speed is, the lower voltage drop is allowed. For
instance, if the slip speed is -0.2, the maximum voltage drop is 0.5 p.u (1-0.5=0.5p.u), in
order to make the rotor-side current within the limitation. Once the voltage drop is larger
than this value, the rotor current will exceed the 2 p.u limitation immediately.
It can be found from Fig.3.24 that the serious condition of ride-through is occurred at the
maximum slip speed. This is accordant to the analysis in Section 3.5. So this condition of
the maximum slip speed is chosen to analyze the ride-through performance affected by
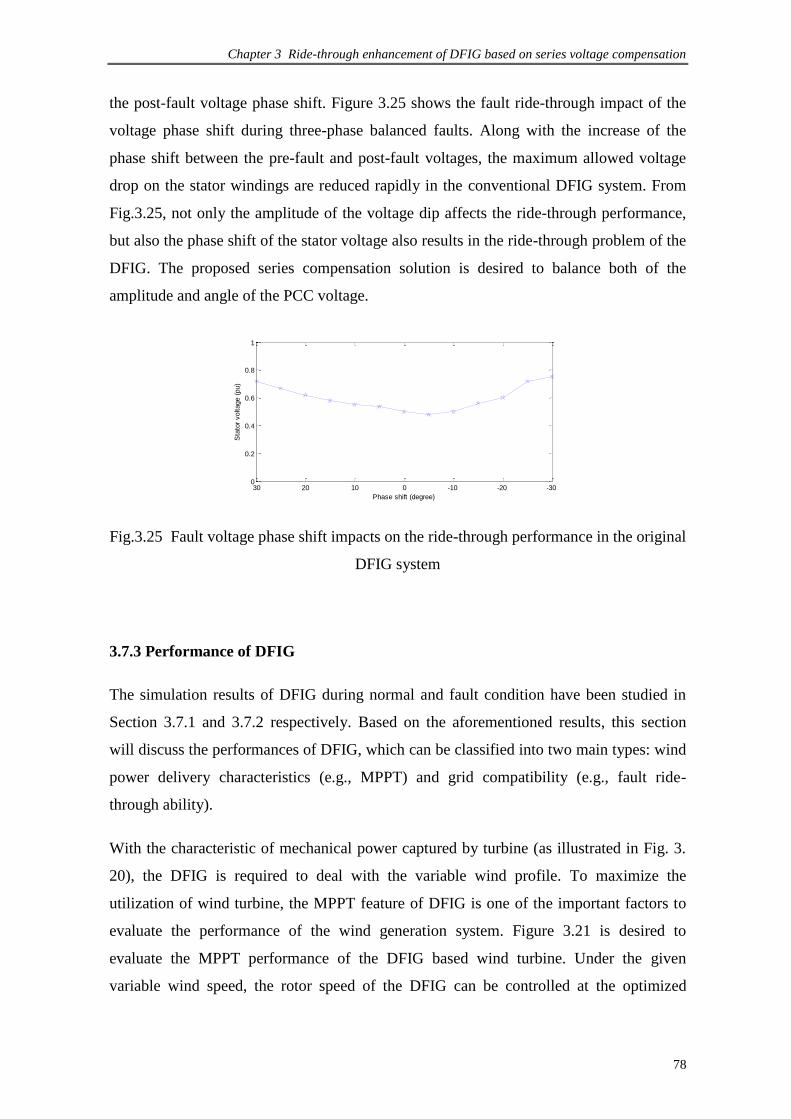
Chapter 3 Ride-through enhancement of DFIG based on series voltage compensation
78
the post-fault voltage phase shift. Figure 3.25 shows the fault ride-through impact of the
voltage phase shift during three-phase balanced faults. Along with the increase of the
phase shift between the pre-fault and post-fault voltages, the maximum allowed voltage
drop on the stator windings are reduced rapidly in the conventional DFIG system. From
Fig.3.25, not only the amplitude of the voltage dip affects the ride-through performance,
but also the phase shift of the stator voltage also results in the ride-through problem of the
DFIG. The proposed series compensation solution is desired to balance both of the
amplitude and angle of the PCC voltage.
-30-20-1001020300
0.2
0.4
0.6
0.8
1
Phase shift (degree)
Sta
tor
voltage (
pu)
Fig.3.25 Fault voltage phase shift impacts on the ride-through performance in the original
DFIG system
3.7.3 Performance of DFIG
The simulation results of DFIG during normal and fault condition have been studied in
Section 3.7.1 and 3.7.2 respectively. Based on the aforementioned results, this section
will discuss the performances of DFIG, which can be classified into two main types: wind
power delivery characteristics (e.g., MPPT) and grid compatibility (e.g., fault ride-
through ability).
With the characteristic of mechanical power captured by turbine (as illustrated in Fig. 3.
20), the DFIG is required to deal with the variable wind profile. To maximize the
utilization of wind turbine, the MPPT feature of DFIG is one of the important factors to
evaluate the performance of the wind generation system. Figure 3.21 is desired to
evaluate the MPPT performance of the DFIG based wind turbine. Under the given
variable wind speed, the rotor speed of the DFIG can be controlled at the optimized

Chapter 3 Ride-through enhancement of DFIG based on series voltage compensation
79
reference speed, and thereby make DFIG tracking the maximum power point of wind
power.
On the other hand, it is better to extinguish the operating performance of DFIG during
fault conditions before the enhancement is involved. The essential behaviors of DFIG
under grid fault condition have been shown in Fig.3.23. It can be seen that the current in
the rotor would be nearly 3 time of that in the normal operation when suffering the
assumed fault mentioned in Section 3.7.2. Hence, the rotor-side converter will be
damaged under the assumed fault if no any protection is provided. The simulation of the
serried compensated DFIG will be carried out in the next section, and the simulation
results in Fig.3.23 can be used as the comparison criterion for the developed series
compensated DFIG.
3.8 Simulation results for series compensated DFIG
3.8.1 Simulation results for series compensated DFIG during normal operation
During normal grid condition, the series compensator is bypassed by SW1 as illustrated in
Fig. 3.10, and thereby the series compensator is at the “standby” status. Hence, the
operation of the series compensated DFIG is similar to the original DFIG system as
discussed in Section 3.7.1 during normal operation.
3.8.2 Simulation results for series compensated DFIG during faults
To verify the effectiveness of the ride-through enhancement of the series compensator,
the proposed control scheme of the series compensator is implemented in the simulation.
Figure 3.26 shows the operating performance of the DFIG with the proposed series
compensation method. Herein, the compensation duration T are chosen as 20ms
according to the (3.45). When the PCC voltage is down to 0.15 p.u and no phase shift is
involved. The PCC voltage is dropt at time 3s and recovered at time 3.2s, which is shown
in Fig.3.26(a). Figure 3.26(b) shows the compensation voltage generated by the series
compensator according to the proposed control scheme. Due to the compensation, the

Chapter 3 Ride-through enhancement of DFIG based on series voltage compensation
80
stator voltage of DFIG is smoothed as Fig.3.26(c). The compensation solution not only
smoothes the amplitude, but also smooth the angle shift of the PCC voltage. Figure 3.27
shows the zoom in of the stator voltage with the compensation. There is no step change in
terms of the amplitude and angle shift, which are the main causes of the overcurrent in the
rotor windings.
From Fig.3.26 (d) and (e), the currents of the stator and rotor windings are always within
the limitation. Both the stator and rotor currents are much smaller than that in Fig.3.23.
Hence, the proposed method is effective to ride through the severe grid faults without any
crowbar circuits.
From the viewpoint of the series compensator, Figure 3.26(f) presents the DC-link
voltage of the series compensator. At the start point of the voltage dip, the power is
absorbed by the compensator and thereby stored into the DC capacitor, which in turn,
boost the DC voltage. Thus at the end point of the voltage dip, the compensator supplies
the power and make the DC link voltage drop. However, within the one cycle of the
voltage dip, the DC link voltage of the series compensator is back to the pre-fault value.
There is no power change between the compensator and the wind turbine. The power
captured by the turbine is stored in the mechanical rotating energy of the wind turbine
rotor. Therefore, the rotor speed is increased as shown in Fig.3.26 (g).
In Fig.3.26, the compensation duration ∆T is chosen as 20 ms, but the ∆T will impact on
the size of the DC-link capacitance of the series compensator and the peak value of the
rotor current. Figure 3.28 shows the relationship of the rotor peak current/ DC link
capacitance of the series compensator versus the compensation duration ∆T. The voltage
on the PCC in Fig.3.26(a) is supplied in this simulation. With the increase of the ∆T, the
peak value of the rotor current can be reduced, however, the capacitance of the
compensator will be larger. Herein, the maximum allowed voltage variation is chosen as
600V and the pre-fault voltage is 1000V. The capacitance is calculated based on (3.46).
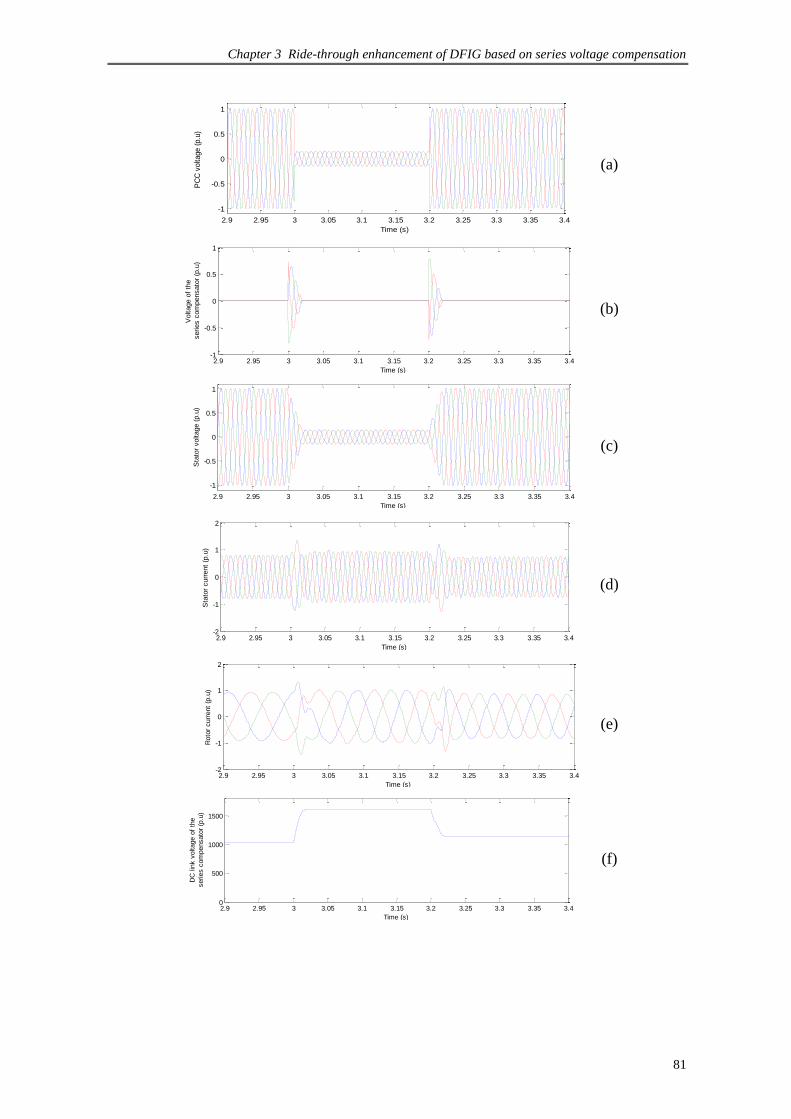
Chapter 3 Ride-through enhancement of DFIG based on series voltage compensation
81
2.9 2.95 3 3.05 3.1 3.15 3.2 3.25 3.3 3.35 3.4
-1
-0.5
0
0.5
1
Time (s)
PC
C v
oltage (
p.u
)
(a)
2.9 2.95 3 3.05 3.1 3.15 3.2 3.25 3.3 3.35 3.4-1
-0.5
0
0.5
1
Time (s)
Voltage o
f th
e
series c
om
pensato
r (p
.u)
(b)
2.9 2.95 3 3.05 3.1 3.15 3.2 3.25 3.3 3.35 3.4
-1
-0.5
0
0.5
1
Time (s)
Sta
tor
voltage (
p.u
)
(c)
2.9 2.95 3 3.05 3.1 3.15 3.2 3.25 3.3 3.35 3.4-2
-1
0
1
2
Time (s)
Sta
tor
curr
ent
(p.u
)
(d)
2.9 2.95 3 3.05 3.1 3.15 3.2 3.25 3.3 3.35 3.4-2
-1
0
1
2
Time (s)
Roto
r curr
ent
(p.u
)
(e)
2.9 2.95 3 3.05 3.1 3.15 3.2 3.25 3.3 3.35 3.40
500
1000
1500
Time (s)
DC
lin
k v
oltage o
f th
e
series c
om
pensato
r (p
.u)
(f)
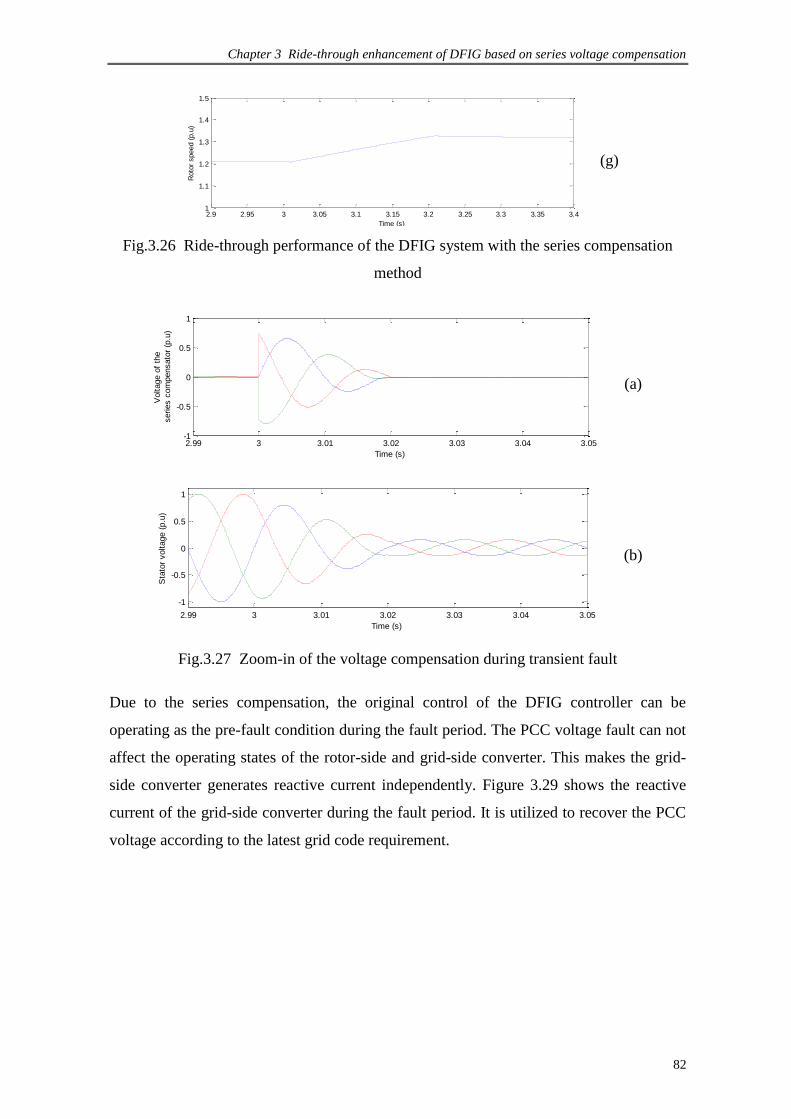
Chapter 3 Ride-through enhancement of DFIG based on series voltage compensation
82
2.9 2.95 3 3.05 3.1 3.15 3.2 3.25 3.3 3.35 3.41
1.1
1.2
1.3
1.4
1.5
Time (s)
Roto
r speed (
p.u
)
(g)
Fig.3.26 Ride-through performance of the DFIG system with the series compensation
method
2.99 3 3.01 3.02 3.03 3.04 3.05-1
-0.5
0
0.5
1
Time (s)
Voltage o
f th
e
series c
om
pensato
r (p
.u)
(a)
2.99 3 3.01 3.02 3.03 3.04 3.05
-1
-0.5
0
0.5
1
Time (s)
Sta
tor
voltage (
p.u
)
(b)
Fig.3.27 Zoom-in of the voltage compensation during transient fault
Due to the series compensation, the original control of the DFIG controller can be
operating as the pre-fault condition during the fault period. The PCC voltage fault can not
affect the operating states of the rotor-side and grid-side converter. This makes the grid-
side converter generates reactive current independently. Figure 3.29 shows the reactive
current of the grid-side converter during the fault period. It is utilized to recover the PCC
voltage according to the latest grid code requirement.

Chapter 3 Ride-through enhancement of DFIG based on series voltage compensation
83
0 10 20 30 40 50 601
2
3
Delta T (ms)
|Iro
tor,
pk| (p
.u)
0 10 20 30 40 50 60
20
40
60
80
DC
lin
k C
apacitance o
f th
e
series c
om
pensato
r (x
1000uF
)
Fig.3.28 The relationship of the rotor peak current/ DC link capacitance of the series
compensator versus the compensation time ∆T
2.9 2.95 3 3.05 3.1 3.15 3.2 3.25 3.3 3.35 3.4-0.4
-0.3
-0.2
-0.1
0
0.1
Time (s)
Reactive c
urr
rent
of
the
grid-s
ide c
onvert
er
(p.u
)
Reactive current reference
Reactive current feedback
Fig.3.29 The control of the reactive current of the grid-side converter during the fault
period
3.8.3 Performance of series compensated DFIG
The rotor-side current is an important indicator to evaluate the effectiveness of the series
compensated solution under the given grid fault. From Fig.3.26, the fault currents in the
rotor of the series compensated DFIG is controlled around the normal value, which is
much smaller than that of the original DFIG in Fig.3.23. In other words, the rotor-side
converter can be protected by the series compensator during the grid fault, and the ride-
through ability of DFIG wind turbine can be enhanced with the concept of series
compensation.
In addition, the energy storage capacity of series compensator would affect the system
cost of the series compensated solution. The large energy storage will significantly
increase the cost of series compensator, which in turns, increase the whole system

Chapter 3 Ride-through enhancement of DFIG based on series voltage compensation
84
expense. The improved control of series compensator has been proposed in Section 3.6 to
reduce the energy storage of series compensator and thereby reduce the system cost. In
our proposed method, the series compensator is desired to provide the expected voltage
only during the transient periods of grid fault happening and clearing. The effectiveness
of the control strategy has been verified in Section 3.8.2 as well.
3.9 Conclusion
Enhancing ride-through capability under grid fault events has been recognized as a
challenging problem of DFIG based wind generation systems. This chapter has presented
the field oriented control and the grid voltage oriented control of DFIG for an in-depth
understanding of the operation of DFIG. Then a ride-through solution, which was inspired
by the series compensation device, has been proposed to enhance grid robustness of DFIG.
The compensator is in series with the stator windings of DFIG and the general control of
the series compensator aims to fully eliminate the impact of grid fault voltages. However,
it is inevitable to increase the cost of the ride-through enhancement. Subsequently, an
improved ride-through control scheme of the DFIG and series compensation has been
developed to significantly reduce the energy capacity of the series compensator, which in
turn, reduces the system expense. This is the significant contribution of this ride-through
strategy. The developed series compensated DFIG has a stronger grid fault ride-through
ability than that of the original DFIG. The performance of the designed architecture has
been verified in simulation.

Chapter 4 Modulation and analysis of three-switch buck-type rectifier based Z-source inverter
85
CHAPTER 4
MODULATION AND ANALYSIS OF THREE-SWITCH BUCK-TYPE
RECTIFIER BASED Z-SOURCE INVERTER
4.1 Introduction
Compared with DFIG, PMSG exhibits good ride-through and grid support performance
because of its full scale converter. Hence the power electronics converter plays a
significant role in the PMSG turbine in terms of reliability and power quality.
This chapter presents an integration of a three-switch buck-type rectifier and a Z-Source
inverter for PMSG, which can overcome the drawbacks of existing configurations as
mentioned in Section 2.6.2. It is prerequisite to explore the integrated topology named as
the three-switch buck-type rectifier with Z-Source inverter in terms of modulation, circuit
analysis and validation before doing system-level integration for PMSG based wind
turbine. Hence, the modulation, analysis and demonstration of the three-switch buck-type
rectifier based Z-Source inverter will be introduced in this chapter with aims to clarify the
essential behavior of the developed topology. Then the design methodology, the
simulation studies and experimental validation of the proposed architecture for PMSG
wind application will be presented in the next chapter.
4.2 Derivation of the proposed topology for PMSG turbine
In order to explore the suitable modulation strategy for the integration of Z-Source
inverter and three-switch rectifier, this section will introduce the origin of the developed
integrated topology, which can be deduced from the Z-Source inverter and indirect matrix
converter (IMC).
4.2.1 Principle of Z-Source inverter

Chapter 4 Modulation and analysis of three-switch buck-type rectifier based Z-source inverter
86
L1
L2
C1
C2
To AC Load
or Motor
So
urc
e
Fig.4.1 DC Z-Source network diagram
The DC Z-source network diagram is illustrated in Fig.4.1 [101]. An impedance network
is coupled between a power source and an inverter circuit, with the impedance network
being implemented using a split-inductor ( 1L and 2L ) and capacitor ( 1C and 2C )
connected in an X-shape. This unique impedance network allows the Z-Source inverter to
buck and boost its output voltage, and also provides unique features that cannot be
achieved in the conventional voltage source inverter (VSI). The inductors 1L , 2L , and
capacitors 1C and 2C make up a symmetrical Z-Source network. Assuming that the
inductors 1L and 2L and the capacitors 1C and 2C have the same inductance L and
C , respectively, the Z-Source network becomes symmetrical. The detailed operation
modes of the Z-Source inverter will be discussed in Section 4.4.
4.2.2 Principle of indirect matrix converter
a
bc
A
B
C
p
n
DC
-lin
k
Fig.4.2 Topology of a three-phase indirect matrix converter
The topology of the IMC is shown in Fig.4.2 [102]. It realizes AC to AC direct power
conversion without intermediate DC-link capacitor. The bidirectional switches in the
front-end rectifier are used to block the input voltage source, and the two-quadrant

Chapter 4 Modulation and analysis of three-switch buck-type rectifier based Z-source inverter
87
switches are applied in the back-end inverter. Space vector modulation (SVM) is
simultaneously employed in both the front-end rectifier and the back-end inverter. The
detailed modulation will be introduced in Section 4.3.
4.2.3 Derivation of the three-switch buck-type rectifier based Z-Source inverter
The Z-Source network shown in Fig.4.1 can be introduced into the IMC (Fig.4.2) such
that the integrated topology can exhibits both the advantages of the aforementioned two
topologies. Figure 4.3 shows the integration of Z-Source network and IMC. The proposed
topology is able to boost the average DC-link voltage in order to provide higher load
voltage when required. In Fig.4.3, the switches in the rectification stage are implemented
using four-quadrant switches [103], and the switches in the inversion stage are each
implemented with an IGBT and an anti-parallel diode. In this topology, the diode D in the
DC-link is utilized for safe commutation of four-quadrant switches in the front-end
converter.
au
bu
cu
Au
Bu
Cu
p
n L2
C1
C2
L1
Sr1
Sr2
Sr3
Sr4
Sr5
Sr6
S1
S2
S3
S4
S5
S6
D
Fig.4.3 Integration of IMC and Z-Source network
Nevertheless, it is noted that the commutation diode D in Fig.4.3 can be replaced by the
front-end bridge leg. Moreover, the DC-link voltage of the topology in Fig.4.3 must have
a fixed polarity, but the front-end four-quadrant switch of the front-end rectifier is able to
operate with both positive and negative DC-link voltage polarities. All of these inspire to
simplify the integration of the IMC and Z-Source network by reducing the front-end
circuit complexity. Consequently, the simplification principle is illustrated in Fig.4.4. One
bridge-leg of the front-end circuit is shown in Fig.4.4(a), and if only positive DC-link
voltage and current are required, the actual useful semiconductors are presented in

Chapter 4 Modulation and analysis of three-switch buck-type rectifier based Z-source inverter
88
Fig.4.4(b) with solid-line. The other two switches 1paS and 1naS , shown with dot-line,
are used to flow negative DC-link current. To simplify the topology, the function of 2paS
and 2naS are replaced by the structure in Fig.4.4(c), where the control signals of switch
2paS and 2naS are same. Considering the same function of 2paS and 2naS , the final
compact bridge leg is shown in Fig.4.4(d), where the switching signal of the merged
switch is synthesized by an „OR‟ operator of 2paS and 2naS .
Spa
Sna
Spa2
Spa1
Sna2
Sna1
Spa2
Sna2
Spa2
Sna2
(a) (b) (c) (d)
Fig.4.4 Simplification of one-leg in the front-end converter
(a) front-end bridge leg structure (b) for modulating Positive DC-link voltage (c)
simplified circuit of (b) (d) derived compact bridge leg
Consequently, the two simplified AC-AC Z-Source inverter topologies are presented in
Fig.4.5. The commutation problem in the two derivatives can be solved easily since the
absence of four-quadrant switches. The actual control of raS , rbS and rcS (Fig.4.5) is
synthesized by utilizing the principle depicted in Fig.4.4. Due to the so-call sparse matrix
converter [104], the topology shown in Fig.4.5(a) is named as Z-Source sparse converter,
which has the same functionality as the topology shown in Fig.4.3. Bidirectional power
flow can be implemented in these two topologies.
However for applications where only unidirectional power flow is required, e.g. wind
turbine generation, the three-switch buck-type Z-Source inverter presented in Fig.4.5(b),
is a good alternative since it has the simplest architecture with buck-boost capability and
low current distortion. Moreover, it has the highest reliability since there is no shoot-
through risk in both front-end and back-end circuits. The shoot-through The system

Chapter 4 Modulation and analysis of three-switch buck-type rectifier based Z-source inverter
89
integration of this topology for PMSG based wind turbine will be discussed in the next
chapter.
The front-end converter is used to control the input power factor and serve as the power
source of the back-end Z-Source inverter. As explained in Fig.4.4, the switching signal of
the switch Sra, Srb and Src in Fig.4.5 can be synthesized by an „OR‟ operator of Sr1 and Sr2,
Sr3 and Sr4, Sr5 and Sr6, respectively. In order to control input power factor flexibly, space
vector modulation is adapted to generate the control signals for Sri (i=1, 2, … , 6), which
will be discussed in detail in the next section. On the other hand, the modulation of back-
end Z-Source inverter should be coordinated with the front-end rectifier, especially the
control of shoot-through mode. Hence, Section 4.3.3 will explain the synthesized
modulation of the front-end converter and back-end inverter.
au
bu
cu
Au
Bu
Cu
p
n L2
C1
C2
L1
Sr1
Sr2
Sr3
Sr4
Sr5
Sr6
S1
S2
S3
S4
S5
S6
Sra S
rbS
rc
(a) Topology of Z-Source sparse converter
au
bu
cu
Au
Bu
Cu
p
n L2
C1
C2
L1
S1
S2
S3
S4
S5
S6
Sra
Srb
Src
(b) Topology of three-switch buck-type Z-Source inverter
Fig.4.5 Two derivatives of the proposed IMC based Z-Source inverter

Chapter 4 Modulation and analysis of three-switch buck-type rectifier based Z-source inverter
90
4.3 Operation and Modulation of three-switch rectifier based Z-Source inverter
This section will introduce the modulation scheme for the three-switch buck-type rectifier
based Z-Source inverter. Since the derivation of this converter is based on the IMC.
Hence the SVM modulation for the IMC can be used for the control of the derivative
converter. Herein, the modulation of IMC will be presented.
4.3.1 Space vector modulation
Implementation of SVM for the matrix converter has been discussed in [105], where the
similar strategy can be used for IMC. The input current of the front-end rectifier is
modulated by current-SVM to attain controllable input power factor. Voltage-SVM is
applied in the back-end inverter to modulate three-phase output voltage. The synthesis of
the simultaneous output-voltage and input-current SVMs for controlling the IMC are
performed. The control principle of the IMC is introduced via front-end rectifier and
back-end inverter, respectively.
1I
2I
3I
4I
5I
6I
Ⅵ
Ⅰ
ⅡⅢ
Ⅳ
Ⅴ
aI
bI
cI
( , )pa nb
( , )pa nc
( , )pb nc
( , )pa na
( , )pc na
( , )pc nb
sc
I
I
iRI
s
TI
T
s
TI
T
Fig.4.6 Input current space vector modulation of the front-end rectifier
The six switches of the rectifier stage can be divided into nine switch modes as shown in
Fig.4.6. These nine modes are relevant to nine static space current vectors which include
six non-zero-vectors and three zero-vectors. The three-phase instantaneous input current
can be transformed into rotating current space vectors by Park transformation. The
rotating vector can be modulated by the six non-zero-vectors and three zero-vectors. For

Chapter 4 Modulation and analysis of three-switch buck-type rectifier based Z-source inverter
91
example, when the vector is in a particular segment, it can be synthesized by two static
vectors of this interval. So the input current vector can be expressed as:
0 0iR iI d I d I d I (4.1)
Where, sin(60 )s i scd T T m , sins i scd T T m , 0 0 1i i sd T T d d ,
sc is the input current vector angle, im is the modulation index of the front-end
rectifier, sT is the switching period,T 、T 、 0iT are the turn-on time of different
current vectors in one switching period, d 、 d 、 0id are the corresponding duty-
cycles, respectively.
1U (100)
2U (110)
3U (010)
4U (011)
5U (001) 6
U (101)
sv
rV
d
dI
II
III
IV
V
VI
Fig.4.7 Space vector representation of the back-end inverter
The back-end inverter is a conventional voltage source inverter (VSI). Among all the
switches combinations, there are six non-zero-vectors and two zero-vectors shown in
Fig.4.7. The rotating output-voltage vector can be modulated by the six non-zero-vectors
and two zero-vectors. Hence, the resulting output voltage vector can be described as:
0VdVdVdV ov
(4.2)
Where, )60sin(/ svvs mTTd , )sin(/ svvs mTTd , and dddov 1 . sv
is the output-voltage vector angle, vm is the modulation index of the VSI.

Chapter 4 Modulation and analysis of three-switch buck-type rectifier based Z-source inverter
92
4.3.2 Control of indirect matrix converter
To obtain a correct balance of the input currents and output voltages in the same
switching periods, the modulation pattern should produce all combinations of the
rectification ( 0 ) and inversion ( 0 ) switching states, resulting in the
following switching pattern: 0 . Each sequence duty-cycle is a cross-
product of the rectification and inversion duty-cycles, while zero-vector duration
completes the switching sequence:
)60sin()sin(
)sin()sin(
)sin()60sin(
)60sin()60sin(
svsc
svsc
svsc
svsc
mddd
mddd
mddd
mddd
(4.3)
Where, vi mmm is defined as the modulation index of IMC. For simplification, it is
convenient to choose 1im and vmm .
T T iT0
T TvT 0
sT
T T vT 0 iT0
0 0 0
VSR-
SVM
IMC-
SVM
Fig.4.8 Switching modes synthesis of the IMC
During the remaining part of the switching cycle (1- d - d - d - d ), we can utilize
the zero-vector, either from the rectification stage (three zero-vectors) or inversion stage
(two zero-vectors). Hence, there are totally five zero-vectors available in the IMC. Note
that only three zero-vectors are available in the conventional MC. This is the most notable
difference in modulation between the IMC and conventional MC. To make the averaged
DC-link stage voltage of the IMC constant, the switching sequence shown in Fig.4.8 is
utilized. The corresponding duty-cycles can be calculated by:

Chapter 4 Modulation and analysis of three-switch buck-type rectifier based Z-source inverter
93
)]30cos(1[
)]30cos(1[)sin(
)]30cos(1[)60sin(
0
00
00
sci
svscvv
svscvv
md
mddd
mddd
(4.4)
Where, vd 0 , vd 0 are the duty-cycles while the zero voltage-vector of the inversion stage
and the nonzero current-vector of the rectification stage are performed simultaneously.
id0 is shown in (4.1).
To evaluate the DC-link voltage of the IMC, we take the input current-vector in the
interval I [105] as an example. Based on the duty-cycles in (4.3) and (4.4), the DC-link
voltage can be expressed as:
dVdV
dddVdddVV
acab
vacvabpn
)()( 00
(4.5)
Together with (4.3) and (4.4), (4.5) can be rewritten as:
iim
c
b
a
T
acabpn V
v
v
v
d
d
dd
vdvdV
cos2
3
(4.6)
Where, va, vb, vc are three-phase input voltages, Vim is the amplitude of the input phase-
voltage and i is input power factor angle. Assuming that the input power factor is unity,
maximum DC-link voltage can be obtained. Similarly, the voltage waveform in the other
five segments can be deduced.
4.3.3 Modulation of the developed converter
With the principle of simplification in Fig.4.4, the control principle is easily expanded to
the developed Z-Source inverters. Figure 4.9 shows the switching sequence of the
proposed Z-Source inverters within a switching period sT . During the duration of sTm ,
the SVM approach is applied to modulate the converter. Then the shoot-through state of
the converter is arranged in the zero-vector interval ( sTm )1( ). The detailed switching
modes will be analyzed in Section 4.4. The subsections in d0i is also required similar in du

Chapter 4 Modulation and analysis of three-switch buck-type rectifier based Z-source inverter
94
and dv in order to obtain a good performance of input current. The related duty-cycles can
be expressed as,
)]30cos(1[)]30cos(1[
)sin()]30cos(1[
)60sin()]30cos(1[
00
00
00
svscvi
svscii
svscii
md
mddd
mddd
(4.7)
T T iT0
T TvT 0
sTm
T T vT 0 iT0
0 0 0
VSR-
SVM
IMC-
SVM
sTm )1(
Shoot-
through
zero
states
Z-Source
principle
sT
iT0 viT 00
Fig.4.9 Switching sequence for the developed Z-Source topology
On the other hand, turning-on the switches in the front-end circuit of the three-switch
buck-type Z-Source inverter will make it as the diode front-end Z-Source inverter of
[106]. Doing this makes it impossible to modulate good line-side current. However, this
provides a robust operation characteristic of the three-switch buck-type Z-Source
converter since shoot-through is allowed.
4.4 Circuit analysis of the developed Z-Source inverter
Upn
Front-end
RectifierZ-Source Back-end
InverterL
1
L2
C1
C2
To AC Load
or Motor
Fig.4.10 Reduced circuit of the developed Z-Source inverter

Chapter 4 Modulation and analysis of three-switch buck-type rectifier based Z-source inverter
95
As viewed from the Z-Source network, the front-end rectifier can be modeled as an
averaged DC Voltage source with high frequency harmonics. So the DC-link voltage can
be expressed as (4.6). We take the current-vector in the interval I as an example to further
explain the operating principle and operating modes. When the input current-vector is
located at the Interval I, the switches 1rS and 4rS conduct as a pair ( I
) and thereby the
Z-Source input voltage is fed by abV . Then the switches 1rS and 6rS conduct as a pair
( I
) and thereby the DC-link voltage is acV . Finally the switches 1rS and 2rS conduct as
a pair (Zero-vector) and the DC-link voltage would be zero (short-circuit). As a result, the
proposed Z-Source inverters are reduced to the basic Z-Source inverter, as shown in
Fig.4.10.
4.4.1 Equivalent circuit analysis
From the reduced circuit, there are three operation modes in terms of the back-end
inverter bridge‟s different switching states.
Vpn
VL1
+ -
VL2 +-
+
-V
C1
+
-V
C2
= Vab
, Vac
or 0
io
2iL- i
o+
-
(a) Mode I
Upn
VL1
+ -
VL2 +-
+
-V
C1
+
-V
C2
+
-
(b) Mode II
VL1
+ -
VL2 +-
+
-V
C1
+
-V
C22i
L
(c) Mode III
Fig.4.11 Equivalent circuit modes of the developed Z-Source inverter

Chapter 4 Modulation and analysis of three-switch buck-type rectifier based Z-source inverter
96
Mode I
The inversion stage is operating in one of the six traditional non-zero-vectors, thus acting
as a current source ( 0i ) viewed from the Z-Source circuit. The DC-voltage of the Z-
Source network can be abV , acV or 0 which is depended on the input current-vector
applied. Figure 4.11(a) shows the circuit of this mode. In the conventional AC-DC-AC
converter, the front-end rectifier may not conduct depending on the DC capacitor voltage
level. However, the Z-Source network always forces the front-end rectifier to support the
difference between the inductor current ( LI ) and inverter DC current 0i , namely 02 iI L .
Both inductors have an identical current value because of the circuit symmetry.
Mode II
The back-end inversion bridge is operating in one of two zero voltage-vectors and
shooting through either the upper and lower three switches, thus acting as an open circuit
viewed from the Z-Source network. Figure 4.11(b) shows the circuit of this mode. The
voltage drop on the inductor would not be a constant which is dependent on the actual
value of the pnV . This is the difference between the Z-Source network applied in the IMC
and the conventional inverter. The current in the inductor will therefore be following in
nonlinear form.
Mode III
The back-end inversion stage is operating in one of the seven shoot-through states.
During this mode, all the bidirectional switches in the front-end rectifier are off,
separating the DC-link from the AC line. In the three-switch buck-type Z-Source inverter,
the AC line is automatically separated by the front-end diode. Figure 4.11(c) shows the
circuit of this mode. Depending on how much a voltage boost is needed, the duration of
the shoot-through state is determined.
Due to the switching principle presented in Fig.4.9, the corresponding switching modes of
the Z-Source inverters are presented in Fig.4.12.

Chapter 4 Modulation and analysis of three-switch buck-type rectifier based Z-source inverter
97
① When ],[ 10 ttt , the Z-Source inverter is operating at Mode II. One of two non-zero
input current-vectors is applied. The inductor voltage )(1 abCL VVV , and thereby the
inductor current is dropping. The output voltage of the Z-Source network is
abC VVV 20.
② When ],[ 21 ttt , the Z-Source inverter is operating at Mode I. One of two non-zero
input current-vectors is applied. The inductor voltage is )(1 abCL VVV , and the output
voltage of the Z-Source network is abC VVV 20 .
③ When ],[ 32 ttt , the Z-Source inverter is operating at Mode I. Another of the two
non-zero input current-vectors is applied. The inductor voltage is )(1 acCL VVV , and
thereby the falling rate of the inductor current is changed. Thus the output voltage of the
Z-Source network is acC VVV 20
.
④ When ],[ 43 ttt , the Z-Source inverter is operating at Mode II. Another of the non-
zero input current-vectors is applied. The inductor voltage is )(1 acCL VVV , and the
output voltage of the Z-Source network is acC VVV 20 .
⑤ When ],[ 54 ttt , the Z-Source inverter is operating at Mode I. The zero input current-
vector is applied. The inductor voltage is CL VV 1 , and the output voltage of the Z-
Source network is CVV 20 .
⑥ When ],[ 65 ttt , the Z-Source inverter is operating at Mode III. This is the shoot-
through state. During this period, all the switches in the rectification stage are off,
separating the DC-link from the input AC supplies. The inductor voltage is CL VV 1
, and
thereby the inductor current is increasing. The output voltage of the Z-Source network is
00 V .

Chapter 4 Modulation and analysis of three-switch buck-type rectifier based Z-source inverter
98
T TvT 0 T T vT 0 iT0
sTm )1(
vL1
iL1
v0
-(VC-V
ab)
-(VC-V
ac)
-VC
VC
2VC-V
ab
2VC-V
ac
2VC
t0
t1 t
4t3
t2 t
6t5
(vL2
)
(iL2
)
Fig.4.12 Operating waveforms of the Z-Source inverters
4.4.2 Obtainable voltage transfer ratio
From the symmetry and the equivalent circuits, we have
CCC VVV 21 and LLL vvv 21 (4.8)
The average voltage of the inductors over one switching period ( sT ) should be zero in
steady state. Thus we have
0
)1()()( 0
s
sCiCacCabCLL
T
TmVTVTVVTVVvV
(4.9)
Utilizing (4.7), then (4.9) can be rewritten as
12
m
m
V
V
pn
C (4.10)
Where, pnV is the DC-link voltage expressed in (4.6), ]1,0[m is the modulation index
of the proposed Z-Source inverters.
Consequently, the average DC-link voltage across the inversion stage can be found as:

Chapter 4 Modulation and analysis of three-switch buck-type rectifier based Z-source inverter
99
s
iCacCabC
T
TVTVVTVVvV
0
00
2)2()2(
(4.11)
Together with (4.7) and (4.10), the (4.11) can be rewritten as
pnpnC Vm
mVVmvV
12)2(00
(4.12)
Furthermore, we define the peak phase-voltage of the inversion stage as omV , and
substituting pnV from (4.6) into (3.12), the obtainable voltage transfer ratio is derived as
i
im
om
m
m
V
Vcos
2
3
12
(4.13)
Where, i is the input power factor angle.
4.5 Simulation and experimental verification
The integration of the three-switch buck-type rectifier and the Z-Source inverter is
modeled with the developed modulation scheme. The simulation study is set up with the
parameters shown in Table 4.1.
Table 4.1 Parameters of the three-switch buck-type rectifier based Z-Source inverter
Items Value
Input AC source 120V/ 50 Hz (line-to-line RMS)
Commanded output voltage 220V/ 25Hz (line-to-line RMS)
Load resistance 30
Load inductance 25 mH
Input power factor 1
Switching frequency 5 kHz
Inductor L1 and L2 3 mH
Capacitor C1 and C2 470 uF
4.5.1 Simulation results
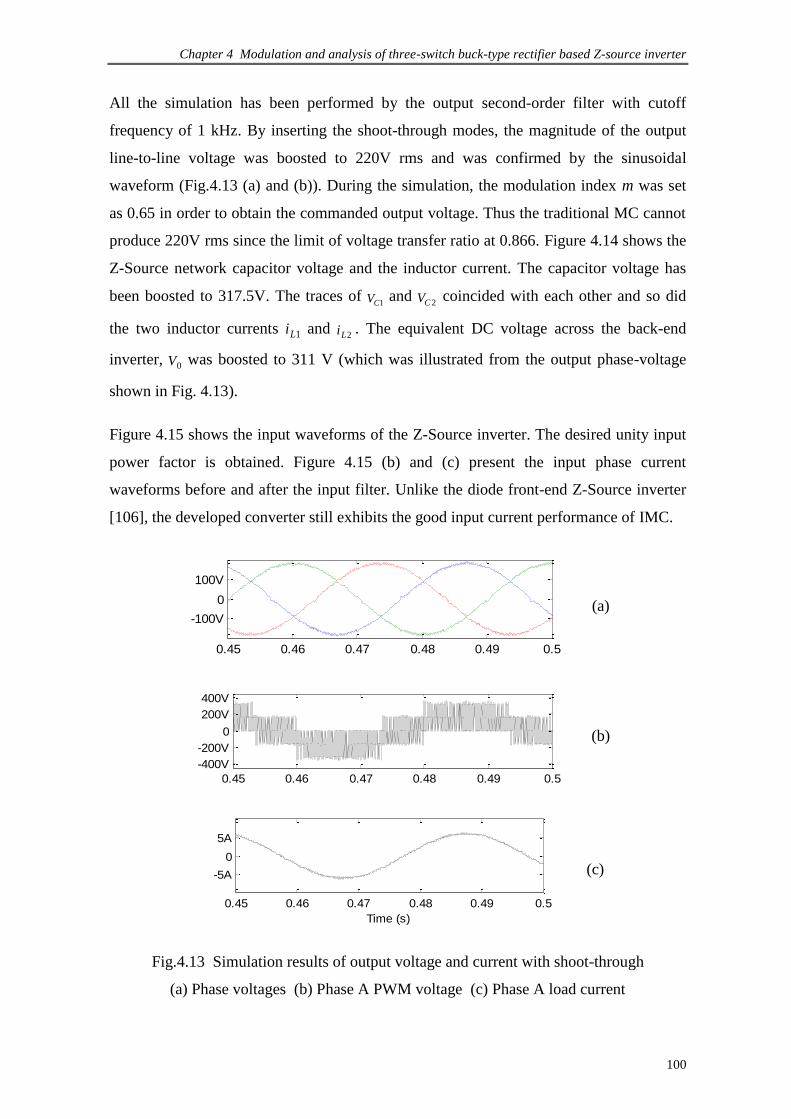
Chapter 4 Modulation and analysis of three-switch buck-type rectifier based Z-source inverter
100
All the simulation has been performed by the output second-order filter with cutoff
frequency of 1 kHz. By inserting the shoot-through modes, the magnitude of the output
line-to-line voltage was boosted to 220V rms and was confirmed by the sinusoidal
waveform (Fig.4.13 (a) and (b)). During the simulation, the modulation index m was set
as 0.65 in order to obtain the commanded output voltage. Thus the traditional MC cannot
produce 220V rms since the limit of voltage transfer ratio at 0.866. Figure 4.14 shows the
Z-Source network capacitor voltage and the inductor current. The capacitor voltage has
been boosted to 317.5V. The traces of 1CV and
2CV coincided with each other and so did
the two inductor currents 1Li and 2Li . The equivalent DC voltage across the back-end
inverter, 0V was boosted to 311 V (which was illustrated from the output phase-voltage
shown in Fig. 4.13).
Figure 4.15 shows the input waveforms of the Z-Source inverter. The desired unity input
power factor is obtained. Figure 4.15 (b) and (c) present the input phase current
waveforms before and after the input filter. Unlike the diode front-end Z-Source inverter
[106], the developed converter still exhibits the good input current performance of IMC.
0.45 0.46 0.47 0.48 0.49 0.5
-100V
0
100V
Time (s)
(a)
0.45 0.46 0.47 0.48 0.49 0.5
-400V
-200V
0
200V
400V
Time (s)
(b)
0.45 0.46 0.47 0.48 0.49 0.5
-5A
0
5A
Time (s)
(c)
Fig.4.13 Simulation results of output voltage and current with shoot-through
(a) Phase voltages (b) Phase A PWM voltage (c) Phase A load current
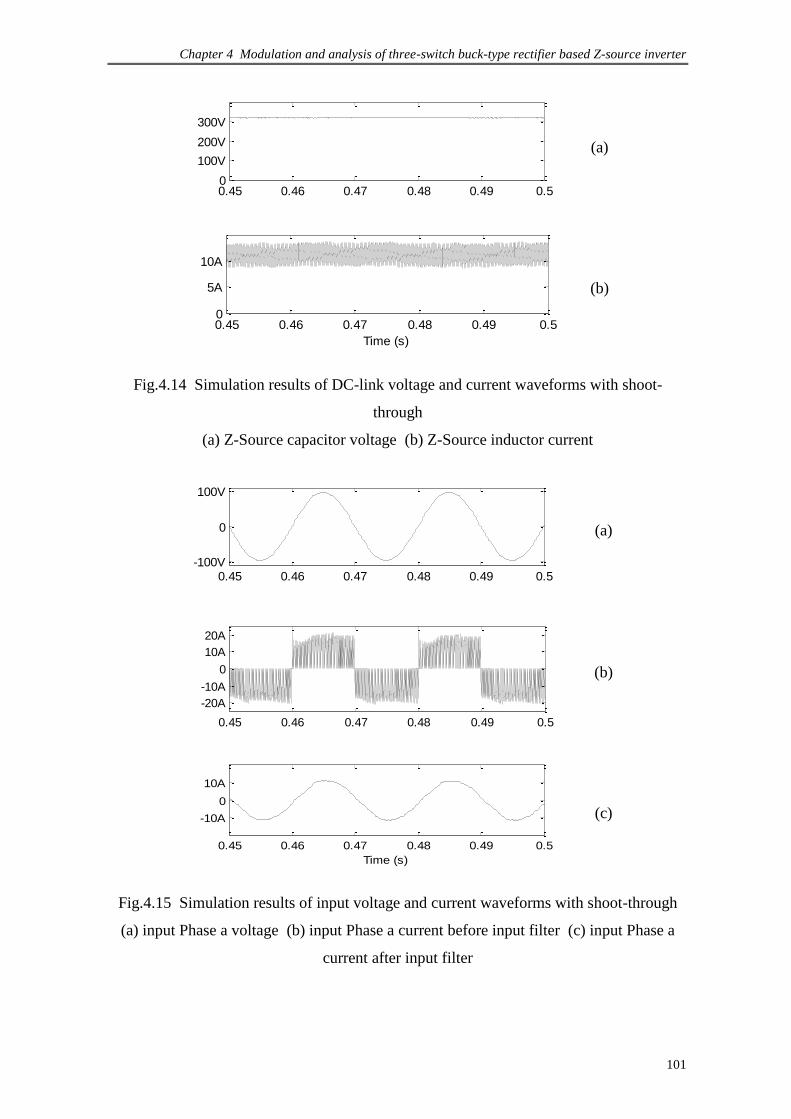
Chapter 4 Modulation and analysis of three-switch buck-type rectifier based Z-source inverter
101
0.45 0.46 0.47 0.48 0.49 0.50
100V
200V
300V
Time (s)
(a)
0.45 0.46 0.47 0.48 0.49 0.50
5A
10A
Time (s)
(b)
Fig.4.14 Simulation results of DC-link voltage and current waveforms with shoot-
through
(a) Z-Source capacitor voltage (b) Z-Source inductor current
0.45 0.46 0.47 0.48 0.49 0.5-100V
0
100V
Time (s)
(a)
0.45 0.46 0.47 0.48 0.49 0.5
-20A
-10A
0
10A
20A
Time (s)
(b)
0.45 0.46 0.47 0.48 0.49 0.5
-10A
0
10A
Time (s)
(c)
Fig.4.15 Simulation results of input voltage and current waveforms with shoot-through
(a) input Phase a voltage (b) input Phase a current before input filter (c) input Phase a
current after input filter

Chapter 4 Modulation and analysis of three-switch buck-type rectifier based Z-source inverter
102
4.5.2 Experimental results
Fig.4.16 Photograph of the prototype of three-switch buck-type Z-Source inverter
A laboratory prototype of the three-switch buck-type Z-Source converter has been
constructed to demonstrate the aforementioned modulation. The switching times and
switch vectors are calculated by Dspace 1103 and then transferred to CPLD (Altera
EPM7128) that generates each of the switch gate signals. The physical arrangement of the
converter, which includes all power devices, gate drives, passive components and control
boards can be seen from the photograph in Fig.4.16.
Experimental measurements of the topology have been made on the input currents and
voltages, Z-Source network voltages and currents, and the output voltages. The operating
conditions in Table 4.1 are also applied to conduct the corresponding experiments. Figure
4.17 and 4.18 show the experimental results of the DC-link voltage and output voltages
under non-shoot through condition, respectively. It can be seen from Fig.4.17 that the
instantaneous DC-link voltage is switched to abv for a duration of 060 . This is followed
with the control principle of IMC. The average DC-link voltage is equivalent to a constant,
which serves as the input of the Z-Source network. Figure 4.18 shows the unfiltered
output voltage, filtered voltage and current flowing in the RL load. The output current is
sinusoidal and has a fundamental frequency according to the command. However, the
voltage transfer ratio, which is theoretically limited to 0.866, is actually even lower as
seen in Fig.4.18. All the experiments have been performed by a second-order filter with
cutoff frequency of 1 kHz, which is similarly used in the simulation study.
Z-Source
network
Power
devices
CPLD board
Input
phase angle
tracking
tracking
Drivers and
protection
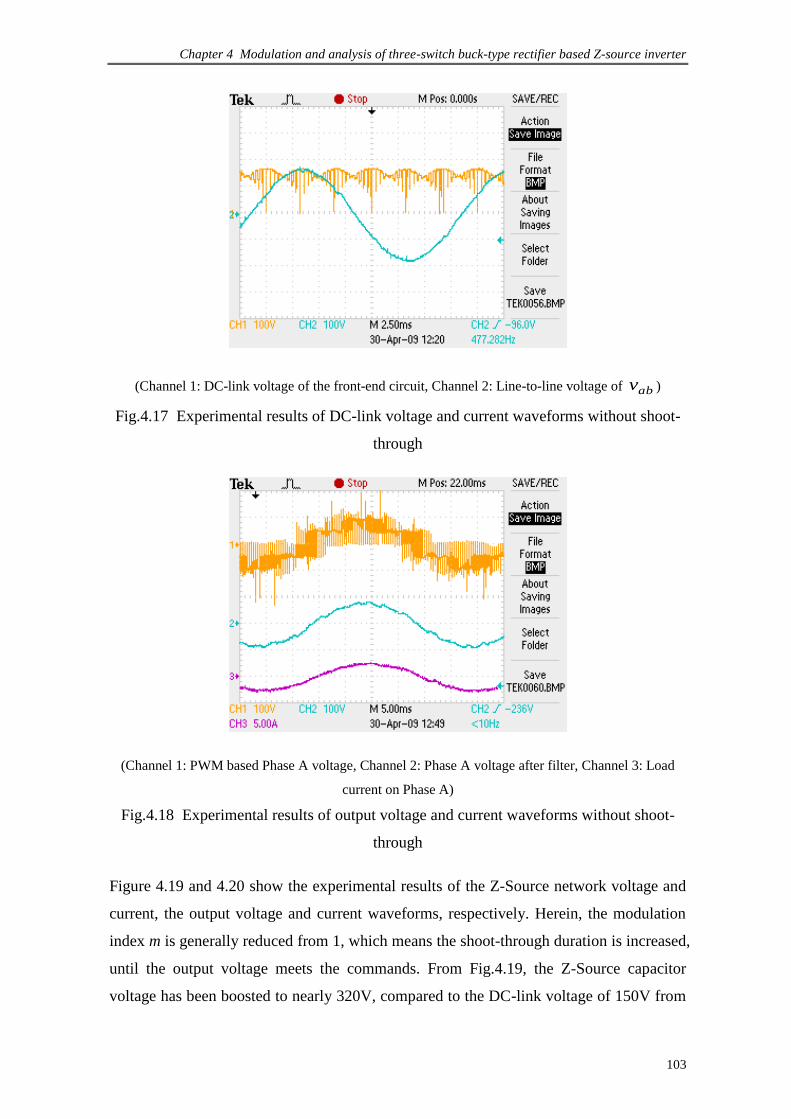
Chapter 4 Modulation and analysis of three-switch buck-type rectifier based Z-source inverter
103
(Channel 1: DC-link voltage of the front-end circuit, Channel 2: Line-to-line voltage of abv )
Fig.4.17 Experimental results of DC-link voltage and current waveforms without shoot-
through
(Channel 1: PWM based Phase A voltage, Channel 2: Phase A voltage after filter, Channel 3: Load
current on Phase A)
Fig.4.18 Experimental results of output voltage and current waveforms without shoot-
through
Figure 4.19 and 4.20 show the experimental results of the Z-Source network voltage and
current, the output voltage and current waveforms, respectively. Herein, the modulation
index m is generally reduced from 1, which means the shoot-through duration is increased,
until the output voltage meets the commands. From Fig.4.19, the Z-Source capacitor
voltage has been boosted to nearly 320V, compared to the DC-link voltage of 150V from
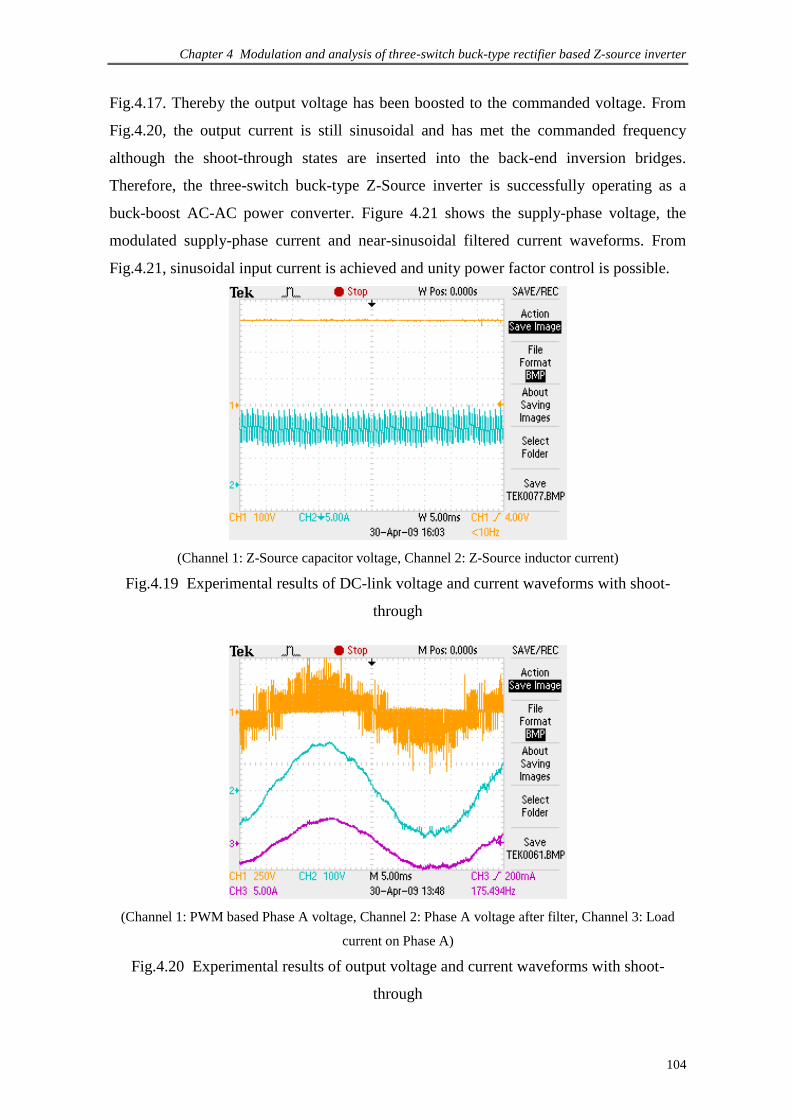
Chapter 4 Modulation and analysis of three-switch buck-type rectifier based Z-source inverter
104
Fig.4.17. Thereby the output voltage has been boosted to the commanded voltage. From
Fig.4.20, the output current is still sinusoidal and has met the commanded frequency
although the shoot-through states are inserted into the back-end inversion bridges.
Therefore, the three-switch buck-type Z-Source inverter is successfully operating as a
buck-boost AC-AC power converter. Figure 4.21 shows the supply-phase voltage, the
modulated supply-phase current and near-sinusoidal filtered current waveforms. From
Fig.4.21, sinusoidal input current is achieved and unity power factor control is possible.
(Channel 1: Z-Source capacitor voltage, Channel 2: Z-Source inductor current)
Fig.4.19 Experimental results of DC-link voltage and current waveforms with shoot-
through
(Channel 1: PWM based Phase A voltage, Channel 2: Phase A voltage after filter, Channel 3: Load
current on Phase A)
Fig.4.20 Experimental results of output voltage and current waveforms with shoot-
through

Chapter 4 Modulation and analysis of three-switch buck-type rectifier based Z-source inverter
105
(Channel 1: input Phase a voltage, Channel 2: input Phase a current before input filter, Channel 3:
input Phase a current after input filter)
Fig.4.21 Experimental results of input voltage and current waveforms with shoot-through
4.6 Comparison of simulation and experimental results
In order to completely evaluate the system performance, it is necessary to compare the
simulation and experimental results in terms of several performance parameters, such as
power factor, THD, ripple on the DC link.
Numerical simulation normally consists of ideal operating conditions, i.e., the ideal
components/switches, fast-enough control processor, real-time sampling without delay,
and no measurement and calculation error and so on. However, in the lab-based prototype,
the power semiconductor switch, i.e., IGBT, is definitely not like the ideal switch used in
the simulation. The real switch has switching loss, reverse current, internal resistance and
so on, and all of these non-ideal factors will impact on the system performance. In
addition, digital signal processor (DSP) is widely used in experimental verification, and
the sampling time is limited by the processing speed of the used DSP.
Bearing all these in mind, the performance of simulation is better than that of
experimental studies in terms of power factor control, THD of input current, and DC-link
voltage ripple. The input current distortion in the experimental results is larger than that in
the simulation, and thereby the input power factor control in experiment is better than that

Chapter 4 Modulation and analysis of three-switch buck-type rectifier based Z-source inverter
106
in simulation as well. In addition, the parasite parameters in the prototype also impact on
the DC-link voltage, which can be found from the simulation and experimental studies.
4.7 Conclusions
This chapter discussed the development of the three-switch buck-type rectifier based Z-
Source inverter and the proposed modulation scheme has been presented in detail. All
these are the prerequisite conditions to apply the developed converter for any WTG
configuration which requires full power converter. The simulation studies and
experimental results have verified the concept of integrating the three-switch rectifier
with a Z-Source inverter. From the aforesaid results, the developed converter exhibits
good reliability due to shoot-through allowance and less power semiconductor switches
compared with the conventional back-to-back topology. The detailed design methodology
and verification of the proposed architecture for PMSG application will be discussed in
the next chapter.

Chapter 5 Design of a robust PMSG turbine based on the developed topology
107
CHAPTER 5
DESIGN OF A ROBUST PMSG TURBINE SYSTEM BASED ON THE
DEVELOPED TOPOLOGY
5.1 Introduction
The modulation, analysis and demonstration of the three-switch buck-type rectifier based
Z-Source inverter have been introduced in Chapter 4. This chapter presents the design of
a robust PMSG wind turbine based on the aforementioned topology. Figure 5.1 shows the
proposed PMSG based wind generation system, which provides high reliability, low
capital cost, and harmonic-free characteristics in both generator and grid sides.
From Fig.5.1, the wind power captured by the turbine is converted by the PMSG and
transferred to the grid via a three-phase three-switch PWM buck-type rectifier in series
with a Z-Source inverter. The detailed power circuit is illustrated in Fig.5.2, which has
been analyzed in Chapter 4. The main function of the generator-side PWM rectifier is to
regulate the power factor of PMSG and to ensure sinusoidal generator currents. A small
LC input filter can be designed to absorb the high frequency harmonics injected into the
generator by the rectifier switching action. The grid-side inverter serves as a grid power
interface to connect PMSG with network utility. The detailed generator-side and grid-side
control scheme will be discussed in this chapter.
Gen
PMSGGrid
Rectifier Z-Source Inverter
Fig.5.1 Proposed PMSG based wind generation system

Chapter 5 Design of a robust PMSG turbine based on the developed topology
108
av bv cv
Av
Bv
Cv
L2
C1
C2
L1
S1
S2
S3
S4
S5
S6
Sra
Srb
Src
From
PMSG
To Grid
+
-
Vpn
+
-
Vo
Fig.5.2 Three-switch buck-type rectifier based Z-Source inverter for PMSG
5.2 Generator-side (PMSG) control principle
- +
Rs
Lm
isd
Vsd
Ipm
Lls= L
sd- L
m
qrp
d
+
-
+ -
Rs
Lsq
isq
Vsq
drp
q
+
-
(a)
ds
qs
pm
inI
sE
sinRI sin XIj
inV
r
r
sdi
sqi
i
(b)
Fig.5.3 Equivalent circuit and phasor diagram of the PMSG
(a) equivalent circuit (b) phasor diagram
The control strategy for the generator-side converter (the three-switch buck-type rectifier)
is discussed based on the equivalent circuit and phasor diagram of PMSG illustrated in
Fig.5.3. The generator terminal voltage serves as the input voltage to the rectifier, termed

Chapter 5 Design of a robust PMSG turbine based on the developed topology
109
as inV
, which is equal to the machine back-EMF sE
minus the voltage drop in the
machine impedance (Rs+jXs). From the equivalent circuit, the steady-state equation of
PMSG can be expressed as
pmrsq
sd
ssdr
sqrs
sq
sd
pI
I
RLp
LpR
V
V
0 (5.1)
Where, Rs, Lsd and Lsq are the PMSG stator resistance, direct-axis and quadrature-axis
inductances, respectively. ω r is the generator speed, p is the PMSG pole pairs and
λpm=LmIpm is the permanent magnetic flux. Herein, two control schemes: unity power
factor control and Id=0 control, are discussed in this section.
5.2.1 Unity power factor control of PMSG
From Fig.5.3, the angle φi between the PMSG terminal voltage and the generator stator
current is equal to the input power factor angle of the three-switch buck rectifier,
assuming small capacitance of the filter. Unity power factor control of the rectifier can be
implemented by making the stator current vector follow the measured terminal voltage
vector. That means the angle φi is kept at zero, which means the rectifier can be treated as
an equivalent „resistance‟ load of the PMSG. Thereby the generator current harmonics
can be reduced and the generator efficiency can be improved compared to the
conventional diode-rectifier topology, where the sinusoidal generator current cannot be
achieved.
With unity power factor control, the overall volt-ampere of the front-end rectifier would
contribute to the active power transfer and thereby reduce the power rating of the
proposed configuration. This would lead to a smaller size and hence reduce the cost of
power circuit, which is one of the significant considerations for MW-level wind turbine
design.
5.2.2 Id=0 control of PMSG

Chapter 5 Design of a robust PMSG turbine based on the developed topology
110
The Id=0 control is applied to improve the efficiency of machine. With this control, the
machine torque is coordinated with the magnitude of the q-axis current, while the d-axis
current is always kept as zero (Id =0).
According to the rotor flux oriented strategy, the stator current vector should always be
kept aligned with the back EMF of PMSG. In other words, the torque angle δ should be
controlled as,
δ = 900 (5.2)
Equation (5.2) denotes the fundamental principle of Id=0 control. The input power factor
of the front-end rectifier can be flexibly adjusted by changing current space vector angle.
Specifically, the reference of the current-vector is easily obtained by utilizing rotor
position signal of the PMSG with a constant angle bias (900).
5.2.3 Optimized control strategy of PMSG
The Id=0 control can provide the maximum torque per ampere. However, for the Id=0
control, the maximum available speed is limited to a base value, which depends on the
DC-link voltage and machine back EMF. Alternatively, this limitation can be explained
using the power factor angle φi of the Id=0 control, which can be derived from (5.1) as,
2
2
1
22
1
)1(
)(
1
1coscos
pmr
sqs
pm
sqsqsdsq
sq
i
IR
ILVV
V
(5.3)
From (5.3), the power factor deteriorates with increasing rotor speed as well as with
increasing stator current. This control results in a relatively low power factor of PMSG,
especially at the rated power and overload operation [69]. Therefore, the lower the power
factor, the higher the DC-link voltage is required in order to keep the same torque. Once
the DC-link voltage is selected, the low power factor results in the reduction of the speed
operating range.

Chapter 5 Design of a robust PMSG turbine based on the developed topology
111
The unity power factor control means that it is still able to increase the voltage for wider
range of speed operation before reaching the base value, while the machine torque is kept
constant. Consequently, the base operating speed range can be extended significantly
compared to the Id=0 control. This principle is similar to the field weakening control of
motor drive. However, this control strategy is not optimal in terms of efficiency as
compared to the Id=0 control. The fundamental machine loss is also evaluated by the
generator torque angle δ, which can be derived from (5.1) as,
sdsqsdpm
sdsq
sdsq
sd
ILL
IL
II
I
)(coscos 1
22
1
(5.4)
From (5.4), the δ can be more than or less than 900 with increasing stator current. A
torque angle larger than 900 will result in an increase of flux linkage contributing to
machine saturation. Hence, the torque per ampere is less than one, indicating that the
unity power factor control is not optimal in terms of torque generation. The efficiency
will be reduced by the increased copper losses for generating the same torque.
In order to obtain both maximum efficiency and maximum torque per ampere, it is
preferable to incorporate the Id=0 control with the unity power factor control, specifically:
the Id=0 control is used before reaching the base speed, while the unity power factor
control is selected after this base speed.
In order to determine the speed boundary, the system real power P is expressed as
ii IVSP coscos (5.5)
Where, V and I are the system rating voltage and current, respectively. S is the system
apparent power. The curve of the power factor angle φi versus the real power can be
calculated by (5.3) with the PMSG parameters. From (5.5), we can obtain the relation
between the real power and apparent power. Herein, if the S is set as 1 p.u, the boundary
real power can be determined. Therefore, the speed boundary can be derived from the
speed-power relationship, which will be introduced in the following section.
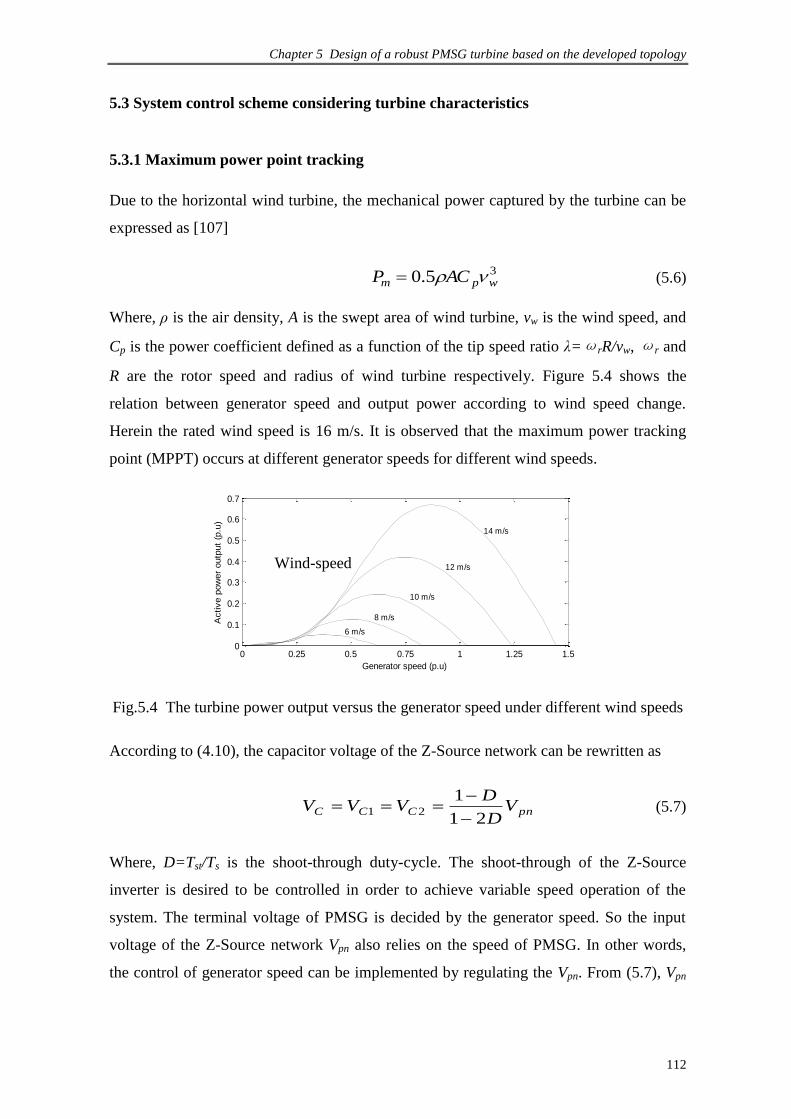
Chapter 5 Design of a robust PMSG turbine based on the developed topology
112
5.3 System control scheme considering turbine characteristics
5.3.1 Maximum power point tracking
Due to the horizontal wind turbine, the mechanical power captured by the turbine can be
expressed as [107]
35.0 wpm ACP (5.6)
Where, ρ is the air density, A is the swept area of wind turbine, vw is the wind speed, and
Cp is the power coefficient defined as a function of the tip speed ratio λ=ωrR/vw, ωr and
R are the rotor speed and radius of wind turbine respectively. Figure 5.4 shows the
relation between generator speed and output power according to wind speed change.
Herein the rated wind speed is 16 m/s. It is observed that the maximum power tracking
point (MPPT) occurs at different generator speeds for different wind speeds.
0 0.25 0.5 0.75 1 1.25 1.50
0.1
0.2
0.3
0.4
0.5
0.6
0.7
Active p
ow
er
outp
ut
(p.u
)
Generator speed (p.u)
6 m/s
8 m/s
10 m/s
12 m/s
14 m/s
Fig.5.4 The turbine power output versus the generator speed under different wind speeds
According to (4.10), the capacitor voltage of the Z-Source network can be rewritten as
pnCCC VD
DVVV
21
121
(5.7)
Where, D=Tst/Ts is the shoot-through duty-cycle. The shoot-through of the Z-Source
inverter is desired to be controlled in order to achieve variable speed operation of the
system. The terminal voltage of PMSG is decided by the generator speed. So the input
voltage of the Z-Source network Vpn also relies on the speed of PMSG. In other words,
the control of generator speed can be implemented by regulating the Vpn. From (5.7), Vpn
Wind-speed
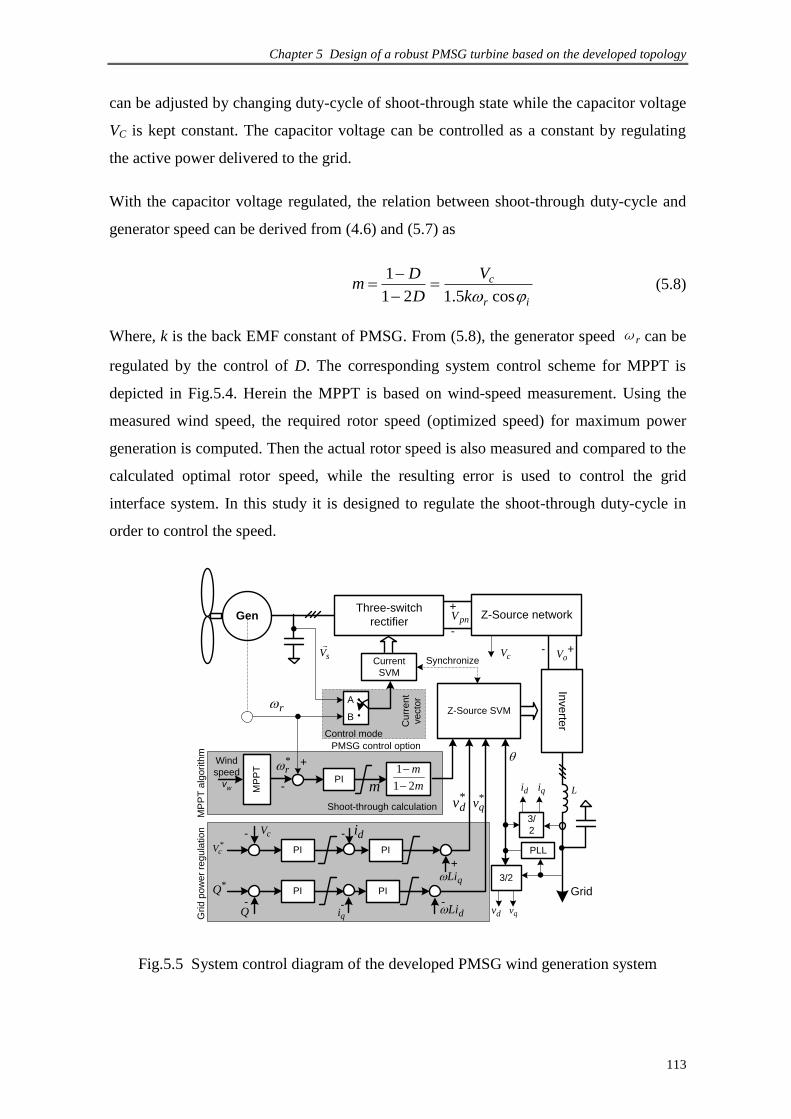
Chapter 5 Design of a robust PMSG turbine based on the developed topology
113
can be adjusted by changing duty-cycle of shoot-through state while the capacitor voltage
VC is kept constant. The capacitor voltage can be controlled as a constant by regulating
the active power delivered to the grid.
With the capacitor voltage regulated, the relation between shoot-through duty-cycle and
generator speed can be derived from (4.6) and (5.7) as
ir
c
k
V
D
Dm
cos5.121
1
(5.8)
Where, k is the back EMF constant of PMSG. From (5.8), the generator speed ωr can be
regulated by the control of D. The corresponding system control scheme for MPPT is
depicted in Fig.5.4. Herein the MPPT is based on wind-speed measurement. Using the
measured wind speed, the required rotor speed (optimized speed) for maximum power
generation is computed. Then the actual rotor speed is also measured and compared to the
calculated optimal rotor speed, while the resulting error is used to control the grid
interface system. In this study it is designed to regulate the shoot-through duty-cycle in
order to control the speed.
GenThree-switch
rectifierZ-Source network
Inve
rter
Grid
Wind
speed
vw M
PP
T
PI
Shoot-through calculation
PMSG control option
PIPI
Current
SVM
r
sV
Control mode
A
B
Cu
rre
nt
ve
cto
r
*r
m
+
- m
m
21
1
cV- -*cV
di
PLL
3/
2
3/2
di qi
qvdv
cV
+
-pnV
oV +-
PIPI
Q- -
*Q
qi
Z-Source SVM
*dv *
qv
Synchronize
MP
PT
alg
orith
mG
rid
po
we
r re
gu
latio
n
qLi
-
+
dLi
L
Fig.5.5 System control diagram of the developed PMSG wind generation system

Chapter 5 Design of a robust PMSG turbine based on the developed topology
114
The PMSG control scheme is presented in Fig.5.5. Any of the two different control
schemes mentioned are utilized to control the PMSG, which is decided by the wind power
obtained from (5.5). The Z-Source inverter serves as a power interface to feed captured
wind power into the grid. The detailed vector-control of the grid-side inverter is given in
the next section.
5.3.2 Control of power delivered into grid
The dynamic model of the grid connection when selecting a reference frame rotating
synchronously with the grid voltage space vector is
dqqiqq
qddidd
Liidt
dLRiuu
Liidt
dLRiuu
(5.9)
Where, L and R are the grid inductance and resistance, respectively, and uid and uiq are the
inverter voltage components. If the reference frame is oriented along the supply voltage,
the grid voltage vector is
u=ud+j0 (5.10)
Then the active and reactive power feeding into the grid can be expressed as
qd
dd
iuQ
iuP
5.1
5.1
(5.11)
Active and reactive power control can be implemented by controlling direct- and
quadrature-current, respectively. The control of the grid-side converter is presented in
Fig.5.5. An outer DC voltage control loop is used to set the d-axis current reference for
active power control. This makes sure all the power coming from the rectifier is
instantaneously fed into the grid by the Z-Source inverter. On the other hand, the second
current control loop is designed to control the reactive power by setting q-axis current
reference to a current loop. The current controller will provide a voltage reference for the
inverter that is compensated by adding the direct-axis and quadrature-axis intersection
terms.

Chapter 5 Design of a robust PMSG turbine based on the developed topology
115
5.4 Design consideration of the passive components
In this section, the passive components of the proposed topology are calculated
analytically based on the system operating condition. This provides the basis for the
design method for the various circuit components.
5.4.1 Parameters design of the Z-Source network
Based on the analysis in Section 4.4, the average current through the rectifier circuit is
equal to the sum of the average current through the inductor L1 and capacitor C1. In steady
state, the average current through the inductor equals to that of the rectifier. If the output
power is Po, therefore, the average current through the rectifier switches as well as the
inductor is
)cos5.1( iimopnoL VPVPI (5.12)
The Z-Source capacitor value is selected according to the voltage ripple and the capacitor
current. Then from the mode III in Fig.4.11, when the capacitor current equals the Z-
Source inductor current, then we get
s
C
L DTV
IC
(5.13)
If ∆VC is selected as ∆VC ≤ k1%VC, we have
o
iim
s
o
pn
sL
C
s
PVkD
DTD
PVkD
DTDI
Vk
DTC
221
211
cos%)1(25.2
)21(
%)1(
)21(
%
(5.14)
The Z-Source inductor value is selected according to the current ripple; from the mode III
again, the inductor voltage equals the Z-Source capacitor voltage, then we get
s
L
C DTI
VL
(5.15)

Chapter 5 Design of a robust PMSG turbine based on the developed topology
116
If ∆IL is selected as ∆IL ≤ k2% IL, we have
iim
o
s
pn
o
sC
L
s
VPkD
DTD
VPkD
DTDV
Ik
DTL
22
2
2
22
cos%)21(
)1(25.2
%)21(
)1(
%
(5.16)
5.4.2 Parameters design of the generator-side filter
Filters must be used at the input of the three-switch buck-type rectifier to reduce the
switching frequency harmonics presented in the input current. The filter requirements are
as follows:
1) To have a cutoff frequency lower than the switching frequency of the converter;
2) to minimize its reactive power at the rated condition;
3) to minimize the filter inductance voltage drop at rated current in order to avoid a
reduction in the voltage transfer ratio.
According to these guidelines, the reactive power of the filter usually has to be limited to
5~10% of the rated power in order to ensure high power factor, so the capacitance Cin of
the generator-side filter can be calculated by
2,,2
%)10~5(
rmsllinin
inin
Vf
PC
(5.17)
The generator-side filter inductance is designed by the cut-off frequency fc, which should
be lower than one-twentieth to one-tenth of the switching frequency fs. For a given filter
capacitor Cin then the filter inductance can be calculated by
insinc
inCfCf
L22 )1.02(
1
)2(
1
(5.18)
It should be noted that this generator-side filter inductance consists of the PMSG winding
inductance and the external filter inductor.

Chapter 5 Design of a robust PMSG turbine based on the developed topology
117
5.5 Simulation and experimental verification
To verify the performance of the proposed wind generation system, simulation tests have
been carried out. Major system parameters are listed in Table 5.1 according to the design
consideration in the previous section.
Table 5.1 System Parameters of the Proposed Systems
System ratings
Grid line-line voltage 127V / 50Hz
DC capacitor voltage 240 V
Cut-in wind speed 4 m/s
Rated wind speed 16 m/s
Generator parameter
Rated power 1.5 KW
Rated frequency 50 Hz
Winding resistance 1.2
Winding inductance 6 mH
Number of poles 4
Rotor inertia 5.66 x 10⁻³ kgm2
Back EMF constant 0.832 V/ rad/s
Converter parameter
Z-Source inductance 5 mH
Z-Source capacitance 1000 uF
Switching frequency 5 kHz
Grid-side inductance 5 mH
Generator-side inductance 1 mH
Generator-side capacitance 15 uF
5.5.1 Simulation results
In this simulation, the system is driven by a wind turbine model provided by
Matlab/Simulink. The turbine model receives the wind speed and provides an optimized
reference speed to the control system. The simulation results are shown in Fig. 5.6~5.12.
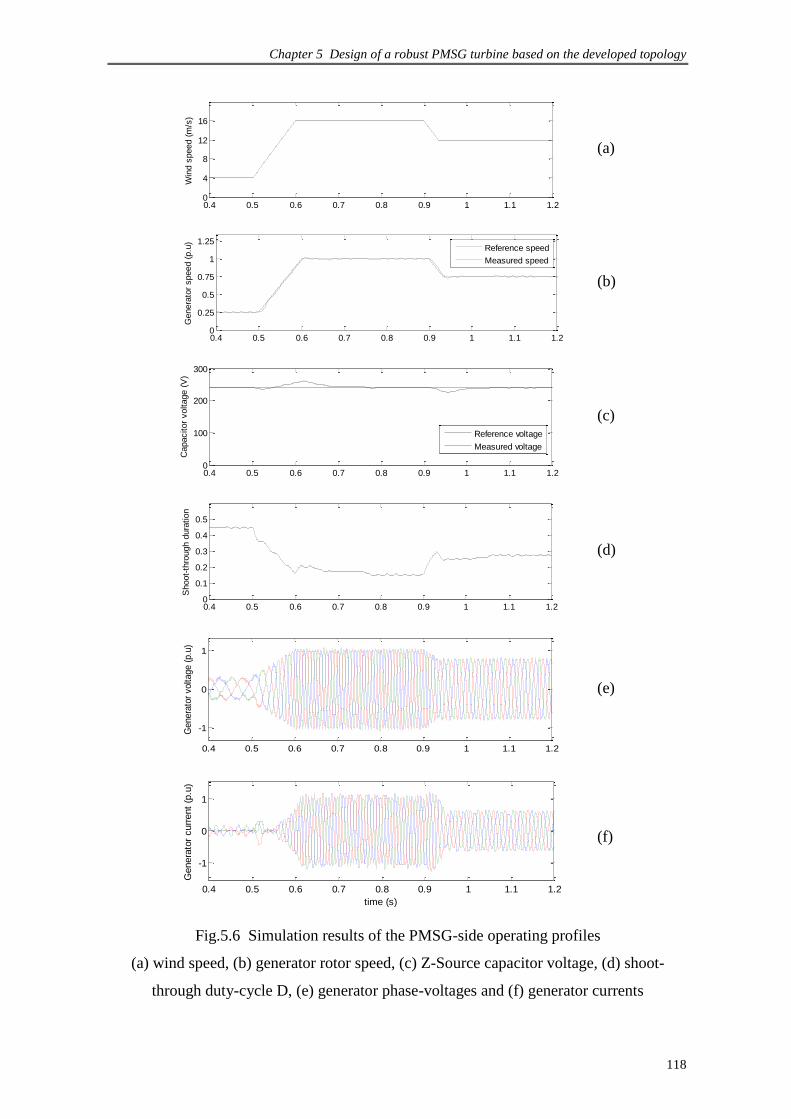
Chapter 5 Design of a robust PMSG turbine based on the developed topology
118
0.4 0.5 0.6 0.7 0.8 0.9 1 1.1 1.20
4
8
12
16
Win
d s
peed (
m/s
)
(a)
0.4 0.5 0.6 0.7 0.8 0.9 1 1.1 1.20
0.25
0.5
0.75
1
1.25
Genera
tor
speed (
p.u
)
Reference speed
Measured speed
(b)
0.4 0.5 0.6 0.7 0.8 0.9 1 1.1 1.20
100
200
300
Capacitor
voltage (
V)
Reference voltage
Measured voltage
(c)
0.4 0.5 0.6 0.7 0.8 0.9 1 1.1 1.20
0.1
0.2
0.3
0.4
0.5
Shoot-
thro
ugh d
ura
tion
(d)
0.4 0.5 0.6 0.7 0.8 0.9 1 1.1 1.2
-1
0
1
Genera
tor
voltage (
p.u
)
(e)
0.4 0.5 0.6 0.7 0.8 0.9 1 1.1 1.2
-1
0
1
time (s)
Genera
tor
curr
ent
(p.u
)
(f)
Fig.5.6 Simulation results of the PMSG-side operating profiles
(a) wind speed, (b) generator rotor speed, (c) Z-Source capacitor voltage, (d) shoot-
through duty-cycle D, (e) generator phase-voltages and (f) generator currents

Chapter 5 Design of a robust PMSG turbine based on the developed topology
119
In order to simulate the transient response of the proposed control system, wind speed is
assumed to have a step-up from 4 m/s to 16 m/s at 0.5 s, and a step-down from 16 m/s to
12 m/s at 0.9 s. Herein, 4 m/s and 16 m/s are the cut-in and the rated wind speeds,
respectively. Figure 5.6 illustrates the operating waveforms of the generator-side
converter. The reference speed for MPPT is shown in Fig.5.6(b). Figure 5.6 (c) shows the
Z-Source capacitor voltage, which is controlled to 240V by the grid-side d-axis controller.
At the instant when the wind speed steps up, the speed regulator reduces the shoot-
through duty-cycle, thus helping to speed up the generator speed. The dynamic response
of the shoot-through duty-cycle is shown in Fig.5.6 (d). The increase of the generator
speed leads to higher generator voltages and currents, and hence higher generator output
power. The transient PMSG phase-voltages and currents are shown in Fig.5.6 (e) and (f),
respectively. The above analysis approach is also viable to study the generator operating
condition when wind speed is step-down.
Figure 5.7 illustrates the grid-side characteristics of the proposed wind generation system.
Herein, the negative value in Fig.5.7 (b) and (c) means the power is flowing into grid. The
performance of MPPT can be evaluated from the power curves shown in Fig.5.7 (a) and
(b). With the grid power regulation, the capacitor voltage is controlled to a constant 240V
as shown in Fig.5.6 (c) and thereby the captured wind power can be fully fed into grid.
This function is similar to that of grid-side inverter in the conventional power generation
system [26].
The reactive power output is presented in Fig.5.7 (c). The reference of the reactive power
is assumed to have a step-up from 0 to -0.22 pu at 1.1 s. It can be seen from Fig.5.6 and
5.7 that the active and reactive power can be regulated independently. This helps to
overcome the ride-through problem, which is an important issue in the grid-connected
wind generation system. The grid-side d-axis and q-axis currents are also presented in
Fig.5.7 (d) and (e), respectively.
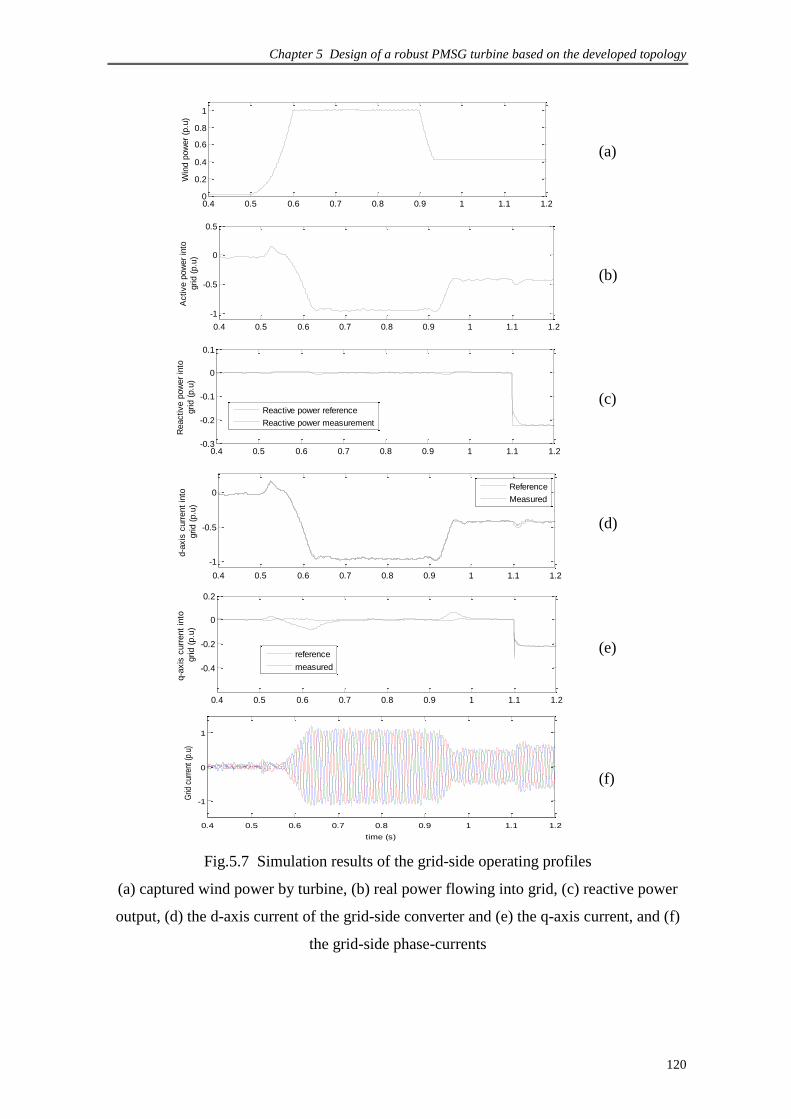
Chapter 5 Design of a robust PMSG turbine based on the developed topology
120
0.4 0.5 0.6 0.7 0.8 0.9 1 1.1 1.20
0.2
0.4
0.6
0.8
1
Win
d p
ow
er
(p.u
)
(a)
0.4 0.5 0.6 0.7 0.8 0.9 1 1.1 1.2
-1
-0.5
0
0.5
Active p
ow
er
into
grid (
p.u
)
(b)
0.4 0.5 0.6 0.7 0.8 0.9 1 1.1 1.2-0.3
-0.2
-0.1
0
0.1
Reactive p
ow
er
into
grid (
p.u
)
Reactive power reference
Reactive power measurement
(c)
0.4 0.5 0.6 0.7 0.8 0.9 1 1.1 1.2
-1
-0.5
0
d-a
xis
curr
ent
into
grid (
p.u
)
Reference
Measured
(d)
0.4 0.5 0.6 0.7 0.8 0.9 1 1.1 1.2
-0.4
-0.2
0
0.2
q-a
xis
curr
ent
into
grid (
p.u
)
reference
measured
(e)
0.4 0.5 0.6 0.7 0.8 0.9 1 1.1 1.2
-1
0
1
time (s)
Grid
cur
rent
(p.
u)
(f)
Fig.5.7 Simulation results of the grid-side operating profiles
(a) captured wind power by turbine, (b) real power flowing into grid, (c) reactive power
output, (d) the d-axis current of the grid-side converter and (e) the q-axis current, and (f)
the grid-side phase-currents
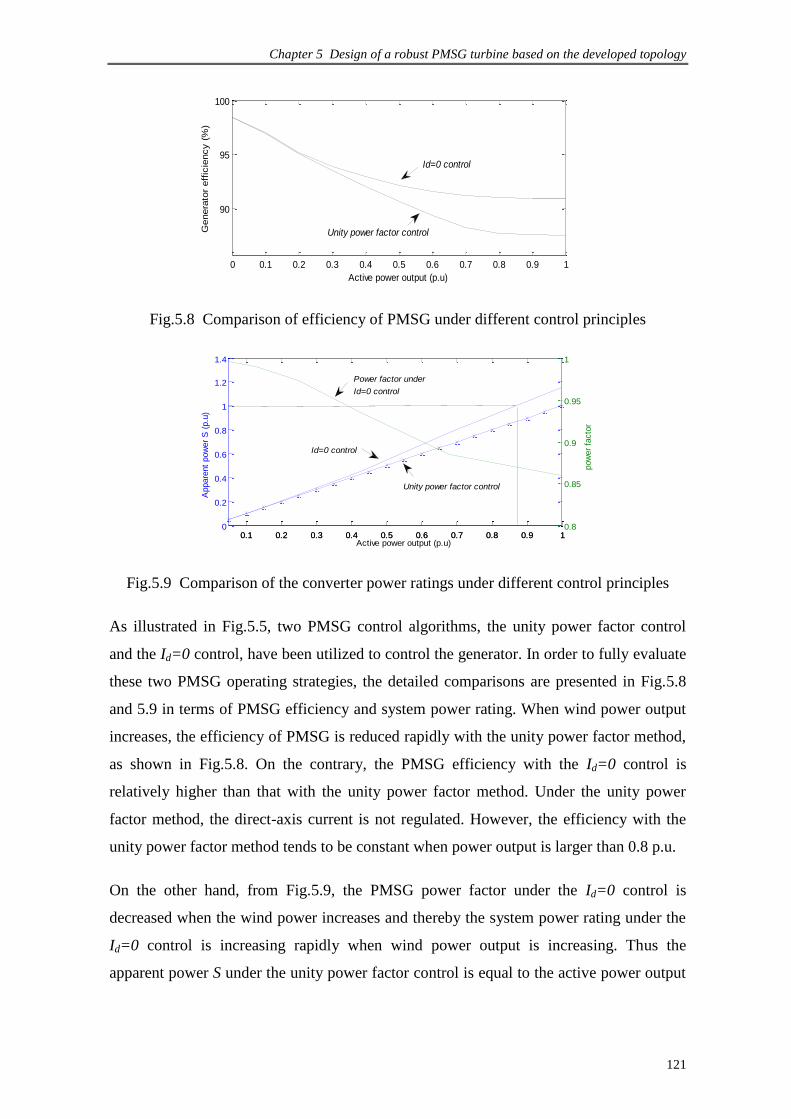
Chapter 5 Design of a robust PMSG turbine based on the developed topology
121
0 0.1 0.2 0.3 0.4 0.5 0.6 0.7 0.8 0.9 1
90
95
100
Active power output (p.u)
Genera
tor
eff
icie
ncy (
%)
Unity power factor control
Id=0 control
Fig.5.8 Comparison of efficiency of PMSG under different control principles
0.1 0.2 0.3 0.4 0.5 0.6 0.7 0.8 0.9 10
0.2
0.4
0.6
0.8
1
1.2
1.4
Appare
nt
pow
er
S (
p.u
)
0.1 0.2 0.3 0.4 0.5 0.6 0.7 0.8 0.9 10.8
0.85
0.9
0.95
1
pow
er
facto
r
Unity power factor control
Id=0 control
Power factor under
Id=0 control
Active power output (p.u)
Fig.5.9 Comparison of the converter power ratings under different control principles
As illustrated in Fig.5.5, two PMSG control algorithms, the unity power factor control
and the Id=0 control, have been utilized to control the generator. In order to fully evaluate
these two PMSG operating strategies, the detailed comparisons are presented in Fig.5.8
and 5.9 in terms of PMSG efficiency and system power rating. When wind power output
increases, the efficiency of PMSG is reduced rapidly with the unity power factor method,
as shown in Fig.5.8. On the contrary, the PMSG efficiency with the Id=0 control is
relatively higher than that with the unity power factor method. Under the unity power
factor method, the direct-axis current is not regulated. However, the efficiency with the
unity power factor method tends to be constant when power output is larger than 0.8 p.u.
On the other hand, from Fig.5.9, the PMSG power factor under the Id=0 control is
decreased when the wind power increases and thereby the system power rating under the
Id=0 control is increasing rapidly when wind power output is increasing. Thus the
apparent power S under the unity power factor control is equal to the active power output

Chapter 5 Design of a robust PMSG turbine based on the developed topology
122
P. Hence, with the converter power rating constraint, it is superior to use the unity power
factor control considering its full real power transfer capability.
The proposed PMSG control strategy is the integration of the unity power factor control
and the Id=0 control. Based on the discussion in Section 5.2.3, we assume the converter
power rating to be 1 p.u. Consequently, the wind power boundary is chosen as 0.87 p.u,
as illustrated in Fig.5.9. From (5.5), the speed boundary can be obtained as 0.95 p.u. That
means the Id=0 control is adopted when wind power output is smaller than 0.87 pu and
the unity power factor method is utilized when wind power output is larger than 0.87 pu.
The main objective of the proposed control strategy is to optimize the performance in
terms of the system cost and efficiency.
Another important motivation to develop the proposed wind generation system is its low-
harmonic characteristic. The proposed converter is compared with the conventional
diode-front system and back-to-back converter, as shown in Fig.2.9 and 2.10, respectively.
Figure 5.10, 5.11 and 5.12 shows the simulation results of PMSG terminal phase-voltage /
current and the FFT spectrum/ total harmonic distortion (THD) of the current waveform.
The generator speed along with wind speed is set as 0.4 p.u in both Fig.5.10, 5.11 and
5.12. The terminal phase-voltage is filtered by a second-order filter with 1000 Hz cut-off
frequency and the same switching frequency is utilized in these three systems. It can be
seen from Fig.5.10 that there are no low-order harmonics in the generator. This low-
harmonic characteristic result from the utilization of the generator-side three-switch buck-
type converter, and the THD of the generator current is only 2.76%. Figure 5.11 presents
the simulation results of phase-voltage/current obtained by the diode front-end
conventional system shown in Fig. 2.9. From Fig.5.11, there are significant 5th-order and
7th-order harmonics in the stator current. The current THD is up to 6.65%, which is much
larger than that in the proposed system. High harmonic distortion currents also appeared
in the generator that further reduce efficiency and produce torque oscillations. These are
the drawbacks of the conventional diode front-end system. Figure 5.12 presents the
simulation results of the back-to-back system. The current THD is only 2.2% and low-
order harmonics are absent. However, the back-to-back converter would be much more
expensive than other two topologies, especially for high power application.
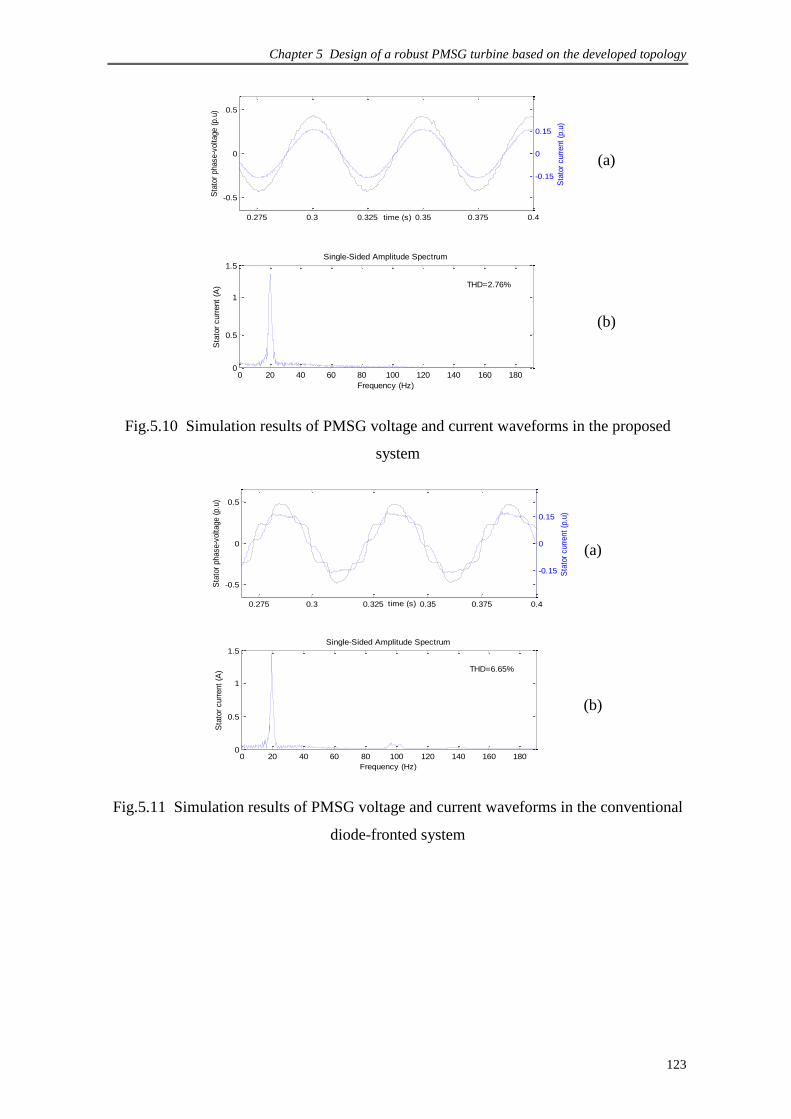
Chapter 5 Design of a robust PMSG turbine based on the developed topology
123
0.275 0.3 0.325 0.35 0.375 0.4
-0.5
0
0.5
Sta
tor
phase-v
oltage (
p.u
)
-0.15
0
0.15
time (s)
Sta
tor
curr
ent
(p.u
)
(a)
0 20 40 60 80 100 120 140 160 1800
0.5
1
1.5Single-Sided Amplitude Spectrum
Frequency (Hz)
Sta
tor
curr
ent
(A)
THD=2.76%
(b)
Fig.5.10 Simulation results of PMSG voltage and current waveforms in the proposed
system
0.275 0.3 0.325 0.35 0.375 0.4
-0.5
0
0.5
time (s)
Sta
tor
phase-v
oltage (
p.u
)
-0.15
0
0.15
Sta
tor
curr
ent
(p.u
)
(a)
0 20 40 60 80 100 120 140 160 1800
0.5
1
1.5Single-Sided Amplitude Spectrum
Frequency (Hz)
Sta
tor
curr
ent
(A) THD=6.65%
(b)
Fig.5.11 Simulation results of PMSG voltage and current waveforms in the conventional
diode-fronted system
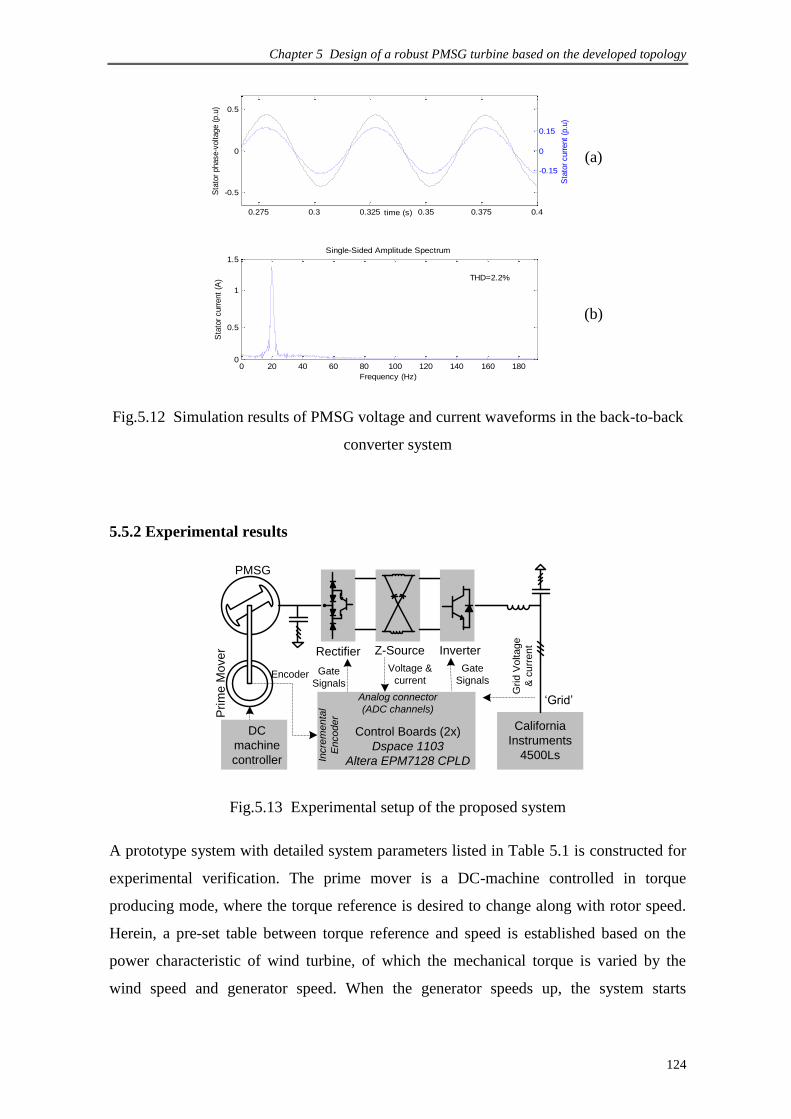
Chapter 5 Design of a robust PMSG turbine based on the developed topology
124
0.275 0.3 0.325 0.35 0.375 0.4
-0.5
0
0.5
Sta
tor
phase-v
oltage (
p.u
)
-0.15
0
0.15
time (s)
Sta
tor
curr
ent
(p.u
)
(a)
0 20 40 60 80 100 120 140 160 1800
0.5
1
1.5Single-Sided Amplitude Spectrum
Frequency (Hz)
Sta
tor
curr
ent
(A) THD=2.2%
(b)
Fig.5.12 Simulation results of PMSG voltage and current waveforms in the back-to-back
converter system
5.5.2 Experimental results
PMSG
Prim
e M
ove
r
Encoder
Rectifier Z-Source Inverter
California
Instruments
4500Ls
Analog connector
(ADC channels)
Incre
me
nta
l
En
co
de
r
Control Boards (2x)
Dspace 1103
Altera EPM7128 CPLD
‘Grid’
Grid
Vo
lta
ge
& c
urr
en
t
Voltage &
currentGate
Signals
Gate
Signals
DC
machine
controller
Fig.5.13 Experimental setup of the proposed system
A prototype system with detailed system parameters listed in Table 5.1 is constructed for
experimental verification. The prime mover is a DC-machine controlled in torque
producing mode, where the torque reference is desired to change along with rotor speed.
Herein, a pre-set table between torque reference and speed is established based on the
power characteristic of wind turbine, of which the mechanical torque is varied by the
wind speed and generator speed. When the generator speeds up, the system starts
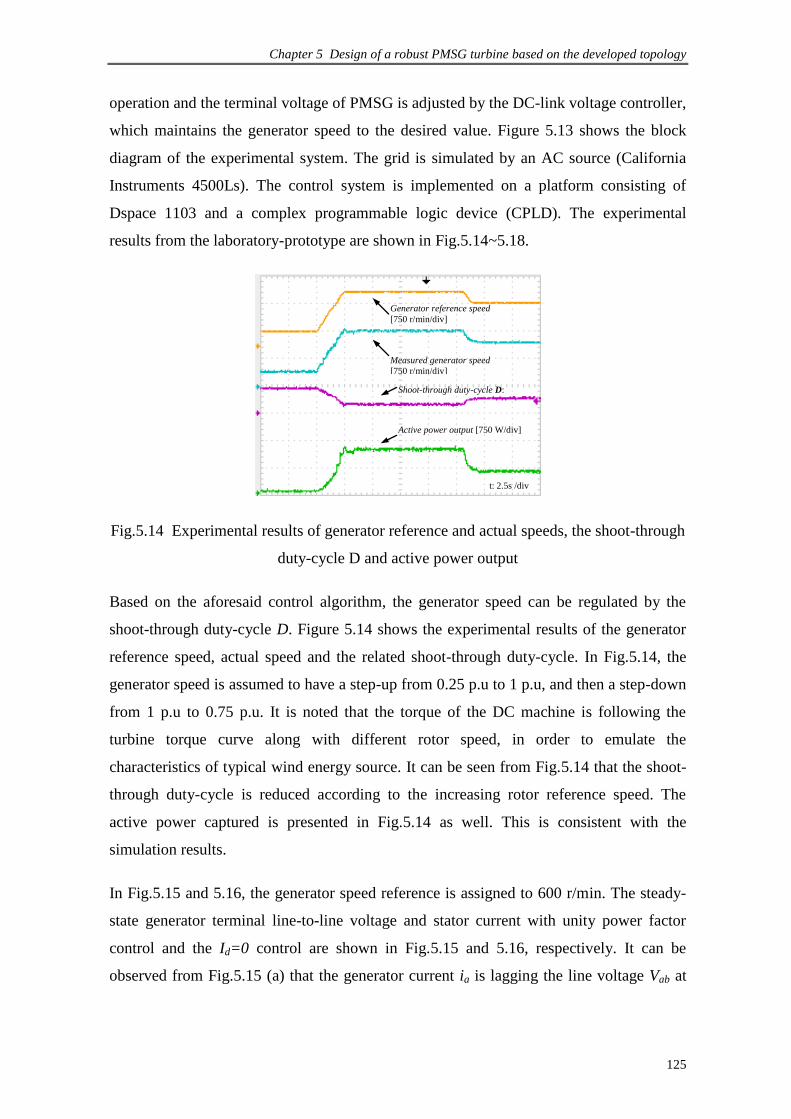
Chapter 5 Design of a robust PMSG turbine based on the developed topology
125
operation and the terminal voltage of PMSG is adjusted by the DC-link voltage controller,
which maintains the generator speed to the desired value. Figure 5.13 shows the block
diagram of the experimental system. The grid is simulated by an AC source (California
Instruments 4500Ls). The control system is implemented on a platform consisting of
Dspace 1103 and a complex programmable logic device (CPLD). The experimental
results from the laboratory-prototype are shown in Fig.5.14~5.18.
Fig.5.14 Experimental results of generator reference and actual speeds, the shoot-through
duty-cycle D and active power output
Based on the aforesaid control algorithm, the generator speed can be regulated by the
shoot-through duty-cycle D. Figure 5.14 shows the experimental results of the generator
reference speed, actual speed and the related shoot-through duty-cycle. In Fig.5.14, the
generator speed is assumed to have a step-up from 0.25 p.u to 1 p.u, and then a step-down
from 1 p.u to 0.75 p.u. It is noted that the torque of the DC machine is following the
turbine torque curve along with different rotor speed, in order to emulate the
characteristics of typical wind energy source. It can be seen from Fig.5.14 that the shoot-
through duty-cycle is reduced according to the increasing rotor reference speed. The
active power captured is presented in Fig.5.14 as well. This is consistent with the
simulation results.
In Fig.5.15 and 5.16, the generator speed reference is assigned to 600 r/min. The steady-
state generator terminal line-to-line voltage and stator current with unity power factor
control and the Id=0 control are shown in Fig.5.15 and 5.16, respectively. It can be
observed from Fig.5.15 (a) that the generator current ia is lagging the line voltage Vab at
Generator reference speed
[750 r/min/div]
Measured generator speed
[750 r/min/div]
Shoot-through duty-cycle D:
[0.5/div]
Active power output [750 W/div]
t: 2.5s /div
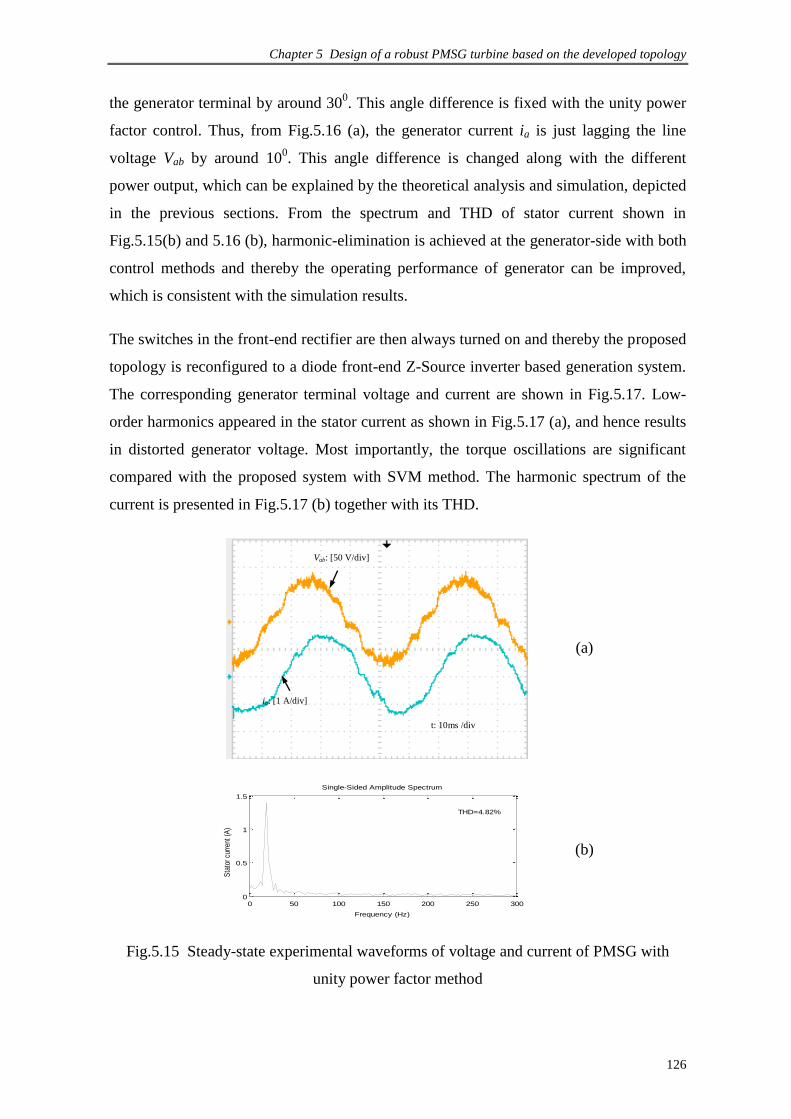
Chapter 5 Design of a robust PMSG turbine based on the developed topology
126
the generator terminal by around 300. This angle difference is fixed with the unity power
factor control. Thus, from Fig.5.16 (a), the generator current ia is just lagging the line
voltage Vab by around 100. This angle difference is changed along with the different
power output, which can be explained by the theoretical analysis and simulation, depicted
in the previous sections. From the spectrum and THD of stator current shown in
Fig.5.15(b) and 5.16 (b), harmonic-elimination is achieved at the generator-side with both
control methods and thereby the operating performance of generator can be improved,
which is consistent with the simulation results.
The switches in the front-end rectifier are then always turned on and thereby the proposed
topology is reconfigured to a diode front-end Z-Source inverter based generation system.
The corresponding generator terminal voltage and current are shown in Fig.5.17. Low-
order harmonics appeared in the stator current as shown in Fig.5.17 (a), and hence results
in distorted generator voltage. Most importantly, the torque oscillations are significant
compared with the proposed system with SVM method. The harmonic spectrum of the
current is presented in Fig.5.17 (b) together with its THD.
(a)
0 50 100 150 200 250 3000
0.5
1
1.5
Single-Sided Amplitude Spectrum
Frequency (Hz)
Sta
tor
curr
ent
(A)
THD=4.82%
(b)
Fig.5.15 Steady-state experimental waveforms of voltage and current of PMSG with
unity power factor method
Vab: [50 V/div]
ia: [1 A/div]
t: 10ms /div
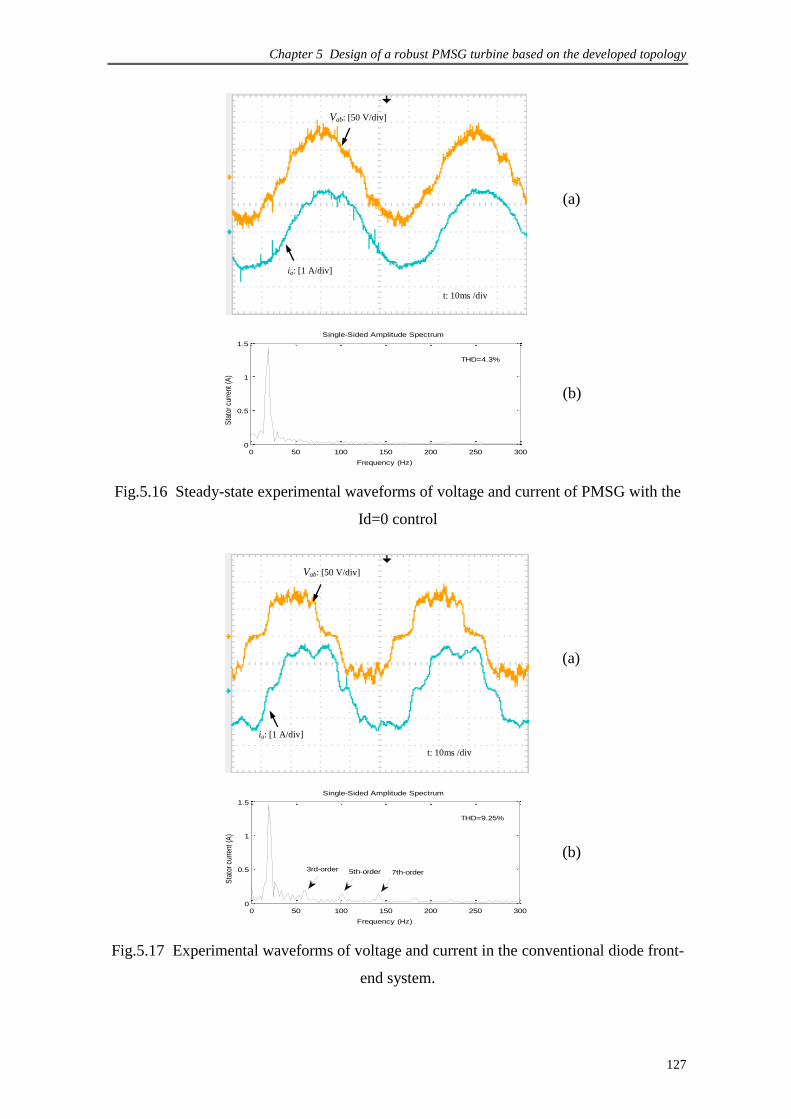
Chapter 5 Design of a robust PMSG turbine based on the developed topology
127
(a)
0 50 100 150 200 250 3000
0.5
1
1.5
Single-Sided Amplitude Spectrum
Frequency (Hz)
Sta
tor
curr
ent
(A)
THD=4.3%
(b)
Fig.5.16 Steady-state experimental waveforms of voltage and current of PMSG with the
Id=0 control
(a)
0 50 100 150 200 250 3000
0.5
1
1.5
Single-Sided Amplitude Spectrum
Frequency (Hz)
Sta
tor
curr
ent
(A)
7th-order5th-order3rd-order
THD=9.25%
(b)
Fig.5.17 Experimental waveforms of voltage and current in the conventional diode front-
end system.
Vab: [50 V/div]
t: 10ms /div
ia: [1 A/div]
t: 10ms /div
Vab: [50 V/div]
ia: [1 A/div]
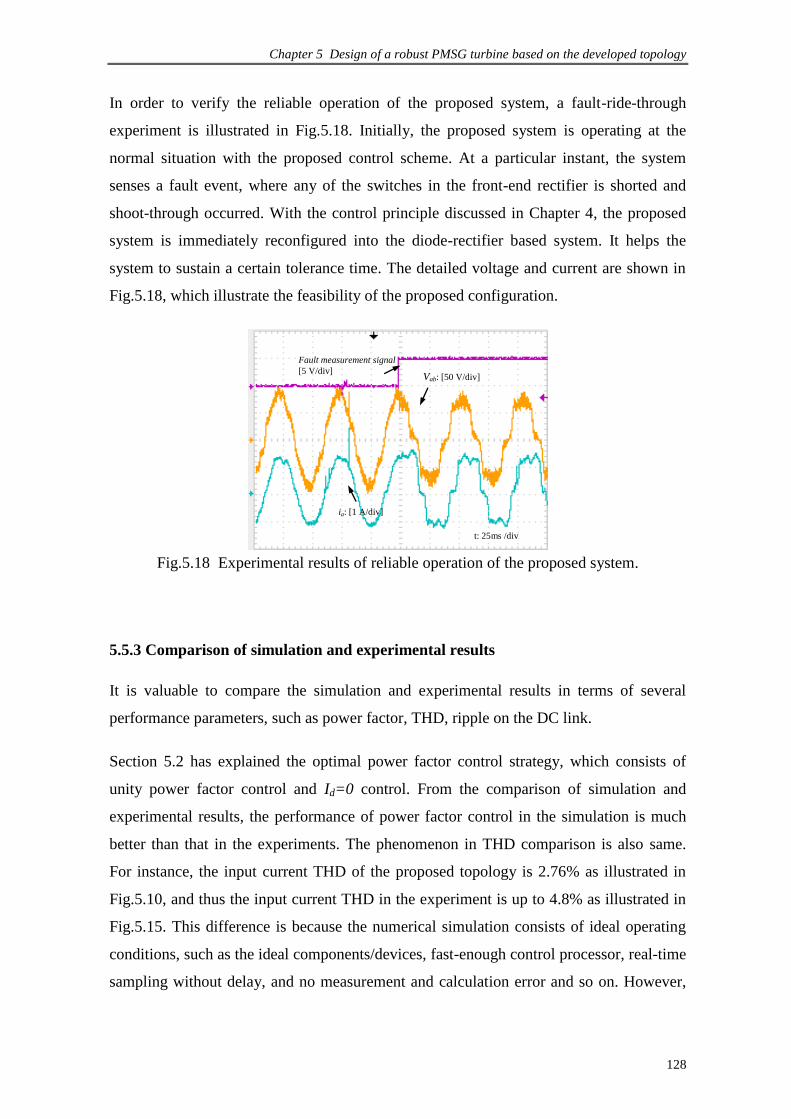
Chapter 5 Design of a robust PMSG turbine based on the developed topology
128
In order to verify the reliable operation of the proposed system, a fault-ride-through
experiment is illustrated in Fig.5.18. Initially, the proposed system is operating at the
normal situation with the proposed control scheme. At a particular instant, the system
senses a fault event, where any of the switches in the front-end rectifier is shorted and
shoot-through occurred. With the control principle discussed in Chapter 4, the proposed
system is immediately reconfigured into the diode-rectifier based system. It helps the
system to sustain a certain tolerance time. The detailed voltage and current are shown in
Fig.5.18, which illustrate the feasibility of the proposed configuration.
Fig.5.18 Experimental results of reliable operation of the proposed system.
5.5.3 Comparison of simulation and experimental results
It is valuable to compare the simulation and experimental results in terms of several
performance parameters, such as power factor, THD, ripple on the DC link.
Section 5.2 has explained the optimal power factor control strategy, which consists of
unity power factor control and Id=0 control. From the comparison of simulation and
experimental results, the performance of power factor control in the simulation is much
better than that in the experiments. The phenomenon in THD comparison is also same.
For instance, the input current THD of the proposed topology is 2.76% as illustrated in
Fig.5.10, and thus the input current THD in the experiment is up to 4.8% as illustrated in
Fig.5.15. This difference is because the numerical simulation consists of ideal operating
conditions, such as the ideal components/devices, fast-enough control processor, real-time
sampling without delay, and no measurement and calculation error and so on. However,
t: 25ms /div
Vab: [50 V/div]
ia: [1 A/div]
Fault measurement signal
[5 V/div]

Chapter 5 Design of a robust PMSG turbine based on the developed topology
129
in the lab-based prototype, the power semiconductor switch, i.e., IGBT, is definitely not
like the ideal switch used in the simulation. Normally the real switch has switching loss,
reverse current, internal resistance and so on, and all of these non-ideal factors will affect
the system performance.
5.5.4 Comparison with other topology
The comparison of Z-Source inverter and traditional inverters was investigated in [108]
using cost, efficiency and passive components requirement as benchmarks. The Z-Source
inverter exhibits a better performance than other topologies from the comparison results.
Herein, the corresponding performance indices will be extended to evaluate the proposed
converter and the back-to-back converter. First, the converter cost can be judged by the
total average switching device power (SDP) and peak SDP [108], which are defined as
follow,
N
j
avjjav IVSDP1
,)( , and
N
j
pkjjpk IVSDP1
,)( (5.19)
Where, N is the number of switching devices, Vj is the peak voltage induced on the
devices, and Ij,av and Ij,pk are the average and peak current through the devices,
respectively. The total SDPs of both topologies are calculated, as shown in Table 5.2,
based on the operating condition in Table 5.1. It can be seen from Table 5.2 that the total
SDP of the back-to-back converter is much greater than that of the proposed converter in
average and peak value, respectively.
On the other hand, the shoot-through problem, which is usually the main weak-link of the
system reliability, does not exist in the proposed converter. Therefore, the developed
topology is able to improve system reliability.

Chapter 5 Design of a robust PMSG turbine based on the developed topology
130
Table 5.2 Comparison between the back-to-back converter and the developed converter
Relationship Items Back-to-back
converter
Developed
converter
Total SDP
Number of switching
device 12 9
(SDP)av (kVA) 10.85 9.66
(SDP)pk (kVA) 34.06 21.05
5.6 Conclusion
In this chapter, the design methodology, the simulation studies, and the experimental
verification of an integrated generator-side buck-type rectifier and grid-side Z-Source
inverter based PMSG wind generation system have been presented. The proposed
generator-side control strategy was optimized from the fundamentals of the Id=0 control
and unity power factor method. The voltage-oriented control was adapted for the Z-
Source inverter to decouple active and reactive power control while extracting the
maximum wind power by adjusting the shoot-through duration of the Z-Source network.
Compared with the traditional back-to-back converter, the shoot-through operation is
allowed in the grid-side Z-source inverter and the reconfiguration of the generator-side
converter is enabling the wind turbine to maintain the safety operation during faults of the
power semiconductors in the generator-side converter. All the aforementioned
characteristics are helpful to improve the reliability of the PMSG based wind turbine.

Chapter 6 Statistical Voltage Quality Assessment Method for Grids with Wind Power Generation
131
CHAPTER 6
STATISTICAL VOLTAGE QUALITY ASSESSMENT METHOD FOR GRIDS
WITH WIND POWER GENERATION
6.1 Introduction
Regardless of DFIG or PMSG, wind power capacity will be meeting a significant
percentage of the worldwide electricity demand in the next decade, especially in western
European countries. Consequently, wind power will affect the operation of utility in terms
of voltage regulation, frequency control and so on. Thus there is a need to devise reliable
methods to accurately quantify the impacts so as to obtain the most appropriate and
economical solution to mitigate the negative impacts. Hence, this chapter intends to
develop a feasible voltage quality analysis for large wind power penetrated networks.
The method proposed in this chapter calculates the impact of wind power penetration on
network voltage in a statistical manner: the wind power injection and the state of the
connected grid are described in terms of probabilistic distributions. An index, termed the
significant level of voltage deviation, is developed to quantify the level of the voltage
variations. The index helps in identifying the most effective remedial actions in restoring
voltage quality to an acceptable level. A case study is included to illustrate the relatively
simple calculation involved.
6.2 Preliminary considerations
6.2.1 Network description
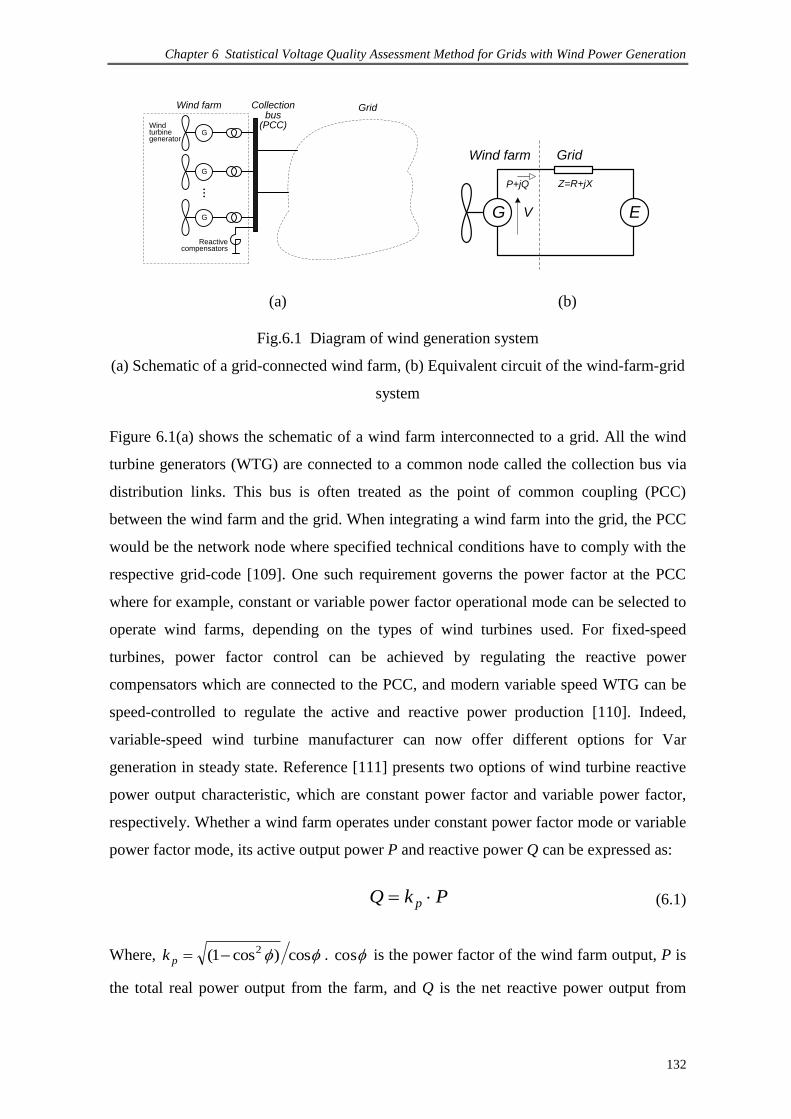
Chapter 6 Statistical Voltage Quality Assessment Method for Grids with Wind Power Generation
132
Wind farm Collectionbus
(PCC)Windturbinegenerator
G
G
G
…
Grid
Reactivecompensators
Wind farm
V
Z=R+jXP+jQ
G E
Grid
(a) (b)
Fig.6.1 Diagram of wind generation system
(a) Schematic of a grid-connected wind farm, (b) Equivalent circuit of the wind-farm-grid
system
Figure 6.1(a) shows the schematic of a wind farm interconnected to a grid. All the wind
turbine generators (WTG) are connected to a common node called the collection bus via
distribution links. This bus is often treated as the point of common coupling (PCC)
between the wind farm and the grid. When integrating a wind farm into the grid, the PCC
would be the network node where specified technical conditions have to comply with the
respective grid-code [109]. One such requirement governs the power factor at the PCC
where for example, constant or variable power factor operational mode can be selected to
operate wind farms, depending on the types of wind turbines used. For fixed-speed
turbines, power factor control can be achieved by regulating the reactive power
compensators which are connected to the PCC, and modern variable speed WTG can be
speed-controlled to regulate the active and reactive power production [110]. Indeed,
variable-speed wind turbine manufacturer can now offer different options for Var
generation in steady state. Reference [111] presents two options of wind turbine reactive
power output characteristic, which are constant power factor and variable power factor,
respectively. Whether a wind farm operates under constant power factor mode or variable
power factor mode, its active output power P and reactive power Q can be expressed as:
PkQ p (6.1)
Where, cos)cos1( 2pk . cos is the power factor of the wind farm output, P is
the total real power output from the farm, and Q is the net reactive power output from

Chapter 6 Statistical Voltage Quality Assessment Method for Grids with Wind Power Generation
133
both the WTG and the wind farm reactive power compensator. It is worthy to mention
that pk has a fixed value under constant power factor operational mode of the wind farm,
and would be variable under variable power factor mode.
From Fig. 6.1(a), the grid can be represented by its Thevenin equivalent circuit viewed
from the PCC. In this representation, the voltage at the bus is denoted as V. The voltage
source E equals to the no-load voltage at the bus. It can be readily shown that the
equivalent Thevenin impedance Z = jXR (in p.u.) is governed by the short circuit ratio
(ζ) and the R/X ratio (γ) at the PCC, as follows:
20
2
20
2
1
1
1
S
EX
S
ER
(6.2)
where 0S is the rated power. Equation (6.2) is useful as very often, the terminal condition
for the wind farm connection is expressed in terms of ζ and γ, instead of Z.
6.2.2 Impact on the PCC voltage
As soon as the wind farm begins to inject power P + jQ (at a particular power factor cos )
into the grid, the voltage at the PCC will deviate from E. With respect to Fig.6.1(b), the
voltage deviation can be expressed approximately as:
V
XQRPEVV
(6.3)
Together with (6.1), (6.3) can then be rewritten as:
PV
XkRV
p
(6.4)

Chapter 6 Statistical Voltage Quality Assessment Method for Grids with Wind Power Generation
134
It can be seen from (6.4) that the voltage deviation ΔV is directly proportional to the wind
farm output power P and the grid Thevenin equivalent R, X values. It should be
emphasized that (6.4) only yields the steady-state value of the voltage variation, assuming
over the interval of interest, no network control action has been initiated within the grid to
vary Z or E.
The impact of the wind farm output power on the PCC voltage quality can be readily
assessed via (6.4). Unfortunately, as will be described in greater detail in the next section,
the WTG power output depends on the prevailing wind condition. As wind speed varies
and when the wind farm operates under power factor control mode, the PCC voltage will
vary in response to the fluctuating wind farm power production. Excessive voltage
variations should not be allowed as it would lead to equipment damage. Allowable
voltage variation applicable for wind farm operation has been prescribed in standards
such as [87]. ΔV has to comply with the steady-state or long-term voltage deviation limit
allowable in the respective standards.
For the problem in hand, an additional complication arises because the grid Thevenin
impedance would also vary over the long-term. Clearly as network topology changes due
to the switching in and out of network elements, upgrading and/or retiring of equipment,
normal generation/load variations, these changes will inevitably lead to variations in ζ and
γ and hence Z.
With the statistical and time-varying nature of P and Z taken into consideration, one needs
to examine not only the degree of severity of the resulting voltage deviations but also the
likelihood of their occurrence. An operating condition which leads to an unacceptable
voltage variation at the PCC and which has a high probability of occurrence warrants
closer design consideration than one which is seen to occur less often. With these points
in mind and unlike the approaches described in [85, 86], a new statistical approach will be
proposed in the next Section to analyze the voltage quality at the PCC.
6.3 Probabilistic analysis of PCC voltage deviation
As stated earlier, P relies on the availability of the wind and Z depends on the operating
state of the network. Probabilistic analysis has been used to estimate wind farm output P

Chapter 6 Statistical Voltage Quality Assessment Method for Grids with Wind Power Generation
135
while statistical concept has been applied in [112] to analyze operating state of power
system elements. The approach described in this section is an attempt to apply these
techniques to obtain the probabilistic evaluation of ΔV at the PCC.
6.3.1 Probabilistic model of wind power generation
In the literature, Weibull distribution function has been widely used to statistically
describe wind speed distribution [113]. The probability density function (pdf) of wind
speed is given by:
])(exp[))(()( 1 kk
c
v
c
v
c
kvf (6.5)
where v is the wind speed, k is the shape coefficient and c is the scale coefficient. In
handling wind speed data, it is convenient to sub-divide the continuous speed range into
sub-sections or states and characterize the probability distribution of v in terms of these
states. Hence from (6.5), one can express the probability distribution of v as a set of
discrete data
},,1,0:)(),({ NllFlvF vv (6.6)
where N is the total number of the discrete wind speed states, and )(lv is the discrete wind
speed value over the speed range }2/)(,2/)({ lvlv , being the width of the speed
range. Typically, sm /1 . According to (6.5), the probability )(lFv of the discrete
wind speed is then given by
}]2/)(
[exp{}]2/)(
[exp{)()(
2/)(
2/)(
kk
lv
lv
vc
lv
c
lvdvvflF
(6.7)
An example of the discrete probability distribution of v is shown on Fig.6.2, with
sm /1 .
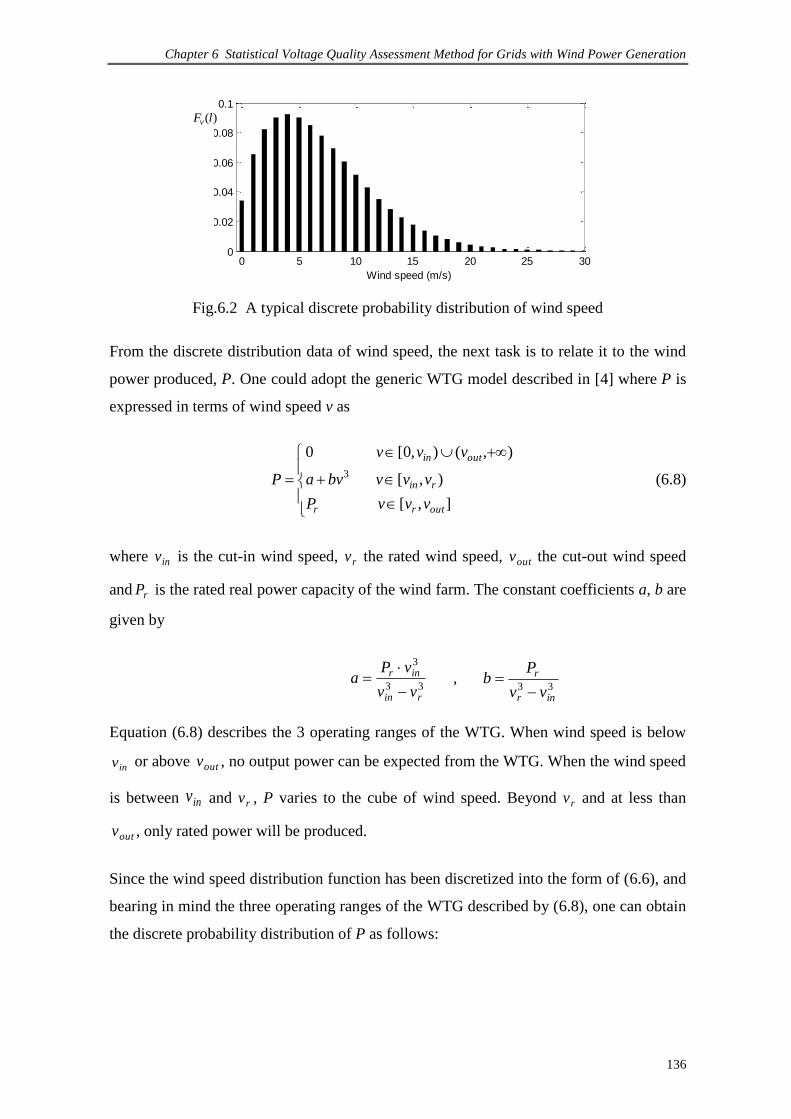
Chapter 6 Statistical Voltage Quality Assessment Method for Grids with Wind Power Generation
136
0 5 10 15 20 25 300
0.02
0.04
0.06
0.08
0.1
Wind speed (m/s)
Dis
cre
te p
robabili
ty
Fig.6.2 A typical discrete probability distribution of wind speed
From the discrete distribution data of wind speed, the next task is to relate it to the wind
power produced, P. One could adopt the generic WTG model described in [4] where P is
expressed in terms of wind speed v as
],[
),[
),(),0[0
3
outrr
rin
outin
vvvP
vvvbva
vvv
P (6.8)
where inv is the cut-in wind speed, rv the rated wind speed, outv the cut-out wind speed
and rP is the rated real power capacity of the wind farm. The constant coefficients a, b are
given by
33
3
rin
inr
vv
vPa
,
33inr
r
vv
Pb
Equation (6.8) describes the 3 operating ranges of the WTG. When wind speed is below
inv or above outv , no output power can be expected from the WTG. When the wind speed
is between inv and rv , P varies to the cube of wind speed. Beyond rv and at less than
outv , only rated power will be produced.
Since the wind speed distribution function has been discretized into the form of (6.6), and
bearing in mind the three operating ranges of the WTG described by (6.8), one can obtain
the discrete probability distribution of P as follows:
)(lFv

Chapter 6 Statistical Voltage Quality Assessment Method for Grids with Wind Power Generation
137
],[)()(]})(exp[])({exp[
),[)(}]2/)(
[exp{}]2/)(
[exp{
),(),0[)()(]})(exp[])(exp[1{
)(
outrrkoutkr
rinkk
outinkoutkin
P
vvivPPc
v
c
v
vvivc
iv
c
iv
vvivPc
v
c
v
iF
(6.9)
where )(iP is the discrete state of the active power production at the discrete wind speed
)(iv . )(P denotes the impulse function at P. Derivation of (6.9) is given in Appendix B.
In Fig. 6.3(a), the discrete wind speed distribution Fv(l) is shown. The corresponding
WTG output power P vs speed v curve is shown in Fig.6.3(b). The discrete probabilistic
distribution of the wind power )(iFP , as described by (6.9), is shown in Fig.6.3(c) where
it is plotted against )(iP . Figure 6.3(c) can be described by the power discrete probability
set
MiiFiPT PP ,1,0:)(),( (6.10)
where M is the number of selected wind power states at which )(iP is calculated using
(6.8) and )(iFP is obtained from (6.9).
V0
00
)(iP
Pr
Vin Vout
V
Vr
)(iP
(c)(b)
(a)
PT
l)Fv (
i)FP (
Pr
Fig.6.3 Probabilistic derivation
(a) Discrete probabilistic distribution of wind speed, (b) Wind-farm power vs wind speed
characteristic, (c) Discrete probability distribution of wind power production

Chapter 6 Statistical Voltage Quality Assessment Method for Grids with Wind Power Generation
138
6.3.2 Grid Thevenin equivalent impedance probabilistic model
The grid is made up of numerous elements, including transmission lines, cables,
transformers and generators. While it can be expected in most instances these equipment
would be in service, it cannot be assumed that this will be so at all times. Consequently,
when an element of the grid is taken out or put in service, it will result in changes in the
fault level ζ, R/X ratio γ and hence impedance Z, when viewed from the PCC. Such
impedance changes can be statistically related to the status of the grid. This is because
utilities have excellent knowledge pertaining to the statistical likelihood of the service
availability of individual major equipment in the grid, based on the operational statistical
data collected over long time and experience. Hence, it is on this basis that the following
approach is proposed to yield a probabilistic grid model.
Suppose there are n elements in the grid, the status of each of which is to be considered in
the analysis. In practice, n would be much less than the actual number of elements in the
grid. This is because as an element is electrically further from the PCC, its operational
status will have lesser impact on the variation in Z. Hence remote elements need not be
considered in the analysis.
…G# 1
# 2
# i
# n
G
Z(j)
… …
Grid
=R(j)+ j X(j)
Wind farm
PCC
Fig.6.4 Network elements in grid
Next, define xk, k = 1,2, …n as the operational state of each of the n elements shown in
Fig.6.4. Each xk can assume the value of 1 or 0: if the kth
element is in service, xk has a
value 1 and if the element is out of service, xk has a 0 value.
Thus a system state vector x can be defined as x = (x1, x2, …, xn). From the utility statistical
data, suppose the corresponding availability and unavailability of each of the elements at

Chapter 6 Statistical Voltage Quality Assessment Method for Grids with Wind Power Generation
139
any given time are Ak and Uk respectively. One can then derive the discrete probability of
the grid system state via the expression
n
k
kkkkZ UxAxjF1
])1([)( (6.11)
where j = 1, 2, …, 2n denotes the grid system state number associated with x. Each state
corresponds to one of the 2n grid configurations. For example, if one is interested in
seeing how two elements in a grid is affecting Z, one only need to consider 22 or 4 states
or network configurations. From (6.11), the probability )( jFz will consist of 4 elements:
A1A2, A1U2, U1A2 and U1U2.
For each of the grid state j, there is a corresponding Thevenin equivalent impedance,
denoted as Z(j). The determination of )( jZ is straight-forward: one only has to use a
conventional short-circuit analysis program to calculate ζ and γ at the PCC bus for the
particular grid state, and then apply (6.2) to evaluate )( jZ .
The equivalent impedance Z(j) and its associated probability FZ(j) can then be grouped to
form the discrete probability set of impedance Z
nZZ jjFjZT 2,2,1:)(),( (6.12)
6.3.3 Probabilistic voltage deviation
From (6.4), it is seen that the voltage deviation ΔV at the PCC can be calculated based on
the wind power production P and the grid Thevenin impedance Z. Since P and Z have
now been expressed in terms of probability sets (6.10) and (6.12), the statistical
distribution of ΔV can be computed by recognizing the distribution of ΔV as a joint
distribution between P and Z. The P and Z distributions are deemed to be independent.
Hence if wind power state i occurs, the corresponding probability distribution )(iFP can
be obtained from (6.9), and if the grid configuration j also occurs, its probability
distribution )( jFz can be inferred from (6.11). Hence from (6.4), ΔV resulting from the
combined state i-j is given by:

Chapter 6 Statistical Voltage Quality Assessment Method for Grids with Wind Power Generation
140
)()()()]()([
),( iPjiPV
jXkjRjiV
p
(6.13)
The corresponding probability of occurrence of the state i-j is given by
)()()),(( jFiFjiVF ZPV (6.14)
Thus ΔV and its probability of occurrence can be evaluated using (6.13) and (6.14).
6.4 Significant level of voltage deviation
As explained in Section 6.2, various standards governing voltage quality are in place. The
analysis of previous section shows that such voltage excursions are statistical in nature. It
is now proposed an index called significant level of voltage deviation be used to quantify
the extent of severity of voltage deviations, taking into consideration their likelihood of
occurrence. Significant level concept has been used in various statistical studies [114]. In
the context of the present study, the significance level of ΔV is denoted as α where
)( Vprob (6.15)
As shown, the significant level α is defined as the probability when |ΔV| exceeds a pre-set
limit δ: i.e. α is the cumulative probability of all the discrete voltage deviations occurring
beyond the |ΔV| limit δ. The value of δ is selected from the relevant standards governing
voltage deviation. Typically δ = 0.1 p.u. from [87]. Since (6.14) yields the probability of
each of the discrete voltage deviations and the value of each ΔV can be readily evaluated
using (6.13), thus all the discrete states of |ΔV| which exceeds δ can be extracted and their
corresponding probabilities summated to provide the significant level measure α.
Mathematically, the calculation of α can be expressed as:
),(),(
)]()([)),((jiV
ZP
jiV
V jFiFjiVF (6.16)
Stated in this context, the ideal grid-wind farm system design would be one with α = 0. In
practice, however, a more realistic design objective would be to reduce α to an acceptable
level. From (6.16), α is seen to be dependent on the distributions of wind power FP(i) and
network Thevenin impedance FZ(j). Manipulation of network impedance Z(j) can be

Chapter 6 Statistical Voltage Quality Assessment Method for Grids with Wind Power Generation
141
carried out by the grid operator. Hence in this paper, the objective is to examine the
impact of adjusting Z on α.
To achieve this objective, the first step is to determine the extent of the contribution of
each of the grid state j to α. The significance level α can be decomposed as
n
j
jZprobjZVprob2
1
))(())(|(| (6.17)
Consider the grid state j which has the Thevenin equivalent impedance of )( jZ . At )( jZ
and from (6.11), the probability of its occurrence is Fz(j) or prob(Z(j)). The conditional
probability term prob(|ΔV| > δ │Z(j)) shown in (6.17) denotes the probability of |ΔV|
exceeding the limit δ when the impedance is Z(j). For this given Z(j) and from (6.13), ΔV
= Ψ(j) P(i). Hence the computation of prob(|ΔV| > δ │Z(j)) can be transformed to
|))(|)((
)|)()((|))(|(|
jiPprob
iPjprobjZVprob
(6.18)
Since Z(j) is given, Ψ(j) is also known. With a pre-set value for δ, one can obtain δ/|Ψ(j)|.
From (6.9), the cumulative probability for P(i) > δ/|Ψ(j)| can be evaluated. Hence,
prob(|ΔV| > δ │Z(j)) is obtained. By repeating the calculation for all Z(j), one can
therefore determine the probability of |ΔV| exceeding the voltage limit δ for all the grid
states j.
A very useful result can now be derived by applying Bayes‟ theorem, i.e.
)|(|Pr
))(())(|(|)||)((
Vob
jZprobjZVprobVjZprob (6.19)
Substituting (7.15) into (7.19), (7.19) can be rewritten as:
))(())(|(|)||)((
jZprobjZVprobVjZprob
(6.20)
Equation (6.20) quantifies the individual contribution of grid state j toward the
significance level α. Therefore it is now possible to calculate the contribution of state j to
α since all the terms on the right hand side of (6.20) are known. From all the states j
which contribute toward voltage deviation exceeding the level δ, one can screen out those

Chapter 6 Statistical Voltage Quality Assessment Method for Grids with Wind Power Generation
142
network scenarios or states which have higher probability of occurrence. Remedial
actions to be taken on these states will be effective ways to enhance the voltage quality at
the PCC. Numerical examples in the next section will illustrate this design strategy.
6.5 Case study
An example of a grid with wind power generation is used in this case study to illustrate
the proposed statistical method. Its single-line diagram is shown in Fig.6.5 and its details
can be found in [115]. In the studied network, Bus 112 is the collection bus of a wind
farm. The farm is assumed to be inter-connected to Bus 111 via an under-sea transmission
cable. Thus Bus 111 is considered as the PCC. Hence, the focus of the study will be the
voltage quality at the PCC.
G
BUS-107/
400kV
BUS-104/
400kV
BUS-101/
400kV
BUS-102/
135kV
BUS-105/
135kVBUS-108/
135kV
BUS-111/
135kV
BUS-112/
135kV
L5 r=0.016 x=0.2 b=0.0625
L6 r=0.016 x=0.2 b=0.0625
L7 r=0.005 x=0.01 b=0.0625
L8 r=0.005 x=0.01 b=0.0625
L4 r=0.036 x=0.18
b=0.06
L3 r=0.06 x=0.36
L1 r=0.16 x=0.98
L2 r=0.16 x=0.98
2 x (500MVA)
T5
400KV/135KV
er=0.1% ex=9%
(650MW+j110MVar)
T3 500MVA
400KV/135KV
er=0.6% ex=30%T4 500MVA
400KV/135KV
er=0.4% ex=30%
(2750MW+j200MVar)
(330MW+j300MVar)
(100MW-j50MVar)
T1/T2
135KV/33KV
er=0.6% ex=30%
2 x (500MVA)
Rating
750MVA
5 x
(500MVA)
T8
400KV/20KV
er=0.4%
ex=5%
5 x (500MVA)
G1 set
3 x (500MVA)
G2 set
3 x
(500MVA)
T7
400KV/20KV
er=0.1%
ex=8%
G3 set
3 x
(500MVA)3 x
(500MVA)
T6
400KV/
20KV
er=0.1%
ex=8.5%
T9 750MVA
400KV/20KV
er=0.1%
ex=16%
Wind farm:
300MW+j36MVar
Sbase=1000MVA
Sea cable 2
BUS-113/
33kV
r=0.22 x=0.32 b=0.00012
Sea cable 1
r=0.22 x=0.32 b=0.00012
Fig.6.5 The base-case network model used in the study
The data from [115] is used for this case study, whereby the total load in the network is
3730 MW, of which the wind farm contributes 300 MW. The base case shows that 36
MVAr (kp = 0.12) of capacitive reactive power is also needed at the PCC in order to
achieve satisfactory voltage profile in the vicinity of the wind farm. Also included in the
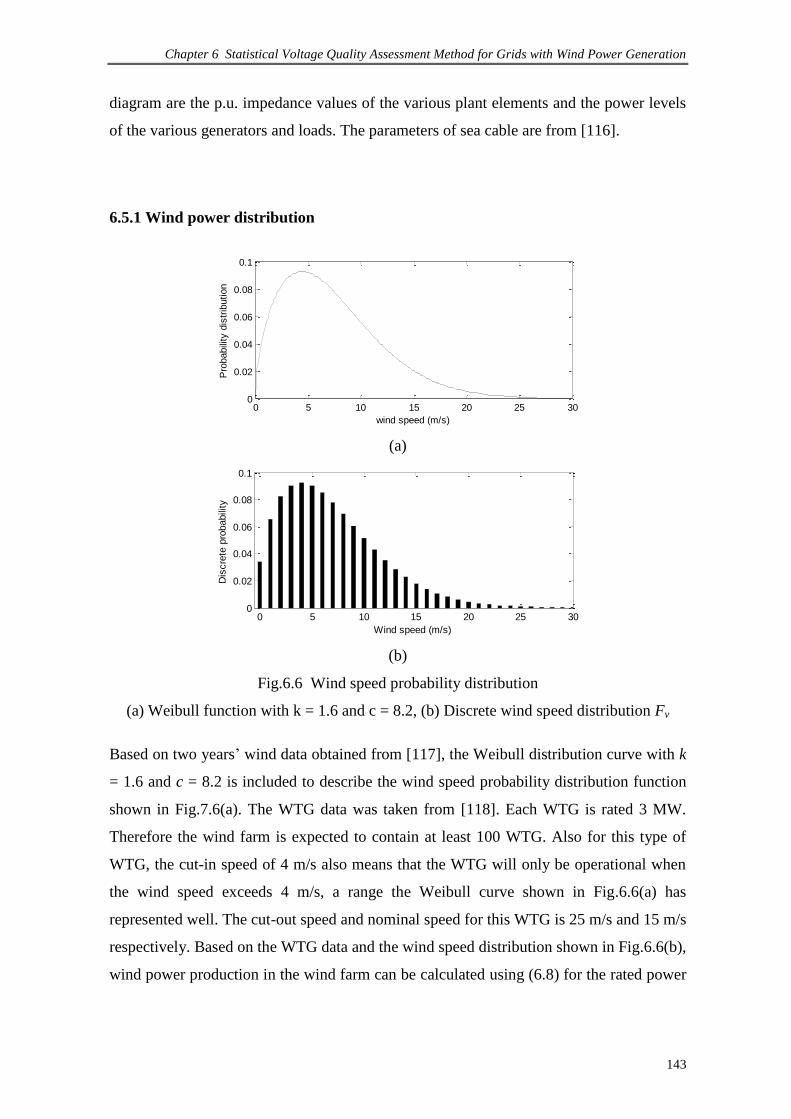
Chapter 6 Statistical Voltage Quality Assessment Method for Grids with Wind Power Generation
143
diagram are the p.u. impedance values of the various plant elements and the power levels
of the various generators and loads. The parameters of sea cable are from [116].
6.5.1 Wind power distribution
0 5 10 15 20 25 300
0.02
0.04
0.06
0.08
0.1
wind speed (m/s)
Pro
babili
ty d
istr
ibution
(a)
0 5 10 15 20 25 300
0.02
0.04
0.06
0.08
0.1
Wind speed (m/s)
Dis
cre
te p
robabili
ty
(b)
Fig.6.6 Wind speed probability distribution
(a) Weibull function with k = 1.6 and c = 8.2, (b) Discrete wind speed distribution Fv
Based on two years‟ wind data obtained from [117], the Weibull distribution curve with k
= 1.6 and c = 8.2 is included to describe the wind speed probability distribution function
shown in Fig.7.6(a). The WTG data was taken from [118]. Each WTG is rated 3 MW.
Therefore the wind farm is expected to contain at least 100 WTG. Also for this type of
WTG, the cut-in speed of 4 m/s also means that the WTG will only be operational when
the wind speed exceeds 4 m/s, a range the Weibull curve shown in Fig.6.6(a) has
represented well. The cut-out speed and nominal speed for this WTG is 25 m/s and 15 m/s
respectively. Based on the WTG data and the wind speed distribution shown in Fig.6.6(b),
wind power production in the wind farm can be calculated using (6.8) for the rated power

Chapter 6 Statistical Voltage Quality Assessment Method for Grids with Wind Power Generation
144
(Pr) of 300 MW. The corresponding probabilistic distribution of P is depicted in Fig.6.7,
which is the graphical description of (6.9).
0 0.1 0.2 0.3 0.4 0.5 0.6 0.7 0.8 0.9 1
0
0.05
0.1
0.15
0.2
0.25
Active power (p.u)
Dis
cre
te p
robabili
ty d
istr
ibution
Fig.6.7 Discrete probability distribution of wind power: rated power 300MW
6.5.2 Grid Thevenin impedance
Component reliability data of the various elements of the grid system is required in order
to derive the plant availability/unavailability information. It is assumed the data shown in
Table 6.1 taken from [112] is applicable in the present study. Unavailability of element(s)
results in altered network configurations/topologies from that shown in the example study.
The probability of the particular grid configuration or state can then be calculated based
on the data given in Table 6.1. For each grid state, the individual impedance at the PCC
has been determined using a short-circuit study program. With this information and
applying (6.2), the Thevenin impedance Z at the PCC is obtained. The results are
summarized in Table 6.2. Grid states with probability of less than 7x10⁻⁵
have been
ignored as it is considered that these states have too small a probability of occurrence to
be of concern.
Table 6.1 Component Reliability Data
Component (failures/yr) Repair Time(hr)
Generator unit 2 198
Overhead line 0.02/km 10
Transformer 0.01 200
)(iFP
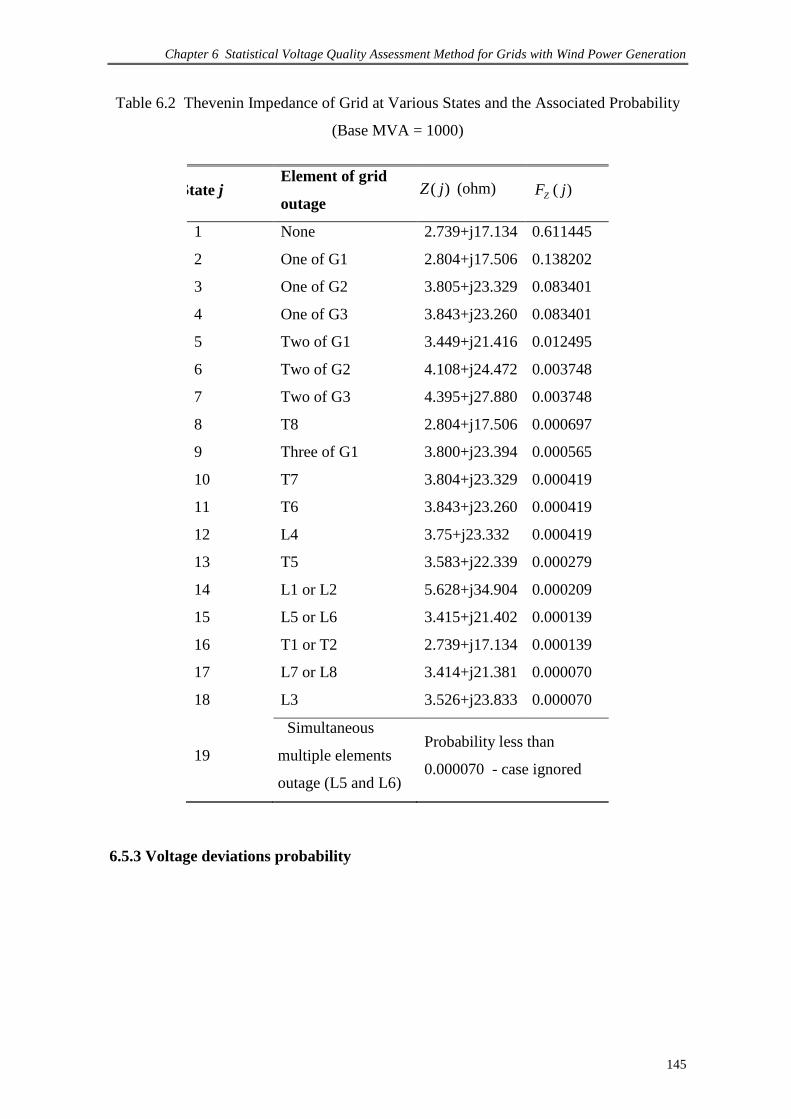
Chapter 6 Statistical Voltage Quality Assessment Method for Grids with Wind Power Generation
145
Table 6.2 Thevenin Impedance of Grid at Various States and the Associated Probability
(Base MVA = 1000)
State j Element of grid
outage )( jZ (ohm) )( jFZ
1 None 2.739+j17.134 0.611445
2 One of G1 2.804+j17.506 0.138202
3 One of G2 3.805+j23.329 0.083401
4 One of G3 3.843+j23.260 0.083401
5 Two of G1 3.449+j21.416 0.012495
6 Two of G2 4.108+j24.472 0.003748
7 Two of G3 4.395+j27.880 0.003748
8 T8 2.804+j17.506 0.000697
9 Three of G1 3.800+j23.394 0.000565
10 T7 3.804+j23.329 0.000419
11 T6 3.843+j23.260 0.000419
12 L4 3.75+j23.332 0.000419
13 T5 3.583+j22.339 0.000279
14 L1 or L2 5.628+j34.904 0.000209
15 L5 or L6 3.415+j21.402 0.000139
16 T1 or T2 2.739+j17.134 0.000139
17 L7 or L8 3.414+j21.381 0.000070
18 L3 3.526+j23.833 0.000070
19
Simultaneous
multiple elements
outage (L5 and L6)
Probability less than
0.000070 - case ignored
6.5.3 Voltage deviations probability
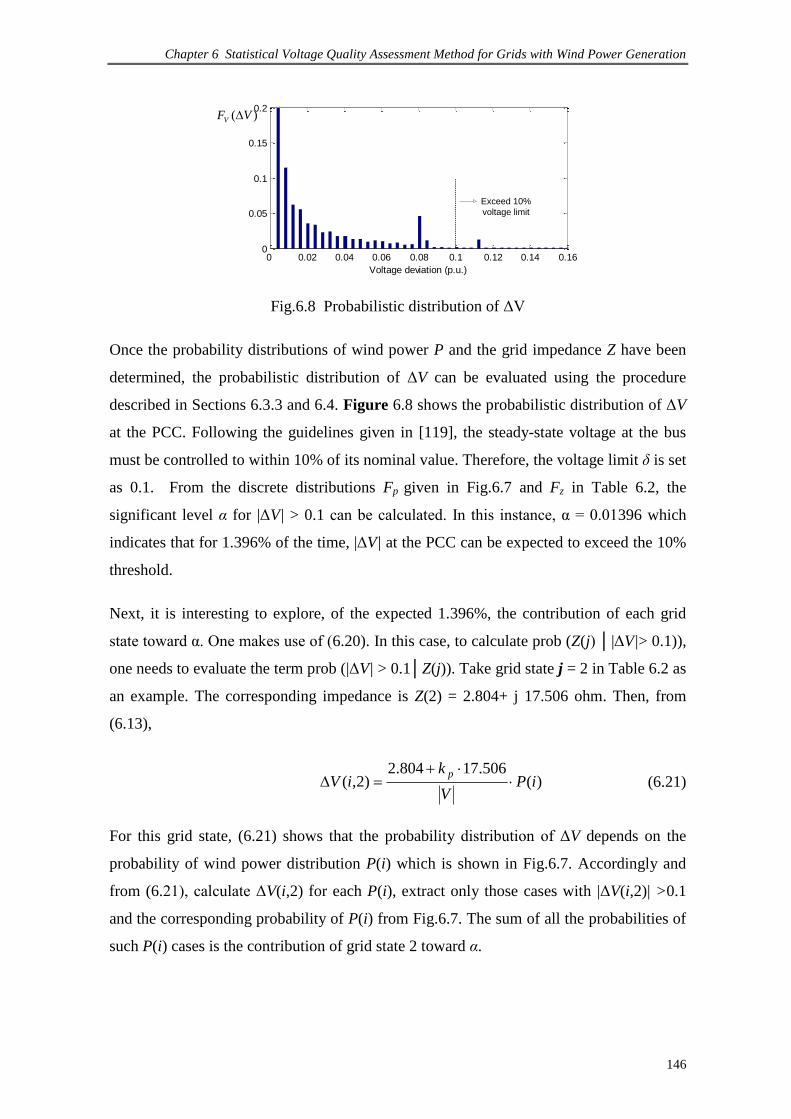
Chapter 6 Statistical Voltage Quality Assessment Method for Grids with Wind Power Generation
146
0 0.02 0.04 0.06 0.08 0.1 0.12 0.14 0.160
0.05
0.1
0.15
0.2
Voltage deviation (p.u.)
Exceed 10%
voltage limit
Fig.6.8 Probabilistic distribution of ΔV
Once the probability distributions of wind power P and the grid impedance Z have been
determined, the probabilistic distribution of ΔV can be evaluated using the procedure
described in Sections 6.3.3 and 6.4. Figure 6.8 shows the probabilistic distribution of ΔV
at the PCC. Following the guidelines given in [119], the steady-state voltage at the bus
must be controlled to within 10% of its nominal value. Therefore, the voltage limit δ is set
as 0.1. From the discrete distributions Fp given in Fig.6.7 and Fz in Table 6.2, the
significant level α for |ΔV| > 0.1 can be calculated. In this instance, α = 0.01396 which
indicates that for 1.396% of the time, |ΔV| at the PCC can be expected to exceed the 10%
threshold.
Next, it is interesting to explore, of the expected 1.396%, the contribution of each grid
state toward α. One makes use of (6.20). In this case, to calculate prob (Z(j) │|ΔV|> 0.1)),
one needs to evaluate the term prob (|ΔV| > 0.1│Z(j)). Take grid state j = 2 in Table 6.2 as
an example. The corresponding impedance is Z(2) = 2.804+ j 17.506 ohm. Then, from
(6.13),
)(506.17804.2
)2,( iPV
kiV
p
(6.21)
For this grid state, (6.21) shows that the probability distribution of ΔV depends on the
probability of wind power distribution P(i) which is shown in Fig.6.7. Accordingly and
from (6.21), calculate ΔV(i,2) for each P(i), extract only those cases with |ΔV(i,2)| >0.1
and the corresponding probability of P(i) from Fig.6.7. The sum of all the probabilities of
such P(i) cases is the contribution of grid state 2 toward α.
)( VFV

Chapter 6 Statistical Voltage Quality Assessment Method for Grids with Wind Power Generation
147
The contribution of other grid states j to α can be calculated in the same manner
described earlier. The results are presented in Table 6.3. The table only includes those
states which can result in |ΔV| >0.1. From Table 6.3, it is obvious states j = 3 and 4 are
the two main contributing states to α. Other grid states j either have much lower
probability or there is no incident of |ΔV| >0.1 for these grid states.
To verify the accuracy of the ΔV calculation used in the proposed method, a series of
conventional load-flow study have also been carried out to calculate ΔV at the PCC for
each of the grid states shown in Table 6.2, at the maximum wind farm output of 300MW.
Table 6.4 compares the voltage deviation ΔV calculated by the proposed method and the
conventional low flow study. Only those grid state(s) which contribute to ΔV >10% have
been shown in Table 6.4.
Table 6.3 Grid States and Probability when |ΔV| >0.1
Grid State j Element(s) of
Plant Outage )%10||)(( VjZprob
3 One of G2 set 0.439108
4 One of G3 set 0.499100
6 Two of G2 set 0.022422
7 Two of G3 set 0.025452
9 Three of G1 set 0.003178
10 T7 0.002356
11 T6 0.002357
12 L4 0.002286
13 T5 0.001433
14 L1 or L2 0.001927
18 L3 0.000371

Chapter 6 Statistical Voltage Quality Assessment Method for Grids with Wind Power Generation
148
Table 6.4 Comparison of voltage deviation ΔV obtained from the conventional load flow
study and from the proposed probabilistic method
Grid State j Element(s) of
Plant Outage
Voltage deviation ΔV (%)
Conventional load
flow study
Proposed statistical
method
3 One of G2 set 11.160 10.87
4 One of G3 set 10.106 10.923
6 Two of G2 set 12.471 11.595
7 Two of G3 set 12.992 12.742
9 Three of G1 set 10.060 10.871
10 T7 11.160 10.87
11 T6 10.106 10.922
12 L4 10.871 10.782
13 T5 10.543 10.311
14 L1 or L2 16.761 17.775
18 L3 10.332 10.512
From Table 6.4, it can be seen that the differences between ΔV obtained from the much
simpler Thevenin equivalent model used in this analysis and that obtained from the
conventional load flow study are less than 8% which are considered acceptable. More
importantly, it is pleasing to note that the load flow studies confirm all the grid states
identified by the present approach and shown in Table 6.3 do indeed result in |ΔV|
exceeding the 10% limit. Furthermore, the computational time of the proposed method is
much shorter than that of the conventional load flow study. For instance, the
computational times required for calculating grid state 3 in Table 6.4 are 9.6s and 0.5s for
the conventional load flow and the proposed statistical method respectively. These
simulations were carried out using a P4 2.13-GHz/1-GB RAM PC. Therefore, the
proposed statistical approach using the simplified network model is able to provide a
quick way to identify those grid states which would result in voltage quality violations.
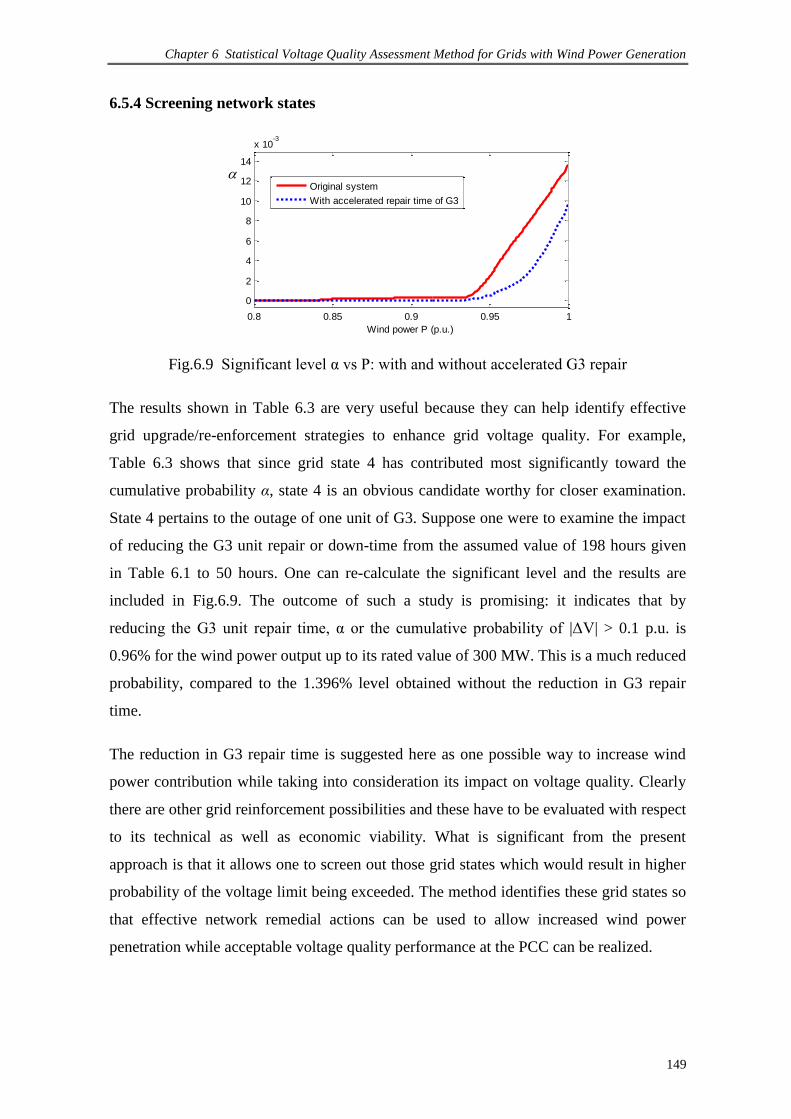
Chapter 6 Statistical Voltage Quality Assessment Method for Grids with Wind Power Generation
149
6.5.4 Screening network states
0.8 0.85 0.9 0.95 1
0
2
4
6
8
10
12
14
x 10-3
Wind power P (p.u.)
Original system
With accelerated repair time of G3
Fig.6.9 Significant level α vs P: with and without accelerated G3 repair
The results shown in Table 6.3 are very useful because they can help identify effective
grid upgrade/re-enforcement strategies to enhance grid voltage quality. For example,
Table 6.3 shows that since grid state 4 has contributed most significantly toward the
cumulative probability α, state 4 is an obvious candidate worthy for closer examination.
State 4 pertains to the outage of one unit of G3. Suppose one were to examine the impact
of reducing the G3 unit repair or down-time from the assumed value of 198 hours given
in Table 6.1 to 50 hours. One can re-calculate the significant level and the results are
included in Fig.6.9. The outcome of such a study is promising: it indicates that by
reducing the G3 unit repair time, α or the cumulative probability of |ΔV| > 0.1 p.u. is
0.96% for the wind power output up to its rated value of 300 MW. This is a much reduced
probability, compared to the 1.396% level obtained without the reduction in G3 repair
time.
The reduction in G3 repair time is suggested here as one possible way to increase wind
power contribution while taking into consideration its impact on voltage quality. Clearly
there are other grid reinforcement possibilities and these have to be evaluated with respect
to its technical as well as economic viability. What is significant from the present
approach is that it allows one to screen out those grid states which would result in higher
probability of the voltage limit being exceeded. The method identifies these grid states so
that effective network remedial actions can be used to allow increased wind power
penetration while acceptable voltage quality performance at the PCC can be realized.

Chapter 6 Statistical Voltage Quality Assessment Method for Grids with Wind Power Generation
150
6.5.5 Additional comparison with other Methods
Although voltage quality can be investigated using the conventional load flow study, the
likelihood of the network voltage quantities assuming particular states is not predicted
since the load flow study is a deterministic method. A more appropriate comparison
would be based on the probabilistic load flow (PLF) method [92, 93], in which one can
evaluate probability issues and statistical moments of all state variables and output
network quantities to indicate the possible ranges of load flow, instead of obtaining a
point estimate result from the conventional load flow.
Alternatively, Monte Carlo simulation (MCS) can be used to solve the PLF problem by
repeated simulations. MSC [120] has been widely used in power system computations,
especially in reliability assessment. It can provide considerably accurate results, but the
computation is time-consuming. In the present investigation, the technique that combine
MCS with multi-linearized power flow equations described in [121] has been adapted in
order to reduce the computational burden. Specifically, MCS is utilized to generate
random wind speed in order to obtain realistic wind power distribution. The wind power
then forms the input to the load flow study of the studied network. This approach
provides a simplified and yet effective technique to investigate voltage quality violations.
Results obtained by MCS are set as benchmarks for comparing against the proposed
statistical method.
Table 6.5 Computational Time Comparison
Methods Computational Time (s)
Monte Carlo Simulation (10000 trials) 77.06
Monte Carlo Simulation (20000 trials) 156.89
Proposed method 1.63
The proposed statistical method and the MCS method are implemented by using
MATLAB M-language. The methods are tested using the same 2.13-GHz PC mentioned
earlier. The average computation times based on the combined MCS-multi-linearized
power flow equations with different trials have been tracked. The computational times are
compared with that using the proposed statistical method, as shown in Table 6.5. From
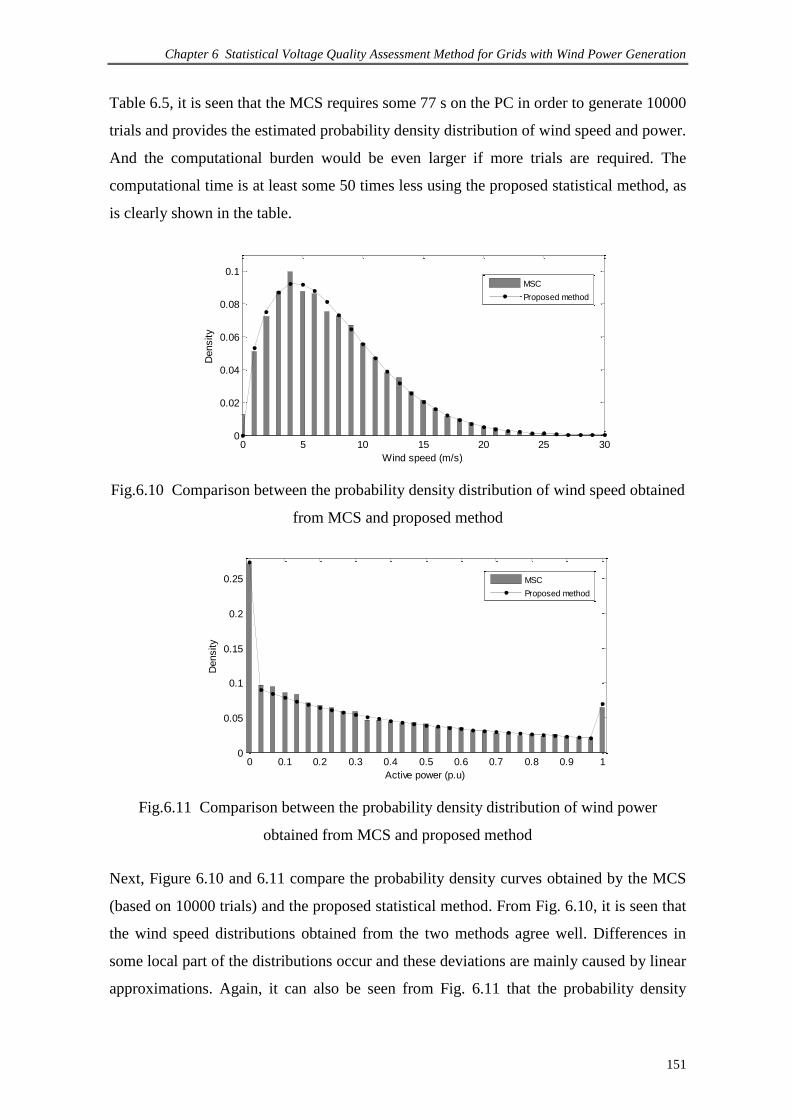
Chapter 6 Statistical Voltage Quality Assessment Method for Grids with Wind Power Generation
151
Table 6.5, it is seen that the MCS requires some 77 s on the PC in order to generate 10000
trials and provides the estimated probability density distribution of wind speed and power.
And the computational burden would be even larger if more trials are required. The
computational time is at least some 50 times less using the proposed statistical method, as
is clearly shown in the table.
0 5 10 15 20 25 300
0.02
0.04
0.06
0.08
0.1
Wind speed (m/s)
Density
MSC
Proposed method
Fig.6.10 Comparison between the probability density distribution of wind speed obtained
from MCS and proposed method
0 0.1 0.2 0.3 0.4 0.5 0.6 0.7 0.8 0.9 10
0.05
0.1
0.15
0.2
0.25
Active power (p.u)
Density
MSC
Proposed method
Fig.6.11 Comparison between the probability density distribution of wind power
obtained from MCS and proposed method
Next, Figure 6.10 and 6.11 compare the probability density curves obtained by the MCS
(based on 10000 trials) and the proposed statistical method. From Fig. 6.10, it is seen that
the wind speed distributions obtained from the two methods agree well. Differences in
some local part of the distributions occur and these deviations are mainly caused by linear
approximations. Again, it can also be seen from Fig. 6.11 that the probability density

Chapter 6 Statistical Voltage Quality Assessment Method for Grids with Wind Power Generation
152
distributions of wind power obtained by the proposed method are in reasonable agreement
with those obtained by the MCS. This is most encouraging as the proposed probabilistic
method is an efficient computational technique to assess voltage quality in wind farm-grid
connected system, in terms of its simple arithmetic operation, while it can still provide
good estimates of voltage deviations and their likelihood of occurrence.
6.6 Conclusion
In this chapter, a statistics-based analysis method has been proposed for the purpose of
assessing the impact on voltage quality caused by wind power generation. Voltage
deviation has been computed using the probabilistic models of wind power production
and grid Thevenin impedance. An index called significance level of the voltage deviation
α has been developed to provide a probabilistic measure of the voltage quality
performance. By considering the contributing factor from each of the grid states that
constitute α, possible solution methods to improve on voltage quality can be obtained.
This will lead to a corresponding increase in the wind power penetration level that can be
accommodated in the grid, with acceptable voltage quality at the PCC. A case study
example is included in this chapter to illustrate the effectiveness of the proposed method.

Chapter 7 Conclusions and recommendations
153
CHAPTER 7
CONCLUSIONS AND RECOMMENDATIONS
7.1 Conclusions
This thesis has documented the investigation of the grid integration issues for wind based
renewable energy conversion system in terms of architecture, control and analysis. The
research includes a review of current wind market development, the advance of wind
turbine technology and grid regulations for wind power penetration; Modeling of DFIG
wind generation system and the potential ride-through enhancement solution; Modulation
of an integration of three-switch buck-type rectifier and Z-Source inverter and its
application for PMSG based wind turbine; and statistics-based voltage assessment method
for large wind power penetration.
A strong increase of worldwide wind capacity is expected in the next decade. The turbine
configurations have been reviewed in terms of different generators and the main grid
connection demands has been reviewed in terms of safety operation of transmission
systems. All these investigations are intended to clarify the potential challenges of
modern wind turbines and thus provided a guide to define research objectives in this
thesis. In fact, with the increase of wind power penetration into utility, it is desired to
design a grid compatible wind turbine, which is able to improve turbine operating
performance and eliminate negative impacts on the network, such as fault ride-through
capability, flexible voltage regulation and power quality issue.
DFIG based wind turbine has been adopted by many turbine manufacturers due to the low
cost of its partial-scale power converter. However, enhancing ride-through capability
under grid fault events has been worldwide recognized as a challenging problem of the
DFIG wind generation systems. Hence, a potential ride-through solution, which is
inspired by power quality improvement devices, i.e., series compensation, has been
proposed in this thesis. The compensator is in series with the stator windings of DFIG in
order to eliminate the effect of grid voltage faults. The essential behavior of DFIG during

Chapter 7 Conclusions and recommendations
154
faults has been analyzed via phasor diagram. Then an improved ride-through control
scheme based on the ramp-function injection voltage has been developed to significantly
reduce the energy capacity of the series compensator, which in turn reduce the capital cost.
The performance of the designed architecture has been verified in simulation.
Compared with DFIG, the PMSG based wind turbine has better grid integration
performance since full-scale power electronics converter is utilized. The power
electronics are enabling wind turbines to have better dynamic response, faster fault
monition, and quicker reaction operation. Thus it is recognized that power electronics
play an important role in modern wind turbine. Hence, in this thesis, the integration of a
three-switch buck-type rectifier and a Z-Source inverter has been developed to design a
reliable power architecture for PMSG based turbine. The detailed modulation and
operating principle of this topology were discussed and thereby the modulation scheme
has been verified by both simulation studies and experimental results.
Subsequently, the design methodology, the simulation studies, and the experimental
verification of the aforementioned architecture for PMSG application have been presented.
The proposed generator-side control strategy is optimized from the fundamentals of the
Id=0 control and the unity power factor method. The voltage-oriented control is adapted
for the Z-Source inverter to decouple active and reactive power control while extracting
the maximum wind power by adjusting the shoot-through duration of the Z-Source
network. The detailed numerical simulation and experimental results have verified the
proposed control schemes.
With the increasing wind power penetration into grid utility, voltage quality analysis is
becoming one of the important issues. In this thesis, a statistics-based analysis method has
been proposed for the purpose of assessing the impact on voltage quality caused by wind
power generation. Voltage deviation has been computed using the probabilistic models of
wind power production and grid Thevenin impedance. An index called significance level
of the voltage deviation α has been developed to provide a probabilistic measure of the
voltage quality performance. By considering the contributing factor from each of the grid
states that constitute α, possible solution methods to improve on voltage quality can be
obtained. This would lead to a corresponding increase in the wind power penetration level

Chapter 7 Conclusions and recommendations
155
that can be accommodated in the grid, with acceptable voltage quality at the PCC. A case
study example has been included to illustrate the effectiveness of the proposed method.
7.2 Recommendations
Based on the contributions of the completed project, further researches are recommended
in following areas.
1. Energy storage control scheme for smoothing wind power
When renewable energy penetration reaches sufficiently high levels (around 20%–30% of
total capacity), the intermittent nature of renewable source such as wind power, can begin
to have noticeable negative effects on the entire grid. To meet this potential challenge, the
utility has the right to curtail wind energy in order to avoid any violation of the system
constraints.
The integration of energy storage systems (ESSs) with renewable energy resources has
become one of the most viable solutions for facilitating increased penetration of
renewable energy. Further studies for allocating an ESS in a distribution system with a
high penetration of wind energy are suggested. The ultimate objective is to maximize the
benefits for both the wind power plant and the utility by sizing the ESSs to accommodate
all amounts of excess wind energy and by then allocating it within the system in order to
minimize the annual cost of the electricity.
2. Scaled-up implementation of ride-through enhancement for DFIG system
The proposed control algorithm for ride-through enhancement for DFIG system can be
scaled up to be implemented for a MW power level DFIG wind turbine in order to
demonstrate the effectiveness and practicality for industry application. One design issue
that needs to be considered is that the selection of power rating of rotor-side converter
should be large enough so as to guarantee the safety operation of the converter during the
demonstration of fault conditions. Then real-time monitoring of grid voltage fault would
be one of the challenges in the experiment, which affects the start and end of the series
compensation duration.

Chapter 7 Conclusions and recommendations
156
3. Ride-through enhancement of PMSG based wind turbine
PMSG based wind turbine is expected to have a large market share in the next decade.
The ride-through problem of PMSG is easier to solve than that of DFIG since it has a full
scale power converter. However, the rated power of PMSG is up to 5MW, which presents
a high requirement for crowbar circuits in terms of cooling facilities and maintenance.
One potential way is to merge energy storage system into the turbine. The flywheel
energy storage system is a good alternative since it has fast charging and discharging
characteristics for absorbing and supplying energy during fault transients.
4. Statistics-based analysis method for the purpose of assessing frequency control
With the large wind power penetration into grid utility, active power and frequency
control is also one of the important issues. In this thesis, a statistics-based analysis
method has been proposed for the purpose of assessing the impact on voltage quality.
Further studies of frequency control are suggested to carry out via statistical methods.
Frequency regulation can be computed using the probabilistic models of wind power
production and system loads. An index called significance level can be also developed to
provide a probabilistic measure of the frequency control performance. The corresponding
case study is recommended using a practical micro grid simulator for simplification.
Author’s Publications
157
AUTHOR’S PUBLICATIONS
1. S. Zhang, K. J. Tseng, Vilathgamuwa D.M., and Nguyen T.D., "Design of a
Robust Grid Interface System for PMSG-based Wind Turbine Generators," IEEE
Transactions on Industrial Electronics, vol. 58, no. 1, pp. 316-328, 2011.
2. S. Zhang, K. J. Tseng, and S. S. Choi, "Statistical voltage quality assessment
method for grids with wind power generation," Renewable Power Generation, IET,
vol. 4, no. 1, pp. 43-54, 2010.
3. S. Zhang, K. J. Tseng, and et al, "Advanced Control of Series Voltage
Compensation to Enhance Wind Turbine Ride-through," IEEE Transactions on
Power Electronics, to be appeared (Early access), 2011.
4. T. D. Nguyen, K. J. Tseng, S. Zhang, and H. T. Nguyen, "A Novel Axial Flux
Permanent Magnet Machine for Flywheel Energy Storage System: Design and
Analysis," IEEE Transactions on Industrial Electronics, vol. 58, no. 9, pp. 3784-
3794, 2011.
5. S. Zhang, K. J. Tseng, and T. D. Nguyen, "Novel three-phase AC-AC Z-Source
converters using matrix converter theory," in Energy Conversion Congress and
Exposition, 2009. ECCE 2009. IEEE, 2009, pp. 3063-3070.
6. S. Zhang, K. J. Tseng, and T. D. Nguyen, "Modeling of AC-AC matrix converter
for wind energy conversion system," in Industrial Electronics and Applications,
2009. ICIEA 2009. 4th IEEE Conference on, 2009, pp. 184-191.
7. S. Zhang, K. J. Tseng, and T. D. Nguyen, "WRIG based wind conversion system
excited by matrix converter with current control strategy," in Sustainable Energy
Technologies, 2008. ICSET 2008. IEEE International Conference on, 2008, pp.
203-208.
8. S. Zhang and K. J. Tseng, "Modeling, Simulation and Analysis of Conducted
Common-Mode EMI in Matrix Converters for Wind Turbine Generators," in 2008

Author’s Publications
158
13th International Power Electronics and Motion Control Conference, Vols 1-5,
2008, pp. 2516-2523.
9. T.D. Nguyen, K.J. Tseng, S. Zhang, H.T.Nguyen. (2010). "On The Modeling and
Control of a Novel Flywheel Energy Storage System". IEEE International
Symposium on Industrial Electronics (ISIE) (pp. 214-219)Bari, Italy.
10. T. D. Nguyen, K. J. Tseng, and S. Zhang, "Position Sensorless Control of a Novel
Flywheel Energy Storage System, " IPEC 2010, Singapore, pp. 1192 - 1198.
11. T. D. Nguyen, K. J. Tseng, and S. Zhang, "Model Predictive Control of a Novel
Axial Flux Permanent Magnet Machine for Flywheel Energy Storage System,"
IPEC 2010, Singapore, pp. 519 - 524.
12. T. D. Nguyen, K. J. Tseng, S. Zhang, and C. Zhang, "A flywheel cell for energy
storage system," in Sustainable Energy Technologies, 2008. ICSET 2008. IEEE
International Conference on, 2008, pp. 214-219.

Bibliography
159
BIBLIOGRAPHY
[1] A. D. Hansen and L. H. Hansen, "Wind turbine concept market penetration over
10 years (1995-2004)," Wind Energy, vol. 10, no. 1, pp. 81-87, 2007.
[2] "http://www.awea.org/," American wind energy association.
[3] J. A. P. Lopes, N. Hatziargyriou, J. Mutale, P. Djapic, and N. Jenkins, "Integrating
distributed generation into electric power systems: A review of drivers, challenges
and opportunities," Electric Power Systems Research, vol. 77, no. 9, pp. 1189-
1203, Jul 2007.
[4] T. Ackermann, Wind power in power systems: Hoboken, NJ: John Wiley & Sons,
2005.
[5] R. Doherty, E. Denny, and M. O'Malley, "System operation with a significant
wind power penetration," in Power Engineering Society General Meeting, 2004.
IEEE, 2004, pp. 1002-1007 Vol.1.
[6] M. Altin, O. Goksu, R. Teodorescu, P. Rodriguez, B.-B. Jensen, and L. Helle,
"Overview of recent grid codes for wind power integration," in Optimization of
Electrical and Electronic Equipment (OPTIM), 2010 12th International
Conference on, pp. 1152-1160.
[7] J. M. Carrasco, L. G. Franquelo, J. T. Bialasiewicz, E. Galvan, R. C.
PortilloGuisado, M. A. M. Prats, J. I. Leon, and N. Moreno-Alfonso, "Power-
Electronic Systems for the Grid Integration of Renewable Energy Sources: A
Survey," Industrial Electronics, IEEE Transactions on, vol. 53, no. 4, pp. 1002-
1016, 2006.
[8] F. Blaabjerg and Z. Chen, Power electronics for modern wind turbines: Morgan &
Claypool Publishers, 2006.
[9] J. M. Carrasco, L. G. Franquelo, J. T. Bialasiewicz, E. Galvan, R. C. P. Guisado,
M. A. M. Prats, J. I. Leon, and N. Moreno-Alfonso, "Power-Electronic Systems
for the Grid Integration of Renewable Energy Sources: A Survey," IEEE
Transactions on Industrial Electronics, vol. 53, no. 4, pp. 1002-1016, 2006.
[10] H. Li and Z. Chen, "Overview of different wind generator systems and their
comparisons," Renewable Power Generation, IET, vol. 2, no. 2, pp. 123-138, 2008.
[11] I. Erlich, W. Winter, and A. Dittrich, "Advanced Grid Requirements for the
Integration of Wind Turbines into the German Transmission System," Power
Engineering Society General Meeting, pp. 18-22, 2006.
[12] T. Burton, N. Jenkins, D. Sharpe, and E. Bossanyi, Wind Energy Handbook: John
Wiley & Sons, 2011.
Bibliography
160
[13] World wind energy association. Available:
http://www.wwindea.org/home/images/stories/worldwindenergyreport2009_s.pdf
[14] J. A. Baroudi, V. Dinavahi, and A. M. Knight, "A review of power converter
topologies for wind generators," Renewable Energy, vol. 32, no. 14, pp. 2369-2385,
Nov 2007.
[15] L. H. Hansen, P. H. Madsen, F. Blaabjerg, H. C. A. C. H. C. Christensen, U. A. L.
U. Lindhard, and K. A. E. K. Eskildsen, "Generators and power electronics
technology for wind turbines," in Industrial Electronics Society, 2001. IECON '01.
The 27th Annual Conference of the IEEE, 2001, pp. 2000-2005 vol.3.
[16] S. Grabic, N. Celanovic, and V. A. Katic, "Permanent magnet synchronous
generator cascade for wind turbine application," IEEE Transactions on Power
Electronics, vol. 23, no. 3, pp. 1136-1142, May 2008.
[17] S. A. Papathanassiou and M. P. Papadopoulos, "Mechanical stresses in fixed-speed
wind turbines due to network disturbances," IEEE Transactions on Energy
Conversion, vol. 16, no. 4, pp. 361-367, Dec 2001.
[18] C. Hao, M. Chao, and Z. Xucheng, "Research on the switched reluctance wind
generator system," in Systems, Man, and Cybernetics, 2001 IEEE International
Conference on, 2001, pp. 1936-1941 vol.3.
[19] H. Chen, T. Su, F. Xiao, and A. Z. Y. Zhu Yifeng, "A switched reluctance wind
power generator with the excitation of low voltage," in Systems, Man and
Cybernetics, 2002 IEEE International Conference on, 2002, p. 5 pp. vol.6.
[20] R. Pena, J. C. Clare, and G. M. Asher, "A doubly fed induction generator using
back-to-back PWM converters supplying an isolated load from a variable speed
wind turbine," IEE Proceedings-Electric Power Applications, vol. 143, no. 5, pp.
380-387, 1996.
[21] M. Y. a. O. Motoyoshi, "Active and reactive power control for doubly-fed wound
rotor induction generator," IEEE Trans. Power Electron., vol. vol. 6, no. no. 4, pp.
624–629, 1991.
[22] S. Peresada, A. Tilli, and A. Tonielli, "Indirect stator flux-oriented output feedback
control of a doubly fed induction machine," IEEE Transactions on Control
Systems Technology, vol. 11, no. 6, pp. 875-888, Nov 2003.
[23] K. Amei, Y. Takayasu, T. Ohji, and M. A. S. M. Sakui, "A maximum power
control of wind generator system using a permanent magnet synchronous
generator and a boost chopper circuit," in Power Conversion Conference, 2002.
PCC Osaka 2002. Proceedings of the, 2002, pp. 1447-1452 vol.3.
[24] K. Ohyama, S. Arinaga, and Y. Yamashita, "Modeling and simulation of variable
speed wind generator system using boost converter of permanent magnet
synchronous generator," in Power Electronics and Applications, 2007 European
Conference on, 2007, pp. 1-9.
Bibliography
161
[25] L. Wei, C. Abbey, and G. Joos, "Control and Performance of Wind Turbine
Generators based on Permanent Magnet Synchronous Machines Feeding a Diode
Rectifier," in Power Electronics Specialists Conference, 2006. PESC '06. 37th
IEEE, 2006, pp. 1-6.
[26] M. Chinchilla, S. Arnaltes, and J. C. Burgos, "Control of permanent-magnet
generators applied to variable-speed wind-energy systems connected to the grid,"
IEEE Transaction on Energy Conversion, vol. 21, no. 1, pp. 130-135, March 2006.
[27] J. A. Sanchez, C. Veganzones, S. Martinez, F. Blazquez, N. Herrero, and J. R.
Wilhelmi, "Dynamic model of wind energy conversion systems with variable
speed synchronous generator and full-size power converter for large-scale power
system stability studies," Renewable Energy, vol. 33, no. 6, pp. 1186-1198, Jun
2008.
[28] R. Johan and B. Lina Margareta, "Survey of Failures in Wind Power Systems With
Focus on Swedish Wind Power Plants During 1997–2005," IEEE
transactions on Energy conversion, vol. 22, no. 1, pp. 167-173, 2007.
[29] M. G. Simoes, B. K. Bose, and R. J. Spiegel, "Fuzzy logic based intelligent control
of a variable speed cage machine wind generation system," Power Electronics,
IEEE Transactions on, vol. 12, no. 1, pp. 87-95, 1997.
[30] T. Ahmed, O. Noro, K. Matzuo, Y. A. S. Y. Shindo, and M. A. N. M. Nakaoka,
"Minimum excitation capacitance requirements for wind turbine coupled stand-
alone self-excited induction generator with voltage regulation based on SVC," in
Telecommunications Energy Conference, 2003. INTELEC '03. The 25th
International, 2003, pp. 396-403.
[31] T. Ahmed, O. Noro, K. Matsuo, Y. A. S. Y. Shindo, and M. A. N. M. Nakaoka,
"Wind turbine coupled three-phase self-excited induction generator voltage
regulation scheme with static VAR compensator controlled by PI controller," in
Electrical Machines and Systems, 2003. ICEMS 2003. Sixth International
Conference on, 2003, pp. 293-296 vol.1.
[32] T. Ahmed, E. Hiraki, M. Nakaoka, and O. A. N. O. Noro, "Three-phase self-
excited induction generator driven by variable-speed prime mover for clean
renewable energy utilizations and its terminal voltage regulation characteristics by
static VAr compensator," in Industry Applications Conference, 2003. 38th IAS
Annual Meeting. Conference Record of the, 2003, pp. 693-700 vol.2.
[33] R. Cardenas, W. F. Ray, and G. M. Asher, "Switched reluctance generators for
wind energy applications," in Power Electronics Specialists Conference, 1995.
PESC '95 Record., 26th Annual IEEE, 1995, pp. 559-564 vol.1.
[34] D. McSwiggan, L. Xu, and T. Littler, "Modelling and control of a variable-speed
switched reluctance generator based wind turbine," in Universities Power
Engineering Conference, 2007. UPEC 2007. 42nd International, 2007, pp. 459-
463.
Bibliography
162
[35] R. Cardenas, R. Pena, M. Perez, J. A. C. J. Clare, G. A. A. G. Asher, and P. A. W.
P. Wheeler, "Control of a switched reluctance generator for variable-speed wind
energy applications," Energy Conversion, IEEE Transaction on, vol. 20, no. 4, pp.
781-791, 2005.
[36] K. Ogawa, N. Yamamura, and M. Ishda, "Study for Small Size Wind Power
Generating System Using Switched Reluctance Generator," in Industrial
Technology, 2006. ICIT 2006. IEEE International Conference on, 2006, pp. 1510-
1515.
[37] H. Polinder, F. F. A. van der Pijl, G. J. de Vilder, and P. J. A. T. P. J. Tavner,
"Comparison of direct-drive and geared generator concepts for wind turbines,"
IEEE Transaction on Energy Conversion, vol. 21, no. 3, pp. 725-733, Sep 2006.
[38] Z. Yi and S. Ula, "Comparison and evaluation of three main types of wind
turbines," in Transmission and Distribution Conference and Exposition, 2008.
T&D. IEEE/PES, 2008, pp. 1-6.
[39] E. Fagan, S. Grimes, J. McArdle, P. Smith, and M. Stronge, "Grid code provisions
for wind generators in Ireland," Power Engineering Society General Meeting,
2005. IEEE, pp. 3073-3079, 2005.
[40] I. M. de Alegria, J. Andreu, J. L. Martin, P. Ibanez, J. L. Villate, and H. Camblong,
"Connection requirements for wind farms: A survey on technical requierements
and regulation," Renewable & Sustainable Energy Reviews, vol. 11, no. 8, pp.
1858-1872, 2007.
[41] E. 50160, "Voltage characteristics of electricity supplied by public distribution
systems," 1999.
[42] I. Erlich and U. Bachmann, "Grid code requirements concerning connection and
operation of wind turbines in Germany," Power Engineering Society General
Meeting, 2005. IEEE, pp. 2230-2234, 2005.
[43] C. Jauch, J. Matevosyan, T. Ackennann, and S. Bolik, "International comparison
of requirements for connection of wind turbines to power systems," Wind Energy,
vol. 8, no. 3, pp. 295-306, 2005.
[44] C. Jauch, P. Sørensen, and B. Bak-Jensen, "International review of grid connection
requirements for wind turbines," Nordic Wind Power Conference, pp. 1–2, 2004.
[45] O. Anaya-Lara, X. Wu, P. Cartwright, J. B. Ekanayake, and N. Jenkins,
"Performance of doubly fed induction generator (DFIG) during network faults,"
Wind Engineering, vol. 29, no. 1, pp. 49-66, 2005.
[46] D. Kastha and B. K. Bose, "Investigation of fault modes of voltage-fed inverter
system for induction motor drive," IEEE Transactions on Industry Applications,
vol. 30, no. 4, pp. 1028-1038, 1994.
Bibliography
163
[47] A. Causebrook, D. J. Atkinson, and A. G. Jack, "Fault ride-through of large wind
farms using series dynamic braking resistors (March 2007)," IEEE Transactions
on Power Systems, vol. 22, no. 3, pp. 966-75, 2007.
[48] J. Morren and S. W. H. de Haan, "Ridethrough of wind turbines with doubly-fed
induction generator during a voltage dip," IEEE Transactions on Energy
Conversion, vol. 20, no. 2, pp. 435-441, Jun 2005.
[49] L. Peng, B. Francois, and Y. Li, "Improved Crowbar Control Strategy of DFIG
Based Wind Turbines for Grid Fault Ride-Through," in Applied Power Electronics
Conference and Exposition, 2009. APEC 2009. Twenty-Fourth Annual IEEE, 2009,
pp. 1932-1938.
[50] O. Gomis-Bellmunt, A. Junyent-Ferre, A. Sumper, and J. Bergas-Jan, "Ride-
Through Control of a Doubly Fed Induction Generator Under Unbalanced Voltage
Sags," IEEE Transactions on Energy conversion, vol. 23, no. 4, pp. 1036-1045,
2008.
[51] P. Zhou and Y. He, "Control strategy of an active crowbar for DFIG based wind
turbine under grid voltage dips," in Electrical Machines and Systems, 2007.
ICEMS. International Conference on, 2007, pp. 259-264.
[52] Y. Jin, J. E. Fletcher, and J. O'Reilly, "A Series-Dynamic-Resistor-Based
Converter Protection Scheme for Doubly-Fed Induction Generator During Various
Fault Conditions," Energy Conversion, IEEE Transactions on, vol. 25, no. 2, pp.
422-432, 2010.
[53] D. Xiang, R. Li, P. J. Tavner, and S. A. Y. S. Yang, "Control of a doubly fed
induction generator in a wind turbine during grid fault ride-through," IEEE
Transaction on Energy Conversion, vol. 21, no. 3, pp. 652-662, 2006.
[54] D. Santos-Martin, J. L. Rodriguez-Amenedo, and S. Arnaltes, "Providing Ride-
Through Capability to a Doubly Fed Induction Generator Under Unbalanced
Voltage Dips," IEEE Transactions on Power Electronics, vol. 24, no. 7, pp. 1747-
1757, 2009.
[55] C. Abbey and G. Joos, "Supercapacitor Energy Storage for Wind Energy
Applications," IEEE Transactions on Industry Applications, vol. 43, no. 3, pp.
769-776, 2007.
[56] O. Abdel-Baqi and A. Nasiri, "A Dynamic LVRT Solution for Doubly Fed
Induction Generators," IEEE Transactions on Power Electronics, vol. 25, no. 1, pp.
193-196, 2010.
[57] M. S. El-Moursi, B. Bak-Jensen, and M. H. Abdel-Rahman, "Novel STATCOM
Controller for Mitigating SSR and Damping Power System Oscillations in a Series
Compensated Wind Park," Power Electronics, IEEE Transactions on, vol. 25, no.
2, pp. 429-441, 2010.
[58] A. H. Kasem, E. F. El-Saadany, H. H. El-Tamaly, and M. A. A. Wahab, "An
improved fault ride-through strategy for doubly fed induction generator-based
Bibliography
164
wind turbines," Renewable Power Generation, IET, vol. 2, no. 4, pp. 201-214,
2008.
[59] J. Lopez, E. Gubia, E. Olea, J. Ruiz, and L. Marroyo, "Ride Through of Wind
Turbines With Doubly Fed Induction Generator Under Symmetrical Voltage
Dips," IEEE Transactions on Industrial Electronics, vol. 56, no. 10, pp. 4246-4254,
Oct 2009.
[60] M. A. Abido, "Analysis and assessment of STATCOM-based damping stabilizers
for power system stability enhancement," Electric Power Systems Research, vol.
73, no. 2, pp. 177-185, Feb 2005.
[61] A. H. Norouzi and A. M. Sharaf, "Two control schemes to enhance the dynamic
performance of the STATCOM and SSSC," IEEE Transactions on Power Delivery,
vol. 20, no. 1, pp. 435-442, Jan 2005.
[62] M. Molinas, J. A. Suul, and T. Undeland, "Low Voltage Ride Through of Wind
Farms With Cage Generators: STATCOM Versus SVC," IEEE Transactions on
Power Electronics, vol. 23, no. 3, pp. 1104-1117, 2008.
[63] J. C. Wu, "Novel circuit configuration for compensating for the reactive power of
induction generator," IEEE Transactions on Energy Conversion, vol. 23, no. 1, pp.
156-162, Mar 2008.
[64] W. Qiao, G. K. Venayagamoorthy, and R. G. Harley, "Real-Time Implementation
of a STATCOM on a Wind Farm Equipped With Doubly Fed Induction
Generators," IEEE Transactions on Industry Applications, vol. 45, no. 1, pp. 98-
107, Jan-Feb 2009.
[65] M. H. Haque, "Compensation of distribution system voltage sag by DVR and D-
STATCOM," in Power Tech Proceedings, 2001 IEEE Porto, 2001, p. 5 pp. vol.1.
[66] J. F. Conroy and R. Watson, "Low-voltage ride-through of a full converter wind
turbine with permanent magnet generator," Renewable Power Generation, IET, vol.
1, no. 3, pp. 182-189, 2007.
[67] M. A. Khan, P. Pillay, and M. Malengret, "Impact of direct-drive WEC Systems
on the design of a small PM wind generator," in Power Tech Conference
Proceedings, 2003 IEEE Bologna, 2003, p. 7 pp. Vol.2.
[68] M. Chinchilla, S. Arnaltes, and J. C. Burgos, "Control of permanent-magnet
generators applied to variable-speed wind-energy systems connected to the grid,"
IEEE transactions on Energy conversion, vol. 21, no. 1, pp. 130-135, 2006.
[69] J. Y. Dai, D. D. Xu, and B. Wu, "A Novel Control Scheme for Current-Source-
Converter-Based PMSG Wind Energy Conversion Systems," IEEE Transactions
on Power Electronics, vol. 24, no. 4, pp. 963-972, Apr 2009.
[70] P. Tenca, A. A. Rockhill, and T. A. Lipo, "Wind turbine current-source converter
providing reactive power control and reduced harmonics," IEEE Transactions on
Industry Applications, vol. 43, no. 4, pp. 1050-1060, Jul-Aug 2007.
Bibliography
165
[71] T. Nussbaumer and J. W. Kolar, "Improving mains current quality for three-phase
three-switch buck-type PWM rectifiers," IEEE Transactions on Power Electronics,
vol. 21, no. 4, pp. 967-973, Jul 2006.
[72] V. Nedic and T. A. Lipo, "Low-cost current-fed PMSM drive system with
sinusoidal input currents," IEEE Transactions on Industry Applications, vol. 42, no.
3, pp. 753-762, May-Jun 2006.
[73] T. Nussbaumer, M. Baumann, and J. W. Kolar, "Comprehensive design of a three-
phase three-switch buck-type PWM rectifier," IEEE Transactions on Power
Electronics, vol. 22, no. 2, pp. 551-562, Mar 2007.
[74] M. Baumann and J. W. Kolar, "Parallel connection of two three-phase three-switch
buck-type unity-power-factor rectifier systems with dc-link current balancing,"
IEEE Transactions on Industrial Electronics, vol. 54, no. 6, pp. 3042-3053, Dec
2007.
[75] M. Shen and F. Z. Peng, "Operation modes and characteristics of the Z-source
inverter with small inductance or low power factor," IEEE Transactions on
Industrial Electronics, vol. 55, no. 1, pp. 89-96, Jan 2008.
[76] C. J. Gajanayake, D. M. Vilathgamuwa, and P. C. Loh, "Development of a
comprehensive model and a multiloop controller for Z-source inverter DO
systems," IEEE Transactions on Industrial Electronics, vol. 54, no. 4, pp. 2352-
2359, Aug 2007.
[77] P. C. Loh, F. Gao, and F. Blaabjerg, "Topological and Modulation Design of
Three-Level Z-Source Inverters," IEEE Transactions on Power Electronics, vol.
23, no. 5, pp. 2268-2277, Sep 2008.
[78] F. Gao, P. C. Loh, F. Blaabjerg, R. Teodorescu, and D. M. Vilathgamuwa, "Five-
level Z-source diode-clamped inverter," Power Electronics, IET, vol. 3, no. 4, pp.
500-510, 2010.
[79] K. P. You and M. F. Rahman, "A Matrix-Z-Source Converter With AC-DC
Bidirectional Power Flow for an Integrated Starter Alternator System," IEEE
Transactions on Industry Applications, vol. 45, no. 1, pp. 239-248, Jan-Feb 2009.
[80] Z. J. Zhou, X. Zhang, P. Xu, and W. X. Shen, "Single-phase uninterruptible power
supply based on Z-source inverter," IEEE Transactions on Industrial Electronics,
vol. 55, no. 8, pp. 2997-3004, Aug 2008.
[81] Y. Tang, S. J. Xie, C. H. Zhang, and Z. G. Xu, "Improved Z-Source Inverter With
Reduced Z-Source Capacitor Voltage Stress and Soft-Start Capability," IEEE
Transactions on Power Electronics, vol. 24, no. 2, pp. 409-415, Feb 2009.
[82] M. Zhu, K. Yu, and F. L. Luo, "Switched Inductor Z-Source Inverter," IEEE
Transactions on Power Electronics, vol. 25, no. 8, pp. 2150-2158, 2010.

Bibliography
166
[83] S. M. Dehghan, M. Mohamadian, A. Yazdian, and F. Ashrafzadeh, "A Dual-Input
& Dual-Output Z-Source Inverter," IEEE Transactions on Power Electronics, vol.
25, no. 2, pp. 360-368, 2010.
[84] J. P. Barton and D. G. Infield, "Energy storage and its use with intermittent
renewable energy," IEEE Transactions on Energy Conversion, vol. 19, no. 2, pp.
441-448, 2004.
[85] Z. Chen and E. Spooner, "Grid power quality with variable speed wind turbines,"
IEEE Transaction on Energy Conversion, vol. 16, no. 2, pp. 148-154, 2001.
[86] E. Muljadi and H. E. McKenna, "Power quality issues in a hybrid power system,"
Ieee Transactions on Industry Applications, vol. 38, no. 3, pp. 803-809, May-Jun
2002.
[87] E. 50160, "Voltage characteristics of electricity supplied by public distribution
systems," European Committee for Electrotechnical Standardization (CENELEC),
1999.
[88] I. Erlich and U. Bachmann, "Grid code requirements concerning connection and
operation of wind turbines in Germany," Piscataway, NJ, USA, 2005, pp. 1253-7.
[89] C. L. Masters, J. Mutale, G. Strbac, S. Curcic, and N. Jenkins, "Statistical
evaluation of voltages in distribution systems with embedded wind generation,"
IEE Proceedings-Generation Transmission and Distribution, vol. 147, no. 4, pp.
207-212, Jul 2000.
[90] J. C. Pidre, C. J. Carrillo, and A. E. F. Lorenzo, "Probabilistic model for
mechanical power fluctuations in asynchronous wind parks," IEEE Transactions
on Power Systems, vol. 18, no. 2, pp. 761-768, 2003.
[91] P. Chiradeja and R. Ramakumar, "Voltage profile improvement with distributed
wind turbine generation-a case study," in IEEE Power Engineering Society
General Meeting, 2003, p. 2336 Vol. 4.
[92] R. Villafafila, S. Galceran, B. Bak-Jensen, C. Peiyuan, C. Zhe, and S. Sorensen,
"Probabilistic assessment of wind power production on voltage profile in
distribution networks," in Electrical Power Quality and Utilisation, 2007. EPQU
2007. 9th International Conference on, 2007, pp. 1-5.
[93] S. Chun-Line, "Effects of Distribution System Operations on Voltage Profiles in
Distribution Grids Connected Wind Power Generation," in Power System
Technology, 2006. PowerCon 2006. International Conference on, 2006, pp. 1-7.
[94] R. Pena, J. C. Clare, and G. M. Asher, "Doubly fed induction generator using
back-to-back PWM converters and its application to variable-speed wind-energy
generation," IEE Proceedings-Electric Power Applications, vol. 143, no. 3, pp.
231-241, May 1996.

Bibliography
167
[95] V. Kaura and V. Blasko, "Operation of a phase locked loop system under distorted
utility conditions," IEEE Transactions on Industry Applications, vol. 33, no. 1, pp.
58-63, 1997.
[96] G. M. J. Herbert, S. Iniyan, E. Sreevalsan, and S. Rajapandian, "A review of wind
energy technologies," Renewable & Sustainable Energy Reviews, vol. 11, no. 6, pp.
1117-1145, 2007.
[97] G. R. Slemon, "Modelling of induction machines for electric drives," IEEE
Transactions on Industry Applications, vol. 25, no. 6, pp. 1126-1131, 1989.
[98] M. H. J. Bollen, Understanding power quality problems: Voltage Sags And
Interruptions. New York: IEEE PRESS, 2000.
[99] J. G. Nielsen, M. Newman, H. Nielsen, and F. Blaabjerg, "Control and testing of a
dynamic voltage restorer (DVR) at medium voltage level," IEEE Transactions on
Power Electronics, vol. 19, no. 3, pp. 806-813, 2004.
[100] F. K. A. Lima, A. Luna, P. Rodriguez, E. H. Watanabe, and F. Blaabjerg, "Rotor
Voltage Dynamics in the Doubly Fed Induction Generator During Grid Faults,"
IEEE Transactions on Power Electronics, vol. 25, no. 1, pp. 118-130, 2009.
[101] F. Z. Peng, "Z-source inverter," IEEE Transactions on Industry Applications, vol.
39, no. 2, pp. 504-510, March-April 2003.
[102] W. Lixiang, T. A. Lipo, and C. Ho, "Matrix converter topologies with reduced
number of switches," in Power Electronics Specialists Conference, 2002. pesc 02.
2002 IEEE 33rd Annual, 2002, pp. 57-63 vol.1.
[103] C. Klumpner and C. Pitic, "Hybrid matrix converter topologies: An exploration of
benefits," in PESC Record - IEEE Annual Power Electronics Specialists
Conference, Rhodes, 2008, pp. 2-8.
[104] J. W. Kolar, F. Schafmeister, S. D. Round, and H. Ertl, "Novel Three-Phase AC-
AC Sparse Matrix Converters," IEEE Transactions on Power Electronics, vol. 22,
no. 5, pp. 1649-1661, 2007.
[105] L. Huber and D. Borojevic, "Space vector modulated three-phase to three-phase
matrix converter with input power factor correction," IEEE Transactions on
Industry Applications, vol. 31, no. 6, pp. 1234-1246, Nov-Dec 1995.
[106] F. Z. Peng, A. Joseph, J. Wang, M. S. Shen, L. H. Chen, Z. G. Pan, E. Ortiz-Rivera,
and Y. Huang, "Z-source inverter for motor drives," IEEE Transactions on Power
Electronics, vol. 20, no. 4, pp. 857-863, Jul 2005.
[107] E. Koutroulis and K. Kalaitzakis, "Design of a maximum power tracking system
for wind-energy-conversion applications," IEEE Transactions on Industrial
Electronics, vol. 53, no. 2, pp. 486-494, Apr 2006.
Bibliography
168
[108] M. Shen, A. Joseph, J. Wang, F. Z. Peng, and D. J. Adams, "Comparison of
traditional inverters and Z-source inverter for fuel cell vehicles," IEEE
Transactions on Power Electronics, vol. 22, no. 4, pp. 1453-1463, Jul 2007.
[109] Eltra, Specifications for connecting wind farms to the transmission network,
Second ed. Denmark: Document ELT1999-411a
[110] H. S. Ko, G. G. Yoon, and W. P. Hong, "Active use of DFIG-based variable-speed
wind-turbine for voltage regulation at a remote location," IEEE Transactions on
Power Systems, vol. 22, no. 4, pp. 1916-1925, Nov 2007.
[111] I. Erlich, M. Wilch, and C. Feltes, "Reactive power generation by DFIG based
wind farms with AC grid connection," in Power Electronics and Applications,
2007 European Conference on, 2007, pp. 1-10.
[112] R. Billinton and R. N. Allan, Reliability Evaluation of Power Systems: Springer,
1996.
[113] I. Y. F. Lun and J. C. Lam, "A study of Weibull parameters using long-term wind
observations," Renewable Energy, vol. 20, no. 2, pp. 145-153, 2000.
[114] J. L. Devore, Probability and statistics for engineering and the sciences:
Brooks/Cole Publishing Company, 1995.
[115] V. Akhmatov and A. H. Nielsen, "A small test model of the transmission grid with
a large offshore wind farm for education and research at technical university of
Denmark," IEEE/PES Power Systems Conference and Exposition. Vols 1-5, pp.
650-654, 2006.
[116] L. V. d. S. Pieter Schavemaker, Electrical power system essentials: John Wiley
and Sons, 2008.
[117] http://mesonet.agron.iastate.edu/.
[118] E. Hau, Wind Turbines: Fundamentals, Technologies, Application, Economics:
Springer, 2006.
[119] I. T. I. Council, The ITI (CBEMA) curve. (Available:
www.itic.org/technical/iticurv.pdf).
[120] D. P. K. Reuven Y. Rubinstein, Simulation and the Monte Carlo method Wiley-
Interscience, 2007.
[121] A. M. L. Dasilva and V. L. Arienti, "PROBABILISTIC LOAD FLOW BY A
MULTILINEAR SIMULATION ALGORITHM," Iee Proceedings-C Generation
Transmission and Distribution, vol. 137, no. 4, pp. 276-282, Jul 1990.

Appendices
169
APPENDICES
Appendix A: Laplace transform
WTG Grid
R1+jX
1 R2+jX
2
Vs
Is
Fig.A.1 single-line equivalent circuit of grid-connected wind farm including transmission
circuit
With the concern of fault situation shown in Fig.A.1, the (3.37) and (3.38) is rewritten as
s
m
ss
sss
s
m
dr vXR
X
L
Lv
sLRsLi
21
21
1
22 )(2
1
(A.1)
s
m
ss
sss
ss
m
qr vXR
R
L
Lv
sLRs
LRs
Li
21
21
1
22 )(2
1
(A.2)
The first terms in the right hand side of (A.1) and (A.2) are second-order model, which
contribute on the vibrating of rotor current response. Thus the second terms are constant
transfer function, which is insensitive on the vibrating. In order to reduce the vibrating, it
is only needed to focus on the second-order model. On the other hand, the second terms in
(A.1) and (A.2) are determined by the transmission circuits, but the first terms are
depended on the DFIG, which is the scope of this study.
Vs (pu)
t0
1
(1-k)
0t
]1,0[k
Vs (pu)
t0
1
(1-k)k
T
0t
(a) (b)

Appendices
170
Fig.A.2 The stator voltage of DFIG (a) without the series compensator (b) with linear-
ramped series compensator
Figure A.2(a) shows the profile of stator voltage without the series compensator. In
Fig.A.2, k is the voltage drop severity. At time 0t , there is a grid fault, which makes the
stator voltage drop. Herein, 0t is large enough to make the system into the rated condition
before the grid fault. Consequently, the stator voltage in Fig.A.2(a) in frequency domain
can be expressed by
)1
( 0stss e
s
k
sVv
(A.3)
Where Vs is the magnitude of the nominal stator voltage.
On the other hand, with the linear ramp voltage generated by the series compensator, the
stator voltage of the DFIG can be illustrated in Fig.A.2(b). And this voltage in frequency
domain can be expressed by
)11
( 0
2
stss e
sT
k
sVv
(A.4)
Hence, due to (A.1) and (A.2), the rotor current responses according to the stator voltages
shown in Fig.A.2 can be calculated as follow: Substituting (A.3) into (A.1) and (A.2), the
rotor current d- and q-axis components can be calculated by inverse Laplace
transformation, which is presented in (3.39) and (3.40). Similarly, substituting (A.4) into
(A.1) and (A.2), the rotor current d- and q-axis components can be also calculated as
shown in (3.43) and (6.44).

Appendices
171
Appendix B: Wind power probability calculation
Derivation of the equation (6.9):
With the three operating ranges of the WTG, the calculation of the captured wind power
can be divided into three sub-sections as zero output power, rated output power and
power between zero and rated values.
During zero output power, the corresponding probability can be expressed with the wind
speed distribution in (6.5):
])(exp[])(exp[1
])(exp[))((])(exp[))(()0( 1
0
1
koutkin
v
kk
v
kkP
c
v
c
v
dvc
v
c
v
c
kdv
c
v
c
v
c
kF
out
in
During rated output power, the probability is derived as:
])(exp[])(exp[
])(exp[))(()0( 1
koutkr
v
v
kkP
c
v
c
v
dvc
v
c
v
c
kF
out
r
Finally, when the output power is between zero and the rated levels, the probability value
can be calculated by applying (6.6) directly. Hence, (6.9) can be determined.