Embed Size (px)
Citation preview

Investigation of Storage Options for Scientific Computing
on Grid and Cloud Facilities
Gabriele Garzoglio1
Fermi National Accelerator Laboratory, P.O. Box 500, Batavia, IL, 60510, USA
E-mail: [email protected]
Abstract. In recent years, several new storage technologies, such as Lustre, Hadoop,
OrangeFS, and BlueArc, have emerged. While several groups have run benchmarks to
characterize them under a variety of configurations, more work is needed to evaluate these
technologies for the use cases of scientific computing on Grid clusters and Cloud facilities.
This paper discusses our evaluation of the technologies as deployed on a test bed at FermiCloud, one of the Fermilab infrastructure-as-a-service Cloud facilities. The test bed
consists of 4 server-class nodes with 40 TB of disk space and up to 50 virtual machine clients,
some running on the storage server nodes themselves. With this configuration, the evaluation
compares the performance of some of these technologies when deployed on virtual machines
and on "bare metal" nodes. In addition to running standard benchmarks such as IOZone to
check the sanity of our installation, we have run I/O intensive tests using physics-analysis
applications. This paper presents how the storage solutions perform in a variety of realistic use
cases of scientific computing. One interesting difference among the storage systems tested is
found in a decrease in total read throughput with increasing number of client processes, which
occurs in some implementations but not others.
1. Introduction In order for large distributed systems to maintain good scalability into the next generation of Grid and
Cloud infrastructures, the ability for applications to access data from a large number of concurrent
clients is of fundamental importance. Several new storage technologies have emerged recently with
interesting properties of fault tolerance, fairness of bandwidth distribution across clients, and minimal operational overheads. Rigorous testing of these solutions for specific access patterns is the key to
understand the relevance of these solutions for specific use cases.
The Grid and Cloud Computing department of the Fermilab Computing Sector has conducted an evaluation of four storage technologies for the use cases of data intensive science on Grid and Cloud
resources. The technologies evaluated are Lustre [2], Hadoop [3], BlueArc [4], and OrangeFS [5].
Because of the relevance of virtualization technologies in the everyday operations of modern computing facilities, we focused on the evaluation of client and server deployments over a variety of
virtualized resource configurations.
In our evaluation, we tested storage technologies using three different methodologies:
1 To whom any correspondence should be addressed.

1. Standard benchmarks: We used the standard storage benchmarks MDTest [13] and IOZone
[7]. MDTest measures scalability of the meta-data operations. IOZone measures aggregate
bandwidth to storage, simulating both high-speed highly-concurrent sequential random access
patterns; 2. Application-based benchmarks: we use the offline framework of the NOνA experiment to
measure storage performance, simulating a skimming root-based application demanding a
highly-concurrent random access pattern; 3. HEPiX Storage Group benchmarks: in collaboration with the HEPiX Storage Working Group,
we have integrated the NOνA computing framework with the HEPiX storage test bed. The
HEPiX group has used this application to evaluate storage technologies not covered under our
investigation, in particular client-side AFS in front of Lustre, GPFS (with and without client-side AFS), and NFSv4.
In sec. 2, we describe our test bed. The performance measurements from standard benchmarks is
discussed in sec. 3, for the study of aggregate bandwidth, and sec. 4, for the scalability of the metadata servers. Results from the application-based benchmarks are in sec. 5. A summary of the results from
the HEPiX storage group is presented in sec. 6. We discuss comparative considerations of fault
tolerance and ease of operations in sec. 7, before concluding in sec. 8. Acknowledgments are in sec. 9.
2. Test Bed Specifications
We evaluated Lustre, Hadoop, BlueArc, and OrangeFS by installing the storage servers on four
FermiCloud (FCL) machines, typically using three machines as data nodes and one as a metadata
node. The machine specifications are described in the Lustre report [1] and are summarized in the diagram of figure 1.
Figure 1. Two diagrams of the test bed. On the left, the servers are installed on “bare metal” and the clients are on FCL or ITB. On the right, the servers are installed either on “bare meta”
or virtual machines; the clients are either on the same machine as the server (“on-board” clients
or on remote machines (“external client).
The clients were deployed on FermiCloud as well as on an external cluster, the FermiGrid
Integration Test Bed (ITB in the diagrams). On FCL, the virtualization infrastructure was KVM; on
ITB, it was XEN. This difference may account at least in part for the differences in performance
between on-board and external clients. Note that for the BlueArc server evaluation, we used the Fermilab BlueArc production servers i.e. we did not deploy the servers in the FermiCloud testbed. The
BlueArc production servers consist of high-end hardware designed for scalability to hundreds of
clients. In this sense, the results may not represent an “apple-to-apple” comparison of BlueArc with the other storage solutions.
Figure 1 shows two diagrams, or views, of the test bed. On the left, the diagram represents an
installation of storage servers on bare metal (i.e. directly on the host, as opposed to on a virtual machine) (left box) and clients on different machines (on FCL or, for Lustre, on ITB) (right box). On
the right, the diagram represents servers installed on bare metal or virtual machines (for Lustre) (left
box) and clients either on the same machine as the server – “on-board” clients – or on different
machines (FCL or ITB) – “external” clients (right box).
These “views” of the testbed represent two main topological use cases. On the left, we recreated the topology of a set of storage service installed on bare metal machines and accessible from remote client
machines. With this topology we compared the performance of storage solutions deployed on the
“bare metal”. On the right, we tested the more complex topology of storage services running on the same machines as their clients. The storage servers run either on the bare metal or on a virtual machine
(for Lustre). This topology is typical of some storage solutions, such as Hadoop, where the disks from
a cluster are aggregated in a single storage namespace for the client machines on the same cluster.
With this topology, we compared the performance of storage for “on-board” vs. “external” client machines.
3. Data Access Measurements from Standard Benchmarks
We have used the IOZone test suite to measure the read/write performance of the storage solutions in the configurations described in sec. 2. We configured IOZone to write and read 2 GB files from
multiple processes, or “clients”, on multiple “bare-metal” and virtual machines. For a given number of
these machines, our measurements typically show the read / write aggregate bandwidth to / from the clients (y-axis) vs. an increasing number of client processes (x-axis).
3.1. Lustre
We measured the performance of Lustre v1.8.3 on SL5 kernel 2.6.18 with servers on “bare metal” and
virtual machines and with “on-board” (on FCL) and “external” (on ITB) clients. The full report can be found elsewhere [1]. We report here a few key points from that report.
1. The measured read bandwidth from “external” clients is the same (~350 MB/s) whether the
servers are deployed on bare metal or on virtual machines (VM). The key to fast read performance from VM is using VirtIO drivers for the network.
2. “On-board” clients read about 15% more slowly than “external” clients. While this is not a
significant difference, it means that the operating system does not perform any optimization
when information is transferred between virtual machines all hosted on the same physical node.
3. Servers running on “bare metal” provide a write bandwidth three times faster than servers
running on virtual machines (~70 MB/s on VM). We could not improve the performance by changing the number of CPU assigned to the server virtual machine or changing IDE and
VirtIO drivers for disk and network access. According to anecdotal reports on a proprietary
Lutre-based storage solution, this performance gap may be reduced using SL6, although we could not test it in this evaluation.
4. Date striping does not have any effect on write bandwidth. External clients read 5% faster
with data striping, not a significant effect.
3.2. Blue Arc The read and write bandwidth of the Blue Arc (BA) storage was measured on the BA Titan HA
production deployment at Fermilab. This consists of 2 tiers of storage designed for a combined
throughput of more than 5 Gbps. One tier consists of RAID-6 SATA disks designed for a combined throughput of 200 MB/s or more (see tests on the /nova area below). The other tier consists of RAID-5
fiber-channel disks, faster than the SATA disks, but smaller in aggregate size and spindles because of
the higher cost, designed for I/O intensive applications (see tests of the /garzogli-tst area below). The storage is mounted via NFS to the clients on the ITB. While the BA installation was shared among
several clusters, we attempted to limit the influence of external network traffic by conducting our
measurement at night and using dedicated BA volumes for some measurements (/garzogli-tst area
tests).

We conducted a comparison of the performance between clients on bare metal and virtual machines
to answer the question
How well do VM clients perform vs. Bare Metal clients?
The measurements were performed with a varying number of clients hosted on the FermiGrid
Integration Test Bed. The VM used VirtIO network drivers, always superior in performance to the
IDE drivers in our tests. Figure 2 shows a plot of the comparison, where in general one can observe
that
clients on the bare metal read ~10% faster than on VM;
clients on the bare metal write ~5% faster than on VM.
Figure 2. A comparison of Blue Arc bandwidth performance for a varying number of clients (x-axis) on bare metal (BM) and on virtual
machines (VM). Bare metal read and write bandwidths are higher than
on virtual machines.
Figure 3. Left: the diagram shows that the VM transmits data to the
server using 3 network buffers. The transmit network buffer in the
virtual machine writes to the network buffer of the bridge managed by the host operating system. In turn, the bridge writes to the transmit
network buffer of the host machine. This, then, sends the data over the
network. Right: The size of the buffers is controlled by the txqueuelen
parameters of the network interfaces. The table shows the values tested for such parameter for the different interfaces.
Eth interface txqueuelen
Host 1000
Host / VM bridge 500, 1000, 2000
VM 1000

We tried to reduce this gap for writing by changing the size of the Ethernet buffer of the network
bridge used by the VM to send data. As shown in figure 3 (left), the VM client transmits data to the
server transferring the network data from the VM transmit buffer, to the buffer of the bridge managed
by the host operating system, to the transmit buffer of the host machine. A mismatch in the length of these buffers is known to cause a slowdown in network write operations. We changed the length of the
bridge buffer using “reasonable” values, as in figure 3 (right). As shown in figure 4, these changes did
not affect the write bandwidth to BA.
Figure 4. A comparison of the write bandwidth to BA (y-axis) for a varying
number of clients (x-axis) on 6 bare metal or 6 virtual machines, when varying the size of the network bridge buffer of the host. The variation in size
(txqueuelen parameter) does not affect the write bandwidth of the virtual
machines, as shown by the red, brown, and yellow traces. The bare metal write bandwidth is always higher, as shown by the black trace.
3.3. Hadoop
We deployed Hadoop v0.19.1-20 with 1 name node and 3 data nodes on top of ext3 disk partitions on 4 physical hosts. Clients mount the Hadoop file system via Fuse [6] from FCL and ITB. We measured
read and write bandwidth under different conditions to answer the following questions:
How well do VM clients perform vs. Bare Metal clients?
Is there a difference for External vs. on-board clients?
How does number of replicas change performance?
Figure 5 shows a plot of the measurements for different conditions of the clients and of the number
of replicas. The read measurements (top plot) show that a small number of “on-board” bare metal clients have
non-physically high read speed, given the network hardware. Considering the amount of memory
available on the machines (24 GB / machine), the relatively small number of clients (up to 24 overall i.e. 8 per machine), and the size of the test files (2 GB per client), this can be explained as an effect of
kernel data caching. For larger numbers of clients, the caching effect disappears as expected. The "on-
board" bare metal clients generally performed the fastest. Read performance is generally 50% – 100% faster than clients on virtual machines ("on-board" or external).

The write measurements (bottom plot) show that “on board” clients on bare metal also gain from
kernel caching for a small number of clients. They are also generally faster than for clients on virtual
machines (“on-board” or external), except for a large number of clients (above 45).
As for the difference between “on-board” vs. external clients on virtual machines, the plots show that “on-board” clients are generally faster than external clients for write and vice versa for read (for 1
replica).
Figure 5. A comparison of the read (top) and write (bottom) bandwidth (y-
axis) of Hadoop for a varying number of clients (x-axis) under different conditions. Brown trace: clients run on 3 bare metal machines with Hadoop
set to 1 replica. Yellow trace: “on-board” clients run on 21 virtual machines
(7 VM on the 3 data nodes) with 1 replica. Black, dark-green, light-green traces: external clients run on 21 VM (7 VM x 3 hosts) with 1, 2, and 3
replicas respectively.

The plots also show that the number of replicas has little or no effect on read bandwidth, while the
write bandwidth scales almost linearly with the number of replicas. So, while data (block) placement
does not make a big difference in read speed since in our use case blocks are read mostly sequentially,
the replication of blocks to increase fault tolerance slows down the system almost proportionally to the number of replicas.
3.4. OrangeFS
Similarly to Hadoop, we initially deployed OrangeFS v2.8.4 with 1 name node and 3 data nodes on top of ext3 disk partitions on 4 physical hosts. With OrangeFS, however, we’ve noticed an
improvement in performance by increasing the number of name nodes to up to four. Clients mount
OrangeFS via NFS from FCL specifying a name node.
We measured read and write bandwidth performance under different conditions to answer the following questions:
How well do VM clients perform vs. Bare Metal clients?
Is there a difference for External vs. on-board clients?
How does number of name nodes change performance?
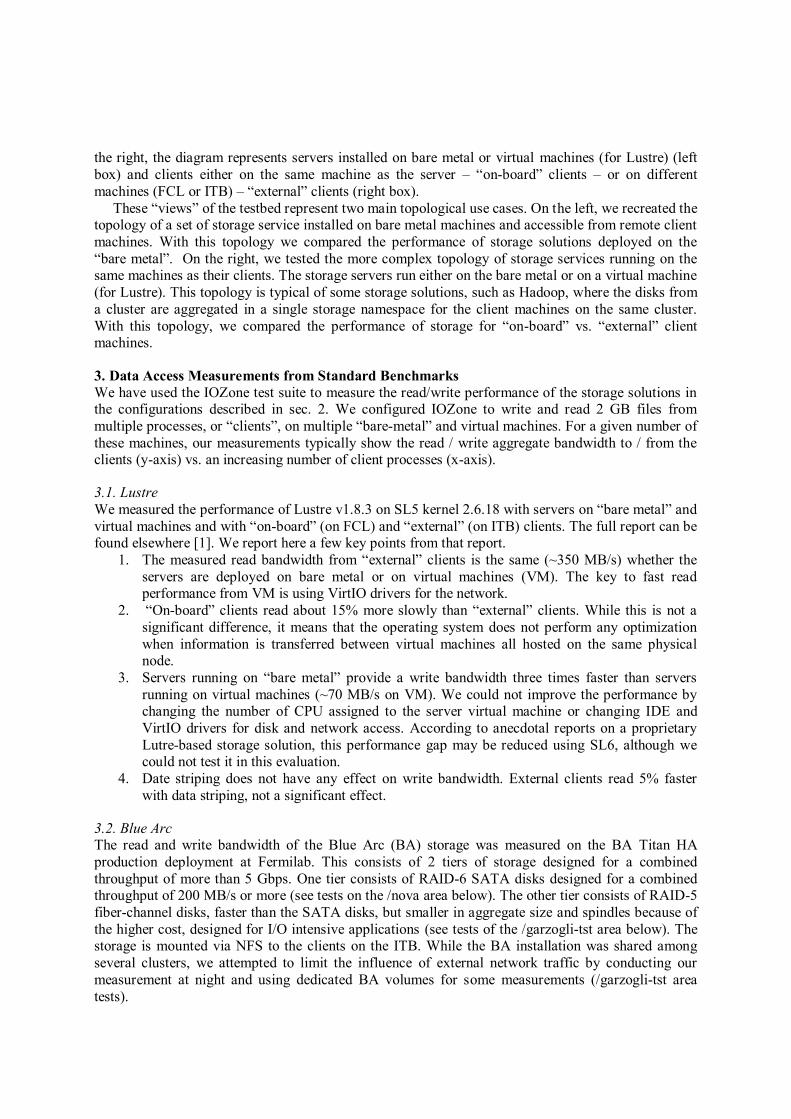
Counterintuitively, figure 6 shows that for a given total number of client processes, clients on bare
metal did not perform better than on virtual machines. In particular, we compare the performance of bare metal clients with the “fastest” on-board clients on virtual machines (3 name nodes and 4 data
nodes when each client mounts a specific name node). Writes are slower (~80%) on bare metal than
on VM. Reads are slightly slower for a few clients, but significantly slower (~50%) for a large number of clients (above 40).
As for the difference between “on-board” vs. external clients on virtual machines, figure 6 shows
that read bandwidth is faster (10% to 60%) on “on-board” clients than on external clients. The write
performance measurements, however, are not as consistent and we consider the write results (for the on-board vs. external clients comparison) not conclusive. In fact, for most configurations, the write
bandwidth is the same for “on-board” and external clients (the traces on the plots are superimposed);
however, for one of the external client configurations we consistently measured that external clients write slower (~70%) than the on-board clients (red trace with square symbols – clients on VMs each
mounting one of the 4 name nodes in the testbed). The measurements were reproducible and we could
not reconcile this discrepancy. The OrangeFS system allows the instantiation of multiple name nodes in the system. For our set up
with three data nodes, we performed measurements of read and write bandwidth with one name node
and four name nodes. When using 4 name nodes, we tried two cases: (1) we mounted all client
machines through one name node; (2) we mounted a specific name node to certain client machines, in order to balance manually the load. From our measurements it appears that the read performance is
improved (10%-60%) with four name nodes; however, the write performance is worsened (~70%)
when using external clients. This may point to the need to optimize the number of name nodes of an OrangeFS storage, depending on the expected access pattern. As for the effects of performing manual
load balancing (point (2) above), we observe that the manual balance has slightly improved read
performance for the same conditions (all on-board or external clients), although, this effect is not
present for the write performance.
Figure 6. A comparison of the read (top) and write (bottom) bandwidth (y-
axis) of OrangeFS for a varying number of clients (x-axis) under different
conditions. Explaining the legend, clients run “on-board” on the 4 storage
servers hosts (4 BM on-board) or on 21 virtual machines (7 VM on 3 hosts), “on-board” and externally. Performance varies depending on the
number of name nodes instantiated (4nn or 1nn) for 3 data nodes (3dn). It
also varies depending on whether each client virtual machine mounts a different name node (Clts mount many) or all mount one name node (Clts
mount 1).
4. Metadata Access Measurements from Standard Benchmarks We measured the performance of the metadata servers of Lustre, Hadoop, and OrangeFS using the
MDTest utility [13]. This tool can be configured to run typical file system operations (directory / file
creation, directory / file stats, etc.) from multiple hosts concurrently. The interaction with the file
system from each client host is coordinated via MPI.

Figure 7. The number of operations per second for various types of metadata operations (directory creation, file stat, etc.) for the three
different modalities of interactions (Unique, Shared, Single) with
Hadoop, OrangeFS, and Lustre. For Haddop and OrangeFS, the measurements have been taken with an increasing number of clients
processes.

For Hadoop and OrangeFS we ran tests with an increasing number of client processes, from 21 to
504, spread across 21 VM (7 VM on 3 hosts), managing up to 50,400 files and directories. For Lustre,
the measurements were done with 48 clients on 6 VM (1 VM on 6 hosts). In addition to MDTest, other
tests have been performed on Lustre and they are described in the Lustre report [1]. We configured MDTest to perform metadata operations with three different modalities:
Unique: each client performs metadata operations on a directory and files unique for that
client, all at the same time (mdtest -d /mnt/pvfs2/mdtest/ -n 100 -i 3 -N 1 -v -u);
Shared: one client creates a set of test files, then all clients perform operations on those shared
files at the same time (mdtest -d /mnt/pvfs2/mdtest/ -n 100 -i 3 -N 1 -v -c);
Single: all clients perform operations on files unique for that client, but all files are located in
a single shared directory (mdtest -d /mnt/pvfs2/mdtest/ -n 100 -i 3 -N 1 -v).
For these modalities, figure 7 shows the number of operations per second for various metadata
interactions.
Figure 8 shows a comparative analysis of the data in figure 7 for directory and file stat for the “Single” modality of interaction. The plot shows that Hadoop scales better than OrangeFS as the
number of clients grows, especially for file stat. For a small number of clients (up to 63), however,
OrangeFS performs better or similarly to Hadoop. Lustre has a comparable performance as Hadoop and OrangeFS for the only measurement performed (48 clients).
Figure 8. A comparison of the performance of the medata servers of
Hadoop, OrangeFS, and Lustre. The plot shows the number of operations
per second supported for the two operations of file stat and directory stat for an increasing number of clients. To give a sense of scale, at 504 clients,
50,400 files or directories were used in the measurement. Hadoop scales
better than OrangeFS for a large number of clients.
5. Data Access Measurements from Application-based Benchmarks
We test the performance of the storage solutions using real High Energy Physics analysis applications.
Our main test benchmark uses “Ana”, the framework of the NOνA experiment [8] at the time, which is

based on root. The application reads a fraction of each event as fast as possible (about 50%),
effectively simulating an event “skimming” application. We access 10 files of 1.5 GB in size in
random order and, before starting each test, we clear the client buffer cache. We run one client per
machine and measure bandwidth by looking at the amount of data transferred from the statistics of the client network interface.
For Lustre, we also made measurements using a test benchmark based on “Loon”, the framework
of the MINOS experiment [9]. This benchmark, however, resulted to always be CPU-bound, thus not a good gauge of storage performance [1].
Our benchmarks for write bandwidth also resulted to always be CPU-bound, mainly due to the
allocation of root data structures. The write bandwidth to storage is about 3 MB/s. Such requirement is
easily supported by all storage solutions.
5.1. Lustre
We used our benchmark to measure the performance of Lustre installed on “bare metal” and virtual
machines for “on-board” (FCL) and “external” (ITB) clients. The full report can be found elsewhere [1]. We report here a few key points of our evaluation:
1. Our baseline is measured using external clients reading from Lustre on “bare metal” with no
data stripes. For 21 clients, the average bandwidth is 12.55 0.06 MB/s; for 1 client 15.6 0.2 MB/s.
2. The performance of Lustre on a virtual machine is comparable to the one on a “bare metal”
installation. For 21 external clients, the average bandwidth is 12.27 0.08 MB/s; for 1 client
15.3 0.1 MB/s.
3. Clients on virtual machines have comparable read performance as clients on “bare metal”. “On-board” clients are 6% faster than external clients. Note that this result is opposite for
Hadoop and OrangeFS. For 21 clients, the average bandwidth is 13.02 0.05 MB/s; for 1,
14.4 0.1 MB/s. 4. Data striping leads to a more consistent distribution of bandwidth across clients. For example,
21 external clients reading from Lustre on a virtual machine have an average bandwidth of
12.81 0.01 MB/s. Note that the error on the client distribution is 10 times smaller than for the case with no striping (point 2).
5. For a larger number of clients (e.g. 49 “on-board” and external clients), the distribution of bandwidth to clients is not fairly distributed (the bandwidth spread is 20%). However, the
spread is comparable between “on-board” and external clients.
In addition, it should be noted that the configuration of the read-ahead parameter of Lustre has an impact on the performance of root-based applications. In our case, our skimming application
benchmark reads 50% of each event by design. On BA, OrangeFS, and Hadoop, the clients transfer
50% of each file as expected. Conversely, on Lustre they transfer 85% because the default read-ahead configuration is inadequate for this use case. Tuning this parameter is crucial for good performance.
5.2. Blue Arc
The application benchmark to evaluate the performance of the Blue Arc storage was measured reading
data from the BA production system at Fermilab. We ran measurements to answer the following questions:
How does read bandwidth vary for clients on “bare metal” vs. virtual machines?
For a larger number of clients (e.g. 49), is the distribution of the bandwidth fair across clients?
To answer the first question, we ran tests with clients on 11 “bare metal” machines (on both FCL
and ITB), then on 21 virtual machines on ITB, to compare their performance. The resulting average
bandwidth was essentially the same, at 8.38 0.03 MB/s and 8.15 0.03 MB/s respectively. Figure 9
shows the plots of the results. It should be noted that some VM showed consistent slow performance accessing storage, although in the time allocated for the tests, we were unable to identify the reason.

Figure 9. Read bandwidth accessing data on the Blue Arc using the application-based
benchmark. One benchmark process is run on each of 11 “bare metal” machines (left plot) and
on 21 virtual machines (right plot). The read bandwidth is essentially the same. Three virtual machines performed consistently slower.
Figure 10. Read bandwidth accessing data on the Blue
Arc using the application-based benchmark. One
benchmark process was run on each of 49 virtual machines. The read bandwidth is fairly distributed
across clients (within 1% of the distribution). Three
virtual machines performed consistently slower.

To answer the question on fairness of the bandwidth distribution across clients, we ran concurrently
a benchmark process on each of 49 virtual machines deployed on 11 hosts. We chose this number of
virtual machines because it is the maximum number we could create without disrupting other activities
and, at the same time, it is not too small compared to the typical use case of Grid machines concurrently accessing storage, generally at a few hundreds machines.
The resulting aggregate bandwidth is about 400 MB/s. At this scale, the BA system fairly
distributed the available bandwidth across all 49 machines (within less than 1% of the distribution), as shown if figure 10. As noted above, 3 virtual machines had a consistently slow connection to the
storage.
5.3. Hadoop
We evaluated the performance of Hadoop with the same system configuration used for the IOZone tests (see sec. 3.3). We measured read and write bandwidth under different conditions to answer the
following questions:
How does read bandwidth vary vs. the number of file replicas?
Is there a difference for external vs. on-board clients?
For a larger number of clients (e.g. 49) at the saturation of the network, is the distribution of
the bandwidth fair across clients? To answer the first question, we ran the application-based client on 21 external virtual machines (1
process per machine) three times, each time configuring the system to provide a different number of
replicas (from 1 to 3). When a client accesses a data block within a file, the metadata server (name node) makes available that block from one of the data nodes. Because access to the blocks is
sequential, the read bandwidth is not affected by the replication factor. Figure 11 (left plot) shows that
the measured read bandwidth is the same at 7.9 0.1 MB/s for the measurements with 1, 2, and 3 replicas.
Figure 11. The plots show the read bandwidth from Hadoop running concurrently one instance of the application-based benchmark at each of the 21 virtual machines. The plot
on the left shows that the number of replicas does not affect read bandwith. The plot on
the right shows that clients on external virtual machines read about 5% faster than clients on-board.
We measured the read bandwidth for “on-board” and external virtual machines, running one
instance of the application-based benchmark per virtual machine, using 21 virtual machines. These
were instantiated on 4 physical hosts on FCL for “on-board” clients (as many as the server nodes, by definition) and on 7 hosts on ITB for external clients. The system was set up with 2 replicas, although

this does not affect the results, as discussed. Figure 11 (right plot) shows that the external clients read
about 5% faster than “on-board” clients. External clients are always faster, irrespectively of whether
the on-board virtual machines are deployed on the name node or on the data nodes. The virtualization
managers, KVM for on-board clients and XEN for external clients, may be in part responsible for the difference. This trend, however, is similar to the results from OrangeFS, but opposite for Lustre
(virtual server deployment), where on-board clients read 6% faster than external clients. Similarly to
the BA measurements, three virtual machines showed particularly slow access to the data and their measurements are not shown in the plot.
The same trend can be seen in the measurements to study the fairness of the bandwidth distribution
for a large number of clients (49). This number of clients has an aggregate bandwidth (~330 GB/s) at
the saturation of the network to the 3 data nodes (1 GE interface per node). We ask whether in these conditions, the storage solution can apportion approximately the same amount of bandwidth to each
client.
Figure 12. The plot shows the fairness of bandwidth distribution
when running 49 clients concurrently. For each client, the open
circles show on the left y-axis the ratio between the time it takes for that client to read all the data (15GB) and the time of the fastest
client. The full circles show on the right y-axis the same
information in terms of bandwidth. External clients are 10% faster than on-board clients; within each group, though, bandwidth is
distributed fairly within 2% of the distribution.
Figure 12 shows a plot of the measurements. We run 49 clients concurrently and we measure the time it takes for each client to read 10 files of 1.5 GB each. On the left y-axis, for each client the open
circles show the ratio between this time and the time from the fastest client, 1117 seconds. For
convenience, the clients are sorted on the x-axis from fastest to slowest. For example, client number
21 (the fastest of the on-board clients) takes about 7% longer (1.07) to read the 15 GB of data, as compared to client number 1, the fastest of the external clients. The slowest client read takes 13%

longer than the faster, if we do not consider the virtual machines with very slow access to the data (5,
in this case, marked as “outliers” when in the plot). On the right y-axis, the full circles show the same
measurement in terms of bandwidth.
In summary, when running 49 concurrent clients, external clients read about 10% faster than on-board clients, a larger difference than noted above (5%) for 21 clients. Among on-board and external
clients, the bandwidth is distributed “fairly” i.e. each client gets the same share of the bandwidth
within 2%.
5.4. OrangeFS
We evaluated the performance of OrangeFS with 1 name node and 3 data nodes on 4 hosts. We
measured read and write bandwidth under different conditions to answer the following questions:
Is there a difference for external vs. on-board clients?
For a larger number of clients (e.g. 49) at the saturation of the network, is the distribution of
the bandwidth fair across clients? To answer the first question, similarly to the measurements for Hadoop, we ran the application-
based benchmark on 20 virtual machines. The results are similar to the ones for Hadoop, with external
clients reading at 7% higher bandwidth than on-board clients (for Hadoop it was 5%) and opposite of the Lustre results (sec. 5.3). The left plot of figure 13 shows the measured bandwidth for the external
(triangles) and on-board (circles) clients.
Figure 13. The plot on the left shows the bandwidth from the application-based benchmark
running as one process on each of 21 on-board and external virtual machines. The plot shows
that external clients read 7% faster than on-board clients. The plot on the right shows the
fairness of bandwidth distribution when running 48 clients concurrently. For each client, the open circles show on the left y-axis the ratio between the time it takes for that client to read all
the data (15GB) and the time of the fastest client. The full circles show on the right y-axis the
same information in terms of bandwidth. Among external clients, the bandwidth is fairly distributed (within 2%); however, among on-board clients it is not, with a spread of 20% of the
distribution.
To answer the question on the fairness of the bandwidth, we followed the same methodology as for Hadoop (sec. 5.3), using 48 virtual machines at the saturation of the network with the 3 data nodes. As
shown on the right plot of figure 13, the fastest external client read the 10 files of 1.5 GB each in 948
seconds (open circles on the left y-axis). The slowest of the on-board clients took 25% longer than this
(as opposed to 13% for Hadoop). The plot shows the same measurement in terms of bandwidth (full

circles on the right y-axis). Within external clients, we see that the fairness of the distribution is
similar to Hadoop, all clients having the same bandwidth within 2% of the distribution. For on-board
clients, instead, the spread is much higher, at about 20%, comparatively a distribution not as fair. This
last result is similar to the spread measured for the virtual server deployment of Lustre (for both on-board and external clients in that case).
6. Data Access Measurements from the HEPiX Storage Group
In order to extend the evaluation of storage solutions using our application-based benchmark beyond the technologies targeted in this work, we have partnered with the HEPiX storage group [10]. The
group, lead by Andrei Maslennikov, deploys different storage technologies on a testbed. It then
evaluates the performance using applications from Atlas and CMS, as well as our benchmark based on
the NOνA offline framework. The group measures the number of physics events per second (y-axis) read by a given number of
concurrent application instances / jobs (x-axis) in a fixed amount of time (figure 14). The
measurements consist of 20,40,60,80 jobs on a 10-node cluster (2,4,6,8 jobs per node), where each of the jobs is processing a dedicated non-shared set of event files. This is a complementary approach to
ours, whereby we measure bandwidth to storage to read a fixed amount of data. In addition, in the
HEPiX testbed the NOνA application writes the few selected events back to storage, while we write them to local (fast) storage.
The HEPiX group evaluated GPFS, Lustre, NFS and AFS, in addition to hybrid solutions
consisting of AFS in front of Lustre (AFS/VILU) and GPFS (AFS/VIGP), to implement client-side
caching. A status report was presented in Oct 2011 [11]. In the case of the NOνA application, the best performing storage was Lustre with AFS client caching, closely followed by Lustre. This is consistent
with our findings (sec. 8). GPFS and its AFS-based hybrid configuration performed the worst.
Figure 14. The HEPiX storage group evaluation of storage
technologies. The group runs 20,40,60, 80 instances of a physics application concurrently from 10 nodes (x-axis) and
measures the number of physics events per second read by the
application in a fixed time (y-axis). The different trends show the performance of different technologies.

7. Fault tolerance and operational considerations
In addition to measuring the performance of storage solutions, we simulated failure conditions and
evaluated the response of the system. From our experience, we also provide some considerations on
ease of operations for the various technologies. For Lustre, the considerations on fault tolerance and ease of operations are reported elsewhere [1].
These are a few major considerations:
The deployment of a Lustre server requires a special Kernel on a special file system. The
deployment of clients requires the installation of a Lustre kernel module. This specialization of the kernels has operational implications on the availability of security patches and the
ability to perform system upgrades.
The configuration of the system is conveniently managed through a server (Lustre MGS),
rather than via configuration files.
For physics applications using root, the default value of the look-ahead parameter may be
suboptimal because of the layout of the events on a root file (sec 5.1). Such parameter requires tuning, depending on the use case to be optimized.
Lustre implements fault tolerance using two modes: fail-over and fail-out. In failover, when a
server is down the operation is blocked; in fail-off, the operation fast-fails. Once decided on
the fault tolerance mode, change is not straight forward, as we ascertained when we tried and lost the data of our testbed.
In fail-over mode, turning off OST and MDT servers on purpose, we observed the expected
behavior of graceful degradation of service.
For Hadoop, as expected we observed that block-level replicas make the system tolerant to faults of individual data nodes. Also, we observe the inability to serve data when the number of failing nodes
is greater than the number of replicas.
As for ease of operations, the Hadoop server is a process in user space, which we implemented on
top of ext3; the client is based on a fuse kernel module that is now standard in most Linux distributions. The fault tolerance properties of Hadoop and this deployment model make system
operations easy to manage (system upgrades, reboots, etc.) We note, however, two caveats: (1) the
current implementation of the fuse client is not fully-POSIX compliant, although the maintainer of the module is fast to respond and improve the implementation, if possible; (2) system configuration is
managed through files, a mechanism that is arguably less easy to manage as compared to a
configuration management server, as for Lustre; in our case, this resulted in some confusion when setting the number of replicas, a client configuration parameter also set via configuration files.
For OrangeFS, we observe that the fault tolerance model is similar to Lustre, with no replica
management and only a fail-off fault tolerance model. Data is assumed to be redundant on disk
through RAID techniques (rather than through replicas in the system) and there is no tolerance of data node failures. In addition, to improve performance, data is striped across multiple servers (as
optionally in Lustre), so that even if a single server were down, likely operations over multiple files
would be compromised. The OrangeFS server is a process in user space over an ext3 file system. Clients access the server
through a kernel module. Arguably, this makes the maintenance for the server easier than for the
clients. We note, however, that as for Hadoop, configuration is managed through files. In addition, we
found limited documentation on the software and, by looking at discussion threads over the internet, we had the impression of a small user community. As a consequence, some of the error messages
found in the log files, which by themselves were hard to interpret, could not be explained.
For BlueArc, we ran our tests using the dedicated BlueArc hardware infrastructure at Fermilab, based on RAID 6 arrays. Clients mount the system via NFS. Since we did not have direct access to the
system, we did not simulate server faults. Because the BlueArc at Fermilab is designed to support a
scale of hundreds of clients, as expected we observed better scalability than for the solutions we deployed on our testbed.

8. Conclusions
We tested the performance of 4 storage systems, Lustre, Hadoop, BlueArc, and OrangeFS, on a
testbed deployed on FermiCloud. We used virtualization to compare the performance of clients
running on the same machines as the server (“on-board” clients) vs. clients running on different hosts (“external” clients). We assessed the response of the systems using three different benchmarks: to
measure the bandwidth response for general file access, we used IOZone [IOZone]; to measure the
scalability of the metadata servers, we used MDTest [13]; to measure the bandwidth distribution for the access patterns typical of high-energy physics, we used a skimming application from the NOνA
experiment based on root [12]. Table 1 summarizes the measurements discussed in the sections above.
Table 1: A comparison of the read and write bandwidth among the 4 storage systems considered for
tests of general access (“IOZone”) and of “root-based” access.
In conclusion, Lustre deployed on “bare metal” has the best performance, as an external storage
solution for the use case of the root skimming application (requires fast read with little write). We
observed consistent performance also for general operations (tested via IOZone). When deploying Lustre, one should consider the potential operational drawbacks of a special kernel for the server and a
kernel module for the clients. Because the Lustre kernel did not support the instantiation and
management of virtual machines, we could test the response of on-board clients by running the Lustre server on a virtual machine. On our host running SL5, this arrangement resulted in slow write
performance.
Hadoop, OrangeFS, and BlueArc have equivalent performance for the root skimming use case. We
observed that Hadoop has good operational properties (maintenance and fault tolerance) and a fast name server, but the performance is not better than the other solutions. As a result of this comparison,
we conclude that BlueArc is a good alternative for general operations at Fermilab, since it is a well
known production-quality solution. This study also supports the growing deployment of Lustre at Fermilab, while maintaining our BlueArc infrastructure.
9. Acknowledgments
We thank Ted Hesselroth and Doug Strain for their help with IOZone performance measurements; Andrei Maslennikov from the HEPiX storage group; Andrew Norman and Denis Perevalov for their
help with the NOνA framework for the storage benchmarks and their HEPiX work; Robert Hatcher,
Art Kreymer for their help with the Minos framework for the storage benchmarks and their HEPiX
work; Keith Chadwick, Steve Timm, Neha Sharma, amd Hyunwoo Kim for their input and for their help with the FermiCloud and FermiGrid ITB test bed; Alex Kulyavtsev and Amitoj Singh for their
consulting time. This work is supported by the U.S. Department of Energy under contract No. DE-
AC02-07CH11359
Storage Benchmark Read (MB/s) Write (MB/s) Notes
Lustre IOZone 350 250 (70 on VM)
Root-based 12.6 –
Hadoop IOZone 50 - 240 80 - 300 Varies on number of replicas
Root-based 7.9 –
BlueArc IOZone 300 330 Varies on system conditions
Root-based 8.4 –
OrangeFS IOZone 150-330 220-350 Varies on number of name nodes
Root-based 8.1 –

10. References
[1] G. Garzoglio et al. “Investigation of Storage Options for Scientific Computing on Grid and Cloud
Facilities”, Fermilab white paper http://cd-docdb.fnal.gov/cgi-bin/ShowDocument?docid=4665 .
Also published in shortened form at PoS (ISGC 2011 & OGF 31) 047. [2] Lustre web site. Accessed on Apr 2011. http://www.lustre.org
[3] B. Bockelman, “Using Hadoop as a grid storage element”, 2009 J. Phys.: Conf. Ser. 180 012047
doi: 10.1088/1742-6596/180/1/012047 [4] Blue Arc web site. Accessed on Apr 2011. http://www.bluearc.com/
[5] Orange File System project web site. Accessed on Apr 2011. http://www.orangefs.org
[6] Fuse the Filesystem in User Space. Accessed on Mar 5, 2012. http://fuse.sourceforge.net/
[7] IOzone File System benchmarks web site. Accessed on Apr 2011. http://www.iozone.org/ [8] The NOνA Experiment at Fermilab. Accessed on Apr 2011. http://www-nova.fnal.gov/
[9] The MINOS Experiment at Fermilab. Accessed on Apr 2011. http://www-numi.fnal.gov/
[10] The HEPiX Storage Wokring Group. Accessed on Apr 2011. http://w3.hepix.org/storage/ [11] HEPiX Storage Working Group – Oct 2011, Vancouver - Andrei Maslennikov
[12] R. Brun and F. Rademakers, “ROOT - An Object Oriented Data Analysis Framework”
Proceedings AIHENP'96 Workshop, Lausanne, Sep. 1996, Nucl. Inst. & Meth. in Phys. Res. A 389 (1997) 81-86. See also http://root.cern.ch/.
[13] mdtest HPC Benchmark web site. Accessed on May 17: http://mdtest.sourceforge.net/