Embed Size (px)
Citation preview

American Journal of Chemical Engineering 2015; 3(2-1): 55-69 Published online June 29, 2015 (http://www.sciencepublishinggroup.com/j/ajche) doi: 10.11648/j.ajche.s.2015030201.17 ISSN: 2330-8605 (Print); ISSN: 2330-8613 (Online)
Comparative Economic Investigation Options for Liquefied Petroleum Gas Production from Natural Gas Liquids
A. B. Raheem1, 2
, A. Hassan1, S. A. Samsudin
1, Z. Z. Noor
1, A. Adebobajo
2
1Faculty of Chemical Engineering, Universiti Teknologi Malaysia, Johor Bahru, Malaysia 2Department of Chemical Engineering, University of Port Harcourt, Port Harcourt, Nigeria
Email address: [email protected] (A. B. Raheem)
To cite this article: A. B. Raheem, A. Hassan, S. A. Samsudin, Z. Z. Noor, A. Adebobajo. Comparative Economic Investigation Options for Liquefied Petroleum
Gas Production from Natural Gas Liquids. American Journal of Chemical Engineering. Special Issue: Developments in Petroleum Refining
and Petrochemical Sector of the Oil and Gas Industry. Vol. 3, No. 2-1, 2015, pp. 55-69. doi: 10.11648/j.ajche.s.2015030201.17
Abstract: There is new trend in the value of oil and gas in the world, with the value of Liquefied Petroleum Gas (LPG)
soaring higher. It is due to its uses as a potential fuel in the several parts of the world, its demand in the petrochemical
industries for plastics and automotive composites productions, and other uses. These results in steadily increases in price.
There is also increase in volume of feed gas, which demands efficient LPG processing and recovery technology. This paper
mainly focuses on comparative economic investigation options for Liquefied Petroleum Gas plant, which processes feed from
natural gas wells and dehydrating units to produce Liquefied Petroleum Gas along with natural gasoline having a higher value as
separate product. Recovery of LPG is possible but raises both the initial cost of plant and operational cost considerably. The value
of LPG recovered should be high enough to widen the operating margins between the processing costs and the market price for
which the recovered liquids can be sold. Therefore, the most economic means of extracting this product must be used. This was
done using two alternatives; the Conventional Fractionation process and Single column overhead recycle process (SCORE).
Both alternatives were simulated with Hysys and are analyzed based on product recovery level, energy required and fixed capital
cost. There are two feeds to the plant, one from the natural gas wells and the other from dehydrating units of natural gas
processing plants with a total flow rate of 6.99 MMSCFD. Analysis of result from modeling shows that Single column overhead
recycle process has a total product recovery of 97.2 % while Conventional fractionation process has a total recovery of 88.5 %,
the require energy margin between the alternatives is about 38.9 % in favor of conventional process and the fixed capital cost is in
the favor of Single column process. Sensitive to choosing the most economic option of LPG recovery between the conventional
process and SCORE process is the recovery level of LPG from each of the options, total energy required and the cost of the
equipment. From the analysis, it shows that, it is more economical to use the Single column overhead recycle process, as
compared to conventional fractionation process.
Keywords: Liquefied Petroleum Gas Plant, Dehydrating Units, Conventional Fractionation Process,
Single Column Overhead Recycle Process, Hysys
1. Introduction
Liquefied petroleum gas, also called LPG, GPL, LP Gas,
liquid petroleum gas or simply propane, is a flammable
mixture of hydrocarbon gases used as a fuel in heating
appliances and vehicles. It is increasingly used as an aerosol
propellant and a refrigerant, replacing chlorofluorocarbons in
an effort to reduce damage to the ozone layer. When
specifically used as a vehicle fuel it is often referred to as auto
gas [1, 2].
The purification of natural gas gotten from heavier
hydrocarbon, in natural gas processing plants, require several
stages of separation and fractionation. The separated liquid
product obtains is named as natural gas liquids (NGL). The
unrefined NGL is sent to LPG recovery plant to separate LPG
that contains iso-propane (i-C3) and iso-butane (i-C4) from
stabilized NGL (C5+) [3, 4]. The values and prices of both
products are very high in the market due to their domestic and
other usefulness’s. Varieties of LPG bought and sold include
mixes that are primarily propane (C3H8), primarily butane
(C4H10) and, most commonly, mixes including both propane
and butane, depending on the season — in winter more
propane, in summer more butane [1].

56 A. B. Raheem et al.: Comparative Economic Investigation Options for Liquefied Petroleum Gas Production from Natural Gas Liquids
High demand of LPG as fuel in many parts of the World due
to aforementioned uses, its availability (more gas wells) and
price increase against the oil price makes it require more focus
for more and effective production methods.
In this work, LPG recovery plant is simulated using
commercial software (Hysys) to investigate the process
economy. The use of conventional fractionation process as an
alternative to single column overhead recycle process
(SCORE) is discussed in order to find the most economic
process for LPG production.
2. Properties of Liquefied Petroleum Gas
It is an established fact that Liquefied Petroleum Gas (LPG)
is a mixture of hydrocarbon gases, which consists mainly of
propane and butane. Its composition depends majorly on its
source, processing principles and the season it is produced [5].
LPG processed in the winter always have record of containing
more propane, whereas it contains more butane in the summer.
At room temperature of say, 25o to 27 oC, propane vapor
pressure is 9.36 bar while butane vapor pressure is 2.44 bar.
LPG is normally odorless, colorless, non-toxic and ready to
explode at a slight raised temperature. The peculiar distinctive
pungent odour that it has is due to addition of odorizing agent
such as ethanethiol, in other to reduce the danger of explosion
that may arise due to undetected leaks from cargoes, pipes or
tanks. LPG calorific value is 94 MJ/m³ (equivalents to 26.1
kWh), which is higher than that of natural gas of 38 MJ/m³
(equivalents to 10.6 kWh) [5]. The properties of LPG are
tabulated in Table 1.
Table 1. Properties of LPG [6].
Name of the Property Value for LPG
Freezing Point -187 OC
Specific Gravity 0.588
Vapour Pressure at 38 OC 1212 KPa
Heat Content 50221 KJ / KG
It is of interest to shows that recovery of LPG is possible but
raises both the initial cost of plant and operational cost
considerably. In order to achieve this, it is pertinent that the
value of LPG recovered should be high enough to widen the
operating margins between the processing costs and the
market price for which the recovered liquids can be sold.
Therefore, the most economic means of extracting this
product must be used.
The utmost aim of this work is to investigating the
economic process of LPG production from NGL using two
different alternatives. In order to help the already established
and new industrial company have a realistic view of LPG
recovery process and enhance their decisions as to making
investment in this sector.
This research identifying an economic or optima process of
LPG recovery to encourage both already established and new
industrial company from all over the world to invest in this
sector, thus consumption of it will increase throughout the
world as a result of its wide availability and most importantly,
our environment will be protected because of its clean-burning
property.
Two alternative methods of extracting LPG from NGL were
studied in this work and they are; Single Column Overhead
Recycle process (SCORE) and Conventional Fractionation
Process. Both methods were modelled using the commercial
process software (Hysys) and the results from modelling were
compared. This method enabled the more economic option
stands out on its merit owing to the result of the modeling.
The two major processes key operating measures, and
benefits of the processes to investigate their recovery and
economy efficiency performance of the LPG from NGL will
be discussed further in the remaining part of this paper.
2.1. LPG Recovery Technology
Several technologies have been developed in order to
extract LPG from natural gas liquids (NGL). Also, researches
coupled with simulations have been done to find the most
optimum and economic process. The recovery process can be
categorized mainly into two groups namely; conventional and
advance processes. Example of conventional fractionation
process is shown in Figures 1, while examples of advance
LPG recovery processes are shown in Figures 2, 3, 4, and 5.
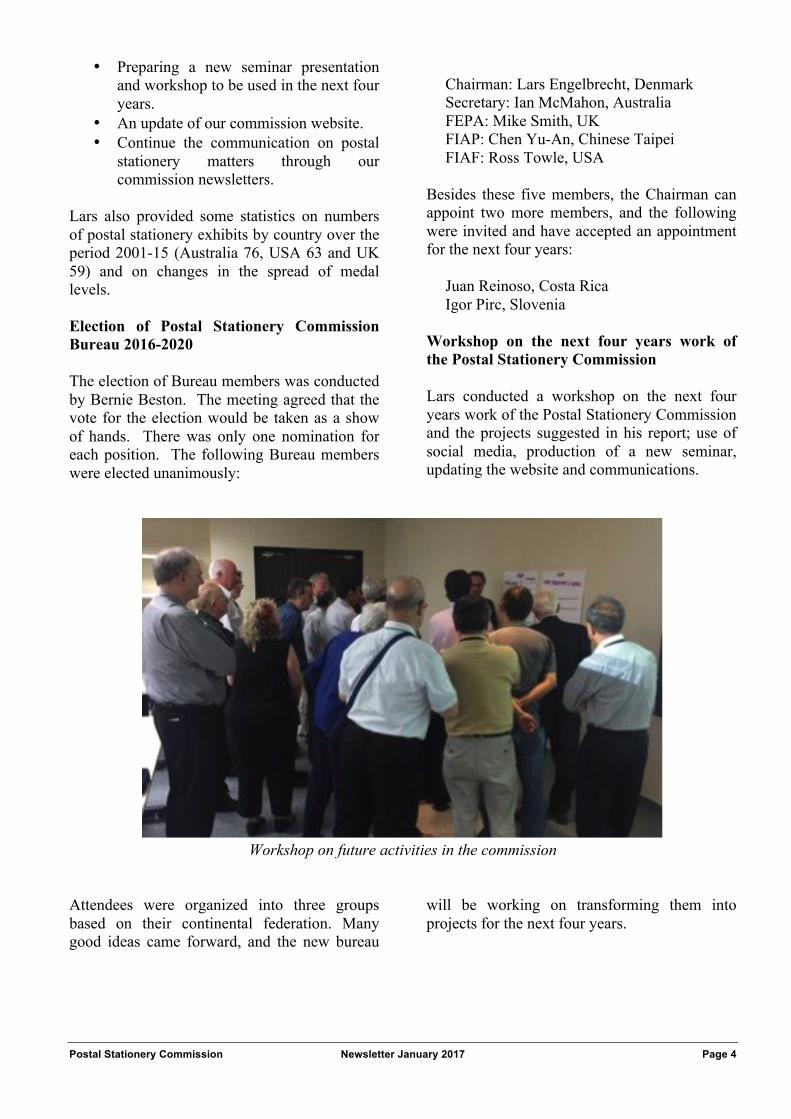
2.2. Conventional Fractionation Process
There are four (4) columns used in this conventional
process. First stage of LPG extraction from NGL is
De-ethanizer. In this column, methane and ethane will be
separated at the top of the column as vapour phase. The
heavier hydrocarbons (C3+) flows at the bottom in liquid phase
for next entering the Debutanizer column. In this column,
propane and butane are separated and go to the top of the
column, while the stabilized natural gas liquid (C5+) flows at
the bottom. In order to obtain pure specified propane product,
propane and butane are separated in De-propanizer Column.
Propane goes to the top and butane goes to the bottom. Then
finally, n-butane and isobutene are separated in butane splitter
to get the specified products [2]. A simplified conventional
fractionation process is shown in Figure 1.
2.3. Advance LPG Recovery Technology
Since 1970’s and till now, Ortloff Engineering have
developed several processes for LPG recovery that are very
efficient and more CO2 tolerant. Some of these processes
includes Gas sub-cooled process (GSP), Overhead recycle
process (ORH), Recycle split-vapour process (RSV), Single
column overhead recycle process (SCORE), LNG
fractionation process (LFP) and some others [7, 8, and 9].
2.3.1. Gas Sub-cooled Process (GSP)
In this process, a portion of the feed gas that is after
vaporization is condensed and sub-cooled flashed down to the
tower operating pressure, and supplied to the tower as its top
feed. The remainder of the feed gas is also expanded to lower
pressure by using turbo expander for vapour streams and
thereafter fed to the tower at one or more intermediate feed
points. The cold liquids supplied to the top of the tower act as

American Journal of Chemical Engineering 2015; 3(2-1): 55-69 57
reflux, contacting and rectifying the vapour leaving the
expander by absorbing the ethane-plus components for
recovery in the bottom product [7, 10, and 11]. This gas
sub-cooled process is showing in Figure 2.
2.3.2. Overhead Recycle Process (OHR)
This process has often been used instead of GSP for LPG
recovery although it typically employ a two-column
configuration, this process in essence withdraws a vapour
stream from an intermediate point in the composite distillation
tower that is then condensed and used as reflux for the upper
portion of the composite tower. This produces cold liquids to
contact and rectify the vapour leaving the expander, absorbing
the propane-plus components for recovery in the bottom
product from the second column. This process provides more
efficient recovery of propane and heavier hydrocarbons than
the GSP design [7, 10, and 11]. This is shown in Figure 3.
Figure 1. Simplified Conventional Fractionation process [4]
2.3.3. Recycle Split-Vapour Process (RSV)
The RSV process uses the split-vapour feed to provide the
bulk ethane recovery in the tower. The methane reflux stream
for the tower is produced by withdrawing a small portion of
the recompressed residue gas, condensing and sub-cooling it,
then flashing it down to tower pressure and supplying it as the
top feed. The higher pressure of this methane stream allows
the tower overhead gas to be used to provide the condensing
and sub-cooling; so that the split-vapour feed can be supplied
directly to the tower. RSV process is suited to both ethane
recovery and ethane rejection operation, and can switch easily
between the two operating modes as market prices change.
RSV also has better CO2 tolerance. [7, 12]. Figure 4 is
showing a typical recycle slit-vapour process.
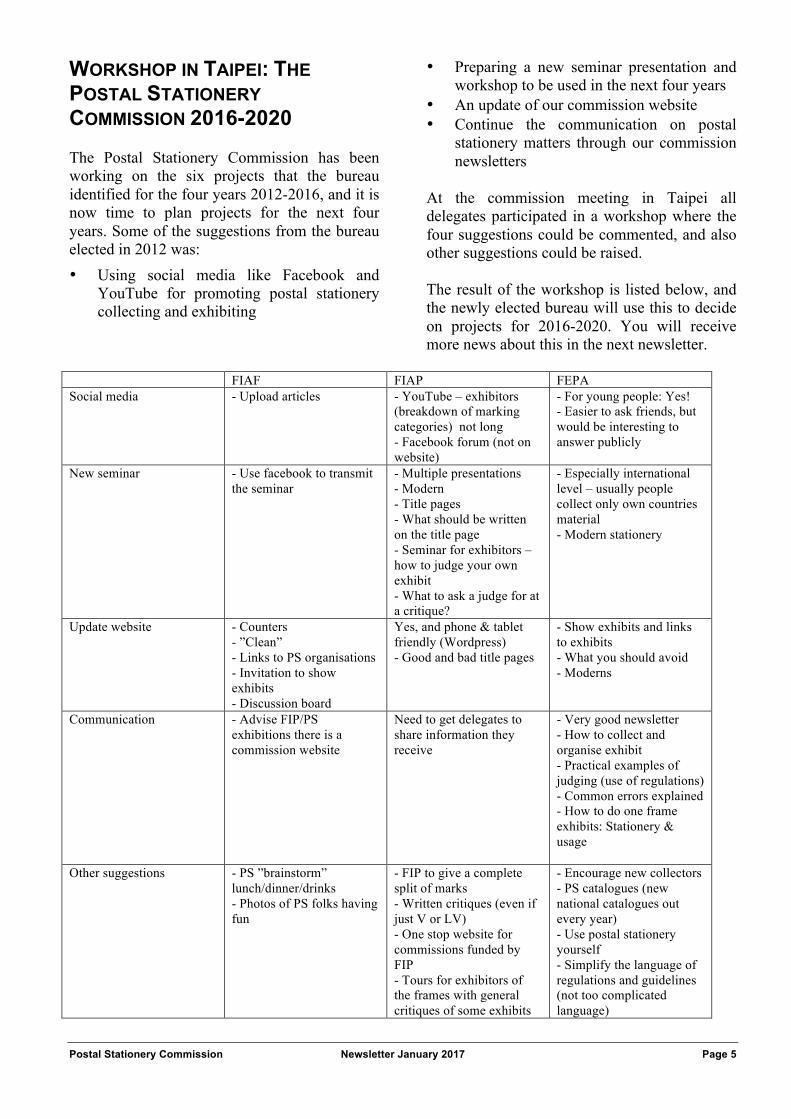
2.3.4. Single Column Overhead Recycle Process (SCORE)
Ortloff’s Single Column Overhead Recycle (SCORE)
process is a cryogenic gas processing technology suited to the
recovery of propane and heavier hydrocarbons from a natural
gas stream. The SCORE design is an enhancement of Ortloff’s
popular Overhead Recycle Process, combining extremely
cooling to the inlet gas and is then fed to the tower in the
bottom (stripper) section [15]. It has high propane recovery
with high efficiency [13]. Initial gas stream enters the gas/gas
exchanger where the gas is cooled by heat exchange with the
residue gas, the cold separator liquids, and the side re-boiler
stream, then enters the cold separator. The vapours from the
cold separator are work-expanded to provide cooling for the
process [14]. The 2-phase expander outlet stream is fed to the
tower at the bottom of the top (absorber) section. The liquid
from the cold separator is used to provide cooling to the inlet
gas and is then fed to the tower in the bottom (stripper) section
[15].There is a side vapour draw below the expander feed tray.
This vapour draw is the vapour coming up from the bottom
section of the tower, and contains methane and ethane that can
be used as reflux to absorb the heavy hydrocarbons from the
expander vapour. The vapour draw is partially condensed as it
is cooled by the tower overhead stream, then fed to a reflux
accumulator to separate liquid for reflux to the absorber and
stripper sections of the tower. There is also a side liquid draw
below the expander feed point that is used to provide inlet gas
cooling. The side liquid draw is similar to a side re-boiler,
except that the liquids are returned to the tower several stages
below the draw stage. Finally the desired product is drawn at
the bottom of the stripper [7, 10, and 11]. This is shown in
Figure 5.
SCORE Preference to Others: Its preference over others is
simply because its propane recovery ability is very high and
it is between 97 to 99 % or higher with maximum efficiency,
while rejecting ethane which are of great importance. It can
operate in a partial ethane recovery mode by adjusting the
quantity of heat input to the column, to have ethane recovery
58 A. B. Raheem et al.: Comparative Economic Investigation Options for Liquefied Petroleum Gas Production from Natural Gas Liquids
limited to 40 % if ethane recovery is desired. It requires no
additional equipment for moderate ethane recovery. It has
high economic value for its ability to operate in either ethane
recovery or rejection modes for extended periods.
Figure 2. A typical Gas Sub-cooled Process [5]
Figure 3. A typical overhead recycle process [5]
It has better CO2 tolerance. It can be switched over to Gas
Sub-cooled Process (GSP) mode. It can also accommodate
wider range of natural gas composition and inlet conditions,
with pressure above 600 PSI preferred for natural gas streams,
but can still accommodate lower pressures. It normally
produces a mixed LPG product stream with product
specification of maximum ethane in propane liquid. Whereas
in Gas Sub-cooled Process (GSP) mode, a mixed NGL
product stream is produced with product specification of a
maximum methane in ethane liquid.
2.3.5. LNG Fractionation Process
With the dramatic increase in LNG production and shipping
worldwide, increased attention is being focused on the
processing of these products on the receiving end. In
industrialized locations it is desirable to extract the lighter
hydrocarbons, to recover a valuable saleable product and also
control the heating value of the pipeline gas [16, 17]. A better
method for controlling the delivery heating value is to recover
LPG by integrating the recovery step into the vaporization
step, eliminating the need for recompression and taking
advantage of the refrigeration available in the LNG [18]. This
provides the lowest capital and operating cost alternative for
controlling heating value, while also providing a significant
additional revenue stream [19]. This is shown in Figure 6.
The different processes designs are shown in the Figures 1
to 6 in order to know the required unit for each design. It is
based on the units involves that the simulation was done.
2.4. Basis of Work
The bases of this work are; feed stream condition,
compositions and product specification [2].
2.5. Feed Streams
Feed stream used for the simulation are given in the Table 2.
The compositions are in mole fraction.
Table 2. Feed Composition [4].
Property Feed 1 [from well] Feed 2 [from dehydration unit]
Temperature 25 °C 25 OC
Pressure 30 bar 30 bar
Mass flow rate 25 ton / hr. 8 ton / hr.
Composition
CH4 0.097 0.130
C2H6 0.029 0.080
C3H8 0.035 0.100
i-C4 0.018 0.055
n-C4 0.028 0.113
i-C5 0.026 0.104
n-C5 0.025 0.091
n-C6 0.064 0.122
n-C7 0.090 0.110
n-C8 0.150 0.072
n-C9 0.110 0.020
n-C10 0.090 0.003
C11 0.079 0.000
C12 0.071 0.000
C13 0.031 0.000
C14 0.023 0.000
C15 0.018 0.000
C16 0.014 0.000
H2O 0.002 0.000
American Journal of Chemical Engineering 2015; 3(2-1): 55-69 59
Inlet Gas
Expander
Residue GasCompressor
Residue Gas
Demethanizer
NGL or LPG Product.
SubCooler
Figure 4. A typical Recycle Split-Vapour process [7]
2.6. Product Specifications
Product specifications are defined based on commercial
products in LPG market [20]. Specifications of LPG products
are taken from OPIC and Argus Americans Methodology [21].
LPG specifications to work with in this project are given in the
Table 3. The product specification above will be used as initial
basis to model the simulation. However, final decision about
the product will be made after analysis of the economics of the
research.
Inlet Gas HP Separator
Expander/Compr.
Residue GasCompressor
Residue Gas
Deethanizer
NGL or LPG Product.
Reboiler
Reflux Condenser
Gas/Gas Exchgr.
RefluxPump
Figure 5. A Typical Single Column Overhead Recycle process [7].
Table 3. Product Specifications [21].
No. Product % Minimum Other Components % Maximum Relative Density Price (# / Gal)
1 n - Butane 94
i-butane 6
0.584 1.54661 Propane 0.35
Pentane 1.5
Olefin 0.35
2 i-Butane 96 n-butane 4
0.563 1.60083 Propane 3
3 Propane 90 Propylene 5 0.507 1.17594
4 C5+ 0.664 1.90315
5 Field Grade Butane i-butane 35 1.4383
n-butane 65
3. Methodology
In this project, the comparative economic investigation
options for LPG recovery is done by modeling Conventional
Fractionation process and Single Column Overhead Recycle
process using commercial simulation software (Hysys). The
method used in this work is based on the procedure derived
from the principle of three concepts: (1) product recovery;
based on the simulation, the product recovery of the two
options considered were evaluated. (2) Equipment duty; based
on the simulation, the energy required of the two options
considered were investigated and accounted for. (3) Fixed
capital cost; equipment cost were done using the
specifications of the equipment’s, quote from suppliers shows
that almost the same price list is used for all the equipment.
Working capital of 3 % of fixed capital can be added to have
the total capital, based on the design standard. Although,
operating cost, direct cost, utility cost and operating labor cost
were not considered, because they depend on the capacity of
the plant which this work is silence on, as we assumed it to be
relatively the same for the two options. Fixed capital cost is
enough to show the needed difference. Investment analysis of
profitability, internal rate of return (IRR), net present value
(NPV) and pay-back period were not done. This method will
enable the most economic option stand out on its merit owing
to the result of the modeling.
3.1. Conventional Fractionation Process
Process Flow -There are four (4) columns used in this
conventional process. First stage of LPG extraction from NGL
is de-ethanizer. In this column, methane and ethane will be
separated at the top of the column as vapor phase. The heavier
hydrocarbons (C3+) will flow at the bottom in liquid phase for
next entering the debutanizer column. In this column, propane
and butane are separated and go to the top of the column,
while the stabilized natural gas liquid (C5+) flows at the
bottom. In order to obtain pure specified propane product,
60 A. B. Raheem et al.: Comparative Economic Investigation Options for Liquefied Petroleum Gas Production from Natural Gas Liquids
propane and butane are separated in de-propanizer column.
Propane goes to the top and butane goes to the bottom. Then
finally, n-butane and isobutene are separated in butane splitter
to get the specified products.
Parameters - Simulating the LPG extraction process flow
above is not as simple as the description, especially to
converge the distillation column with Hysys. The parameters
below should be considered in order to find a good result of
simulation and the process as well as minimize the errors of
the calculation.
• Operating pressure of the column
• Temperature of top product – avoid using refrigerant
• Number of stages
• Column specification
• Temperature profile at each tray
• Product specification
• Reboiler duty
Modeling- Generally, the process modeling for
Conventional LPG extraction with Hysys is divided into five
(5) main sections. The sections are; feed conditioning,
de-ethanizer, de-butanizer, de-propanizer and butane splitter.
The additional condenser and reboiler are also explained
separately. Each section will be described step by step.
Figure 6. LNG Fractionation Process Flow Diagram [22]
3.2. Feed Conditioning
As mentioned in the project basis, there are two (2) feed
streams of NGL. Both streams have the same condition of
pressure and temperature that is 30 bar and 25 oC, but different
compositions and mass flow rates.
First step of the LPG extraction process is feed conditioning
before entering the de-ethanizer column. The most simple and
economic means of conditioning this kind of stream is to mix
both feed stream, expand the mixed feed and enter the
de-ethanizer column without using any separator. The
operating conditions of the mixed stream are shown in Table
4.
Table 4. Mixed feed
Operating Conditions Value
Pressure (bar) 30
Temperature (OC) 24.87
Molar flow (MMSCFD) 6.989
3.2.1. De-Ethanizer
The next thing to do after defined stream connection in
de-ethanizer properties specification is to select the operating
pressures at the top and the bottom of the column. As initial
guess, 26.9 bar pressure was used based on reference. Since
the feed pressure is 30 bars, expansion valve is added in order
to meet the operating pressure of the column. There will be no
condenser that is used at the overhead column stream in order
to minimize cost so only one column specification needs to be
defined to converge the column. The operating pressure has to
be selected so that most methane and ethane flow to overhead
column and keep propane and heavier hydrocarbons as the
bottom product. The lower the pressure the more the vapour
phase.
Practically, some trials have to be done to find the best
result in selecting the column specification and number of
stages bearing in mind their respective costs. The more the
number of stages means the better the separation process. In
the other hand, more number of stages means higher column is
required and the cost will be more expensive. The simulation
is continued to modeling the debutanizer column. This is
shown in Table 5.
Table 5. De-ethanizer
Operating Conditions Value
Pressure of the Top Stage and Bottom Stage
(bar) 18, 26
Temperature of the Top Stage and Bottom Stage
(oC) 36.05, 248
Number of Stages 18
Column Specification Bottom Product Rate
Reboiler Duty (KW) 5449
3.2.2. De-Butanizer
Both condenser and reboiler properties specifications are
used in simulating de-butanizer. Basically, the steps in
simulating the debutanizer column are almost the same like
de-ethanizer. The differences are in selecting the column
specifications. Since both condenser and reboiler
specifications are used, there are 2 column specifications to be
defined in order to converge the column.
In this case, components recovery of the top product is
selected as column specification. It is expected to separate
propane and butane at the top and heavier hydrocarbons at the
bottom. Even though most propane and butane can be
recovered as the top product, there is one specification that
should be considered, that is, reboiler duty. It is possible to
have 99.99% of propane and butane at the top, but more
reboiler duty will be required. Thus, the fraction of
components recovery should be selected by considering
minimum reboiler duty in order to minimize the cost for the
steam. It is shown in Table 6.
American Journal of Chemical Engineering 2015; 3(2-1): 55-69 61
Table 6. Debutanizer
Operating Conditions Value
Pressure of the Top Stage and
Bottom Stage (bar) 16, 17
Temperature of the Top Stage
and Bottom Stage (oC) 81.04, 236
Number of Stages 19
Column Specification Component Recovery and Boil up Ratio
Reboiler Duty (KW) 2735
3.2.3. De-Propanizer
Both condenser and reboiler are used in simulating the
de-propanizer. In this column, propane liquid is produced as
overhead product and butane as bottom product. It is simpler
simulating this column since it only has two compositions in
the feed. Components recovery is also used as column
specification. There is no significant reboiler duty difference
in changing the recovery fraction value. Selecting operating
pressure and number of stages are also done using initial guess
value from reference. Some trials still have to be done to find
the optimum value. This is shown in Table 7. Hysys
conventional depropanizer result is shown in Table 24 in the
appendix.
Table 7. De-propanizer
Operating Conditions Value
Pressure of the Top Stage and
Bottom Stage (bar) 9, 10
Temperature of the Top Stage
and Bottom Stage (˚C) 23.49, 81.02
Number of Stages 19
Column Specification Component Recovery and Boil up Ratio
Reboiler Duty (KW) 129.2
3.2.4. Butane Splitter
Butane from de-propanizer column is next separated into
i-butane and n-butane in butane splitter column. It is typically
the same as the de-propanizer column as shown in Figure 3.9.
Components recovery is still used as column specification.
But it is more difficult than two previous columns to meet the
products specification for n-butane and i-butane, since it is
very sensitive with changing value of component recovery. So
that some trials have to be done to select the optimum
components recovery value for both n-butane and i-butane in
order to meet the specification of the product. Selecting
operating pressure and number of stages are still done using
initial guess value from reference. It is shown in Table 8.
Hysys result for conventional butane splitter is shown in Table
25 in the appendix.
Table 8. Butane Splitter
Operating Conditions Value
Pressure of the Top Stage and
Bottom Stage (bar) 4, 5
Temperature of the Top Stage
and Bottom Stage (˚C) 0.63, 63.14
Number of Stages 19
Column Specification Component Recovery and Boil up Ratio
Reboiler Duty (KW) 117.3
3.3. Reboiler and Condenser
Reboiler and condenser are parts of the columns. Reboiler is
used to supply heat into the column, so that the lighter
hydrocarbons will be vaporized and go up to the top stage.
Steam is used to heat up a part of bottom product and recycle it
into the column. Meanwhile, condenser is used to condense
the overhead vapor so the liquid product will be produced
which partially recycled into the column as reflux.
3.4. Single Column Overhead Recycle Process
3.4.1. Process Flow
Feed gas stream from mixer enters the LNG exchanger where
the gas is cooled by heat exchange with the residue gas, the cold
separator liquids, and the side reboiler stream, then enters the
cold separator. The vapour from the cold separator is
work-expanded and the 2-phase expander outlet stream is fed to
the tower at the bottom of the top (absorber) section. The liquid
from the cold separator is used to provide cooling to the inlet gas
and is then fed to the tower in the bottom (stripper) section.
There is a side vapour draw below the expander feed tray. This
vapour draw is the vapour coming up from the bottom section of
the tower. The vapour draw is partially condensed as it is cooled
by the tower overhead stream, then fed to a reflux accumulator to
separate liquid for reflux to the absorber and stripper sections of
the tower. There is also a side liquid draw below the expander
feed point that is used to provide inlet gas cooling, the liquids are
returned to the tower several stages below the draw stage. Finally
the desired product is drawn at the bottom of the stripper.
3.4.2. Parameters
The parameters necessary for simulating SCORE process is
practically the same with ones considered in simulating
conventional column, the like of operating pressure of the
column, operating temperature, number of stages, column
specification and reboiler duty.
3.5. Modeling
The modeling of SCORE process with Hysys can be
divided into seven (7) sections. These are feed conditioning,
LNG exchanger, cold separator and the expander, absorber
section, stripper section, reflux accumulator and its
compressor, distillate column.
3.6. Feed Conditioning
The same feed conditioning for the convention column is
also adopted here for the SCORE process, the inlet streams
from well and dehydration unit are mixed and then expanded
and thereafter it enters the LNG exchanger. Mixed feed
operating conditions and their respective values are shown in Table 9.
Table 9. Mixed feed
Operating Conditions Value
Pressure (bar) 30
Temperature (˚C) 24.87
Molar flow (MMSCFD) 6.989

62 A. B. Raheem et al.: Comparative Economic Investigation Options for Liquefied Petroleum Gas Production from Natural Gas Liquids
3.7. LNG Exchanger
Feed gas from mixer enters the LNG exchanger where the
gas is to be cooled by heat exchange with the residue gas, the
cold separator liquids, and the side reboiler stream, but these
streams that will cool the inlet gas are not existing yet as at
this stage of simulation, so a demo stream of cooling
property will be used to achieve the expected aim and can
then be deleted subsequently as the cooling streams emerged.
The feed gas is cooled first by the demo stream and leaves
the exchanger to cold separator at 8 oC and 30 bars.
3.8. Cold Separator/Expander
The gas is expanded first by a valve from 30 bars to 10
bars so as to enhance separation and as well reduce the work
of the expander. The vapour phase from the top of separator
enters the expander and the liquid stream from the bottom
flow back to the LNG exchanger this serve as the first
cooling stream from the process to support the demo stream.
The expander on the other hand expands the vapour stream
from the separator to provide cooling for the process by
reducing its pressure from 10 bars to 0.6 bars with working
duty of 27.78 KW. The 2-phase expander outlet stream is fed
to the tower at the bottom of the top (absorber) section.
3.9. Absorber Section
Recall that in the process description of SCORE process a
reflux liquid will supply both the absorber and the stripper
from the top and that this liquid is to be obtained from the
overhead of the stripper but since the process has not been
simulated to such extent, a demo stream of the reflux liquid
property is simulated rich in methane and ethane. It is
splitted into two equal parts by a Tee one to the top of the
absorber and the other to the stripper.
Next step is to select the operating pressure. 4 bars and 0.6
bars were selected for both top and bottom pressures
respectively, after several guess were made, before the case
was resolved at the aforementioned pressures. Since
condenser is not used, only one column specification needs
to be defined to converge the column. However, some trials
have to be done to find the best result. The simulation is
continued to modeling the stripper section. Absorber
operating conditions and their respective values are shown in
Table 10.
Table 10. Absorber
Operating Conditions Value
Pressure of the top stage and bottom stage (bar) 4, 0.6
Temperature of the top stage and bottom stage
(˚C) -80, -140
Number of stages 10
Column specification Component recovery
Stripper Section
The other stream from the Tee enters the stripper at the top
and the liquid draw from the bottom of the absorber enters the
LNG exchanger to provide further cooling and leave to the
stripper at the top. The liquid from cold separator also enter
the stripper at the middle of the column. Next is selecting the
operating pressure at the top and the bottom of the column.
After several guess, zero bar was used for the top and 10 bar as
bottom pressure.
Three column specifications are required to converge the
stripper column, they are; overhead product rate, bottom
product rate and boil up ratio. Trials have to be done to find the
best result. The same number of stages for the absorber is also
used for the stripper. Operating conditions and their values are
summarized in Table 11.
Table 11. Stripper
Operating Conditions Value
Pressure of the top stage and bottom
stage (bar) 0, 10
Temperature of the top stage and
bottom stage (˚C) 23.49, 81.02
Number of stages 10
Column specification Component recovery, boil up ratio
Reboiler duty (KW) 129.2
Reflux Accumulator
The simulation of this unit proves to be the most sensitive
part of the whole process. It was discussed earlier that a demo
stream was used as the reflux but at this stage the process is
completely mature enough to provide all the streams it needs
to run the plant itself. The streams from the top of both the
absorber and stripper pass through the condenser to exchange
heat, thereafter the stream from the stripper enters the
accumulator which function is to separate the vapour from the
liquid.
Vapour from the accumulator join the residue gas pipeline
while the liquid is sent back to the Tee to replace the demo
stream but the process did not simulate with ease, many
balancing of properties between the liquid reflux and the demo
stream was needed to run the process. See operating
conditions and their respective values for reflux stream in
Table 12.
Table 12. Reflux Stream
Operating Conditions Value
Vapour/phase fraction 0.000
Temperature (˚C) -135.0
Pressure (bar) 3.783
Molar flow (MMSCFD) 4.091
Distillate Column
Liquid from the bottom of the stripper enters this unit
primarily to separate lighter hydrocarbon gas from the heavy
hydrocarbons our desire product can thus be obtain with a
measure of purity. The operating conditions of this column are
summarized in the Table 13.
American Journal of Chemical Engineering 2015; 3(2-1): 55-69 63
Table 13. Distillate column
Operating Conditions Value
Pressure of the top stage and bottom
stage (bar) 4, 10
Temperature of the top stage and
bottom stage (˚C) 17.46, 209.6
Number of stages 10
Column specification Component fraction, bottom
product rate
Reboiler duty (KW) 4482
Equipment Cost Estimation
It include fixed capital cost, working capital cost, operating
cost, direct cost, utility cost and operating labor cost.
Fixed Capital Cost
It is made up of equipment purchase deliverance cost,
installation of the purchased equipment cost, instrumentation
and controls installed cost, and building and its services cost.
It also have electrical systems installation cost, services
facilities installed cost, engineering supervisions cost,
construction expenses, yard improvement cost, contractor fees,
legal expenses, and contingency.
Working Capital
This is needed capital to start up the plant and financing it
for a period of time (in months), for plant to stabilize for
money to flow in. The expenses that this capital covered is
made up of salaries, raw materials, and contingencies. It is
usually 3 % of the capital cost, and will be recovered at the end
of the project.
Total Investment – It is the sum of the fixed capital and
working capital.
Operating Cost – it is all expenses incurred during the
manufacturing, and made up of direct manufacturing cost,
fixed manufacturing cost and general expenses.
Direct Cost – It is the costing of raw materials (NGL and
steams)
Utility Cost – It is the costing of electricity for processing
natural gas and cooling water pumping.
Operating Labor – it is the costing of work force required to
operate the plant.
3.10. Investment Analysis
It is a measure of profitability of a project. The three
parameters to be considered in other to determine profitability
are internal rate of return (IRR), net present value (NPV), and
pay-back period. It can be noted that operating cost, direct cost,
utility cost and operating labor cost are not calculated in this
work, because they depend on the capacity of the plant and
may not be necessary in this work, as it is assumed to be the
same for the two options. Fixed capital cost is enough to show
the needed difference. Hence, investment analysis is not done.
4. Results and Discussion
Only the key unit operations result from the simulation vital
to achieve the objective of this project will be shown*. The
following unit operations results are vital;
Conventional Fractionation Process
• De-propanizer
• Butane Splitter
Single Column Overhead Recycle Process
• Liquid-Draw Splitter
Tables 14 and 15 are showing results 1 and 2 respectively
for conventional column depropanizer, while other results for
Hysys simulation are shown in the appendix. Also, Figures 7
and 8 in the appendix are showing the process flow sheet for
conventional fractionation process and single column
overhead recycle process respectively.
Table 14. Conventional Column Depropanizer Results 1.
Flow Basis: Molar
Feed Composition
Flow Rate (MMSCFD) 34.4926
Mkl,; m;,
Methane 0.0000
Ethane 0.0000
Propane 0.4060
i – butane 0.1616
n – butane 0.1865
i - Pentane 0.0732
n – Pentane 0.0568
n – Hexane 0.0490
n – Heptane 0.0306
n – Octane 0.0219
n – Nonane 0.0082
n - Decane 0.0037
n – C11 0.0019
n – C12 0.0011
n – C13 0.0003
n – C14 0.0001
n – C15 0.0001
n – C16 0.0000
H2O 0.0000
Flow Basis: Molar
Feed Flows
Flow Rate (MMSCFD) 34.4926
mkl,; m;,
Methane 0.0000
Ethane 0.0002
Propane 13.9681
i – butane 5.5735
n – butane 6.4343
i - Pentane 2.5247
n – Pentane 1.9579
n – Hexane 1.6898
n – Heptane 1.0565
n – Octane 0.7564
n – Nonane 0.2829
n - Decane 0.1279
n – C11 0.0662
n – C12 0.0372
n – C13 0.0096
n – C14 0.0040
n – C15 0.0021
n – C16 0.0011
H2O 0.0000

64 A. B. Raheem et al.: Comparative Economic Investigation Options for Liquefied Petroleum Gas Production from Natural Gas Liquids
Table 15. Conventional Column Depropanizer Results 2.
Products
Flow Basis: Molar
Product Compositions
C3 C4
Flow Rate (MMSCFD) 11.4949 23.0377
mkl,; m;, mkl,; m;,
Methane 0.0000 0.0000
Ethane 0.0000 0.0000
Propane 0.9753 0.1214
i – butane 0.0216 0.2312
n – butane 0.0031 0.2778
i - Pentane 0.0000 0.1096
n – Pentane 0.0000 0.0850
n – Hexane 0.0000 0.0734
n – Heptane 0.0000 0.0459
n – Octane 0.0000 0.0328
n – Nonane 0.0000 0.0123
n - Decane 0.0000 0.0056
n – C11 0.0000 0.0029
n – C12 0.0000 0.0016
n – C13 0.0000 0.0004
n – C14 0.0000 0.0002
n – C15 0.0000 0.0001
n – C16 0.0000 0.0000
H2O 0.0000 0.0000
Flow Basis: Molar
Product Flows
C3 C4
Flow Rate (MMSCFD) 11.4949 23.0377
mkl,; m;, mkl,; m;,
Methane 0.0000 0.0000
Ethane 0.0002 0.0000
Propane 11.1718 2.7963
i – butane 0.2477 5.3259
n – butane 0.0352 6.3991
i - Pentane 0.0000 2.5247
n – Pentane 0.0000 1.9579
n – Hexane 0.0000 1.6898
n – Heptane 0.0000 1.0565
n – Octane 0.0000 0.7564
n – Nonane 0.0000 0.2829
n - Decane 0.0000 0.1279
n – C11 0.0000 0.0662
n – C12 0.0000 0.0372
n – C13 0.0000 0.0096
n – C14 0.0000 0.0040
n – C15 0.0000 0.0021
n – C16 0.0000 0.0011
H2O 0.0000 0.0000
Flow Basis: Molar
Product Recoveries
C3 C4
Flow Rate (MMSCFD) 11.4949 23.0377
mkl,; m;, mkl,; m;,
Methane 100.0000 0.0000
Ethane 99.9990 0.0010
Propane 79.9806 20.0194
i – butane 4.4433 95.5567
n – butane 0.5476 99.4524
i - Pentane 0.0011 99.9989
n – Pentane 0.0002 99.9998
n – Hexane 0.0000 100.0000
Products
Flow Basis: Molar
Product Compositions
C3 C4
n – Heptane 0.0000 100.0000
n – Octane 0.0000 100.0000
n – Nonane 0.0000 100.0000
n - Decane 0.0000 100.0000
n – C11 0.0000 100.0000
n – C12 0.0000 100.0000
n – C13 0.0000 100.0000
n – C14 0.0000 100.0000
n – C15 0.0000 100.0000
n – C16 0.0000 100.0000
H2O 100.0000 0.0000
Sensitive to choosing the most economic option of LPG
recovery between the conventional process and SCORE
process is the recovery level of LPG from each of the options,
total energy required and the cost of the equipment.
This will be analyzed based on the results of both options.
4.1. Product Recovery
Based on the simulation, the product recovery of the two
options considered is tabulated below. Product recovery for
the two options is shown in Table 16, while their product flows
is shown in Table 17.
Table 16. Product Recovery
Composition (%) Conv. Process SCORE Process
Propane 79.8695 99.9981
i-butane 90.0005 98.9988
n-butane 95.6441 92.5056
Table 17. Product Flows
Composition [MMSCFD] Conv. Process SCORE Process
Propane 11.1650 20.0414
i-butane 4.7939 10.6055
n-butane 6.1188 18.6623
4.2. Equipment Duty
Based on the simulation, the energy required of the two
options considered is tabulated in Table 18 and 19 for
conventional and SCORE processes respectively.
Table 18. Conventional process
Description Duty [KW]
De-ethanizer Reboiler 5449
De-butanizer Reboiler 2735
De-butanizer Condenser 3391
De-propanizer Reboiler 129.2
De-propanizer Condenser 153.2
Butane Splitter Reboiler 117.3
Butane Splitter Condenser 145.6
Total Energy Required 12120.3

American Journal of Chemical Engineering 2015; 3(2-1): 55-69 65
Table 19. SCORE Process
Description Duty [KW]
Expander 27.78
Reflux Compressor 4870
Reflux Cooler 5512
Stripper Reboiler 3511
Distillation Reboiler 4482
Distillation Condenser 3319
Residue gas Compressor 3200
LNG-Exchanger 328.6
Total Energy Required 25250.4
NB: It should be noted that the reflux compressor and
cooler are optional utilities if other method of liquefying the
reflux stream is available. That been the case, total energy
require of SCORE process will be 19828.4 KW.
The equipment cost is estimated to get an approximate price
for the total plant installation. These calculations are based on
given percentages. Major equipment costs are calculated in
Appendix A. Tables 20 and 21 are showing equipment cost for
conventional and SCORE processes respectively. Table 22 is
showing the total investment for the two options, while Table
23 in the appendix is showing the fixed capital cost for the two
options.
Table 20. Conventional process*
Equipment Cost ($)
Column 425571
Tray 60651.54
Heat exchangers 29157889.63
Total Equipment Cost 29644112.17
* Equipment number: 4 columns, 109 column trays, 7 heat exchangers
Table 21. SCORE Process*
Equipment Cost ($)
Column 319178.25
Tray 16693.1
Heat exchangers 24992476.83
Separators 136000.9
Compressors 105377.44
Expander 105377.44
Total Equipment Cost 25675104.21
*Equipment number: 3 columns, 30 column trays, 6 heat exchangers, 2
separators; 1 compressor, 1 expander
Table 22. Total Investment
Investment Cost [MUSD($)]
Conventional Process SCORE Process
Fixed Capital 149.90 129.52
Working Capital 4.50 3.89
Total Investment 154.40 133.41
5. Conclusions
Today’s major player in the World’s market will be gas
processors with performance of NGL/LPG recovery plant
tailored to maximum product margins with higher efficient
operation, and maintains it as the market conditions change.
The comparative investigation done in this work is to
highlight a process with higher flexibility, efficiency,
reduced capital cost and higher product recovery.
From the analysis of the result, single column overhead
recycle process (SCORE) has a total product recovery of
97.2 % while conventional fractionation process has a total
recovery of 88.5 %. Energy requirement margin between the
SCORE process and conventional process is about 38.9 %,
but in the same vein the fixed capital cost of SCORE process
is cheaper compared to the conventional process. Sensitive
to choosing the more economic option of LPG recovery
between the conventional process and SCORE process is the
recovery level of LPG from each of the options, total energy
required and the cost of the equipment.
Based on the results of this study, the following
conclusions can be drawn that both LPG extraction processes
is profitable but it is more economical to use the Single
Column Overhead Recycle process.
In SCORE process, configurations are available to provide
maximum efficiency for a given product or to allow efficient
adjustment of product recovery levels, if the product
economy is viable and the market is boost for it. The process
efficiency provided by the SCORE technology allows for
processing LNG cargoes of varying composition with the
same process design and nearly constant operating
parameters. Also, it gives rooms for product variations with
the same process design. These allows for more products in
the market in terms of quantity and varieties to meet up the
markets demand.
We recommend that more research should be made into
modeling of single column overhead recycle process for
better recovery of LPG. Also, the use of single column
overhead recycle process for LPG extraction from NGL for
both already established and new industries is recommended.
Appendix
Equipment Cost
Using the specifications of the equipment, quote from
suppliers shows that almost the same price list is used for all
the equipment [23].
Conventional Fractionation Process
Column: Each of the column cost $106393 therefore 4
columns = 425571
Tray: Each of the tray cost $557, 109 trays = 60651.54
Heat exchangers: Each heat exchanger cost $4165413,
7 exchangers = 29157889.63
66 A. B. Raheem et al.: Comparative Economic Investigation Options for Liquefied Petroleum Gas Production from Natural Gas Liquids
Table 23. Fixed Capital Cost for the Two Options
Fixed Capital Cost Cost [MUSD ($)]
Conventional Process SCORE Process
Equipment Purchased Delivered 29.64 25.68
Installation of Equipment 13.93 12.07
Instrumentation and Controls Installed 10.72 9.25
Pipes Installations 20.25 17.48
Building and its services 5.36 4.63
Electrical Systems Installation 3.28 2.82
Services Facilities 20.85 18.00
Engineering and Supervisions 9.83 8.48
Construction Expenses 12.21 10.54
Yard Improvement 2.98 2.57
Contractor Fees 6.56 5.66
Legal Expenses 1.19 1.03
Contingency 13.10 11.31
Fixed Capital Investment 149.90 129.52
Single Column Overhead Recycle Process (SCORE)
Column: Each of the column cost $106393 therefore 3
columns = 319178.25
Tray: Each of the tray cost $557, 30 trays = 16693.1
Heat exchangers: Each heat exchanger cost $4165413,
6 exchangers = 24992476.83
Separator: Each separator cost $68000.5, 2 separators =
136000.9
Compressors/Expander: Each of this cost $105377.44, 1
Compressor = $105377.44 and 1 Expander = $105377.44
Figure 7. Conventional Process.
Figure 8. Single Column Overhead Recycle Process.
American Journal of Chemical Engineering 2015; 3(2-1): 55-69 67
Table 24. Hysys Conventional Column Depropanizer Result
Distillation: Depropanizer
SUMMARY
C3 C4
i-Pentane (%) 0.0011 99.9989
n-Pentane (%) 0.0002 99.9998
n-Hexane (%) 0.0000 100.0000
n-Heptane (%) 0.0000 100.0000
n-Octane (%) 0.0000 100.0000
n-Nonane (%) 0.0000 100.0000
n-Decane (%) 0.0000 100.0000
n-C11 (%) 0.0000 100.0000
n-C12 (%) 0.0000 100.0000
n-C13 (%) 0.0000 100.0000
n-C14 (%) 0.0000 100.0000
n-C15 (%) 0.0000 100.0000
n-C16 (%) 0.0000 100.0000
H2O (%) 100.0000 0.0000
COLUMN PROFILES
Reflux Ratio: 2.167 Reboil Ratio: 0.9999 The Flow Option is Selected Flow Basis: Molar
Column Profile Flows
Temperature (oC) Pressure (KPa) Net liquid
(Kgmole/h)
Net Vapor
(Kgmole/h)
Net Feed
(Kgmole/h)
Net Draws
(Kgmole/h)
Condenser 23.49 900.0 24.82 mkl,;m;, mkl,;m;, 11.45
1-Main TS 24.40 900.0 24.53 36.28 mkl,;m;, mkl,;m;,
2-Main TS 26.04 905.9 24.17 35.98 mkl,;m;, mkl,;m;,
3-Main TS 28.29 911.8 23.69 35.62 mkl,;m;, mkl,;m;,
4-Main TS 31.22 917.6 23.13 35.15 mkl,;m;, mkl,;m;,
5-Main TS 34.74 923.5 22.52 34.59 mkl,;m;, mkl,;m;,
6-Main TS 38.73 929.4 21.76 33.97 mkl,;m;, mkl,;m;,
7-Main TS 43.56 935.3 20.12 33.22 mkl,;m;, mkl,;m;,
8-Main TS 53.04 941.2 45.94 31.57 34.49 mkl,;m;,
9-Main TS 53.32 947.1 46.03 22.90 mkl,;m;, mkl,;m;,
10-Main TS 53.63 952.9 46.12 22.99 mkl,;m;, mkl,;m;,
11-Main TS 54.00 958.8 46.21 23.08 mkl,;m;, mkl,;m;,
12-Main TS 54.46 964.7 46.30 23.17 mkl,;m;, mkl,;m;,
13-Main TS 55.08 970.6 46.39 23.26 mkl,;m;, mkl,;m;,
14-Main TS 55.98 976.5 46.47 23.35 mkl,;m;, mkl,;m;,
15-Main TS 57.36 982.4 46.56 23.44 mkl,;m;, mkl,;m;,
16-Main TS 59.53 988.2 46.65 23.52 mkl,;m;, mkl,;m;,
17-Main TS 62.94 994.1 46.69 23.61 mkl,;m;, mkl,;m;,
18-Main TS 68.58 1000 46.07 23.65 mkl,;m;, mkl,;m;,
Reboiler 81.09 1000 mkl,;m;, 23.04 mkl,;m;, 23.04
Column Profiles Energy
Temperature (oC) Liquid Enthalpy
(KJ/Kgmol) Vapor Enthalpy (KJ/Kgmole) Heat Loss (KJ/h)
Condenser 23.49 -1.211e+005 -1.035e+005 mkl,;m;,
1-Main TS 24.40 -1.220e+005 -1.058e+005 mkl,;m;,
2-Main TS 26.04 -1.233e+005 -1.064e+005 mkl,;m;,
3-Main TS 28.29 -1.251e+005 -1.071e+005 mkl,;m;,
4-Main TS 31.22 -1.273e+005 -1.081e+005 mkl,;m;,
5-Main TS 34.74 -1.296e+005 -1.092e+005 mkl,;m;,
6-Main TS 38.73 -1.320e+005 -1.105e+005 mkl,;m;,
7-Main TS 43.56 -1.351e+005 -1.116e+005 mkl,;m;,
8-Main TS 53.04 -1.445e+005 -1.125e+005 mkl,;m;,
9-Main TS 53.32 -1.445e+005 -1.125e+005 mkl,;m;,
10-Main TS 53.63 -1.444e+005 -1.125e+005 mkl,;m;,
11-Main TS 54.00 -1.444e+005 -1.126e+005 mkl,;m;,
68 A. B. Raheem et al.: Comparative Economic Investigation Options for Liquefied Petroleum Gas Production from Natural Gas Liquids
Table 25. Hysys Conventional Column Butane Spliter Result
Distillation: Butane Splitter
SUMMARY
i - C4 n - C4
i-Pentane (%) 0.5859 99.4141
n-Pentane (%) 0.3218 99.6782
n-Hexane (%) 0.0303 99.9697
n-Heptane (%) 0.0032 99.9968
n-Octane (%) 0.0004 99.9996
n-Nonane (%) 0.0000 100.0000
n-Decane (%) 0.0000 100.0000
n-C11 (%) 0.0000 100.0000
n-C12 (%) 0.0000 100.0000
n-C13 (%) 0.0000 100.0000
n-C14 (%) 0.0000 100.0000
n-C15 (%) 0.0000 100.0000
n-C16 (%) 0.0000 100.0000
H2O (%) 100.0000 0.0000
COLUMN PROFILES
Reflux Ratio: 6.878 Reboil Ratio: 1.0000 The Flow Option is Selected Flow Basis: Molar
Column Profile Flows
Temperature (oC) Pressure (KPa) Net liquid
(Kgmole/h)
Net Vapor
(Kgmole/h)
Net Feed
(Kgmole/h)
Net Draws
(Kgmole/h)
Condenser 0.6579 400.0 24.90 mkl,;m;, mkl,;m;, 3.620
1-Main TS 9.819 400.0 22.37 28.52 mkl,;m;, mkl,;m;,
2-Main TS 27.88 405.9 36.37 25.99 23.04 mkl,;m;,
3-Main TS 29.60 411.8 36.53 16.95 mkl,;m;, mkl,;m;,
4-Main TS 31.70 417.6 36.73 17.11 mkl,;m;, mkl,;m;,
5-Main TS 34.13 423.5 36.97 17.31 mkl,;m;, mkl,;m;,
6-Main TS 36.77 429.4 37.25 17.55 mkl,;m;, mkl,;m;,
7-Main TS 39.42 435.3 37.57 17.84 mkl,;m;, mkl,;m;,
8-Main TS 41.88 441.2 37.89 18.15 mkl,;m;, mkl,;m;,
9-Main TS 44.04 447.1 38.20 18.47 mkl,;m;, mkl,;m;,
10-Main TS 45.83 452.9 38.48 18.78 mkl,;m;, mkl,;m;,
11-Main TS 47.29 458.8 38.72 19.06 mkl,;m;, mkl,;m;,
12-Main TS 48.48 464.7 38.93 19.30 mkl,;m;, mkl,;m;,
13-Main TS 49.46 470.6 39.11 19.51 mkl,;m;, mkl,;m;,
14-Main TS 50.32 476.5 39.26 19.69 mkl,;m;, mkl,;m;,
15-Main TS 51.12 482.4 39.39 19.84 mkl,;m;, mkl,;m;,
16-Main TS 51.95 488.2 39.49 19.98 mkl,;m;, mkl,;m;,
17-Main TS 53.06 494.1 39.47 20.07 mkl,;m;, mkl,;m;,
18-Main TS 55.23 500.0 38.84 20.05 mkl,;m;, mkl,;m;,
Reboiler 63.14 500.0 mkl,;m;, 19.42 mkl,;m;, 19.42
Column Profiles Energy
Temperature (oC) Liquid Enthalpy
(KJ/Kgmole) Vapor Enthalpy (KJ/Kgmole)
Heat Loss
(KJ/h)
Condenser 0.6579 -1.306e+005 -1.088e+005 mkl,;m;,
1-Main TS 9.819 -1.388e+005 -1.122e+005 mkl,;m;,
2-Main TS 27.88 -1.555e+005 -1.175e+005 mkl,;m;,
3-Main TS 29.60 -1.558e+005 -1.183e+005 mkl,;m;,
4-Main TS 31.70 -1.563e+005 -1.194e+005 mkl,;m;,
5-Main TS 34.13 -1.568e+005 -1.208e+005 mkl,;m;,
6-Main TS 36.77 -1.574e+005 -1.224e+005 mkl,;m;,
7-Main TS 39.42 -1.579e+005 -1.242e+005 mkl,;m;,
8-Main TS 41.88 -1.584e+005 -1.258e+005 mkl,;m;,
9-Main TS 44.04 -1.587e+005 -1.273e+005 mkl,;m;,
10-Main TS 45.83 -1.589e+005 -1.285e+005 mkl,;m;,
11-Main TS 47.29 -1.590e+005 -1.293e+005 mkl,;m;,
American Journal of Chemical Engineering 2015; 3(2-1): 55-69 69
References
[1] Wikipedia the Free Encyclopedia, en.wikipedia.org/wiki/LPG, 2010.
[2] M. R. Fenske, "Fractionation of straight-run Pennsylvania gasoline", Ind. Eng. Chem., Vol.24 Pp. 482, 1932.
[3] R. M. Ahmad, A. Majed, E. D. H. Osama, S. F. Marcos, and M. Amir – Usman, “Fractionation of Natural Gas Liquids to produce LPG" TPG4140 Natural Gas, Norway, 2011.
[4] K. Eldar, F. Feby and S. Juejing, "Process Design and Economic Investigation of LPG Production from Natural Gas Liquids (NGL)" TKP4170 Process design, Norway, 2010.
[5] Wikipedia the Free Encyclopedia: en.wikipedia.org/wiki/LPG-subtilis. 2012.
[6] Petroleum Fuel Facilities. MIL-HDBK-1022A, Department of defense of the United States, 1999, p. 34.
[7] J. D. Wilkinson, H. M. Hudson, K. T. Cuellar, and R.N. Pitman, "Next Generation Processes for NGL/LPG Recovery", Proceedings of the 77th GPA Annual Convention, pp 1-8, 2002.
[8] J. D. Wilkinson and H. M. Hudson, U.S., Patent No. 7,155,931, 2002.
[9] J. D. Wilkinson, H. M. Hudson and K. T. Cuellar, U.S., Patent Application Nos. 11/144,728; 60/810,244; and 60/812,686, 2002.
[10] A.C. Christiansen, S. Skogestad and K. Lien, "Complex Distillation Arrangements: Extending the Petlyuk ideas'', Computers and Chem. Engr., Pp. 21, Suppl., S237-S242. (Supplement from symposium PSE-97/ESCAPE-7, Trondheim, Norway, pp. 25-29, 1997.
[11] A.C. Christiansen, S. Skogestad and K. Lien, "Partitioned Petlyuk arrangements for quaternary separations'', Proc. Symposium Distillation and Absorption 97, Published by I Chem. E, UK. Maastricht, Netherlands. Pp. 745-756, 1997.
[12] M. Peters and K. Timmerhaus, "Plant Design and Economics for Chemical Engineers", Fourth Edition, McGraw-Hill International, New York, Pp. 910, 1991.
[13] E. R. Gilliland, "Optimum feed-plate composition in multicomponent rectification", Ind. Eng. Chem., Vol.32 Pp. 918, 1940.
[14] N. Grant and M. Santa, "LNG Fractionation Process and Optimization of the Turbo expander Unit", Proceedings of the 82nd GPA Annual Convention, Pp. 1-7, 2008.
[15] T. Richard, B. Richard, W. Wallace and A. S. Joseph, "Analysis, Synthesis, and Design of Chemical Processes", Third Edition. Prentice Hall, Pp. 1088, 2008.
[16] I. J. Halvorson and S. Skogestad, "Distillation Theory", from http://www.nt.ntnu.no/users/skoge/publications/1999/DistillationTheory/original/distillationtheory.pdf
[17] J. W. Holmes, M. L. Spears and J.A. Bullin, "Sweetening LPGs with Amines," Chemical Engineering Progress Conf. http://www.opisnet.com/methodology.asp#nglforwards 1984.
[18] S. Parkash, "Petroleum fuels manufacturing", McGraw-Hill, New York, Pp. 3-11, 2003.
[19] Wikipedia the Free Encyclopedia, en.wikipedia.org/wiki/NGL, 2012.
[20] T. James, S. Phil, and M. Erin, "Natural Gas Processing: The Crucial Link between Natural Gas Production and Its Transportation to Market, Energy Information Administration, Office of Oil and Gas", 2006.
[21] Argus NGL Americans Methodology from http://web04.us.argusmedia.com/ArgusStaticContent//Meth/NGL%20AmericasMeth-Latest.pdf
[22] Petroleum Fuel Facilities, MIL-HDBK-1022A, Department of defense of the United States, Pp. 34, 1999.
[23] K.T. Cuellar, H.M. Hudson, and J.D. Wilkinson, “Economical Options for Recovering NGL/LPG at LNG Receiving Terminals”, Proceedings of the 86th GPA Annual Convention, Pp. 2-10, 2007.
[24] CME prices from http://www.cmegroup.com/trading/energy/petrochemicals/mnt-belvieuiso-butane-5-decimal-opis-swap futures_quotes_settlements_futures.htm 2010.