Embed Size (px)
Citation preview

Civil Engineering Infrastructures Journal, 53(1): 33 – 51, June 2020
Print ISSN: 2322-2093; Online ISSN: 2423-6691
DOI: 10.22059/ceij.2020.267723.1521
* Corresponding author E-mail: [email protected]
33
Investigating the Performance of Cracked Asphalt Pavement Using Finite
Elements Analysis
Taherkhani, H.1 and Tajdini, M.2*
1 Associate Professor, Civil Engineering Department, University of Zanjan, Zanjan, Iran.
2 Ph.D., Civil Engineering Department, University of Tabriz, Tabriz, Iran.
Received: 17 Oct. 2018; Revised: 29 Dec. 2019; Accepted: 04 Jan. 2020
ABSTRACT: Occurrence of top down and bottom up fatigue cracking in asphaltic
pavements is common. Conventional pavement analysis methods ignore the existence of
cracks in asphaltic layers. However, it seems that the responses of cracked pavement would
not be the same as a pavement without crack. This paper describes effects of crack type,
position and length, and vehicles tire inflation pressure and axle load on the performance of
cracked asphalt pavement. Tensile strain at the bottom of asphaltic layer, the vertical strain
on subgrade, maximum deflection on the surface, rut depth and the stress intensity factors of
cracked pavement, with top down and bottom up crack have been computed using 3D Finite
Elements method in ABAQUS. Moving load of standard single axle with different loads and
tire pressures have been used in the analysis. Standard 8.2 ton single axle load at different
tire pressures of 552(80), 690(100), 828(120) and 1035(150) kPa(psi) and single axle at
different loads of 5, 8.2 and 15 ton, all at the same tire pressure of 690 kPa, have been used.
Results show that the pavement responses increase with increasing tire pressure and axle load
with higher values and rate of increase with increasing tire pressure and axle load for the
cracked pavement compared with the pavement without crack. For the pavement structure
investigated in this study, it was found that, in general, top down crack results in higher
responses than bottom up crack.
Keywords: Axle Load, Cracked Asphalt Pavement, Fatigue Cracking, Rutting, Tire
Pressure.
INTRODUCTION
Asphalt pavements are the most common
type of structures which are used in highway
construction worldwide. In order to preserve
the huge asset used in these structures, and
protect the environment, utilization of a
reliable pavement design method is necessary
(Khavandi Khiavi et al., 2019). One of the
requirements of a reliable pavement design
method is the capability of accurate
prediction of pavement performance during
its service life. In mechanistic-empirical
design methods, the pavement performance is
related to the pavement responses using
empirical transform functions. Many
agencies have used the horizontal tensile
strain at the bottom of the asphalt concrete
layer and the vertical compressive strain at
the top of the sub-grade for prediction of
pavement long term performance. The
horizontal tensile strain at the bottom of

Taherkhani, H. and Tajdini, M.
34
asphalt layer is related to the fatigue cracking,
initiating from the bottom and propagates to
the surface. However, due to excessive tensile
strains, the pavement cracks may also start at
the pavement surface and propagate
downward (Wu et al., 2019; Alae et al.,
2019).
The vertical compressive strain at the top
of the sub-grade is related to the pavement
rutting due to densification and/or
consolidation of the sub-grade soil (Huang,
2004). The accurate prediction of pavement
long-term performance relies on the accuracy
of determining the responses. Responses of
pavement can be determined using
mechanistic methods. Multilayer linear or
non-linear elastic or viscoelastic and finite
elements method are the common methods
used for flexible pavement analysis
(Taherkhani and Jalali, 2018; Rahman et al.,
2019; Alae et al., 2019).
Multilayer analysis methods have many
limitations, due to their simplifications in
dealing with the load, materials and sub-grade
mechanical behavior, geometry of pavement
structure and heterogeneity of pavement
materials, which are far from the reality.
Considering all of the realistic conditions
requires extensive computation and
development of accurate constitutive models
for simulation of the pavement materials
behavior.
Finite Elements (FE) method is a useful
tool for doing the computation. FE method
can model complex structures with complex
behavior of constituting materials. Using
three dimensional FE methods makes it
possible to consider the complexity of the
pavement materials behavior, the geometry of
layers, inclusion of cracks and geo-
synthetics, and the complex nature of loads in
the analysis and more accurately
determination of pavement responses. Many
general purpose FE analysis packages have
been developed, among which ABAQUS is
used more frequently than the others for
pavement analysis (Alae et al., 2019).
Due to the replacement of the bias-ply tires
by radial-ply tires, the truck tire pressures
have increased steadily since the AASHTO
road test (Hutchinson and Mallett, 1990).
Although in AASHTO road tests, the tire
pressures of 75 to 80 psi were used, the tire
pressures of 95 to 105 psi are more common
nowadays, and in some cases 120 to 130 psi
have also been used. The most evident result
of increasing tire pressure is the reduction of
the area of tire imprint. The studies conducted
in Texas University have shown that 50% of
increase in tire pressure has resulted in 8 to
25% reduction of the imprint surface area
(Marshek et al., 1985).
Similarly, studies in Ireland have shown
that the increase of tire pressure from 50 to
110 psi, have resulted in 35% and 22.4%
reduction of tire contact surface area of the
front and rear wheels, respectively (Owende
at al., 2001). The same results have been
reported by Good Year Co. (Ford and Yap,
1990). The reduction of tire imprint surface
area results in the increase of surface pressure
and pavement damage.
Several studies can be found in literature,
which has investigated the effects of tire
pressure on the pavement responses. Some
have conducted the studies by using
instrumented pavement sections (Mahoney et
al., 1995; Chatti et al., 1996). The others have
utilized the analytical methods, including
multilayer (Prozzi et al., 2005, Abdel-
Motaleb, 2007) and FE methods (Hernandez
et al., 2014; Kim et al., 2018). In both
methods, it has been found that the tire
pressure has significant influence on the
pavement responses, especially on the
horizontal tensile strain at the bottom of
asphalt layer.
Asphalt pavements are prone to the
occurrence of different cracks. The cracks
occur due to a combined effect of loads and
environmental conditions. They are classified
according to the cause of occurrence, such as

Civil Engineering Infrastructures Journal, 53(1): 33 – 51, June 2020
35
thermal or fatigue cracking, and the shape and
position of cracks, such as longitudinal,
transverse, diagonal, block, alligator, top
down and bottom up cracks. Fatigue cracking
occurs as a result of repeated tensile and/or
shear strain in asphaltic layers. For a long
time the assumption was that fatigue cracks
occurs at the bottom of asphaltic layers and
propagate upward to the pavement surface,
known as bottom up fatigue cracking.
However, studies in recent years have
indicated that top-down fatigue cracking is a
major mode of distress in asphaltic
pavements, which initiate at the top and
propagate downward (Sun et al. 2005; Zhao
et al. 2018). Top down fatigue cracks are
longitudinal and their location is in wheel
path. Various factors such as the contact
stress between tire and pavement, pavement
structure, stiffness of base layer and the
modulus gradient in asphalt layer due to
ageing and temperature gradient, may cause
the occurrence of top down cracking (Ling et
al. 2017; Alae et al., 2019).
Accurate analysis of pavement needs to
consider the existence of crack in asphaltic
layers. The responses of cracked asphaltic
materials are different from those without
cracks. You et al. (2018) investigated the
effects of pavement distresses on the
deflection basin measured by FWD
evaluation. They found that crack type and
position relative to the loading point affect the
pavement responses. In cracked pavement, in
addition to the traditional responses of
horizontal tensile strain in asphaltic layer and
the vertical strain on the top of subgrade,
fracture parameters, which are related to the
rate of crack propagation, are also important.
Stress Intensity Factors (SIF) are the most
common fracture parameters used for
evaluating fracture resistance of asphaltic
pavements (Jacobs et al., 2006; Modarres and
Shabani, 2015).
For viscoelastic materials J-integral and
fracture energy are more suitable to be used
for evaluation of crack propagation (Alae et
al., 2019). SIF is a measure of stress state at
crack tip. In fracture mechanics, three SIF,
namely KI, KII and KIII are used, which are
related to the modes of crack opening, sliding
and tearing, respectively (Ameri et al., 2011).
Aliha and Sarbijan (2016) investigated the
effects of length and number of cracks and
position of vehicles relative to crack on the
fracture parameters of bottom up and top
down cracks. They found that the position of
vehicle load is significantly effective on the
fracture parameters. It was also found that the
top down cracks are more vulnerable to
propagation than the bottom up cracks. The
thinner and stiffer overlay has more
pronounced fracture parameters.
Exploring literature shows that
investigating the pavement performance has
commonly been done using intact asphaltic
layers. However, the reality is that pavement
is cracked and their effect on the structural
analysis and performance needs to be
considered. Therefore, this research aimed to
investigate the effects of tire pressure and
axle load on the responses of cracked asphalt
pavement using Finite Elements method by
the application of commercially available FE
program of ABAQUS.
RESEARCH METHODOLOGY
As mentioned earlier, the main objective of
this study is to investigate the critical
responses of cracked asphaltic pavement
sections under different tire inflation
pressures and axle loads and their comparison
with those of a pavement section without
cracks as control section. Therefore, a typical
flexible pavement structure, including asphalt
concrete surface layer, unbound aggregate
base and sub-base layers on sub-grade soil, all
with linear elastic behavior, have been
modeled in ABAQUS.
Table 1 shows the properties of the sub-
grade and pavement layers. Although it is

Taherkhani, H. and Tajdini, M.
36
expected that the responses of different
pavement structures can be different, in this
study, only a fixed structure has been
selected, which is close to the typical
structures used for flexible pavements for
highways. Also, more realistic results can be
obtained by considering the realistic
behaviors for pavement layers and sub-grade.
However, in this research, for simplicity, all
layers were considered to behave elastically.
Different types of cracks may occur in
asphaltic layers of flexible pavements.
However, the most common type of cracks
observed in wheel path is the fatigue
cracking, which occurs due to the fatigue of
asphaltic materials as a result of repeated
tensile strain induced by traffic loads. They
may occur as top down or bottom up cracks,
which are normally developed longitudinally
at their initial stage. In this research,
longitudinal top down and bottom up cracks
with the same length of 0.5 m and depth of
7.5 cm (half of the surface layer thickness)
have been used in modeling. The critical
position of crack relative to the dual tires
imprint will be used for evaluation of tire
pressure and axle load effects on the
pavement responses.
Three dimensional models of the
pavement structure were made using cubical
elements which is the most common type
used in previous studies (Sun and Duan,
2013). The dimensions of 6×6×6 m for the
model were selected after trying different
dimensions. Figure 1 shows the model used
in this research. As can be seen, the
dimensions of the meshes around the load
were chosen to be smaller than the rest of
elements. In order to have more convergence
and accuracy, 8 node elements (3D8R) have
been used (Rahman et al., 2011).
The boundary conditions were defined to
simulate the free movement of sides in
vertical direction and the constrained
horizontal movement of the bottom of the
model (Fakhri and Farokhi, 2010). To prevent
the horizontal movement of the model, the
circumferential nodes were constrained
against horizontal movements, while were
free to move vertically. The nodes at the
bottom of the model were tied to prevent
moving in any direction.
Table 1. Properties of pavement layers used in modeling (Huang, 2004)
Layers Thickness (cm) Elastic modulus (MPa) Poisson's ratio Unit weight (gr/cm3)
Surface 15 4000 0.4 2.4
Base 25 400 0.3 2.1
Sub-base 25 200 0.3 2
Sub-grade 535 50 0.25 1.8
Fig. 1. Cubical element used in modeling

Civil Engineering Infrastructures Journal, 53(1): 33 – 51, June 2020
37
The analysis of the models have been
undertaken using 8.2ton single axle load with
dual tires assembly at different tire pressures
of 552(80), 690(100), 828(120) and
1035(150) kPa(psi). In addition, in order to
evaluate the effects of axle load on the
pavement responses, single axle load with
single tire and different weights of 5, 8.2 and
15 ton, all with the same tire pressure of 690
kPa (100 psi) have been used. All of the loads
were considered to move at a speed of 80
km/h.
Different contact areas of tire and
pavement have been used by researchers,
including oval, rectangular, circular etc.
Rectangular contact area has been used in this
study, as previous studies have shown that
acceptable results can be obtained (Fakhri et
al., 2009; Chen et al., 1990; Zheng and Xie,
2003). The area of the contact surface was
obtained by dividing the tire load to the tire
pressure. The length and width of the
rectangles were considered to be 0.8721L and
0.6L, respectively, (Huang, 2004). Eq. (1)
was used for determination of L.
5227.0
CAL (1)
where; AC: is the area of contact surface.
Moving loads were applied, all at the same
speed of 80 km/h (22.22 m/s). The total
loading time T, calculated by Eqs. (2) and (3),
was used for calculating the amount of
pressure at different moments over the period
of loading (Sun and Duan, 2013).
V
aT 12 (2)
)sin(0T
tpp
(3)
where; a: is the length of contact area in cm,
V: is the speed in cm/sec, p: is the amount of
pressure at time t and p0: is the maximum
contact pressure. Table 2 shows the length of
contact surface rectangle and loading time for
different tire pressures and axle loads
investigated in this study. For verification, the cracked pavement
section, with the similar layer thicknesses and
material properties as used by Sun and Duan
(2013), were analyzed under moving load with
the tire contact area as shown in Figure 2 and
contact pressure of 690 kPa (100 psi). Table 3
shows the results of analysis for the maximum
surface deflection, the maximum tensile strain in
asphalt layer and the stress intensity factor KI at
different speeds, and those obtained by Sun and
Duan (2013). As can be seen, the differences are
not significant, which verify the modeling used in
this research.
Fig. 2. Tire contact area
Table 2. Length of contact area and loading time for different tire pressures and axle loads
Axle load (kN) Tire pressure (kPa (psi)) L (cm) T (sec)
82 552 (80) 23.2 0.125
82 690 (100) 20.78 0.112
82 828 (120) 18.96 0.103
82 1035 (150) 17.2 0.093
50 690 (100) 22.95 0.124
82 690 (100) 29.38 0.159
150 690 (100) 39.74 0.21

Taherkhani, H. and Tajdini, M.
38
Table 3. Results of analysis for verification
Speed
(km/h)
Maximum tensile strain
(× 10-5)
Surface deflection
(× 10-5 m)
Stress intensity factor KI
(kPa × m0.5)
This
research
Sun and
Duan
This
research
Sun and
Duan
This
research
Sun and
Duan
60 4.7 4.97 3.44 3.33 102 100
80 4.75 5.07 3.3 3.2 102 100
100 4.8 5.08 3.1 3.11 104 100
RESULTS AND DISCUSSIONS
Critical Position of Crack
The responses of the pavement were
evaluated by positioning the 1.5 m long full
depth crack at different lateral distances from
the geometric center of dual tire imprints, as
shown in Figure 3. 8.2 ton single axle with
dual tires and tire pressure of 552 kPa (80 psi)
was used, for which the width of rectangle
was 16 cm and the width of the gap between
dual tires was 8 cm. The results of analyses
are presented in Table 4. As was expected,
results show that the responses under cracked
pavement are higher than those in the
pavement without crack. The results also
show that the most critical position of crack
is when the center of crack is placed at the
geometric center of dual tires, for which the
highest responses are resulted. In addition, it
can be seen that the responses resulted from
placing the center of each tire on the crack is
much lower than those resulted from placing
the inner or outer edge of tire on crack. Also,
it is seen that, the responses decreases with
increasing the distance between crack
position and tire load. Based on these results,
it was decided to use the critical position of
crack for further investigation in this
research.
Fig. 3. Lateral positions for the longitudinal crack
Table 4. Variation of pavement responses with position of crack
Position of crack
The maximum
tensile strain in
asphaltic layer
(× 10-5)
The maximum
vertical strain on
subgrade
(× 10-5)
The maximum
surface
deflection
(mm)
Stress
intensity
factor KI
(kPa × m0.5)
Stress
intensity
factor KII
(kPa × m0.5)
Along the axis of symmetry
of dual tires 9.9 2.25 0.384 324 16
Along the inner edge of tires 9.84 2.21 0.382 318 48
Along the center of tires 6.11 1.11 0.215 60 38
Along the outer edge of tires 9.49 0.38 261 247
0.5 m from the outer edge 9.2 2.19 0.37 43 13
1 m from the outer edge 9.09 2.17 0.368 32 6
1.5 m from the outer edge 8.91 2.13 0.367 18 4
2 m from the outer edge 8.73 2.12 0.367 7 2
Uncracked pavement 8.59 2.1 3.62 - -
Civil Engineering Infrastructures Journal, 53(1): 33 – 51, June 2020
39
Effects of Crack Length
The responses of the pavement including
the maximum tensile strain in asphaltic layer,
the maximum vertical strain on the subgrade,
the maximum vertical deflection on surface
and the stress intensity factors in mode I and
II were determined by analysis of model
under single axle load of 8.2 ton and tire
pressure of 552 kPa (80 psi) in pavement
sections with and without crack. In these
analyses the top down and bottom up cracks
with 7.5 cm in depth were considered to be
along the center of dual tires. Results are
shown in Table 5. As can be seen, in general,
the responses under top down cracks are
higher than those under bottom up cracks. In
addition, the responses increase with
increasing crack length. Among the responses
the stress intensity factors are more sensitive
to crack length than the other responses, and
the vertical compressive strain in sub-grade is
the least influenced response.
The Results for the Effects of Tire Inflation
Pressure
As mentioned earlier, in order to
investigate the effects of tire pressure on the
responses of cracked pavement sections and
its comparison with the section without crack,
8.2 ton single axle with dual tires assembly
and different tire pressures of 552(80),
690(100), 828(120) and 1035(150) kPa was
used in all analyses. The load was applied at
a constant speed of 80 km/h. Longitudinal top
down and bottom up cracks, denoted by TD
and BU, respectively, both with the same
length of 0.5 m and different depths, located
at the middle of the gap between the dual tires
imprints, were used for analysis. The
responses of interest were the maximum
tensile strain in asphalt layer, the maximum
vertical compressive strain on the sub-grade,
the surface maximum rut depth, and the stress
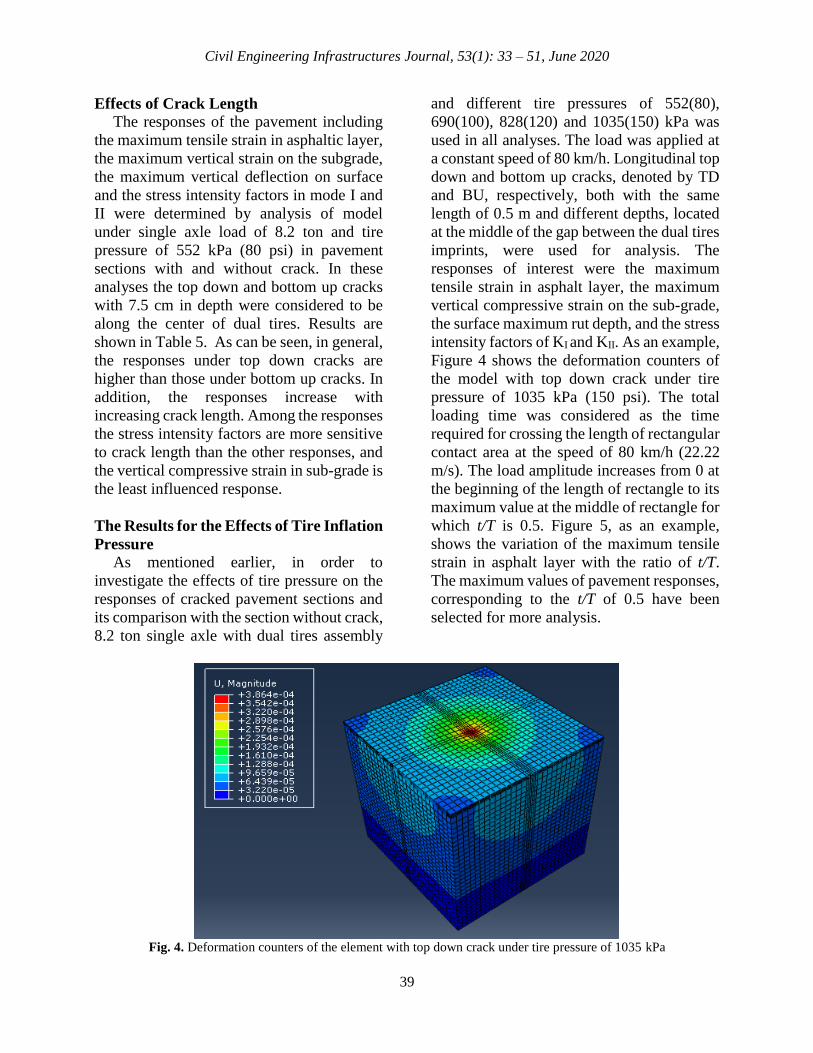
intensity factors of KI and KII. As an example,
Figure 4 shows the deformation counters of
the model with top down crack under tire
pressure of 1035 kPa (150 psi). The total
loading time was considered as the time
required for crossing the length of rectangular
contact area at the speed of 80 km/h (22.22
m/s). The load amplitude increases from 0 at
the beginning of the length of rectangle to its
maximum value at the middle of rectangle for
which t/T is 0.5. Figure 5, as an example,
shows the variation of the maximum tensile
strain in asphalt layer with the ratio of t/T.
The maximum values of pavement responses,
corresponding to the t/T of 0.5 have been
selected for more analysis.
Fig. 4. Deformation counters of the element with top down crack under tire pressure of 1035 kPa

Taherkhani, H. and Tajdini, M.
40
Fig. 5. Variation of tensile strain with the time of loading
Table 5. Variation of pavement responses with crack length
Crack length
(cm)
Horizontal
tensile strain
in asphalt
(× 10-5)
The maximum
vertical strain
on subgrade
(× 10-4)
The maximum
surface
deflection
(mm)
Stress
intensity
factor KI
(kPa × m0.5)
Stress
intensity
factor KII
(kPa × m0.5)
TD* BU** TD BU TD BU TD BU TD BU
0 8.59 8.59 2.1 2.1 0.362 0.362 - - - -
5 8.68 8.6 2.25 2.24 0.372 0.37 84 21 13 7
15 8.83 8.68 2.26 2.26 0.375 0.373 201 47 27 21
25 9.29 8.71 2.29 2.27 0.376 0.374 232 56 15 11
50 9.91 9.09 2.35 2.28 0.384 0.385 324 91 16 48
75 10.8 9.18 2.38 2.31 0.391 0.391 468 151 23 92
*Top down crack, **Bottom up crack One of the critical responses of flexible
pavements is the maximum tensile strain in
the asphaltic layers, which is related to the
critical distress of fatigue cracking. The
fatigue life decreases exponentially with
increasing the tensile strain in asphalt layer.
Several equations can be found in literature
that relate the tensile strain to the fatigue life.
Figure 6 shows the variation of the
maximum tensile strain of asphalt layer with
tire pressure for the pavement sections with
different depths of top down and bottom up
crack and the control section without crack
(UC). In this figure the notations of TD and
BU, have been used for top down and bottom
up crack, after which the numbers show the
depth of crack in cm. The TD-15 and BU-15
are corresponding to models in which a crack
depth of 14.9 cm has been used.
As can be seen in Figure 6, for all sections,
the maximum tensile strain in asphalt layer
increases with increasing tire pressure, which
is consistent with the findings in previous
studies (Machemehl et al., 2005; Prozzi and
Luo, 2005). However, the rate of increase
grows with increasing crack depth, with
higher rate of increase for the sections with
top down crack than that for bottom up crack.
For example, by the increase of the tire
pressure from 552 to 1035 kPa, the maximum
horizontal tensile strain of asphalt layer in the
pavement section without crack, with 7.5 cm
deep top down and bottom up crack increases
13, 33 and 15%, respectively. At the tire
pressure of 1035 kPa, the maximum tensile
strain of the section with 7.5 cm deep top
down crack is, approximately, 33 and 24%,
respectively, higher than that of the section
without crack and the section with bottom up
crack. However, at 552 kPa, those values are
12.7 and 7.4%, respectively.
0
0.00002
0.00004
0.00006
0.00008
0.0001
0.00012
0 0.2 0.4 0.6 0.8 1 1.2
Ten
sile
Str
ain
t/T
552kPa
690kPa
828kPa
1035kPa

Civil Engineering Infrastructures Journal, 53(1): 33 – 51, June 2020
41
Fig. 6. Variation of the maximum tensile strain in asphalt layer with tire pressure
Another critical response of flexible
pavements is the vertical compressive strain
at the top of the sub-grade. Mechanistic-
empirical design methods use this response
for prediction of pavement rutting. The higher
the compressive strain on the sub-grade, the
lower the rutting life, which is defined as the
number of loads applied before the
occurrence of the critical rut depth. Figure 7
shows the variation of the maximum
compressive strain on the sub-grade with tire
pressure for the pavement sections with
different depths of top down and bottom up
crack, and the control pavement without
crack.
As can be seen, the strain increases with
increasing tire pressure and crack depth.
Also, the results reveal that for the crack
depths of 3.75 and 7.5 cm, the strain of the
sections with bottom up crack is higher than
that of those with top down crack. However,
for higher depths, the trend reverses and the
strain for the sections with top down cracking
is higher than that for the sections with
bottom up cracks. Comparing the results in
Figure 7 with those in Figure 8 reveals that
the increase of the compressive strain at the
top of sub-grade with increasing tire pressure
is not as much as the increase of the
horizontal tensile strain of asphalt layer,
indicating that the compressive strain on sub-
grade, is not sensitive to the tire inflation
pressure as much as the tensile strain in
asphalt layer. Increase of the tire pressure is
more influencing on the fatigue cracking of
asphalt layer than the permanent deformation
in sub-grade.
Fig. 7. Variation of the maximum compressive strain on sub-grade with tire pressure
8
9
10
11
12
13
14
15
552 690 828 1035
Ho
rizo
nta
l T
ensi
le S
tra
in (×
10
-5)
Tire Pressure (kPa)
TD-3.75 TD-7.5 TD-10TD-15 BU-3.75 BU-7.5BU-10 BU-15 UC
2.05
2.1
2.15
2.2
2.25
2.3
2.35
2.4
552 690 828 1035Ver
tica
l S
train
on
Su
bgra
de
(×10
-4)
Tire Pressure (kPa)
TD-3.75 TD-7.5 TD-10TD-15 BU-3.75 BU-7.5BU-10 BU-15 UC

Taherkhani, H. and Tajdini, M.
42
Stress intensity factor shows the intensity
of stress at a crack tip. The magnitude of the
crack intensity factor is an indication of the
potential of crack propagation. Three modes
of failure are defined for relating the stress
and displacement in cracks, which are
opening mode (mode I), shear mode (mode
II), and torsion mode (mode III), as shown in
Figure 8. In mode I, II and III, the crack
propagates due to pure tension, shear and
torsion, respectively. The crack will
propagate in a mode with a higher
corresponding stress intensity. Previous
studies show that mode I and II are dominant
in pavement (Sun and Duan, 2013).
Therefore, the stress intensity factors of mode
I and mode II, KI and KII, have been
investigated in this research, and mode III has
been disregarded.
Figures 9 and 10 show, the variation of the
stress intensity factor in mode I and mode II,
respectively, with tire pressure and crack
depth for the pavement sections. As can be
seen, the stress intensity factors increase with
increasing tire pressure, indicating that the
potential of crack propagation increases with
increasing tire pressure. Consistent with
previous studies (Sun and Duan, 2013; Fakhri
et al., 2010), it is observed that the mode I is
more critical than mode II, indicating that the
opening mode in crack propagation is
dominant. It can also be seen that the stress
intensity factors of KI and KII of the pavement
increase with increasing crack depth, with
higher values for top down crack than bottom
up crack, indicating that the rate of crack
propagation increases with increasing crack
depth with higher rate for pavement with top
down crack than that with bottom up crack.
Comparing Figure 9 and 10 reveals that the
stress intensity factor of KI is more sensitive
to the crack depth than the factor KII.
However, the factor KII is more sensitive to
tire pressure than KI.
Fig. 8. Crack propagation in different modes (Sun and Duan, 2013)
Fig. 9. Variation of the stress intensity factor KI with tire pressure
8
108
208
308
408
508
608
708
808
552 690 828 1035
Str
ess
Inte
nsi
ty F
cto
r, K
I
(kP
a*
m0
.5)
Tire Pressure (kPa)
TD-3.75 TD-7.5 TD-10 TD-15
BU-3.75 BU-7.5 BU-10 BU-15

Civil Engineering Infrastructures Journal, 53(1): 33 – 51, June 2020
43
Fig. 10. Variation of the stress intensity factor KII with tire pressure
Rutting is one of the major structural
failure modes in flexible pavements, which
occurs as a result of accumulation of the
plastic deformation in all layers and subgrade
(Taherkhani and Arshadi, 2018). Rutting is
defined by its depth, and the appropriate
measures for maintenance is usually chosen
based on the rut depth. The rut depth of
pavement sections in this study was
calculated using Eq. (4).
1
ni i
p
i
RD h
(4)
where, RD: is the total rut depth on the
surface in mm, i
p : is the plastic strain in ith
sub-layer, hi: is the thickness of ith sub-layer
in mm and n: is the number of sub-layers.
To this end, the pavement in each model
was divided into n sub-layer and the plastic
strain in the mid-depth of each sub-layer was
calculated using Eq. (5) for asphaltic layer
and Eq. (6) for the unbound layers and
subgrade (Wang and Machemehl, 2006).
3.4488 1.5606 0.479244
110p
r
k T N
(5)
01
p N
r a
e
(6)
where, εp: is plastic strain, εr: is resilient
strain, k1: is asphalt layer thickness correction
factor, T: is pavement temperature in °F, N: is
the number of axle load repetitions, εa: is
resilient strain imposed in laboratory tests, β1:
is regression coefficient and β, ε0 and ρ: are
pavement materials properties.
The resilient strain in sub-layers was
determined by finite element analysis and the
values for other parameters were obtained
from previous studies (Wang and
Machemehl, 2006). The rut depth at different
lateral distances from the center of dual tires
was calculated and it was found that the
maximum rut depth occurs at 14 cm from the
center of dual tires. For example, Figure 11
shows the rut depth on the pavement with 7.5
cm top down crack after 1000 loading cycles.
The maximum rut depth of cracked and intact
pavement sections was determined after
1000, 10000, 100000 and 1000000 loading
cycles.
Figure 12 shows the maximum rut depth of
the pavements after different loading cycles.
As can be seen, the rutting of cracked
pavements is higher than that of the pavement
without crack. Also, the results show that the
rutting depth increases with increasing crack
depth, with higher rut depth for the
pavements with top down crack than that for
bottom up crack. Furthermore, it can be seen
that the rate of increase of rut depth with
loading repetition increases with increasing
crack depth with higher rate for the pavement
with top down cracks.
0
20
40
60
80
100
552 690 828 1035
Str
ess
Inte
nsi
ty F
cto
r, K
II
(kP
a*
m0
.5)
Tire Pressure (kPa)
TD-3.75 TD-7.5 TD-10 TD-15
BU-3.75 BU-7.5 BU-10 BU-15

Taherkhani, H. and Tajdini, M.
44
Fig. 11. Rut depth after 1000 loading repetitions in pavement with 7.5 cm top down crack
Fig. 12. Variation of rut depth with number of loading repetitions
Figure 13 shows the variation of the
maximum rut depth with number of loading
repetition under different tire pressures for a
pavement with 7.5 cm deep top down crack.
These results have been obtained by using 8.2
ton single axle with dual tires. As can be seen,
the rut depth increases with increasing tire
pressure. Also, these results reveal that the
rate of increase of rut depth with loading
repetition increases with increasing tire
pressure, indicating that the high pressure
tires results in fast propagation of rut depth in
cracked pavements, such that, the rut depth
occurred after 1000000 repetition of 8.2 ton
axle load with a tire pressure of 1035 Kpa
(150 psi) is approximately 3 times higher than
that with a tire pressure of 552 kPa (80 psi).
The Results for the Effects of Axle Load One of the major properties of vehicles
influencing the pavement performance is the
load transmitted by the axles to the pavement.
The maximum load of different types of axles
is limited to specified legal values. In order to
investigate the effect of axle load on the
immediate responses of cracked pavement
and its comparison with the pavement
without crack, single axle with single tire and
different axle loads of 5, 8.2 and 15 ton were
used in modeling. These values were used
according to the maximum legal value of 8ton
for this type of axle in Iran, to evaluate the
damage caused by the axle loads higher and
lower than the legal value. Using the same
structure as described earlier, three
-6
-5
-4
-3
-2
-1
0
0 0.5 1 1.5 2 2.5 3 3.5
Ru
t d
epth
(m
m)
Distance from center of dual tires (m)
0
5
10
15
20
25
30
35
40
1000 10000 100000 1000000
Ru
t D
epth
(m
m)
Number of Loading Cycles
TD-3.75 TD-7.5 TD-10TD-15 BU-3.75 BU-7.5BU-10 BU-15 UC

Civil Engineering Infrastructures Journal, 53(1): 33 – 51, June 2020
45
dimensional models of cracked pavements, in
which longitudinal top down and bottom up
cracks with a length of 0.5 m and depth of 7.5
cm located at the geometric center of
rectangular tire contact surface were made in
addition to the pavement section without
crack.
In all cases, the tire pressure of 690 kPa
(100 psi), which is normally used for truck
tires nowadays, and speed of 80 km/h was
used. After analysis, the responses of the
maximum tensile strain in asphalt layer, the
maximum compressive strain on the sub-
grade, the maximum vertical deflection of
surface and the stress intensity factors of KI
and KII were used for evaluation.
Figure 14 shows the variation of the
maximum tensile strain in asphalt layer for
the cracked and intact pavement sections. As
can be seen, the maximum tensile strain in
asphalt layer increases with increasing axle
load, with different rate of increase for
different pavement sections. As can be seen,
the section with bottom up crack has the
highest rate of increase. It can also be seen
that the maximum tensile strain of the section
with top down crack is higher than that of the
section with bottom up crack and the intact
section. The maximum tensile strain of the
section with top down and bottom up crack is
approximately, 35 and 25%, respectively,
higher than that of the control section,
indicating that the pavement sections with top
down cracks are more vulnerable to fatigue
cracking.
Fig. 13. Variation of rutting depth with tire pressure and load repetitions
Fig. 14. Variation of the maximum tensile strain in asphalt layer with axle load
0
10
20
30
40
50
60
1000 10000 100000 1000000
Ru
t D
epth
(m
m)
Number of Loading Cycles
80psi 100psi 120psi 150psi
y = 0.8522x + 3.0124
y = 1.0951x + 5.7395
y = 1.2543x + 2.123
5
7
9
11
13
15
17
19
21
23
25
4 6 8 10 12 14 16
Th
e m
axim
um
ten
sile
str
ain
(x10
-5)
Axle Load (ton)
UN
TD
BU

Taherkhani, H. and Tajdini, M.
46
Figure 15 shows the variation of the
maximum vertical compressive strain on the
sub-grade with the axle load in three different
pavement sections. As can be seen, the
maximum compressive strain on the sub-
grade increases with increasing axle load in
all sections, with a higher values and rate of
increase for the cracked sections. The values
for the cracked sections are approximately
17% higher than those for intact section. It
can also be seen that the difference between
the maximum compressive strain on sub-
grade for the section with top down and
bottom up crack is not significant, although
for the section with top down crack is slightly
higher. Comparing the results with those for
tire pressure, it can be inferred that the
compressive strain on sub-grade, which is
normally related to rutting, is more sensitive
to the axle load rather than the tire pressure.
The surface deflection under applying a
single load is an indication of the structural
capacity of a pavement, and a pavement with
a higher deflection has a lower remained life.
Figure 16 shows the variation of the
maximum surface vertical deflection of the
pavement sections with axle load. As can be
seen, the surface deflection increases with
increasing axle load, with the higher values
for the section with top down crack, and the
lowest values for the intact pavement. The
maximum surface deflection of the pavement
with top down crack is, approximately, 18%
higher than that of the section with bottom up
crack, and 50% higher than that of the section
without crack. These results imply that the
cracked sections will have much lower life
than the sections without crack. It can also be
seen that the rate of increase with increasing
axle load is higher for the cracked sections
than the intact pavement, indicating that
allowing the trucks with axle loads higher
than the legal values, leads different
consequences in the sections with crack,
especially with top down cracks, and those
without crack.
Figures 17 and 18 show, respectively, the
variation of the stress intensity factor KI and
KII, with the axle load for the pavement
sections with top down and bottom up crack.
As can be seen in Figures 17 and 18, over the
range of axle loads used in this research, in
both modes, the values of stress intensity
factors in the pavement section with top down
crack are higher than those of the pavement
section with bottom up crack, indicating that
the top down cracks have more potential to
propagate in opening and shear mode than the
bottom up crack. In addition, the rate of
increase of the stress intensity factor KI with
axle load for the pavement section with top
down crack is 4 times higher than that for the
pavement section with bottom up crack,
indicating that the increase of vehicles axle
load causes more propagation of top down
cracks than the bottom up cracks. However,
in mode II, the rate of increase of stress
intensity factor for the pavement section with
bottom up crack is higher than that for the
section with top down crack, indicating that
at higher axle load levels, the stress intensity
factor of KII for the bottom up cracked section
may become dominant.
In order to investigate the effects of axle
load on rutting, following the method as
described earlier, the rut depth of a pavement
section with 7.5 cm top down crack was
calculated at different lateral distances from
the center of dual tires under different axle
loads. In these analyses, a tire pressure of 690
kPa (100 psi) has been used. Figure 19 shows
the rutted shapes of the pavement. As can be
seen, the rut depth increases with increasing
axle load. Also, it can be seen that the rate of
increase in rut depth increases with increasing
axle load. Comparing the rutted shape of the
pavement with top down and bottom up crack
under axle load of 8.2 ton reveals that the top
down cracked sections results in higher rut
depth than the sections with bottom up crack.

Civil Engineering Infrastructures Journal, 53(1): 33 – 51, June 2020
47
Fig. 15. Variation of the maximum compressive strain on sub-grade with axle load
Fig. 16. Variation of the maximum surface deflection with axle load
Fig. 17. Variation of the stress intensity factor KI with axle load
y = 0.246x + 0.1108
y = 0.2863x + 0.1716
y = 0.2928x + 0.0511
1
1.5
2
2.5
3
3.5
4
4.5
5
4 9 14
Th
e m
ax
imu
m c
om
pre
ssiv
e
stra
in (
x1
0-4
)
Axle Load (ton)
UN
TD
BU
y = 0.3176x + 0.7283
y = 0.5586x + 0.6526y = 0.534x + 0.1799
1
2
3
4
5
6
7
8
9
10
4 6 8 10 12 14 16
Th
e m
ax
imu
m s
urf
ace
def
lect
ion
(x
10
-4m
)
Axle Load (ton)
UN
TD
BU
y = 64.41x + 98.884
y = 17.255x + 112.81
0
200
400
600
800
1000
1200
4 6 8 10 12 14 16
Str
ess
inte
nsi
ty f
act
or
KI(
kP
a*
m0
.5)
Axle load (ton)
TD
BU

Taherkhani, H. and Tajdini, M.
48
Fig. 18. Variation of the stress intensity factor KII with axle load
Fig. 19. Rutting of the pavement section with 7.5cm top down crack under different axle loads
In order to compare the effect of using dual
tires with single tire, the responses of the
cracked and intact pavement sections,
corresponding to 8.2 ton single axle with dual
and single tires, both at the same tire pressure
of 690 kPa (100 psi) have been presented in
Table 6. As can be seen, the single tire results
in higher responses than the dual tires, with
the highest difference for the stress intensity
factor KI, for which the stress intensity factor
under single tire is approximately, 244 and
184% higher than that of dual tire for the
sections with bottom up and top down crack,
respectively, indicating that the sections with
bottom up crack are more vulnerable to crack
propagation under single axles with single
wheel.
The results in Table 6 also show that the
maximum tensile strain in asphalt layer is also
significantly affected by using single tire
instead of dual tires. The maximum tensile
strain of asphalt layer under single tire is
approximately, 8.5, 31 and 24% higher than
that under dual tires for the pavement section
without crack, with top down crack and
bottom up crack, respectively; indicating that,
under the same axle load, the axles with
single tire has more deteriorating effect on the
fatigue cracking of sections with top down
crack. The results also show that, although the
axles with single tire result in the same
compressive strain at the top of sub-grade and
lower surface deflection than the axles with
dual tires, for the cracked sections, the
deflection of pavement and the compressive
strain at the top of sub-grade are higher under
single tire than those under dual tire, with
higher responses for the section with top
down crack.
y = 29.126x + 149.22
y = 39.41x - 68.449
0
100
200
300
400
500
600
700
4 6 8 10 12 14 16
Str
ess
inte
nsi
ty f
act
or
KII
kP
a*m
0.5
)
Axle load (ton)
TD
BU
-100
-80
-60
-40
-20
0-1.5 -1 -0.5 0 0.5 1 1.5
ut
dep
th (
mm
))Distance from center of dual tires (m)
5ton
8.2ton
12 ton
15ton
8.2ton-BU

Civil Engineering Infrastructures Journal, 53(1): 33 – 51, June 2020
49
Table 6. Comparison between the responses of single axle with single and dual tires
Section
type
Tensile strain in asphalt
layer (× 10-5)
Compressive strain on
sub-grade (×10-5)
Surface deflection
(× 10-4m)
Stress intensity
factor KI (kPa × m0.5)
Single tire Dual tires Single tire Dual tires Single
tire
Dual
tires Single tire
Dual
tires
UN 10.3 9.5 2.1 2.1 3.4 3.82 - -
TD 14.3 10.9 2.51 2.26 5.3 3.85 624 339
BU 11.9 9.6 2.43 2.28 4.53 3.87 225 92
CONCLUSIONS
The effects of varying tire pressure and axle
load on some responses of cracked flexible
asphalt pavement have been evaluated and
compared with the pavement without crack.
For the pavement section used for modeling
in this research, the following are the brief
results.
The maximum tensile strain of asphalt
layer increases with increasing tire pressure
and axle load, with a higher values and rate of
increases for the pavement section with top
down crack.
The maximum compressive strain on sub-
grade of cracked and intact pavement sections
increases with increasing tire pressure and
axle load, with more sensitivity to the axle
load and higher rate of increase for the section
with bottom up crack.
The maximum compressive strain on sub-
grade of the pavement with bottom up crack
is higher than those of the section with top
down crack and intact pavement section.
The maximum surface deflection of
cracked pavement is higher than that of intact
pavement with a higher deflection for the
pavement with bottom up crack under the
axle with dual wheels, while under the axles
with single wheel, the maximum deflection of
the pavement with top down crack is higher
than the others.
The rut depth increases with increasing tire
pressure, axle load and crack depth, with
higher rut depth for the sections with top
down crack than those with bottom up crack.
The rate of increase in rut depth with loading
repetition increases with increasing tire
pressure and crack depth.
The results of stress intensity factors show
that the opening mode is dominant, with the
highest potential of crack propagation for the
top down crack.
The stress intensity factor in opening mode
increases with increasing tire pressure and
axle load, with a higher rate of increase with
tire pressure for the section with bottom up
crack, and a higher rate of increase with axle
load for the pavement with top down crack.
The results of this research shows that the
top down cracks are more critical than the
bottom up cracks and need more care for
having an acceptable pavement performance.
It is worthy to note that the top down cracks
are visible and can be filled; while the bottom
up cracks cannot be seen until propagate to
the surface.
REFERENCES
Abdel-Motaleb, M.E. (2007). "Impact of high pressure
truck tires on pavement design in Egypt", Emirates
Journal for Engineering Research, 12(2), 65-73.
Alae, M., Haghshenas, H.F. and Zhao, Y. (2019).
“Evaluation of top-down crack propagation in
asphalt pavement under dual tires loading”,
Canadian Journal of Civil Engineering, 5, 185-
193.
Aliha, M.R.M. and Sarbijan, M.J. (2016). “Effects of
loading, geometry and material properties on
fracture parameters of a pavement containing top-
down and bottom-up cracks”, Engineering
Fracture Mechanics, 166, 182-197.
Ameri, M., Mansourian, A., Khavas, M.H., Aliha,
M.R.M. and Ayatollahi, M.R. (2011). “Cracked
asphalt pavement under traffic loading, A 3D Finite
Element analysis”, Engineering Fracture
Mechanics, 78(8), 1817-1826.
Chatti, K., Kim, H.B., Yun, K.K., Mahoney, J.P. and
Monismith, C.L. (1996). “Field investigation into

Taherkhani, H. and Tajdini, M.
50
effects of vehicle speed and tire pressure on asphalt
concrete pavement strains”, Transportation
Research Record, No. 1539, Transportation
Research Board, Washington D.C., 66-71.
Chen, H.H., Marshek, K.M. and Saraf, C.L. (1990).
“Effects of truck tire contact pressure distribution
on the design of flexible pavements: A three
dimensional Finite Element approach”,
Transportation Research Record, No. 1095, 72-78.
Fakhri, M., Farokhi, M. and Kheiry, P.T. (2009).
“Modeling of Top-Down Cracking (TDC)
propagation in asphalt concrete pavements using
fracture mechanics theory”, Advanced Testing and
Characterisation of Bituminous Materials, II, 681-
692.
Ford, T.L. and Yap, P. (1990). “The truck
tire/pavement interface”, The Promise of New
Technology in the Automotive Industry, Torino,
Italy, 330-340.
Huang, Y.H. (1993). Pavement analysis and design,
Prentice-Hall, Inc., Englewood Cliffs, New Jersey.
Hutchinson, B.G. and Mallett, J.J.L. (1990). “Line haul
transportation cost and pavement damage
characteristics of some Ontario trucks”, Canadian
Journal of Civil Engineering, 17(1), 28-35.
Hernandez, J., Gamez, A., Al-Qadi, I. and De Beer, M.
(2014). “Analytical approach for predicting three-
dimensional tire-pavement contact load”, Journal
of the Transportation Research Board, 2456, (1),
75-84.
Jacobs, M.M.J., Hopman, P.C. and Molenaar, A.A.A.
(1996). “Application of fracture mechanics principles
to analyze cracking in asphalt concrete (with
discussion)”, Journal of the Association of Asphalt
Paving Technology, 65, 1-35.
Khavandi Khiavi, A., Naghiloo, M. and Rasouli, R.
(2019). "Considering a new sample unit definition
for Pavement condition index", Civil Engineering
Infrastructure Journal, 52(1), 101-114.
Kim, S.M., Darabi, M.K., Little, D.N. and Al-Rub,
R.K.A. (2018). “Effect of the realistic tire contact
pressure on the rutting performance of asphaltic
concrete pavements”, KSCE Journal of Civil
Engineering, 22(6), 2138-2146.
Ling, M., Luo, X., Gu, F. and Lytton, R.L. (2017). “An
inverse approach to determine complex modulus
gradient of field-aged asphalt mixtures”, Materials
and Structures, 50(2), 138.
Machemehl, R.B., Wang, F. and Prozzi, J.A. (2005).
“Analytical study of effects of truck tire pressure
on pavements using measured tire-pavement
contact stress data”, Proceedings for the 84th TRB
Annual Meeting, Transportation Research Board,
Washington DC, January 9-13.
Mahoney, J.P., Winters, B.C., Chatti, K., Moran, T.J.,
Monismith, C.L. and Kramer, S.L. (1995).
Vehicle/pavement interaction at the PACCAR test
site, Final Report No. WA-RD 384.1, Washington
State Department of Transportation, Olympia,
Washington, November.
Marshek, K.M., Hudson, W.R., Connell, R.B., Chen,
H.H. and Saraf, C.L. (1985). Experimental
investigation of truck tire inflation pressure on
pavement-tire contact area and pressure
distribution, Research Report 386-1, Center for
Transportation Research, the University of Texas
at Austin.
Modarres, A. and Shabani, H. (2015). “Investigating
the effect of aircraft impact loading on the
longitudinal top-down crack propagation
parameters in asphalt runway pavement using
fracture mechanics”, Engineering Fracture
Mechanics, 150, 28-46.
NCHRP. (2004). Guide for mechanistic-empirical
design of new and rehabilitated pavements
structures, Final Report, Part 3: Design Analysis.
National Cooperative Highway Research Program,
Washington, D.C.
Owende, P.M.O., Hartman, A.M., Ward, S.M.,
Gilchrist, M.D. and O'Mahony, M.J. (2001).
“Minimizing distress on flexible pavements using
variable tire pressure”, ASCE Journal of
Transportation Engineering, 127, 254-262
Prozzi, J.A. and Luo, R. (2005). Quantification of the
Joint Effect of Wheel Load and Tire Inflation
Pressure on Pavement Response, TRB Annual
Meeting, Transportation Research Board,
Washington D.C., January.
Rahman M.T., Mahmud K. and Ahsan, S. (2011).
"Stress strain characteristics of flexible pavement
using Finite Element analysis", International
Journal of Civil and Structural Engineering, 2(1),
352-364.
Rahman, M.M., Saha, S., Hamdi, A.S.A. and Alam,
M.J.B. (2019). “Development of 3-D Finite
Element models for geo-jute reinforced flexible
pavement”, Civil Engineering Journal, 5, 437-446.
Sun, L. and Duan, Y. (2013). "Dynamic response of
top-down cracked asphalt concrete pavement under
a half-sinusoidal impact load", Acta Mechanica,
224(8), 1865-1877.
Sun, L. and Hudson, W.R. (2005). “Probabilistic
approaches for pavement fatigue cracking
prediction based on cumulative damage using
Miner’s law”, Journal of Engineering Mechanics,
131(5), 546-549.
Taherkhani, H. and Arshadi, M.R. (2018).
“Investigating the creep properties of PET-
modified asphalt concrete", Civil Engineering
Infrastructure Journal, 51(2), 277-292.
Taherkhani, H. and Jalali, M. (2018). “Viscoelastic
analysis of geogrid-reinforced asphaltic pavement

Civil Engineering Infrastructures Journal, 53(1): 33 – 51, June 2020
51
under different tire configurations”, International
Journal of Geomechanics, 18(7), 04018060.
Wang, F. and Machemehl, R.B. (2006). “Mechanistic-
empirical study of effects of truck tire pressure on
pavement using measured tire-pavement contact
stress data”, 85th TRB Annual Meeting,
Transportation Research Board, Washington D.C.,
January.
Wu, S., Wen, H., Zhang, W., Shen, S., Mohammad, L.
N., Faheem, A. and Muhunthan, B. (2019). “Field
performance of top-down fatigue cracking for
warm mix asphalt pavements”, International
Journal of Pavement Engineering, 20(1), 33-43.
Zheng, C. and Xie, S. (2003). "Effects of the tire-
pavement contact pressure on asphalt pavement",
Proceedings of the Eastern Asia Society for
Transportation Studies, 4, 401-407.
Zhao, Y., Alae, M. and Fu, G. (2018). “Investigation
of mechanisms of top-down fatigue cracking of
asphalt pavement”, Road Materials and Pavement
Design, 19(6), 1436-1447.