Embed Size (px)
Citation preview

Investigating sailing styles and boat set-up on the performance of a hydrofoiling Moth dinghy
M W Findlay, S R Turnock
Fluid-Structure Interactions Research Group, School of Engineering Sciences, University of Southampton, UK
Email: [email protected] , [email protected] Abstract The adoption of hydrofoils in the International Moth class of dinghy has posed new challenges to sailors both in terms of the set-up of the boat and hydrofoils, and their sailing techniques and styles. The experience of sailors in the class indicates that the height above the water surface at which the boat is flown (ride height) and the amount of windward heel (heel angle) are critical factors affecting performance, particularly in upwind sailing. The fore-aft position of the helm affects the stability of the craft and, in conjunction with the aft foil settings, alters the pitch orientation of the craft and offers potential for significant gains in performance. A four degree of freedom velocity prediction programme (VPP) with the capability to investigate these factors is presented and used to demonstrate how the fore-aft position of the helm and the aft foil may be used in conjunction to maximise speed. Nomenclature α Incident flow angle [rad] c Chord of foil [m]
XCB∂
Movement of centre of buoyancy in X-direction
[m] D Drag [N]
α∂∂ LC
Lift-curve slope of foil [rad
-
1]
SprayD Spray drag [N]
ZYX
i
,,∆
Distance along X, Y, or Z-axis, between centre of effort of i
th component of
force and centre of mass of craft
[m] WD Drag due to windage [N]
airρ Density of air [kgm-
3]
e Oswald efficiency factor [-]
ρ Density of water [kgm-
3]
ZYX
iF,,
Force in X, Y, or Z-direction, acting on i
th
component
[N]
Hθ Heel angle [deg] I Moment of Inertia of craft about centre of mass
[kgm
2]
Pθ Pitch angle [deg] L Length [m]
AR Geometric Aspect ratio [-] L Lift [N]
DC Coefficient of drag [-] M Total mass [kg]
iDC Coefficient of induced
drag [-] S Area of foil [m
2
]
pDC Coefficient of profile drag [-] t Thickness of foil [m]
DsprayC Coefficient of spray drag [-] av Apparent wind speed [m/
s]
LC Coefficient of lift [-] ZYXv ,, Craft speed in X, Y, or Z-
direction [m/
s]
WPC Coefficient of waterplane area
[-] W Total weight of craft and crew
[N]
z Vertical distance between craft centre of mass and water surface
[m]
1 Introduction
Hydrofoils are lifting surfaces fitted to marine craft that act at speed to partially or fully lift the main body of the craft clear of the water with the aim of reducing total drag at speed and therefore offers potential for an increased top speed. The practical application of hydrofoils to sailing craft is difficult for two main reasons [1]. Firstly, the power to weight ratio of most sailing boats is relatively low because of the need to carry ballast in order to provide righting moment against the heeling moment from the sails. This generally limits the application of hydrofoils to catamarans and dinghies which can extend the crew weight on racks or trapezes to provide the necessary righting moment. Secondly, the operating speed of sailing craft is highly variable, being a function of apparent wind speed and direction, and so the use of hydrofoils is also largely a problem of developing suitable control systems to account for these fluctuations. Nevertheless, since 2005, hydrofoil-equipped International Moth dinghies have won every major championship [2] demonstrating that in this class hydrofoils can be used successfully in a large enough range of conditions to consistently win regattas against non hydrofoil-equipped craft from the same class. The impressive speed of these craft (top recorded speed close to 30 knots [3]) has caused an explosion in interest from both sailors and the sailing media and development has taken place at a rapid pace – posing many interesting challenges to both designers and sailors. The major aims of this paper are to give an overview of the International Moth dinghy (section 2), present a new velocity prediction program (VPP) for the Moth (section 3) and use the VPP to look specifically at the influence of aft foil setting and helm longitudinal centre of gravity (LCG) on performance (section 4.)
2 The International Moth Dinghy
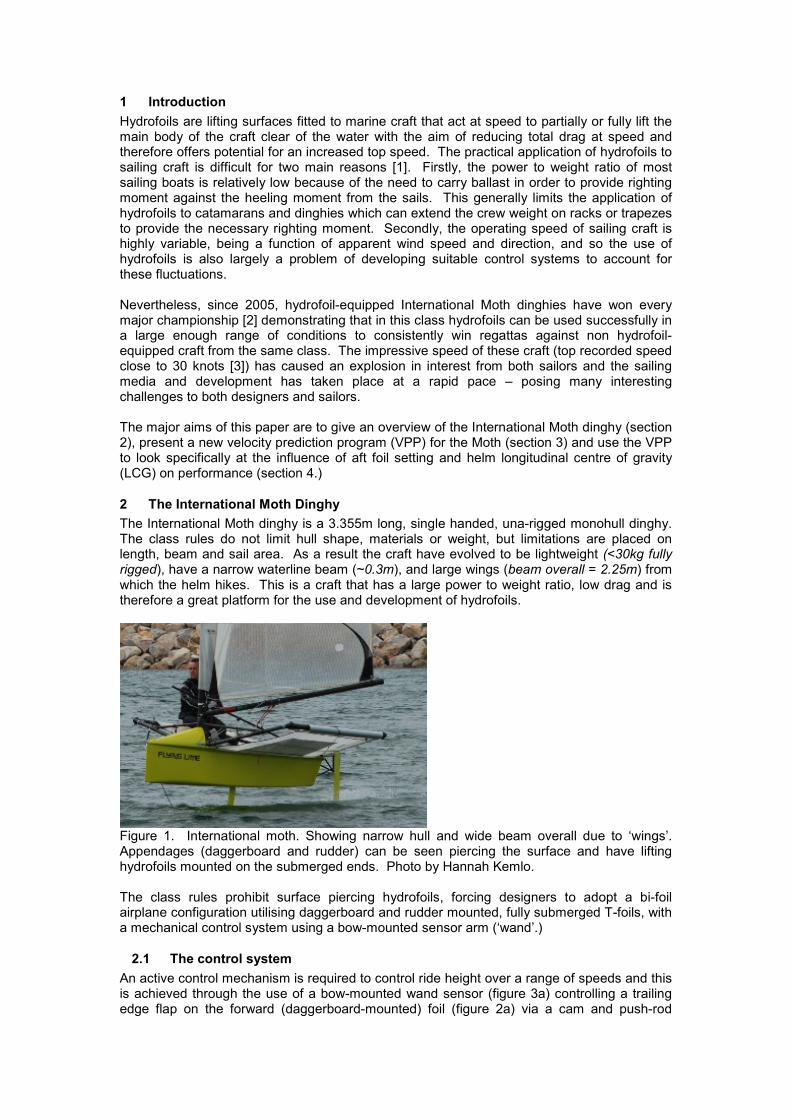
The International Moth dinghy is a 3.355m long, single handed, una-rigged monohull dinghy. The class rules do not limit hull shape, materials or weight, but limitations are placed on length, beam and sail area. As a result the craft have evolved to be lightweight (<30kg fully rigged), have a narrow waterline beam (~0.3m), and large wings (beam overall = 2.25m) from which the helm hikes. This is a craft that has a large power to weight ratio, low drag and is therefore a great platform for the use and development of hydrofoils.
Figure 1. International moth. Showing narrow hull and wide beam overall due to ‘wings’. Appendages (daggerboard and rudder) can be seen piercing the surface and have lifting hydrofoils mounted on the submerged ends. Photo by Hannah Kemlo. The class rules prohibit surface piercing hydrofoils, forcing designers to adopt a bi-foil airplane configuration utilising daggerboard and rudder mounted, fully submerged T-foils, with a mechanical control system using a bow-mounted sensor arm (‘wand’.)
2.1 The control system
An active control mechanism is required to control ride height over a range of speeds and this is achieved through the use of a bow-mounted wand sensor (figure 3a) controlling a trailing edge flap on the forward (daggerboard-mounted) foil (figure 2a) via a cam and push-rod
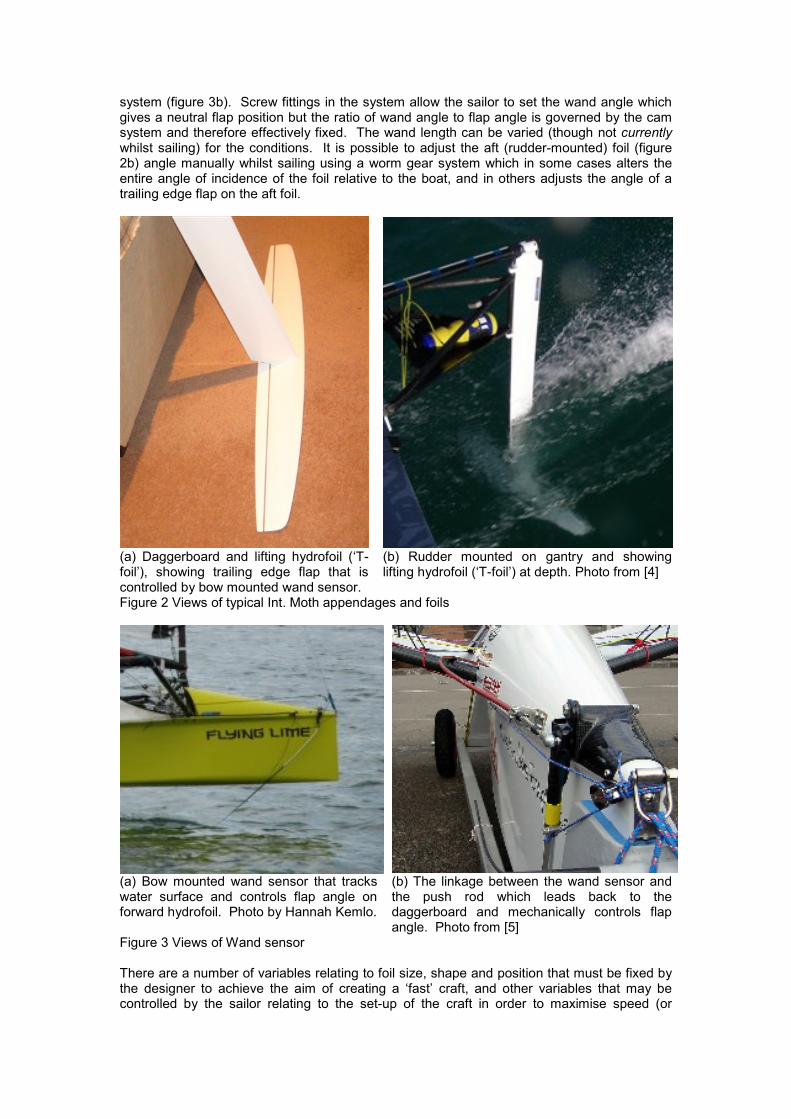
system (figure 3b). Screw fittings in the system allow the sailor to set the wand angle which gives a neutral flap position but the ratio of wand angle to flap angle is governed by the cam system and therefore effectively fixed. The wand length can be varied (though not currently whilst sailing) for the conditions. It is possible to adjust the aft (rudder-mounted) foil (figure 2b) angle manually whilst sailing using a worm gear system which in some cases alters the entire angle of incidence of the foil relative to the boat, and in others adjusts the angle of a trailing edge flap on the aft foil.
(a) Daggerboard and lifting hydrofoil (‘T-foil’), showing trailing edge flap that is controlled by bow mounted wand sensor.
(b) Rudder mounted on gantry and showing lifting hydrofoil (‘T-foil’) at depth. Photo from [4]
Figure 2 Views of typical Int. Moth appendages and foils
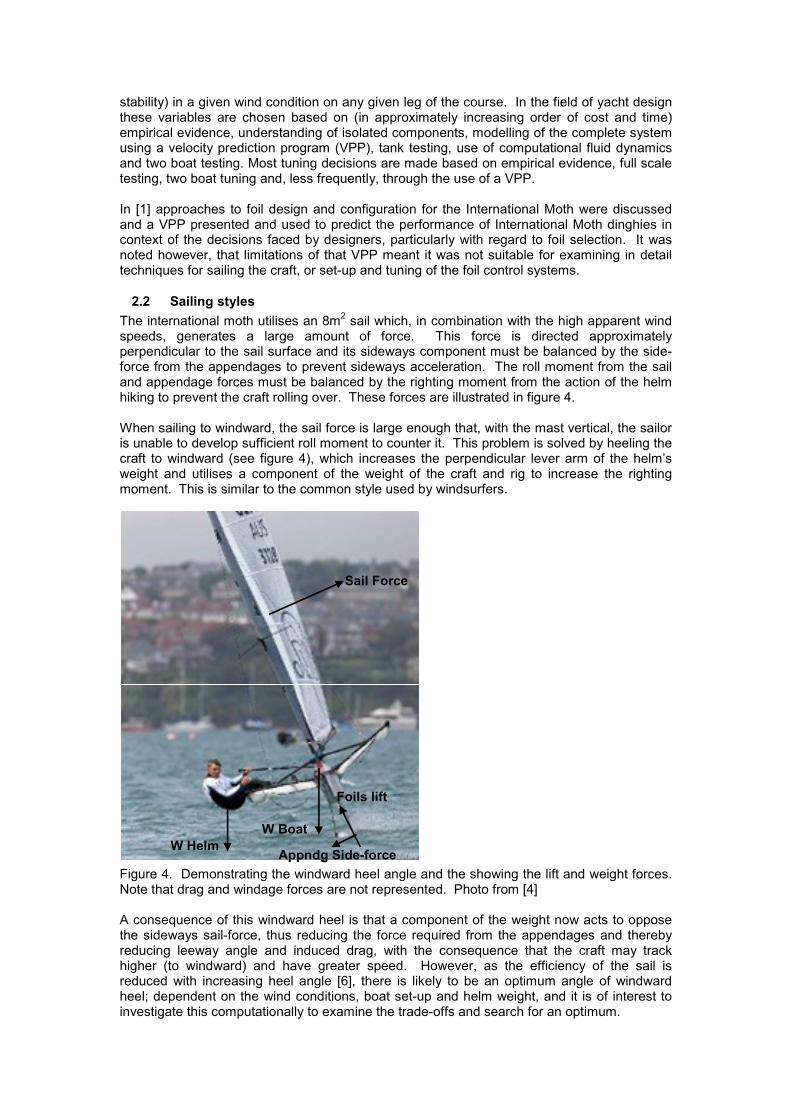
(a) Bow mounted wand sensor that tracks water surface and controls flap angle on forward hydrofoil. Photo by Hannah Kemlo.
(b) The linkage between the wand sensor and the push rod which leads back to the daggerboard and mechanically controls flap angle. Photo from [5]
Figure 3 Views of Wand sensor There are a number of variables relating to foil size, shape and position that must be fixed by the designer to achieve the aim of creating a ‘fast’ craft, and other variables that may be controlled by the sailor relating to the set-up of the craft in order to maximise speed (or
stability) in a given wind condition on any given leg of the course. In the field of yacht design these variables are chosen based on (in approximately increasing order of cost and time) empirical evidence, understanding of isolated components, modelling of the complete system using a velocity prediction program (VPP), tank testing, use of computational fluid dynamics and two boat testing. Most tuning decisions are made based on empirical evidence, full scale testing, two boat tuning and, less frequently, through the use of a VPP. In [1] approaches to foil design and configuration for the International Moth were discussed and a VPP presented and used to predict the performance of International Moth dinghies in context of the decisions faced by designers, particularly with regard to foil selection. It was noted however, that limitations of that VPP meant it was not suitable for examining in detail techniques for sailing the craft, or set-up and tuning of the foil control systems.
2.2 Sailing styles
The international moth utilises an 8m2 sail which, in combination with the high apparent wind
speeds, generates a large amount of force. This force is directed approximately perpendicular to the sail surface and its sideways component must be balanced by the side-force from the appendages to prevent sideways acceleration. The roll moment from the sail and appendage forces must be balanced by the righting moment from the action of the helm hiking to prevent the craft rolling over. These forces are illustrated in figure 4. When sailing to windward, the sail force is large enough that, with the mast vertical, the sailor is unable to develop sufficient roll moment to counter it. This problem is solved by heeling the craft to windward (see figure 4), which increases the perpendicular lever arm of the helm’s weight and utilises a component of the weight of the craft and rig to increase the righting moment. This is similar to the common style used by windsurfers.
W Helm
W Boat
Sail Force
Appndg Side-force
Foils lift
W Helm
W Boat
Sail Force
Appndg Side-force
Foils lift
Figure 4. Demonstrating the windward heel angle and the showing the lift and weight forces. Note that drag and windage forces are not represented. Photo from [4] A consequence of this windward heel is that a component of the weight now acts to oppose the sideways sail-force, thus reducing the force required from the appendages and thereby reducing leeway angle and induced drag, with the consequence that the craft may track higher (to windward) and have greater speed. However, as the efficiency of the sail is reduced with increasing heel angle [6], there is likely to be an optimum angle of windward heel; dependent on the wind conditions, boat set-up and helm weight, and it is of interest to investigate this computationally to examine the trade-offs and search for an optimum.

In setting up the boat the sailor also controls whether the craft flies higher (‘riding high’) or lower on the foils. Combined with windward heel, ‘riding high’ may have a positive effect by increasing the lever arm over which the weight of the craft acts to provide righting moment, yet there is also an increase in the lever arm by which the sail force acts to oppose righting moment, and the payoff between the two must depend at least partially on the windward heel angle. Increased ride height also decreases stability, making the craft harder to sail, and increases the risk of foil ventilation – which may be catastrophic. Again a trade-off must be made and it is of interest to examine the behaviour of the system. Affecting the forces on the lifting foils, rather than the sail force and righting moment, the fore-aft position of the helm, in conjunction with aft foil settings, are known to affect the stability, pitch orientation and speed of the craft. At the 2008 International Moth world championships in Weymouth, the Australian sailors demonstrated superior upwind speed in the stronger winds by flying high and with a bow down orientation. Another area of great interest is therefore in investigating why this orientation was faster than the traditional set-up used by the European competitors who used essentially the same equipment.
3 Development of the VPP
There are many questions regarding the set-up of the International Moth, and those associated with the optimal foil settings and sailing styles are motivating factors towards developing a computational simulation of the craft. In this paper a new VPP is presented in which the craft is free in four degrees of freedom and may be used to examine the influence of hydrofoil set-up and sailing styles on performance. The VPP is used to specifically investigate the relationship between fore-aft position of the helm and aft-foil angle and their impact on ride height, pitch orientation (bow-down, bow-up), speed and stability. The results give insight into the progress in boat set-up and sailing styles (particularly for stronger winds) made by Australian sailors, using essentially the same equipment as their European counterparts, demonstrated at the 2008 World Championships [7].
3.1 Overview
The VPP replicates the geometry of the International Moth (crucially the wand-foil system) and aims to find the stable ride-height, velocity and pitch orientation at which the craft converges for a given boat set-up and true wind condition. This is achieved by quasi-steady calculation of fluid and weight forces to accelerate the craft from rest through displacement sailing, take-off and ultimately stable flight. The result of interest is the steady motion of the craft and the design of the VPP reflects this by adopting rudimentary but sufficient models of hull-related forces (which are zero when foil-borne) and using a damping factor approach to account for added mass. This does not affect the final solution but may affect the acceleration of the craft. Nevertheless the time-related motion of the boat is predicted and is of interest because it indicates the stability of the set-up. Comparison of the predicted motion with video footage of a Moth accelerating from rest shows that the time-scales of the acceleration (onto the foils and up to full speed) are similar. The VPP constrains the craft’s yaw and roll motions but leaves it free to move in all other dimensions (surge, sway, heave and pitch.) Any heel angle can be specified in order to look at the effects of windward heel and other model inputs include aft foil setting and helm LCG. The dimensions of the Moth dinghy used in the simulation are those of the ‘Flying Lime’ (figure 1), a Fastacraft built ‘Prowler’ design of International Moth, which is available for measurement and future validation trials. Foil settings are determined from the geometry of the wand system and its position relative to the water surface, as in the real craft. Sail drive force is maximised under the constraint that heeling moment may not exceed the maximum righting moment and standard aerodynamic empirical formulae are used to find the lift and drag forces acting on the craft, which are resolved into the body axis system and govern its behaviour. The simulation is coded in Matlab™ and uses a one step solver based on an explicit Runge-Kutta formula using a variable step size based on derivatives and error tolerance criteria. One 60s simulation can take between 20s and 2 hours to run on a modern desktop PC depending on the number of iterations to achieve convergence at each step.
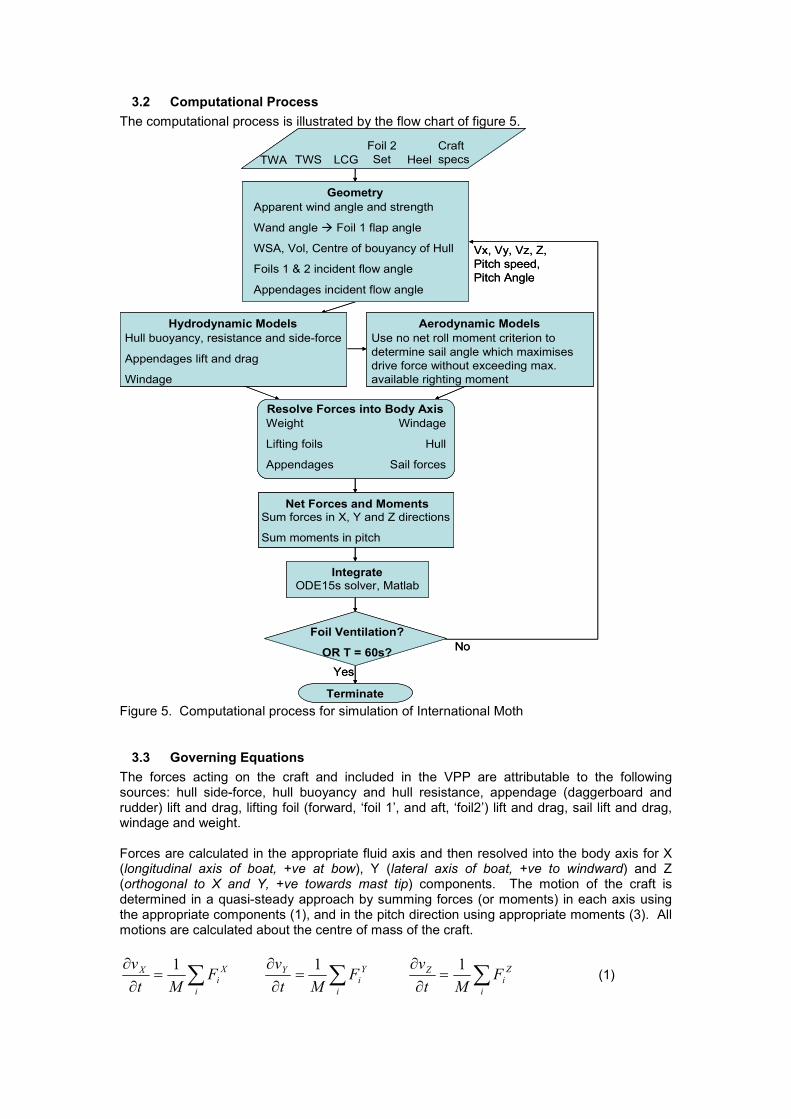
3.2 Computational Process
The computational process is illustrated by the flow chart of figure 5.
Vx, Vy, Vz, Z,
Pitch speed,
Pitch Angle
TWA TWS
Foil 2
SetLCG Heel
Craft
specs
Apparent wind angle and strength
Wand angle � Foil 1 flap angle
WSA, Vol, Centre of bouyancy of Hull
Foils 1 & 2 incident flow angle
Appendages incident flow angle
Geometry
Hull buoyancy, resistance and side-force
Appendages lift and drag
Windage
Hydrodynamic Models
Resolve Forces into Body Axis
Weight
Lifting foils
Appendages
Windage
Hull
Sail forces
Use no net roll moment criterion to
determine sail angle which maximises
drive force without exceeding max.
available righting moment
Aerodynamic Models
Sum forces in X, Y and Z directions
Sum moments in pitch
Net Forces and Moments
ODE15s solver, MatlabIntegrate
Foil Ventilation?
OR T = 60s?
Terminate
Yes
No
Vx, Vy, Vz, Z,
Pitch speed,
Pitch Angle
TWA TWS
Foil 2
SetLCG Heel
Craft
specsTWA TWS
Foil 2
SetLCG Heel
Craft
specs
Apparent wind angle and strength
Wand angle � Foil 1 flap angle
WSA, Vol, Centre of bouyancy of Hull
Foils 1 & 2 incident flow angle
Appendages incident flow angle
Geometry
Apparent wind angle and strength
Wand angle � Foil 1 flap angle
WSA, Vol, Centre of bouyancy of Hull
Foils 1 & 2 incident flow angle
Appendages incident flow angle
Geometry
Hull buoyancy, resistance and side-force
Appendages lift and drag
Windage
Hydrodynamic Models
Hull buoyancy, resistance and side-force
Appendages lift and drag
Windage
Hydrodynamic Models
Resolve Forces into Body Axis
Weight
Lifting foils
Appendages
Windage
Hull
Sail forces
Resolve Forces into Body Axis
Weight
Lifting foils
Appendages
Windage
Hull
Sail forces
Use no net roll moment criterion to
determine sail angle which maximises
drive force without exceeding max.
available righting moment
Aerodynamic Models
Use no net roll moment criterion to
determine sail angle which maximises
drive force without exceeding max.
available righting moment
Aerodynamic Models
Sum forces in X, Y and Z directions
Sum moments in pitch
Net Forces and MomentsSum forces in X, Y and Z directions
Sum moments in pitch
Net Forces and Moments
ODE15s solver, MatlabIntegrate
Foil Ventilation?
OR T = 60s?
Terminate
Yes
No
Figure 5. Computational process for simulation of International Moth
3.3 Governing Equations
The forces acting on the craft and included in the VPP are attributable to the following sources: hull side-force, hull buoyancy and hull resistance, appendage (daggerboard and rudder) lift and drag, lifting foil (forward, ‘foil 1’, and aft, ‘foil2’) lift and drag, sail lift and drag, windage and weight. Forces are calculated in the appropriate fluid axis and then resolved into the body axis for X (longitudinal axis of boat, +ve at bow), Y (lateral axis of boat, +ve to windward) and Z (orthogonal to X and Y, +ve towards mast tip) components. The motion of the craft is determined in a quasi-steady approach by summing forces (or moments) in each axis using the appropriate components (1), and in the pitch direction using appropriate moments (3). All motions are calculated about the centre of mass of the craft.
∑=∂
∂
i
X
i
X FMt
v 1 ∑=
∂
∂
i
Y
i
Y FMt
v 1 ∑=
∂
∂
i
Z
i
Z FMt
v 1 (1)
Zvt
z=
∂∂
(2)
)(1
2Z
i
X
i
i
X
i
Z
i
P FFIt
∆+∆=∂
∂∑
θ (3)
5
2ML
I = (4)
0)( =∆+∆∑ Y
i
Z
i
i
Z
i
Y
i FF (5)
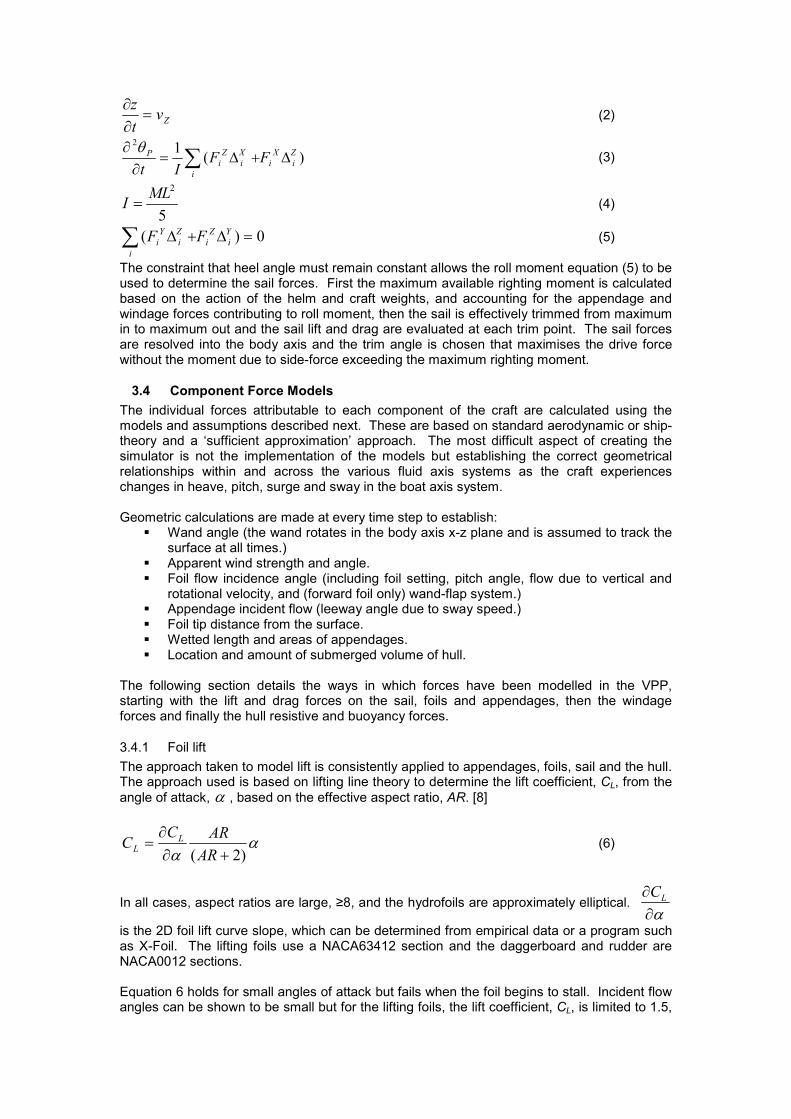
The constraint that heel angle must remain constant allows the roll moment equation (5) to be used to determine the sail forces. First the maximum available righting moment is calculated based on the action of the helm and craft weights, and accounting for the appendage and windage forces contributing to roll moment, then the sail is effectively trimmed from maximum in to maximum out and the sail lift and drag are evaluated at each trim point. The sail forces are resolved into the body axis and the trim angle is chosen that maximises the drive force without the moment due to side-force exceeding the maximum righting moment.
3.4 Component Force Models
The individual forces attributable to each component of the craft are calculated using the models and assumptions described next. These are based on standard aerodynamic or ship-theory and a ‘sufficient approximation’ approach. The most difficult aspect of creating the simulator is not the implementation of the models but establishing the correct geometrical relationships within and across the various fluid axis systems as the craft experiences changes in heave, pitch, surge and sway in the boat axis system. Geometric calculations are made at every time step to establish:
� Wand angle (the wand rotates in the body axis x-z plane and is assumed to track the surface at all times.)
� Apparent wind strength and angle. � Foil flow incidence angle (including foil setting, pitch angle, flow due to vertical and
rotational velocity, and (forward foil only) wand-flap system.) � Appendage incident flow (leeway angle due to sway speed.) � Foil tip distance from the surface. � Wetted length and areas of appendages. � Location and amount of submerged volume of hull.
The following section details the ways in which forces have been modelled in the VPP, starting with the lift and drag forces on the sail, foils and appendages, then the windage forces and finally the hull resistive and buoyancy forces.
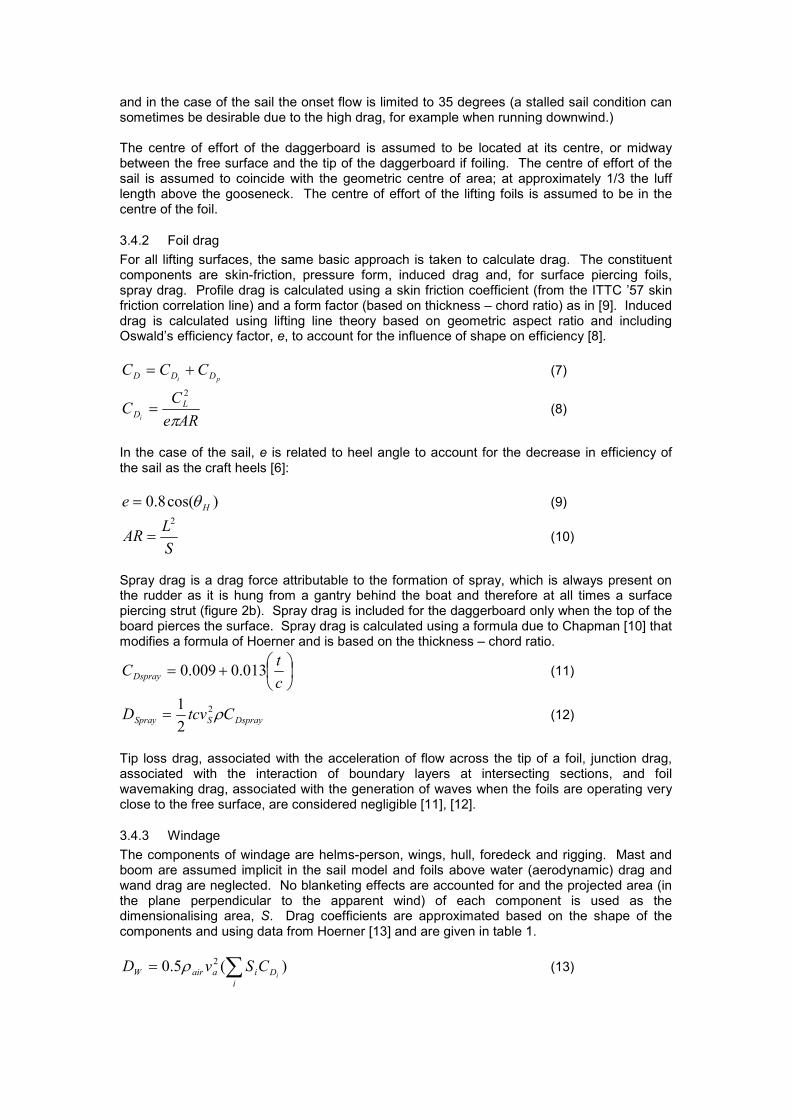
3.4.1 Foil lift
The approach taken to model lift is consistently applied to appendages, foils, sail and the hull. The approach used is based on lifting line theory to determine the lift coefficient, CL, from the
angle of attack, α , based on the effective aspect ratio, AR. [8]
αα )2( +∂
∂=
AR
ARCC L
L (6)
In all cases, aspect ratios are large, ≥8, and the hydrofoils are approximately elliptical. α∂
∂ LC
is the 2D foil lift curve slope, which can be determined from empirical data or a program such as X-Foil. The lifting foils use a NACA63412 section and the daggerboard and rudder are NACA0012 sections. Equation 6 holds for small angles of attack but fails when the foil begins to stall. Incident flow angles can be shown to be small but for the lifting foils, the lift coefficient, CL, is limited to 1.5,
and in the case of the sail the onset flow is limited to 35 degrees (a stalled sail condition can sometimes be desirable due to the high drag, for example when running downwind.) The centre of effort of the daggerboard is assumed to be located at its centre, or midway between the free surface and the tip of the daggerboard if foiling. The centre of effort of the sail is assumed to coincide with the geometric centre of area; at approximately 1/3 the luff length above the gooseneck. The centre of effort of the lifting foils is assumed to be in the centre of the foil.
3.4.2 Foil drag
For all lifting surfaces, the same basic approach is taken to calculate drag. The constituent components are skin-friction, pressure form, induced drag and, for surface piercing foils, spray drag. Profile drag is calculated using a skin friction coefficient (from the ITTC ’57 skin friction correlation line) and a form factor (based on thickness – chord ratio) as in [9]. Induced drag is calculated using lifting line theory based on geometric aspect ratio and including Oswald’s efficiency factor, e, to account for the influence of shape on efficiency [8].
pi DDD CCC += (7)
ARe
CC L
Di π
2
= (8)
In the case of the sail, e is related to heel angle to account for the decrease in efficiency of the sail as the craft heels [6]:
)cos(8.0 He θ= (9)
S
LAR
2
= (10)
Spray drag is a drag force attributable to the formation of spray, which is always present on the rudder as it is hung from a gantry behind the boat and therefore at all times a surface piercing strut (figure 2b). Spray drag is included for the daggerboard only when the top of the board pierces the surface. Spray drag is calculated using a formula due to Chapman [10] that modifies a formula of Hoerner and is based on the thickness – chord ratio.
+=c
tCDspray 013.0009.0 (11)
DspraySSpray CtcvD ρ22
1= (12)
Tip loss drag, associated with the acceleration of flow across the tip of a foil, junction drag, associated with the interaction of boundary layers at intersecting sections, and foil wavemaking drag, associated with the generation of waves when the foils are operating very close to the free surface, are considered negligible [11], [12].
3.4.3 Windage
The components of windage are helms-person, wings, hull, foredeck and rigging. Mast and boom are assumed implicit in the sail model and foils above water (aerodynamic) drag and wand drag are neglected. No blanketing effects are accounted for and the projected area (in the plane perpendicular to the apparent wind) of each component is used as the dimensionalising area, S. Drag coefficients are approximated based on the shape of the components and using data from Hoerner [13] and are given in table 1.
∑=i
DiaairW iCSvD )(5.0 2ρ (13)
3.4.4 Hull Forces
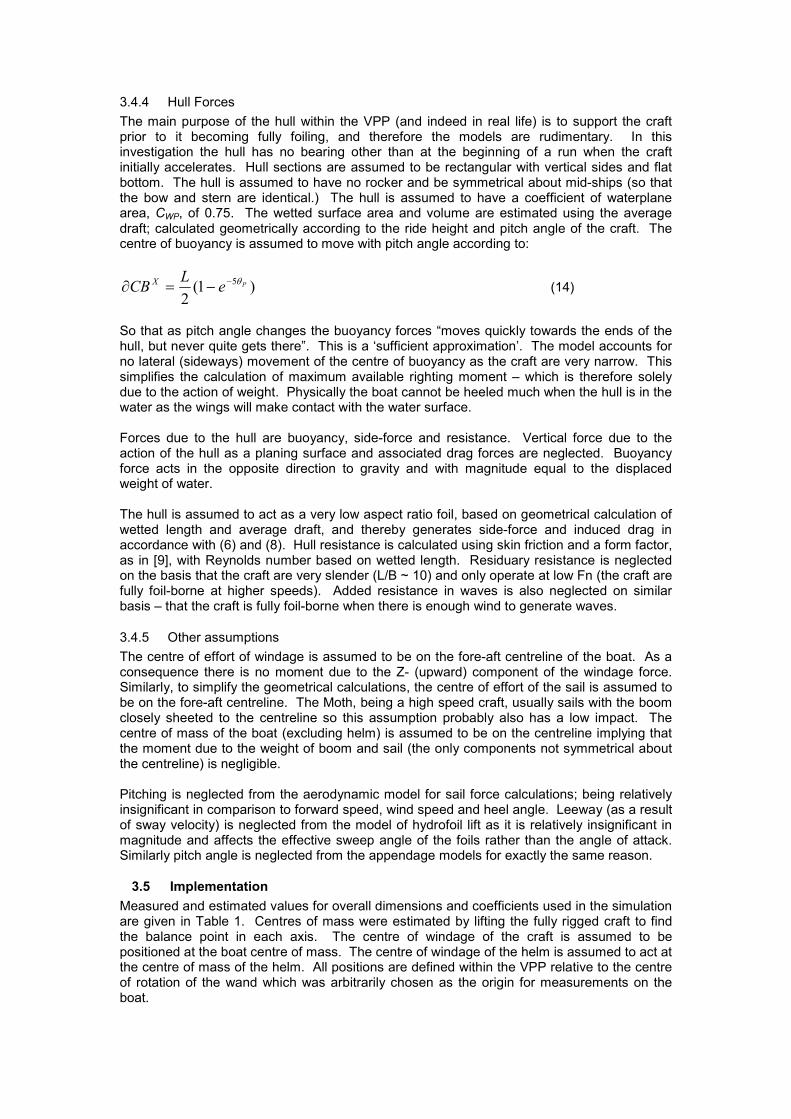
The main purpose of the hull within the VPP (and indeed in real life) is to support the craft prior to it becoming fully foiling, and therefore the models are rudimentary. In this investigation the hull has no bearing other than at the beginning of a run when the craft initially accelerates. Hull sections are assumed to be rectangular with vertical sides and flat bottom. The hull is assumed to have no rocker and be symmetrical about mid-ships (so that the bow and stern are identical.) The hull is assumed to have a coefficient of waterplane area, CWP, of 0.75. The wetted surface area and volume are estimated using the average draft; calculated geometrically according to the ride height and pitch angle of the craft. The centre of buoyancy is assumed to move with pitch angle according to:
)1(2
5 PeL
CBX θ−−=∂ (14)
So that as pitch angle changes the buoyancy forces “moves quickly towards the ends of the hull, but never quite gets there”. This is a ‘sufficient approximation’. The model accounts for no lateral (sideways) movement of the centre of buoyancy as the craft are very narrow. This simplifies the calculation of maximum available righting moment – which is therefore solely due to the action of weight. Physically the boat cannot be heeled much when the hull is in the water as the wings will make contact with the water surface. Forces due to the hull are buoyancy, side-force and resistance. Vertical force due to the action of the hull as a planing surface and associated drag forces are neglected. Buoyancy force acts in the opposite direction to gravity and with magnitude equal to the displaced weight of water. The hull is assumed to act as a very low aspect ratio foil, based on geometrical calculation of wetted length and average draft, and thereby generates side-force and induced drag in accordance with (6) and (8). Hull resistance is calculated using skin friction and a form factor, as in [9], with Reynolds number based on wetted length. Residuary resistance is neglected on the basis that the craft are very slender (L/B ~ 10) and only operate at low Fn (the craft are fully foil-borne at higher speeds). Added resistance in waves is also neglected on similar basis – that the craft is fully foil-borne when there is enough wind to generate waves.
3.4.5 Other assumptions
The centre of effort of windage is assumed to be on the fore-aft centreline of the boat. As a consequence there is no moment due to the Z- (upward) component of the windage force. Similarly, to simplify the geometrical calculations, the centre of effort of the sail is assumed to be on the fore-aft centreline. The Moth, being a high speed craft, usually sails with the boom closely sheeted to the centreline so this assumption probably also has a low impact. The centre of mass of the boat (excluding helm) is assumed to be on the centreline implying that the moment due to the weight of boom and sail (the only components not symmetrical about the centreline) is negligible. Pitching is neglected from the aerodynamic model for sail force calculations; being relatively insignificant in comparison to forward speed, wind speed and heel angle. Leeway (as a result of sway velocity) is neglected from the model of hydrofoil lift as it is relatively insignificant in magnitude and affects the effective sweep angle of the foils rather than the angle of attack. Similarly pitch angle is neglected from the appendage models for exactly the same reason.
3.5 Implementation
Measured and estimated values for overall dimensions and coefficients used in the simulation are given in Table 1. Centres of mass were estimated by lifting the fully rigged craft to find the balance point in each axis. The centre of windage of the craft is assumed to be positioned at the boat centre of mass. The centre of windage of the helm is assumed to act at the centre of mass of the helm. All positions are defined within the VPP relative to the centre of rotation of the wand which was arbitrarily chosen as the origin for measurements on the boat.
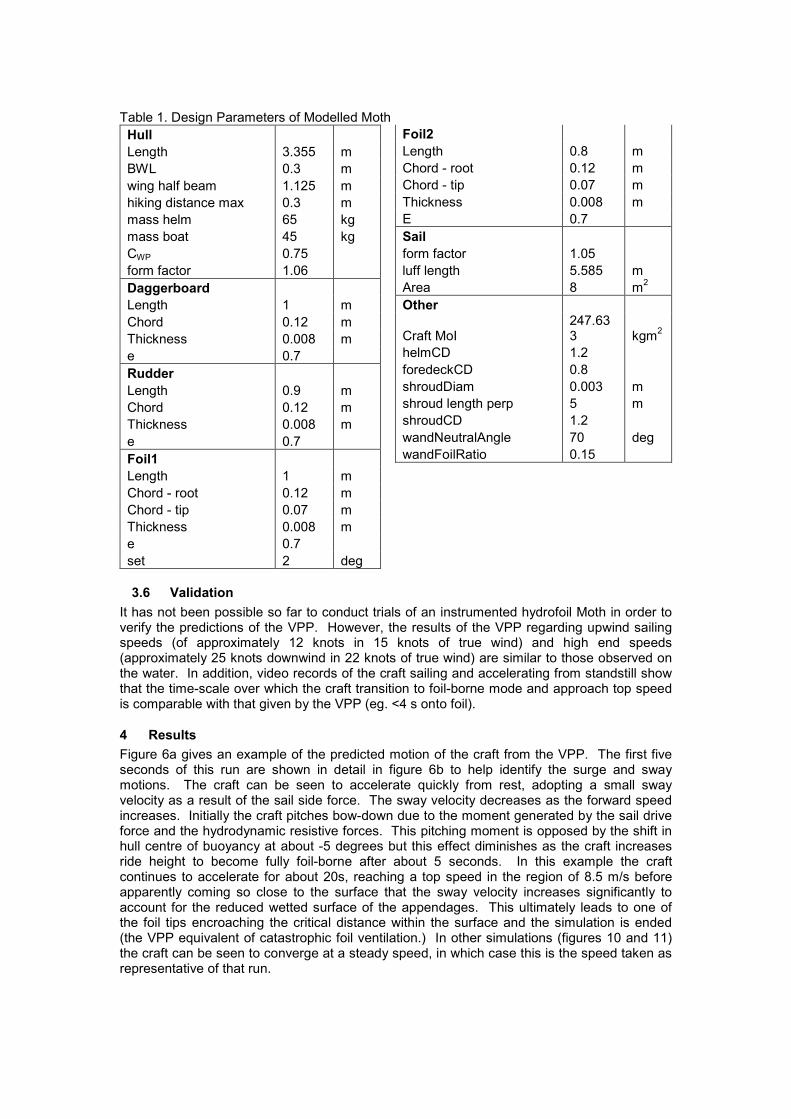
Table 1. Design Parameters of Modelled Moth
Hull
Length 3.355 m
BWL 0.3 m
wing half beam 1.125 m
hiking distance max 0.3 m
mass helm 65 kg
mass boat 45 kg
CWP 0.75
form factor 1.06
Daggerboard
Length 1 m
Chord 0.12 m
Thickness 0.008 m
e 0.7
Rudder
Length 0.9 m
Chord 0.12 m
Thickness 0.008 m
e 0.7
Foil1
Length 1 m
Chord - root 0.12 m
Chord - tip 0.07 m
Thickness 0.008 m
e 0.7
set 2 deg
Foil2
Length 0.8 m
Chord - root 0.12 m
Chord - tip 0.07 m
Thickness 0.008 m
E 0.7
Sail
form factor 1.05
luff length 5.585 m
Area 8 m2
Other
Craft MoI 247.633 kgm
2
helmCD 1.2
foredeckCD 0.8
shroudDiam 0.003 m
shroud length perp 5 m
shroudCD 1.2
wandNeutralAngle 70 deg
wandFoilRatio 0.15
3.6 Validation
It has not been possible so far to conduct trials of an instrumented hydrofoil Moth in order to verify the predictions of the VPP. However, the results of the VPP regarding upwind sailing speeds (of approximately 12 knots in 15 knots of true wind) and high end speeds (approximately 25 knots downwind in 22 knots of true wind) are similar to those observed on the water. In addition, video records of the craft sailing and accelerating from standstill show that the time-scale over which the craft transition to foil-borne mode and approach top speed is comparable with that given by the VPP (eg. <4 s onto foil).
4 Results
Figure 6a gives an example of the predicted motion of the craft from the VPP. The first five seconds of this run are shown in detail in figure 6b to help identify the surge and sway motions. The craft can be seen to accelerate quickly from rest, adopting a small sway velocity as a result of the sail side force. The sway velocity decreases as the forward speed increases. Initially the craft pitches bow-down due to the moment generated by the sail drive force and the hydrodynamic resistive forces. This pitching moment is opposed by the shift in hull centre of buoyancy at about -5 degrees but this effect diminishes as the craft increases ride height to become fully foil-borne after about 5 seconds. In this example the craft continues to accelerate for about 20s, reaching a top speed in the region of 8.5 m/s before apparently coming so close to the surface that the sway velocity increases significantly to account for the reduced wetted surface of the appendages. This ultimately leads to one of the foil tips encroaching the critical distance within the surface and the simulation is ended (the VPP equivalent of catastrophic foil ventilation.) In other simulations (figures 10 and 11) the craft can be seen to converge at a steady speed, in which case this is the speed taken as representative of that run.

(a) Simulation lasting approx 20s (b) Enlarged view of first 5 seconds Figure 6. Example of VPP Output The particular variables under investigation are the aft foil setting (alpha) and longitudinal position of the weight of the helm (LCG). The range of values for LCG are from 1.6m, which represents the helm sitting as far forward as possible (by the mast), to 3.1m which represents the helm sitting as far back as possible (at the transom.) Aft foil angle is adjustable by a few degrees while sailing but can be set at any particular region by adjustment of the gantry. Initially results were gathered for aft foil angles in the region -9 to +10 degrees, and this showed that the region in which the aft foil is most effective is 6-10 degrees, which is where subsequent efforts were focussed. In order to manage the case study, all variations of alpha and LCG were applied to just one arbitrary wind condition and heel angle: true wind speed of 6 m/s, true wind angle of 120 degrees, and a windward heel angle of 10 degrees. The results of this test matrix are given in table 2. Table 2. Results matrix of simulations. Values are speed in m/s.
Alpha
-9 -6 -3 0 3 4 5 6 7 8 9 10
1.6 3.81 4.29 4.80 5.75 7.10 7.55 7.96 8.28 8.34 8.37 0 0
1.9 3.69 4.07 4.71 5.51 6.92 7.40 7.84 8.20 8.40 8.45 0 0
2.2 3.56 3.88 4.37 5.19 8.32 7.21 7.69 8.09 0 0 0 0
2.5 3.47 3.73 4.11 4.75 0 7.00 7.40 7.95 8.09 0 8.35 0
2.8 3.37 3.58 3.86 4.34 0 0 7.24 8.01 8.18 0 8.34 0
LCG
3.1 3.27 3.43 3.62 3.92 0 0 7.13 8.40 8.50 8.68 8.33 8.00 It can be seen from the table that there are four distinct regions. On the left the configurations which failed to achieve full foiling because the aft foil angle is simply too low. Here the speed is limited to 3 or 4 m/s and an example (LCG = 2.5, aft foil = 0) can be seen in figure 7. The craft initially pitches bow down due to the moments from sail force and resistive forces but this pitch angle is opposed by the longitudinal movement of the centre of buoyancy of the hull (which remains in the water) and the craft settles at a pitch angle of about -0.5 degrees.
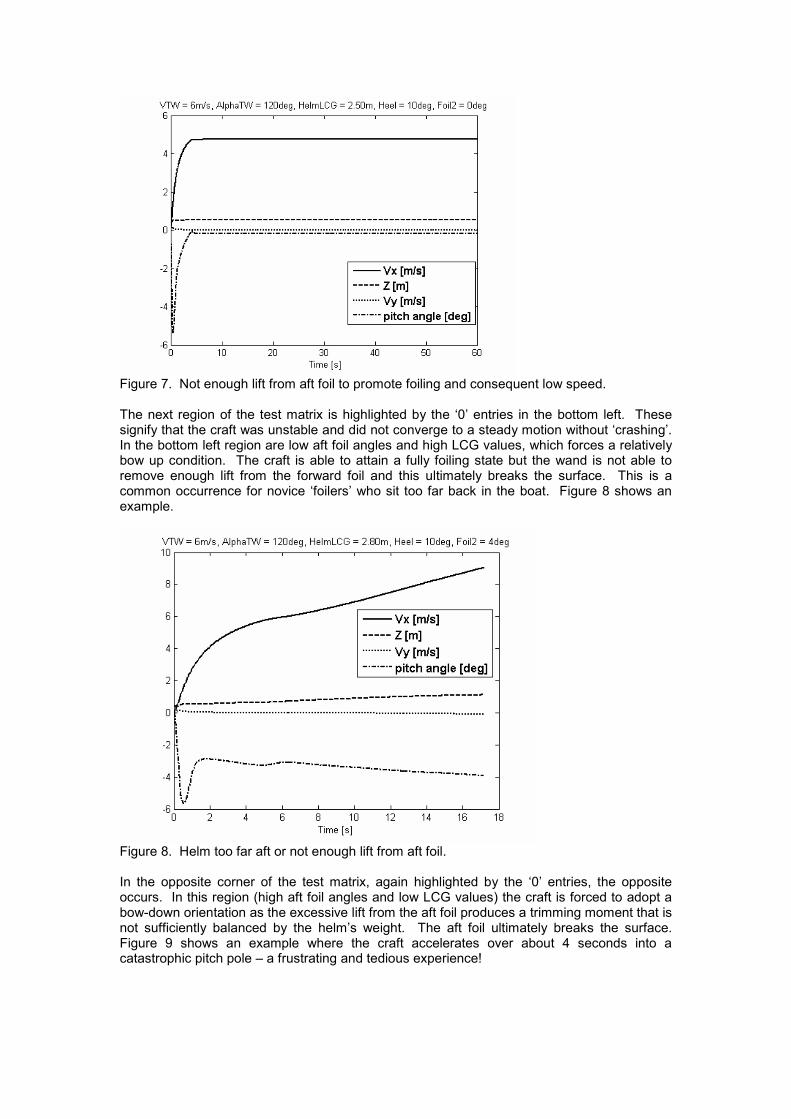
Figure 7. Not enough lift from aft foil to promote foiling and consequent low speed. The next region of the test matrix is highlighted by the ‘0’ entries in the bottom left. These signify that the craft was unstable and did not converge to a steady motion without ‘crashing’. In the bottom left region are low aft foil angles and high LCG values, which forces a relatively bow up condition. The craft is able to attain a fully foiling state but the wand is not able to remove enough lift from the forward foil and this ultimately breaks the surface. This is a common occurrence for novice ‘foilers’ who sit too far back in the boat. Figure 8 shows an example.
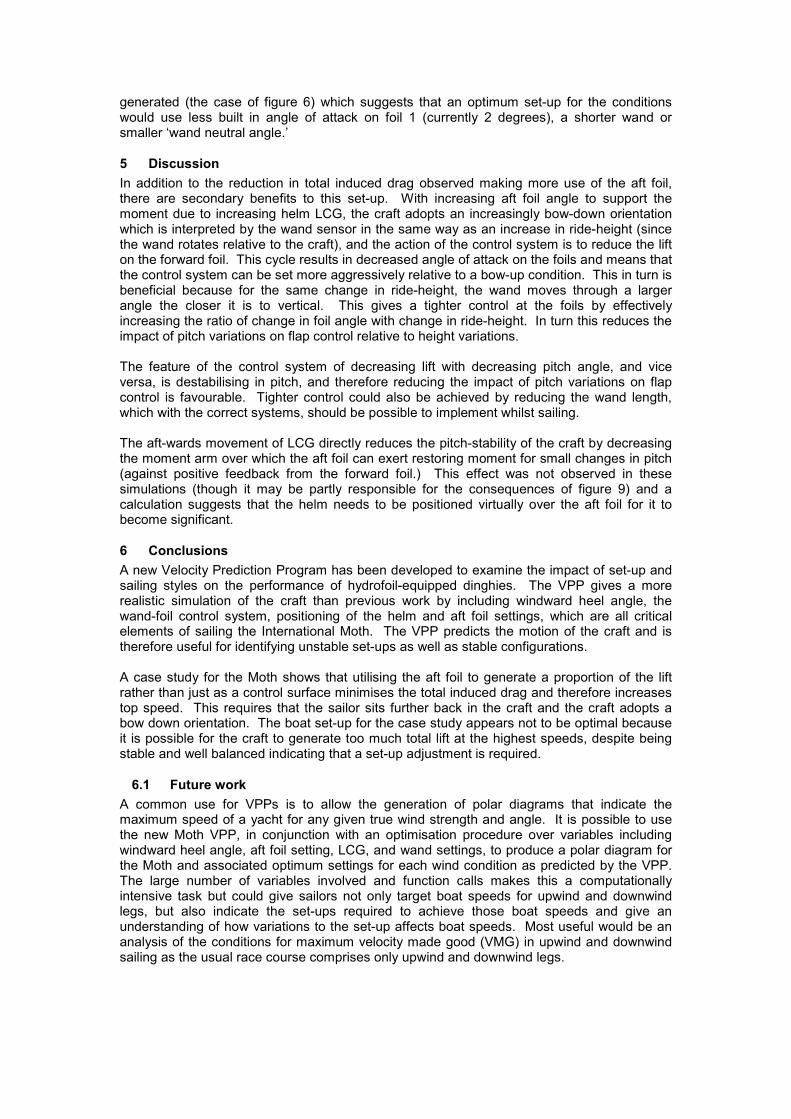
Figure 8. Helm too far aft or not enough lift from aft foil. In the opposite corner of the test matrix, again highlighted by the ‘0’ entries, the opposite occurs. In this region (high aft foil angles and low LCG values) the craft is forced to adopt a bow-down orientation as the excessive lift from the aft foil produces a trimming moment that is not sufficiently balanced by the helm’s weight. The aft foil ultimately breaks the surface. Figure 9 shows an example where the craft accelerates over about 4 seconds into a catastrophic pitch pole – a frustrating and tedious experience!
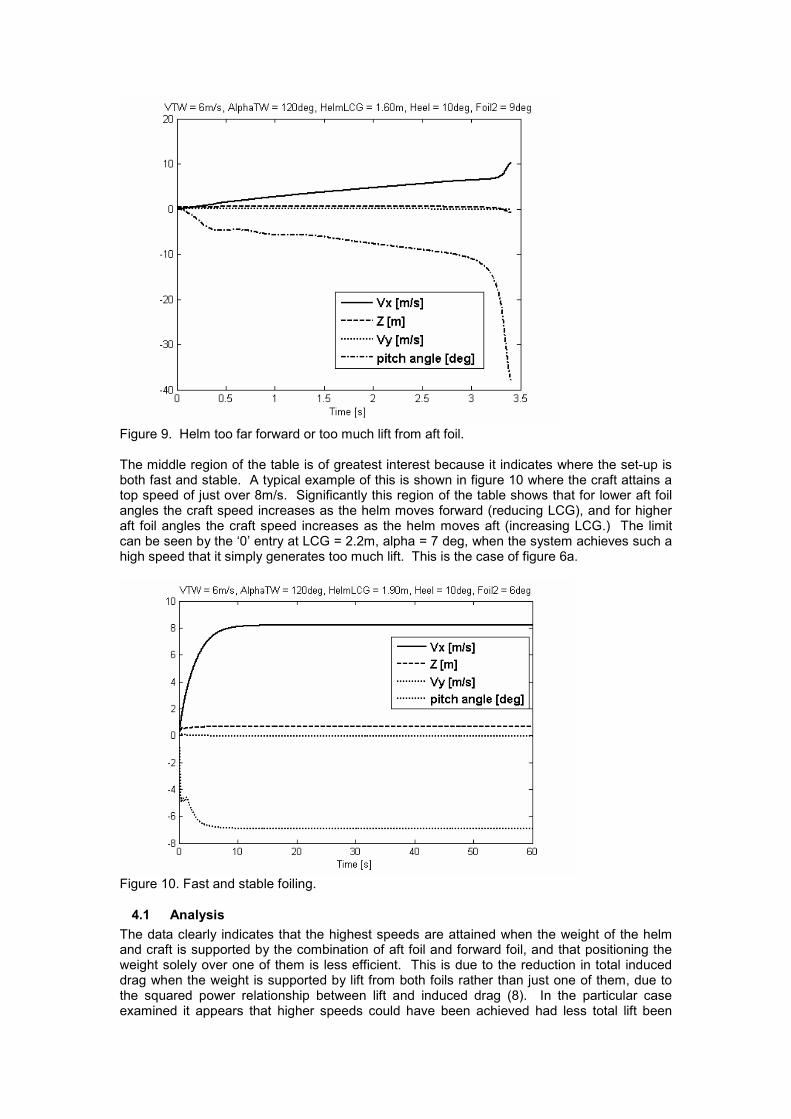
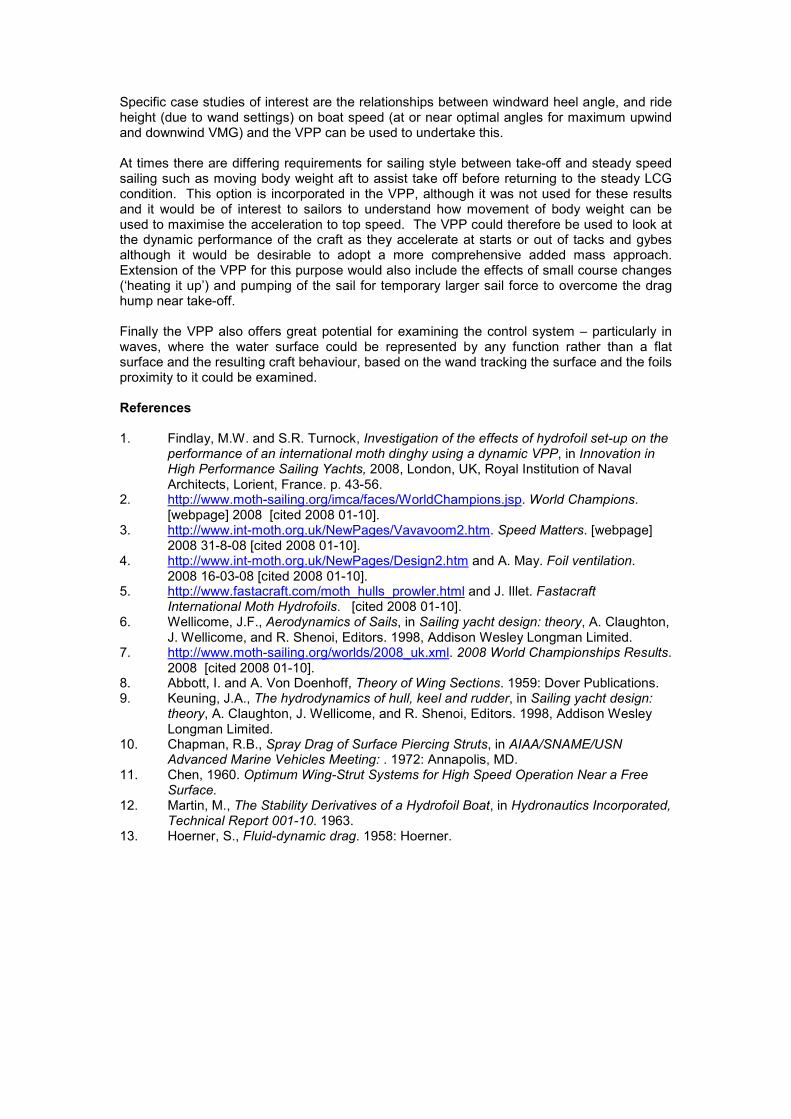
Figure 9. Helm too far forward or too much lift from aft foil. The middle region of the table is of greatest interest because it indicates where the set-up is both fast and stable. A typical example of this is shown in figure 10 where the craft attains a top speed of just over 8m/s. Significantly this region of the table shows that for lower aft foil angles the craft speed increases as the helm moves forward (reducing LCG), and for higher aft foil angles the craft speed increases as the helm moves aft (increasing LCG.) The limit can be seen by the ‘0’ entry at LCG = 2.2m, alpha = 7 deg, when the system achieves such a high speed that it simply generates too much lift. This is the case of figure 6a.
Figure 10. Fast and stable foiling.
4.1 Analysis
The data clearly indicates that the highest speeds are attained when the weight of the helm and craft is supported by the combination of aft foil and forward foil, and that positioning the weight solely over one of them is less efficient. This is due to the reduction in total induced drag when the weight is supported by lift from both foils rather than just one of them, due to the squared power relationship between lift and induced drag (8). In the particular case examined it appears that higher speeds could have been achieved had less total lift been
generated (the case of figure 6) which suggests that an optimum set-up for the conditions would use less built in angle of attack on foil 1 (currently 2 degrees), a shorter wand or smaller ‘wand neutral angle.’
5 Discussion
In addition to the reduction in total induced drag observed making more use of the aft foil, there are secondary benefits to this set-up. With increasing aft foil angle to support the moment due to increasing helm LCG, the craft adopts an increasingly bow-down orientation which is interpreted by the wand sensor in the same way as an increase in ride-height (since the wand rotates relative to the craft), and the action of the control system is to reduce the lift on the forward foil. This cycle results in decreased angle of attack on the foils and means that the control system can be set more aggressively relative to a bow-up condition. This in turn is beneficial because for the same change in ride-height, the wand moves through a larger angle the closer it is to vertical. This gives a tighter control at the foils by effectively increasing the ratio of change in foil angle with change in ride-height. In turn this reduces the impact of pitch variations on flap control relative to height variations. The feature of the control system of decreasing lift with decreasing pitch angle, and vice versa, is destabilising in pitch, and therefore reducing the impact of pitch variations on flap control is favourable. Tighter control could also be achieved by reducing the wand length, which with the correct systems, should be possible to implement whilst sailing. The aft-wards movement of LCG directly reduces the pitch-stability of the craft by decreasing the moment arm over which the aft foil can exert restoring moment for small changes in pitch (against positive feedback from the forward foil.) This effect was not observed in these simulations (though it may be partly responsible for the consequences of figure 9) and a calculation suggests that the helm needs to be positioned virtually over the aft foil for it to become significant.
6 Conclusions
A new Velocity Prediction Program has been developed to examine the impact of set-up and sailing styles on the performance of hydrofoil-equipped dinghies. The VPP gives a more realistic simulation of the craft than previous work by including windward heel angle, the wand-foil control system, positioning of the helm and aft foil settings, which are all critical elements of sailing the International Moth. The VPP predicts the motion of the craft and is therefore useful for identifying unstable set-ups as well as stable configurations. A case study for the Moth shows that utilising the aft foil to generate a proportion of the lift rather than just as a control surface minimises the total induced drag and therefore increases top speed. This requires that the sailor sits further back in the craft and the craft adopts a bow down orientation. The boat set-up for the case study appears not to be optimal because it is possible for the craft to generate too much total lift at the highest speeds, despite being stable and well balanced indicating that a set-up adjustment is required.
6.1 Future work
A common use for VPPs is to allow the generation of polar diagrams that indicate the maximum speed of a yacht for any given true wind strength and angle. It is possible to use the new Moth VPP, in conjunction with an optimisation procedure over variables including windward heel angle, aft foil setting, LCG, and wand settings, to produce a polar diagram for the Moth and associated optimum settings for each wind condition as predicted by the VPP. The large number of variables involved and function calls makes this a computationally intensive task but could give sailors not only target boat speeds for upwind and downwind legs, but also indicate the set-ups required to achieve those boat speeds and give an understanding of how variations to the set-up affects boat speeds. Most useful would be an analysis of the conditions for maximum velocity made good (VMG) in upwind and downwind sailing as the usual race course comprises only upwind and downwind legs.
Specific case studies of interest are the relationships between windward heel angle, and ride height (due to wand settings) on boat speed (at or near optimal angles for maximum upwind and downwind VMG) and the VPP can be used to undertake this. At times there are differing requirements for sailing style between take-off and steady speed sailing such as moving body weight aft to assist take off before returning to the steady LCG condition. This option is incorporated in the VPP, although it was not used for these results and it would be of interest to sailors to understand how movement of body weight can be used to maximise the acceleration to top speed. The VPP could therefore be used to look at the dynamic performance of the craft as they accelerate at starts or out of tacks and gybes although it would be desirable to adopt a more comprehensive added mass approach. Extension of the VPP for this purpose would also include the effects of small course changes (‘heating it up’) and pumping of the sail for temporary larger sail force to overcome the drag hump near take-off. Finally the VPP also offers great potential for examining the control system – particularly in waves, where the water surface could be represented by any function rather than a flat surface and the resulting craft behaviour, based on the wand tracking the surface and the foils proximity to it could be examined. References
1. Findlay, M.W. and S.R. Turnock, Investigation of the effects of hydrofoil set-up on the
performance of an international moth dinghy using a dynamic VPP, in Innovation in High Performance Sailing Yachts, 2008, London, UK, Royal Institution of Naval Architects, Lorient, France. p. 43-56.
2. http://www.moth-sailing.org/imca/faces/WorldChampions.jsp. World Champions. [webpage] 2008 [cited 2008 01-10].
3. http://www.int-moth.org.uk/NewPages/Vavavoom2.htm. Speed Matters. [webpage] 2008 31-8-08 [cited 2008 01-10].
4. http://www.int-moth.org.uk/NewPages/Design2.htm and A. May. Foil ventilation. 2008 16-03-08 [cited 2008 01-10].
5. http://www.fastacraft.com/moth_hulls_prowler.html and J. Illet. Fastacraft International Moth Hydrofoils. [cited 2008 01-10].
6. Wellicome, J.F., Aerodynamics of Sails, in Sailing yacht design: theory, A. Claughton, J. Wellicome, and R. Shenoi, Editors. 1998, Addison Wesley Longman Limited.
7. http://www.moth-sailing.org/worlds/2008_uk.xml. 2008 World Championships Results. 2008 [cited 2008 01-10].
8. Abbott, I. and A. Von Doenhoff, Theory of Wing Sections. 1959: Dover Publications. 9. Keuning, J.A., The hydrodynamics of hull, keel and rudder, in Sailing yacht design:
theory, A. Claughton, J. Wellicome, and R. Shenoi, Editors. 1998, Addison Wesley Longman Limited.
10. Chapman, R.B., Spray Drag of Surface Piercing Struts, in AIAA/SNAME/USN Advanced Marine Vehicles Meeting: . 1972: Annapolis, MD.
11. Chen, 1960. Optimum Wing-Strut Systems for High Speed Operation Near a Free Surface.
12. Martin, M., The Stability Derivatives of a Hydrofoil Boat, in Hydronautics Incorporated, Technical Report 001-10. 1963.
13. Hoerner, S., Fluid-dynamic drag. 1958: Hoerner.