Embed Size (px)
Citation preview
City of Beacon
Comprehensive Plan
March 2006
Prepared by:
Frederick P. Clark Associates, Inc. Planning/Development/Environment/Transportation
Inventory and
Analysis
INVENTORY AND ANALYSIS
City of Beacon Comprehensive Plan
TABLE OF CONTENTS Page
I. Introduction and Evaluation of Prior Planning Documents…. I-1
II. Land Use, Zoning and Development Potential……………… II-1
III. Traffic Circulation and Parking Facilities…………………... III-1
IV. Demographics and Housing…………………………………. IV-1
V. Community Services and Facilities……................................. V-1
VI. City Utilities…………………………………………………. VI-1
VII. Environmental Resources…………………………………… VII-1
Maps
Study Areas
Aerial Map
Existing Land Use
Elevation Map
Environmental Features
Water Resources
Community Facilities
Traffic Circulation Plan
Parking Facilities Plan
Appendix
Development Potential of Large Undeveloped Lots
Development Potential of Industrial Areas
Development Potential of Main Street

INVENTORY AND ANALYSIS
City of Beacon Comprehensive Plan
APPENDIX
INVENTORY AND ANALYSIS
City of Beacon Comprehensive Plan
MAPS
Inventory and Analysis Introduction
City Beacon Comprehensive Plan (March 2006) I-1
I. INTRODUCTION AND EVALUATION OF
PRIOR PLANNING DOCUMENTS
A. INTRODUCTION
The Inventory and Analysis document is a fundamental component of the City of
Beacon’s Comprehensive Plan project. This document provides basic information about
the City’s history and current conditions. Subsequent components of the Comprehensive
Plan will describe significant issues and opportunities, and the goals, objectives and
policies to guide the City’s future development.
Information presented in the Inventory and Analysis document, together with the findings
of the City’s Public Opinion Survey and the public involvement process will provide a
basis for developing the community vision, goals and objectives of the new
Comprehensive Plan.
The Comprehensive Plan Committee and other City representatives will be actively
involved in formulating drafts of the subsequent components. Input from residents, local
businesses and property owners is an important part of the planning process.
Opportunities for the public to identify their opinions on issues and recommendations
will continue throughout the planning process.
The focus of the City’s planning effort is the Main Street Business District and the larger
undeveloped or vacant properties and buildings throughout the City. These areas have
identified areas specifically as Study Areas, and this document includes data on these
areas to a greater degree of detail and specificity than areas in the rest of the City. Please
refer to the Study Areas map at the back of this document for more detailed information
about the exact boundaries of the Study Areas, and to Section D in Chapter II for a
breakdown of the areas numbered on the map.
This Inventory and Analysis document contains data and information regarding the
following topic areas: an Evaluation of Prior Planning Documents; Land Use, Zoning,
and Development Potential; Traffic Circulation and Parking Facilities; Demographics and
Housing; Community Services and Facilities; City Utilities; and Environmental
Resources. The information contained in the document was obtained from a number of
local, regional, State and Federal sources. The preparation of this document involved the
review of previous plans and studies, the compilation of information, contact with various
organizations, and the analysis of each topic area. The sources include the U.S. Census
Bureau, the Dutchess Country Department of Planning, the Dutchess County Office of
Real Property Services, the Dutchess County Environmental Management Council, other
local agencies and organizations, the City’s tax office, and the City Building Department.
Inventory and Analysis Introduction
City Beacon Comprehensive Plan (March 2006) I-2
The Inventory and Analysis document is a working document which can be updated by
the City. As information changes, such as the census and economic data, or is produced
by other organizations, relevant sections can be updated, or additional data and analysis
incorporated into appendices of the document.
B. EVALUATION OF PRIOR PLANNING DOCUMENTS
It is important to consider the research and policies of prior planning efforts in order to
effectively build upon what remains relevant to present and future circumstances. This
section of this document reviews Beacon’s 1962 and 1974 Plans, as well as updates to the
1974 Plan and the City’s 1990 Local Waterfront Revitalization Plan. The Dutchess
County Planning Department has also produced Plans, first in 1965 and most recently in
1987, which have specific recommendations for Beacon. The County’s “Greenway
Connections” is also included in the review of Plans. [Include Glynwood Center report,
1999] Finally, the evaluation contained in this section also briefly discusses some of the
local area planning that has taken place in the last several years regarding Long Dock, the
City’s Harbor, and lands owned by the Metropolitan Transportation Authority adjacent to
the Beacon train station.
The City of Beacon has a long history of planned development. The City’s 1962 “City
Development Plan” was conducted in conjunction with plans for the Towns of Fishkill
and Wappinger. The City adopted a new, updated Development Plan in 1974, again as a
part of a larger project involving planning for the Towns of Fishkill and Wappinger, and
the Villages of Fishkill and Wappingers Falls. The 1974 planning process involved the
creation of a “Southern Dutchess Area Development Plan,” as well as individual plans for
each municipality in the area. The 1974 Plan was first amended in 1996 to add “Specific
and Remedial Housing Goals” to the goals and policies of the 1974 Plan. Another
amendment revised the City Development map to change the meaning of “Low-Density
Residential” from “1 to 2 dwelling units per acre” to “2 or fewer dwelling units per acre.”
Other amendments to the Plan have added content to the background information, but
have not changed the goals and policies of the plan. The background information from
the original plans and the updates has been incorporated into this document, although in
many cases the format of the data has changed.
The goals and policies currently in effect are summarized below, and each are evaluated
according to their relevance for the City’s current status and future development.
Inventory and Analysis Introduction
City Beacon Comprehensive Plan (March 2006) I-3
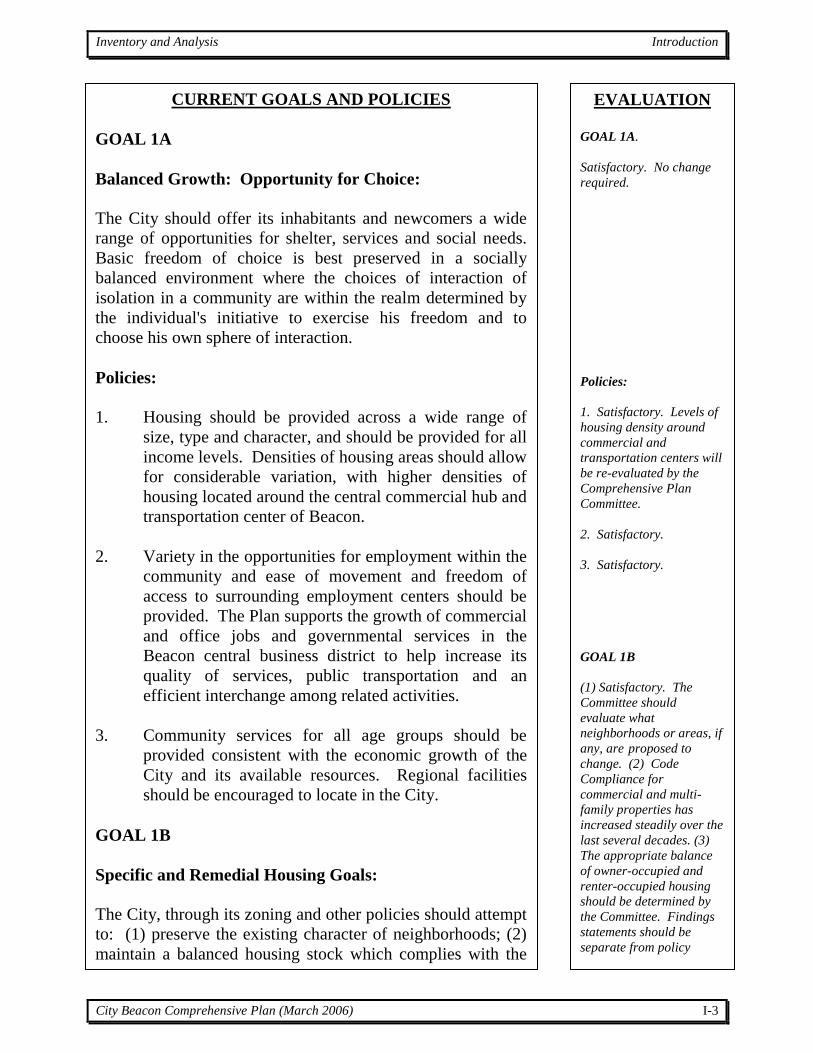
CURRENT GOALS AND POLICIES
GOAL 1A
Balanced Growth: Opportunity for Choice:
The City should offer its inhabitants and newcomers a wide
range of opportunities for shelter, services and social needs.
Basic freedom of choice is best preserved in a socially
balanced environment where the choices of interaction of
isolation in a community are within the realm determined by
the individual's initiative to exercise his freedom and to
choose his own sphere of interaction.
Policies:
1. Housing should be provided across a wide range of
size, type and character, and should be provided for all
income levels. Densities of housing areas should allow
for considerable variation, with higher densities of
housing located around the central commercial hub and
transportation center of Beacon.
2. Variety in the opportunities for employment within the
community and ease of movement and freedom of
access to surrounding employment centers should be
provided. The Plan supports the growth of commercial
and office jobs and governmental services in the
Beacon central business district to help increase its
quality of services, public transportation and an
efficient interchange among related activities.
3. Community services for all age groups should be
provided consistent with the economic growth of the
City and its available resources. Regional facilities
should be encouraged to locate in the City.
GOAL 1B
Specific and Remedial Housing Goals:
The City, through its zoning and other policies should attempt
to: (1) preserve the existing character of neighborhoods; (2)
maintain a balanced housing stock which complies with the
EVALUATION
GOAL 1A.
Satisfactory. No change
required.
Policies:
1. Satisfactory. Levels of
housing density around
commercial and
transportation centers will
be re-evaluated by the
Comprehensive Plan
Committee.
2. Satisfactory.
3. Satisfactory.
GOAL 1B
(1) Satisfactory. The
Committee should
evaluate what
neighborhoods or areas, if
any, are proposed to
change. (2) Code
Compliance for
commercial and multi-
family properties has
increased steadily over the
last several decades. (3)
The appropriate balance
of owner-occupied and
renter-occupied housing
should be determined by
the Committee. Findings
statements should be
separate from policy
Inventory and Analysis Introduction
City Beacon Comprehensive Plan (March 2006) I-4
Building Code; (3) encourage owner-occupied housing
(which tends to be better maintained through pride of
ownership); (4) require high quality, long lasting
construction; (5) provide incentives for the preservation of
historic and older homes; (6) effect an overall stabilization of
density; and (7) discourage development which involves
significant land manipulation and its attendant potential for
drainage, erosion and other environmental problems.
Policies:
1. The City should amend is zoning for the purposes of:
a. Replacing, in certain existing predominantly
single-family detached neighborhoods, the RD-
3 Designed Residence District (which permits
single-family, two-family, and multi-family
dwelling units at a density of 3,000 square feet
per unit) with a new R1-5 One-Family
Residence District (which would permit single-
family detached homes on 5,000 square foot
lots).
b. Replacing, in certain other areas, where
appropriate, the RD-3 Designed Residence
District with either a new RD-5 Designed
Residence District (which would permit single-
family, two-family and multi-family dwelling
units at a density of 5,000 square feet per unit)
or with the RD-6 Designed Residence District
(which permits single-family, two-family and
multi-family dwelling units at a density of
6,000 square feet per unit).
c. Selectively rezoning properties so as to effect
an overall stabilization of residential density.
2. The City should catalogue its housing stock
(conforming, legally non-conforming, and illegally
non-conforming uses) so as to be able to identify
legally and illegally non-conforming uses.
3. The City should strengthen its enforcement policies so
as to continue to eliminate existing and future zoning
statements, and should be
backed up by research.
(4) The City does not
have the authority to
require construction
standards higher than the
State Building Code. The
appearance of new
buildings is regulated by
Chapter 86. (5)
Satisfactory. City
Council is currently re-
evaluating this matter.
(6) No longer relevant,
since zoning changes
achieved this. (7)
Satisfactory. The
Committee may choose to
focus this element to
specific priority areas of
the City.
Policies:
1.a. Policy achieved. No
longer relevant.
1.b. Policy achieved. No
longer relevant.
1.c. Policy is too broad
in current context. No
longer relevant.
2. Policy has not
received the resources
necessary for
implementation. Past
practices of City record-
keeping makes this task
difficult and time-
consuming.
3. Policy has been
successful regarding
Building Code violations.
Regarding zoning
violations, see comment
Inventory and Analysis Introduction
City Beacon Comprehensive Plan (March 2006) I-5
and Building Code violations.
4. The City should make sure that its taxing methods do
not unduly encourage conversions to higher density
residential uses.
5. The City should, through its Historic District and
Landmark Overlay Zone and associated policies,
protect its historic homes and provide incentives for
their preservation.
6. The City should require compatible architectural
design throughout the City and should require
architectural consistency within its Historic District
and Landmark Overlay Zone.
7. The City should inventory its undeveloped and
underdeveloped lands for the purpose of developing a
land use plan and zoning which are consistent with its
housing goals and policies.
GOAL 2
Optimum Land Use and Physical Amenity:
The most desirable use of land should be sought based upon
people's needs, locational significance and physical
characteristics. Physical amenities of facilities, utilities and
roads should be rationally supplied to adequately serve the
various land uses.
Policies:
1. Land should be distributed in a compatible
arrangement so that conflicts between various uses are
avoided and so that harmonious land uses are
encouraged to locate near each other. Growth should
be encouraged in and around the Beacon central
business district, rather than spreading out along the
highways of the City and its surrounding area.
2. A sound system of utility services should be provided
for the City, and wherever possible, intermunicipal use
should be encouraged. Provision of an increased
above. Recommend
changing “should
strengthen” to “maintain
its strong enforcement
policies”
4. The planning
consultants will
determine if this question
has been answered
satisfactorily.
5. Policy achieved. The
City Council is currently
re-evaluating City
historic preservation
policy.
6. Policy achieved.
7. This policy is being
implemented through the
planning process
currently under way.
GOAL 2
Satisfactory.
Policies:
1. Satisfactory.
2. Provision of an
increased water supply
has been achieved and
excess capacity of 0.8
Inventory and Analysis Introduction
City Beacon Comprehensive Plan (March 2006) I-6
public water supply is of first priority concern.
3. An integrated and efficient transportation system
consistent with the overall areawide development
pattern should be provided for to assure the effective
and economic movement of people and goods within
and through Beacon.
To achieve this, a top priority of the Plan is the
connection of the City's business district and its
proposed transportation center to the expressway
network of the area.
GOAL 3
Community Identity and Cohesion:
The gathering of economic, governmental and social
activities into a hierarchy of suburban centers to provide a
greater sense of identity and community is a primary goal of
the Area Development Plan. The purposes of this were to
preserve open space, to economically provide for public
utilities and facilities and to create the advantages of
providing a single place where people living around such a
center could take care of their day-to-day needs.
Policies:
1. Growth should be encouraged in Beacon to strengthen
its existing urban character. The clustering of
residential uses should be related to the central
business district, with higher densities adjacent to the
City's central commercial core and to the proposed
transportation center.
2. Local shopping areas should be maintained, but at a
small enough scale not to detract from or be
competitive with the major commercial center.
3. The central business district should be made more
compact and office uses should be encouraged to
locate adjacent to the central business district. Such a
compact business center should be served by public
transportation.
million gallons currently
exists. See “City
Utilities” Chapter for
more information.
3. Recent improvements
include ferry service to
Newburgh and road
improvements to Route
9D. The plan should
specify whether and how
the integrated system
should include bus lines,
particularly in
connection with the train
station / transportation
center.
GOAL 3
Generally sufficient.
Somewhat redundant in
relation to other goals
and policies already
expressed. Beacon may
be considered a small
urban center rather than
a suburban center; the
Committee will
determine how it chooses
to characterize the City.
Policies:
1. This policy appears to
be somewhat inconsistent
with other goals of the
current plan, which focus
on preserving the
existing character of
neighborhoods and
reducing densities in
areas adjacent to Main
Street. The Committee
should re-evaluate the
existing and allowable
densities in the
residential areas around
the central business
district and the
transportation center.
2. Satisfactory. Small
businesses serving
neighborhoods should be
maintained.
Inventory and Analysis Introduction
City Beacon Comprehensive Plan (March 2006) I-7
GOAL 4
Open Space and Natural Resource Preservation:
An open space system of sufficient size and locational
qualities must be provided to meet the complete range of
recreational need[s] for the people and to reserve adequate
areas for the protection of water related resources, wild life,
and land forms of particular environmental value.
Policies:
1. Areas of ecological importance such as water bodies,
wetlands, aquifers, slopes, hilltops, and valuable wild
life areas should be preserved through conservation-
type zoning techniques. The rare assets of the City,
such as the Hudson River and Fishkill Creek should be
protected, as should the Hudson Highlands in the
southeast portion of the City.
2. Development density should be reasonably related to
land capabilities with lower densities maintained on
lands least able to support intensive uses.
3. Adequate recreational facilities of various types should
be provided throughout the City in accessible
locations. Special attention should be given to small
local parks, in locations convenient to City residents.
GOAL 5
Public Awareness and Participation:
The use of freedom and opportunity depends heavily upon
adequate information and the ability to participate in local
decision making processes. The identification of the human
consequences of alternative public actions, including
identification of positive social and cultural values to be
preserved, as well as social costs and benefits of alternative
courses of action must receive wide exposure so that those
who are affected have an understanding of such factors and
the opportunity to express their views prior to the decision
making process.
3. A large number of well-
maintained historic
buildings with commercial
uses are located on both
ends of Main Street. This
policy should be re-
evaluated by the
Committee.
GOAL 4
Satisfactory.
Policies:
1. Satisfactory. The
Committee should re-
evaluate the areas
prioritized by this policy
and add any other
important areas.
2. Satisfactory. The
Committee should decide
if the Plan should identify
these areas specifically.
3. Satisfactory. Specific
recommendations begin
on page 41 of the 1974
plan. The Committee may
wish to update or revise
this list.
GOAL 5
Satisfactory. This is an
excellent statement of the
process that should be
used to develop a new
Plan. Alternative
scenarios, with social
costs and benefits
explicitly presented,
should be included in the
planning process.
Inventory and Analysis Introduction
City Beacon Comprehensive Plan (March 2006) I-8
Beacon’s Local Waterfront Revitalization Plan, completed in April of 1991, effectively
updated the Comprehensive Plan in a rather profound manner and resulted in numerous
Zoning Map amendments. The Plan was developed in conjunction with other similar
planning and zoning analyses along Fishkill Creek from Wolcott Avenue northerly to the
Town of Fishkill boundary. Together, these planning efforts encompassed a significant
portion of the City. The Local Waterfront Revitalization Plan contains 44 policy
statements and numerous secondary policy statements, which are found in Section III of
the document. We have reviewed these policy statements and find all of them still
relevant, as the revitalization of the waterfront is still in process.
Policies:
1. Information on planning decisions should be made
available through a wide variety of channels: the local
press and communication systems, the schools, and
through various religious, health, social and club
organizations.
2. Flexibility in City governmental procedures and
institutions should be sought to ensure greater
constructive citizen participation and involvement in
the planning process and to foster leadership in all
groups, especially those neglected in public decision
making because of gaps in organization, leadership,
articulation of values and needs, or economic status.
3. The City should speak for itself through its plan. The
development of genuine local centers of activity and
adequate community and recreational facilities in
residential areas which relate to each other through an
integral open space system can help create a sense of
community and identity where some factors of
isolation and alienation might be minimized and where
a sense of awareness, incentives for participation in
neighborhood decision making processes and
opportunities for interaction with one's neighbor, if
desired, can be maximized.
Policies:
1. The policy should be
updated to include
electronic media as an
element of the existing
communications systems.
The Committee should
evaluate the planning
process to date and
upcoming outreach
events and methods in
relation to this policy.
2. Satisfactory. The
Committee should
evaluate past, present,
and projected planning
work in light of this
policy.
3. Satisfactory. The
Committee may choose to
evaluate the perceived
level of opportunities for
positive social
participation in the City
today versus in the past.
Inventory and Analysis Introduction
City Beacon Comprehensive Plan (March 2006) I-9
Dutchess County Plans
The 1987 Dutchess County Plan, Directions, places Beacon in the regional context as a
small city, second to Poughkeepsie, and the focus of southwestern Dutchess County. The
Plan calls for inter-municipal cooperation regarding sewer and water utilities, and
envisions Beacon’s municipal sewage treatment plant as eventually expanding to serve
the Village of Fishkill and large portions of the Towns of Fishkill, East Fishkill, and
Wappinger. In terms of land use, the Plan recommends the following:
Protection of residential areas from incompatible development.
Renovation of the railroad station and the immediate vicinity.
Redevelopment and protection of the riverfront area.
Revitalization and strengthening of the downtown area.
Adoption and enforcement of strict standards for site and architectural design and
building construction.
Expansion of the economic base.
Dutchess County’s Greenway Connections document, dated March 2000, is in many
respects a plan. The “Settlement Patterns” on page 24 supports close-knit and compact
centers that support central utilities and have a mixture of uses within a five to ten minute
walk of surrounding residential areas, all features of Beacon today. Plans for
transforming Long Dock and connecting the train station and harbor area with Dennings
Point and Madam Brett Park along the Fishkill Creek are also described on page 35. A
section on “Promoting Arts and Tourism” highlights the TALLIX Foundry in Beacon and
the then-pending development of the Dia Center for the Arts. A section on “Enhancing
Rail Connections,” page 39, includes information about a Metro-North feasibility study
of developing a Beacon Line between Beacon, Hopewell Junction, and Brewster, along
the former Housatonic Line. Beacon is also included in a list of communities that could
benefit from transit-oriented infill development around the train station. Greenway
Guides organized around the theme “Strengthening Centers” are all relevant to Beacon’s
current condition and future development. Also, the “Greenway Connections” section
contains relevant environmental principles for the City’s continued development,
including “Connected Habitats,” “Stream Corridor Protection,” “Highways into
Greenways,” and “Wellhead and Aquifer Protection.”
Important Site / Area Plans
Following up on the work of the Local Waterfront Revitalization Plan of 1990, the Scenic
Hudson Land Trust, the New York State Rivers and Estuaries Center, and the
Metropolitan Transportation Authority have collaborated with the City to initiate
planning processes to revitalize the City’s waterfront and transportation center.
Inventory and Analysis Introduction
City Beacon Comprehensive Plan (March 2006) I-10
Long Dock
The proposal for Beacon’s Long Dock consists of uniting three abutting parcels totaling
approximately 25 acres and developing a hotel, conference center, restaurants,
community space and boardwalks and parks, pursuant to a development agreement
between The Scenic Hudson Land Trust, Inc. and Foss Group Beacon, LLC. The project
totals approximately 163,110 SF of gross floor area in addition to the existing 4,000 SF
of gross floor area associated with the Red Barn (which is the only existing building to
remain). The proposed project consists of the following components:
Hotel (up to 140 rooms)
Conference Center (10,000 SF)
Restaurants (two restaurants: up to 500 persons served; indoor only 275 seats)
Offices (3,000 SF Phase I, up to 25,000 SF Phase II)
Residential Units (up to 17 2-bdrm units, Phase II)
Red Barn (for community activities, 4,000 SF)
Greenhouse (a retail space to include public restrooms)
Boardwalk and Public Plaza
Passive Recreation Area (called ‘South Meadow’)
Parking Areas
Some additional details regarding the site and its potential and proposed uses can be
found in Section D of Chapter II.
Harbor
The City’s Harbor Advisory Committee has been working with the various stakeholders
of the Long Dock project as well as others to create a Harbor Management Plan. The
Plan includes all of the lands west of the railroad tracks in the City, but focuses
principally on the area between Long Dock and Riverfront Park. Harbor Plans include a
research vessel for the Rivers and Estuaries Center to be docked at Long Dock, as well as
a barge for educational purposes. A building is proposed to house the operating needs of
the Center as well as accommodate the needs of a boat club oriented to the harbor. A
sloop club, separate from the boat club, is planning to provide moorings in the harbor.
The Hudson River Fisheries Trust is also participating in the planning, and is proposing
to offer sailing classes. Cassion Associates is working with the Advisory Committee to
develop a plan.
Inventory and Analysis Introduction
City Beacon Comprehensive Plan (March 2006) I-11
Transportation Center
The Metropolitan Transportation Authority (MTA) has been engaged in a public planning
and consultation process with the City regarding the development of its lands around the
Beacon station for several years.
The MTA has recently begun improvements to the Beacon station, including the purchase
of a portion of the Dorel property and construction of 365 additional parking spaces on
the new parcel, landscaping and beautification of the existing parking, including tree
plantings, construction of an intermodal plaza adjacent to the station, and construction of
an additional access road to the station.
The MTA’s long term plans, which are still in the conceptual stages and are not
scheduled or funded, feature a parking structure on the south lot, which would be kept to
a low profile and accessed from Beekman Street directly onto the top of the structure.
The structure would accommodate up to 1000 parking spaces, but would result in only
400 new parking spaces, since parking would be removed from the west side of the
tracks. The west side area could be converted through private partnership to relatively
low buildings that do not block views of the harbor, housing water-related commercial
uses and residential uses. A multi-functional gateway facility is also an element in the
MTA’s long term plans for the station.
J:\DOCS2\100\Beacon\City Development Plan\Basic Studies\Intro and Eval2.doc
Inventory and Analysis Land Use, Zoning and Development Potential
City of Beacon Comprehensive Plan (March 2006) II-1
II. LAND USE, ZONING AND
DEVELOPMENT POTENTIAL
A. Existing Land Use
This chapter focuses on the existing types, amounts and locations of land uses in the City
of Beacon. The map, Existing Land Use, shows the existing land uses, including the
locations and concentrations of land use activities throughout the City.
Land use information was classified into standard planning categories of residential and
non-residential uses. The existing land uses in the City were grouped into the following
categories:
Single-Family Residential
Two-Family Residential
Three-Family Residential
Multi-Family Residential
Retail/Service
Office/Professional
Mixed Use
Industrial
Vacant Industrial
Public/Private Institutions and Services
Vacant Institutional
Private Recreation/Open Space
Public Recreation/Open Space
Roads/Utilities
Vacant/Undeveloped
The original planimetric information (i.e., lot lines, etc.) and real property classifications
were obtained from the Dutchess County Office of Real Property Tax. This information
was analyzed, supplemented and updated through field checks and review of the aerial
photography by the City’s planning consultants and City staff. Field checks were made
to verify recent land use changes. In addition, drafts of the land use maps were
coordinated with, and reviewed by City staff.
A summary of the previous and current land uses, acreages and percentage of the total
land area for each category in the City of Beacon are identified in Table II-1, below.
Inventory and Analysis Land Use, Zoning and Development Potential
City of Beacon Comprehensive Plan (March 2006) II-2
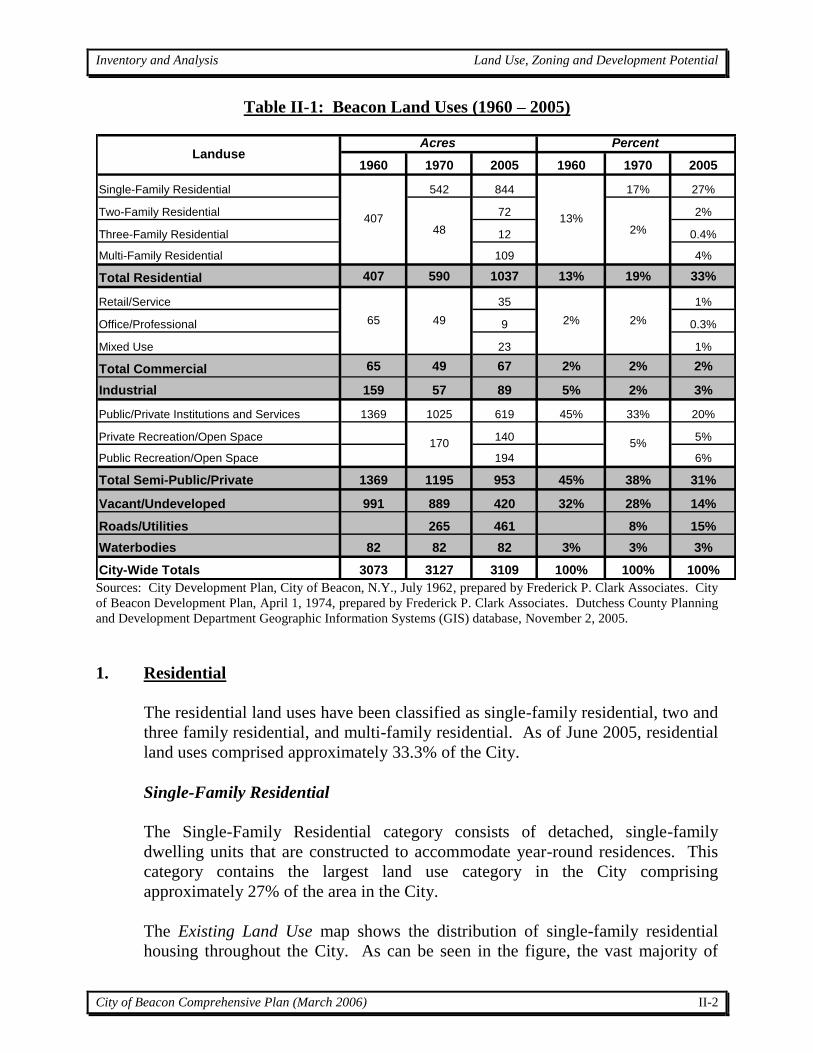
Table II-1: Beacon Land Uses (1960 – 2005)
1960 1970 2005 1960 1970 2005
Single-Family Residential 542 844 17% 27%
Two-Family Residential 72 2%
Three-Family Residential 12 0.4%
Multi-Family Residential 109 4%
Total Residential 407 590 1037 13% 19% 33%
Retail/Service 35 1%
Office/Professional 9 0.3%
Mixed Use 23 1%
Total Commercial 65 49 67 2% 2% 2%
Industrial 159 57 89 5% 2% 3%
Public/Private Institutions and Services 1369 1025 619 45% 33% 20%
Private Recreation/Open Space 140 5%
Public Recreation/Open Space 194 6%
Total Semi-Public/Private 1369 1195 953 45% 38% 31%
Vacant/Undeveloped 991 889 420 32% 28% 14%
Roads/Utilities 265 461 8% 15%
Waterbodies 82 82 82 3% 3% 3%
City-Wide Totals 3073 3127 3109 100% 100% 100%
5%
Percent
13%2%
2% 2%
170
AcresLanduse
40748
65 49
Sources: City Development Plan, City of Beacon, N.Y., July 1962, prepared by Frederick P. Clark Associates. City
of Beacon Development Plan, April 1, 1974, prepared by Frederick P. Clark Associates. Dutchess County Planning
and Development Department Geographic Information Systems (GIS) database, November 2, 2005.
1. Residential
The residential land uses have been classified as single-family residential, two and
three family residential, and multi-family residential. As of June 2005, residential
land uses comprised approximately 33.3% of the City.
Single-Family Residential
The Single-Family Residential category consists of detached, single-family
dwelling units that are constructed to accommodate year-round residences. This
category contains the largest land use category in the City comprising
approximately 27% of the area in the City.
The Existing Land Use map shows the distribution of single-family residential
housing throughout the City. As can be seen in the figure, the vast majority of
Inventory and Analysis Land Use, Zoning and Development Potential
City of Beacon Comprehensive Plan (March 2006) II-3
single-family residences are currently located within one-half of a mile from Main
Street, with areas to the northeast and southwest settled at lower densities. The
relative density of single-family development can be surmised from a review of
the Existing Land Use map - the smaller the lot size, the more single-family
residences there are in a given area.
Multiple Residences
The Multiple Residences land use category consists of lands occupied by either:
two-family residences, three-family residences, or lands that contain multiple
residences (e.g., two single-family residences on one lot). Two-family residences
are scattered among the single-family residences, clustered most densely between
Verplank Avenue north of Main Street and Rombout Avenue south of Main Street.
Three-family residences are clustered in the area around the east end of Main
Street. Approximately 2% of the City was occupied by such land uses in 2005.
Multi-Family Residential Development
The Multi-Family Residential Development category includes structures that have
been built or converted into four or more dwelling units, and the various multi-
family developments in the City. These residences are generally distributed
among large parcels on North and South Avenues (Route 9D). Multi-Family
development comprised approximately 4% of the City in 2005.
2. Commercial
Retail / Service
The Retail/Service land use category includes a variety of uses, including: retail
stores and shopping centers; restaurants; motor vehicle sales, hotels, automobile
services and gas stations; and such commercial uses. As shown on the Existing
Land Use map, the majority of the commercial development is concentrated along
the Main Street corridor, with a smaller cluster on Fishkill Avenue (Route 9D).
Such uses comprise 35 acres, approximately 1% of the City.
Office/Professional
This category includes professional offices and banks. Such uses comprise 9
acres, approximately 0.3% of the total land area in the City. Office uses are
generally located on Main Street.
Inventory and Analysis Land Use, Zoning and Development Potential
City of Beacon Comprehensive Plan (March 2006) II-4
Mixed Use
The Mixed Use land use category includes developments that contain a mixture
of uses such as retail/service and multi-family residential on a single parcel of
land. Such uses occur together on parcels that total approximately 1% of the total
land area of the City.
3. Industrial
The Industrial land use category consists of manufacturing, storage, warehouse
and distribution facilities located within the City. This land use category
comprises 89 acres, 3% of the land area City in 2005. Industrial uses are found
on Main Street west of City Hall and on Fishkill Avenue.
The Vacant Industrial land use category includes lots that have existing industrial
buildings that are vacant and no longer in use. All of the parcels in this category
are located along Fishkill Creek. Table II-1 does not include this category; vacant
industrial properties are included under “Industrial” rather than “Vacant” because
of the existing buildings on the properties.
4. Public Space
Public/Private Institutions and Services
The Public/Private Institution and Services category includes schools and other
educational facilities, hospitals and other health facilities, religious facilities,
cemeteries, police and fire protection facilities. These uses comprise
approximately 20% of the total land area in the City. These land uses are
distributed fairly evenly throughout the City.
The Vacant Institutional land use category is comprised of open areas on
currently partially developed Institutional sites, primarily the Fishkill
Correctional Facility.
Public Recreation/Open Space
The Public Recreation/Open Space category includes active State and local parks
and community recreational areas such as playing fields and courts. These
community uses comprise 194 acres of the total land area in the City, or 6%.
Memorial Park and Dennings Point State Park are the largest. The community
Inventory and Analysis Land Use, Zoning and Development Potential
City of Beacon Comprehensive Plan (March 2006) II-5
Park off of Wolcott Avenue and the Riverfront Park are smaller, more centrally
located parks.
Private Recreation/Open Space
Private recreation includes passive parks, homeowners association open space
and specifically includes Southern Dutchess Country Club near Interstate 84,
Hammond Field, Mount Beacon Park and Madam Brett Park. Approximately
140 acres (5%) of the City constitutes this land use category.
Roads/Utilities
Roads and utilities comprise approximately 461 acres (15%) of the City. A large
portion of this area includes the Metro-North Railroad right-of-way along the
Hudson River and the railroad right-of-way along Fishkill Creek, the sewage
transfer center, the closed landfill site, the land south of Interstate-84 owned by
the New York State Bridge Authority and a number of other smaller publicly-
owned utility sites throughout the City.
5. Vacant Land
This category includes the vacant parcels in the City which are not in use or
without permanent improvements. Approximately 14% of the total land area in
the City fits into the Vacant land use category. As shown on the Existing land
Use map, there are only a few large vacant properties located throughout the City.
Specifically, the majority of the vacant land consists of the following properties:
the proposed Long Dock Beacon site between the railroad tracks and the Hudson
River, the Hiddenbrooke Property in the northeast portion of the City as well as
the land surrounding the Fairview Cemetery, a couple lots south of City Hall,
land south of DIA Beacon, land south of the closed landfill and adjacent to a
vacant industrial site, and the Craig House site in the southern part of the City.
Analysis of the potential future development of such properties, along with under-
developed parcels, is a critical part of the comprehensive planning process.
Information on oversized / under-developed parcels is provided in Section D of
this chapter, “Development Potential Analysis.”
Inventory and Analysis Land Use, Zoning and Development Potential
City of Beacon Comprehensive Plan (March 2006) II-6
Land Use: 1960
Commercial
2.1%
Waterbodies
2.7%
Undeveloped
32.2%
Public/Semi-
Public
44.5%Residential
13.2%
Industrial
5.2%
B. Land Use Change
Table II-1 and Figures II-1 through II-4 illustrate changes in land use in the City of
Beacon over the last 45 years. Figures II-1 through II-3 display the land use
characteristics within the designated year. The table at the beginning of the chapter
presents the City’s land use characteristics at the three different times (the years 1960,
1970 and 2005). Note that the time periods between the land use data analyzed in the
City’s Development Plans differ in length, with 10 years between 1960 and 1970 and 35
years between 1970 and 2005. Figure II-4 graphically illustrates the relative changes in
land use in the City over this time period.
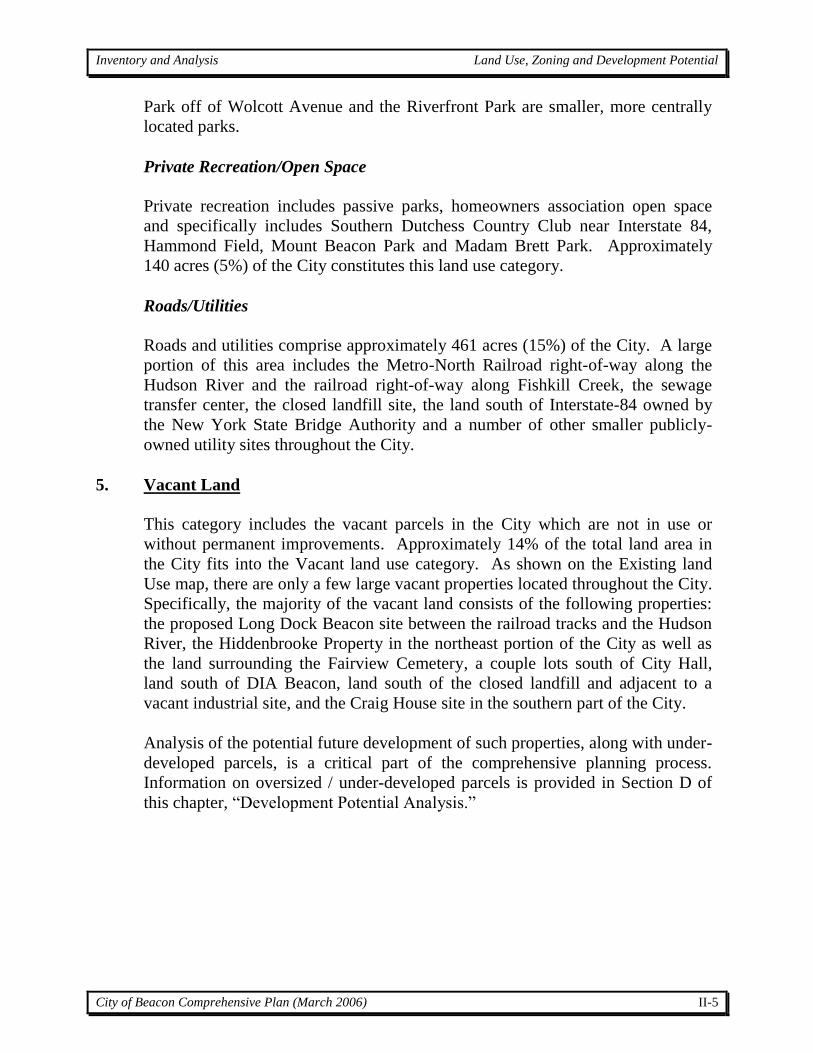
1. Land Use - 1960
Figure II-1 Figure II-1 Land Use,
1960 shows the land use
characteristics of the City
in the year 1960.
Approximately one-third
of the City (i.e., 33%)
was undeveloped in 1960.
Another 45% of the land
area was occupied by
public and semi-public
uses. Approximately
13% was occupied by
residential uses.
Approximately 2% of the City was occupied by commercial uses and 5% was
occupied by industrial uses. The source of the 1960 land use data was the City
Development Plan for the City of Beacon, N.Y., prepared by Frederick P. Clark
Associates, July 1962. Public and Semi-Public land use refers to Public/Private
Institutions and Services, Private Recreation/Open Space and Public
Recreation/Open Space.
Inventory and Analysis Land Use, Zoning and Development Potential
City of Beacon Comprehensive Plan (March 2006) II-7
Land Use: 1970
Roads/Utilities
8.5%
Waterbodies
2.6%
Commercial
1.6%
Undeveloped
28.4%
Public/Semi-
Public
38.2%
Residential
18.9%
Industrial
1.8%
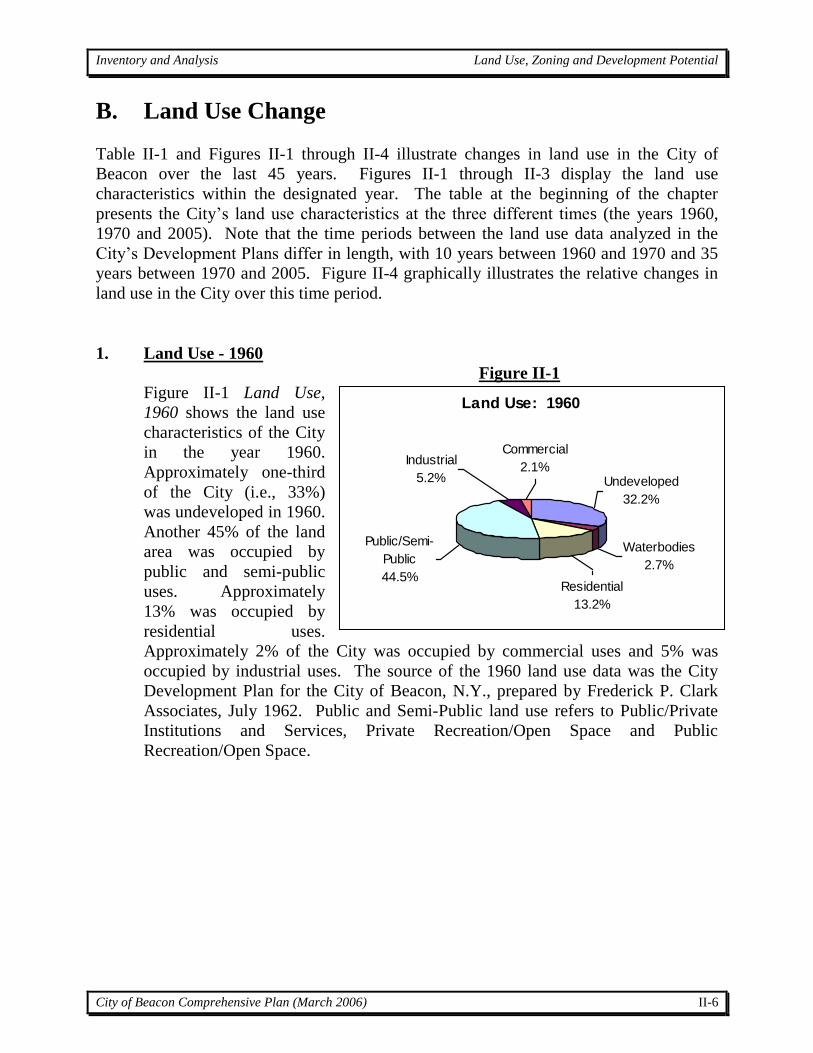
2. Land Use - 1970
Figure II-2
Figure II-2, Land Use,
1970, illustrates the way
land was used in the City
in 1970. Lands occupied
by public and semi-public
uses occupied 38% of the
City’s land area. The
amount of the City’s land
area occupied by
residential uses, rose from
13% in 1960 to 19%
(17% was occupied by
single-family residential
uses) while the amount
occupied by commercial uses remained approximately 2%. The amount of
industrial land use declined from 5% to 2%. The source of the 1970 land use data
was the City of Beacon Development Plan, prepared by Frederick P. Clark
Associates, April 1974. Public and Semi-Public land use refers to Public/Private
Institutions and Services, Private Recreation/Open Space and Public
Recreation/Open Space.
The significant changes in land uses in the City between 1960 and 1970 (a 10-year
period) are as follows:
° The 183 acre increase in residential land area, from 13% to 19% (a 38%
increase in total acres), was the only increase in acres experienced during this
time period. This equaled an average per annum increase of 4% (18.3 acres
per year) compared to the extent of such development in 1960.
° The amount of undeveloped land decreased from 991 acres to 889 acres
between 1960 and 1970. This represented a decrease of 10% based on the
amount of undeveloped land in 1960.
° The amount of commercial land area remained approximately the same
between 1960 and 1970 whereas Industrial land uses decreased by
approximately 102 acres (64%).
Inventory and Analysis Land Use, Zoning and Development Potential
City of Beacon Comprehensive Plan (March 2006) II-8
Land Use: 2005
Roads/Utilities
14.8%Commercial
2.2%Waterbodies
2.6%
Public/Semi-
Public
30.7%
Undeveloped
13.5%
Residential
33.4%
Industrial
2.9%
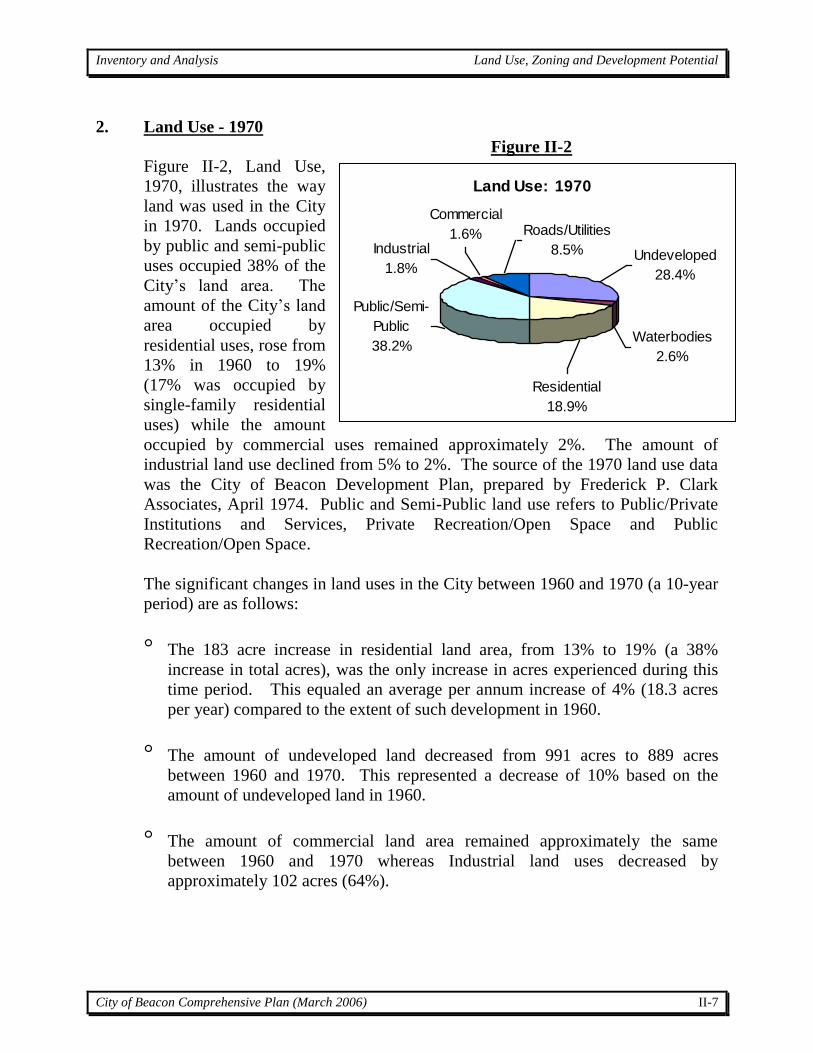
3. Land Use - 2005
Figure II-3 Figure II-3, Land Use,
2005, shows the land use
characteristics of the City
in the year 2005. As
shown in that area of the
table, the largest single
land use category in the
City is “Residential” land
use category, which
accounts for one-third of
the land area of the City.
Residential land use area
surpassed the amount of
undeveloped land in the
City between 1970 and 2005. The amount of undeveloped land in the City
decreased to 14% of the City by 2005 (compared to 28% in 1970 and 32% in
1960). The amount of public/semi-public land use dropped to 31% of the City
from 38% in 1970 and 45% in 1960. Commercial land use increased from 1970 to
2005 by 18 acres (a 37% increase) to 67 acres, which was basically the same
acreage that was in commercial use in 1960. Industrial land use increased
approximately 32 acres (a 56% increase) from 1970 to 2005. Please refer to Table
II-1 for a summary of the land use characteristics described herein.
The significant changes in land uses in the City between 1970 and 2005 (a 35-year
period) are as follows:
° The 302 acre (56%) increase in single-family residential land area was the
largest increase in acres experienced during this time period, followed by the
145 acre (300%) increase in land area used for multiple residences and multi-
family (four or more residences per lot) residential use.
° The amount of undeveloped land decreased by 469 acres (53%) between 1970
and 2005. This equates to an average decrease of 13.4 acres of undeveloped
land per year during this time period.
° The average yearly amount of land converted to residential use increased from
18.3 acres per year between 1960 and 1970 to 12.8 acres per year between
1970 and 2005. Specifically, the average amount of land converted to single-
family residential use between 1970 and 2005 was 8.6 acres per year. The
Inventory and Analysis Land Use, Zoning and Development Potential
City of Beacon Comprehensive Plan (March 2006) II-9
amount of land converted to multiple residences and multi-family residential
during the same period was 4.1 acres per year.
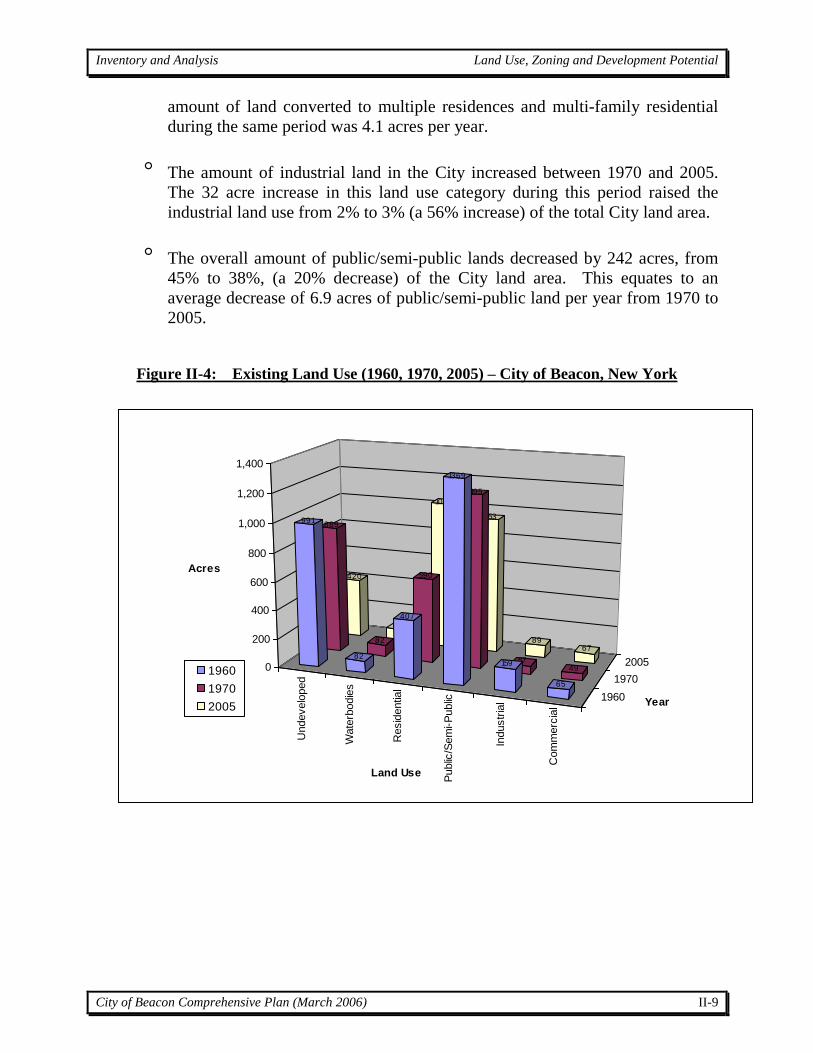
° The amount of industrial land in the City increased between 1970 and 2005.
The 32 acre increase in this land use category during this period raised the
industrial land use from 2% to 3% (a 56% increase) of the total City land area.
° The overall amount of public/semi-public lands decreased by 242 acres, from
45% to 38%, (a 20% decrease) of the City land area. This equates to an
average decrease of 6.9 acres of public/semi-public land per year from 1970 to
2005.
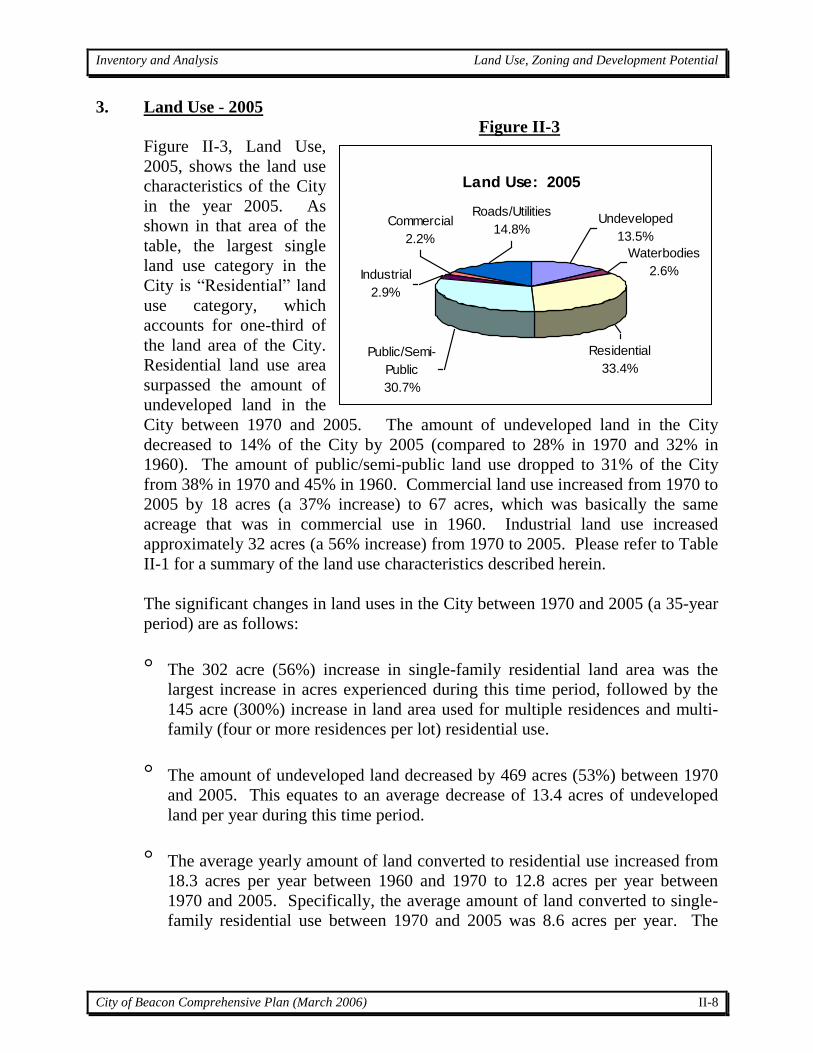
Figure II-4: Existing Land Use (1960, 1970, 2005) – City of Beacon, New York
Undevelo
ped
Wate
rbodie
s
Resid
entia
l
Public
/Sem
i-P
ublic
Industr
ial
Com
merc
ial
1960
1970
2005
420
82
1037
953
8967
889
82
590
1195
5749
991
82
407
1369
159
65
0
200
400
600
800
1,000
1,200
1,400
Acres
Land Use
Year
1960
1970
2005
Inventory and Analysis Land Use, Zoning and Development Potential
City of Beacon Comprehensive Plan (March 2006) II-10
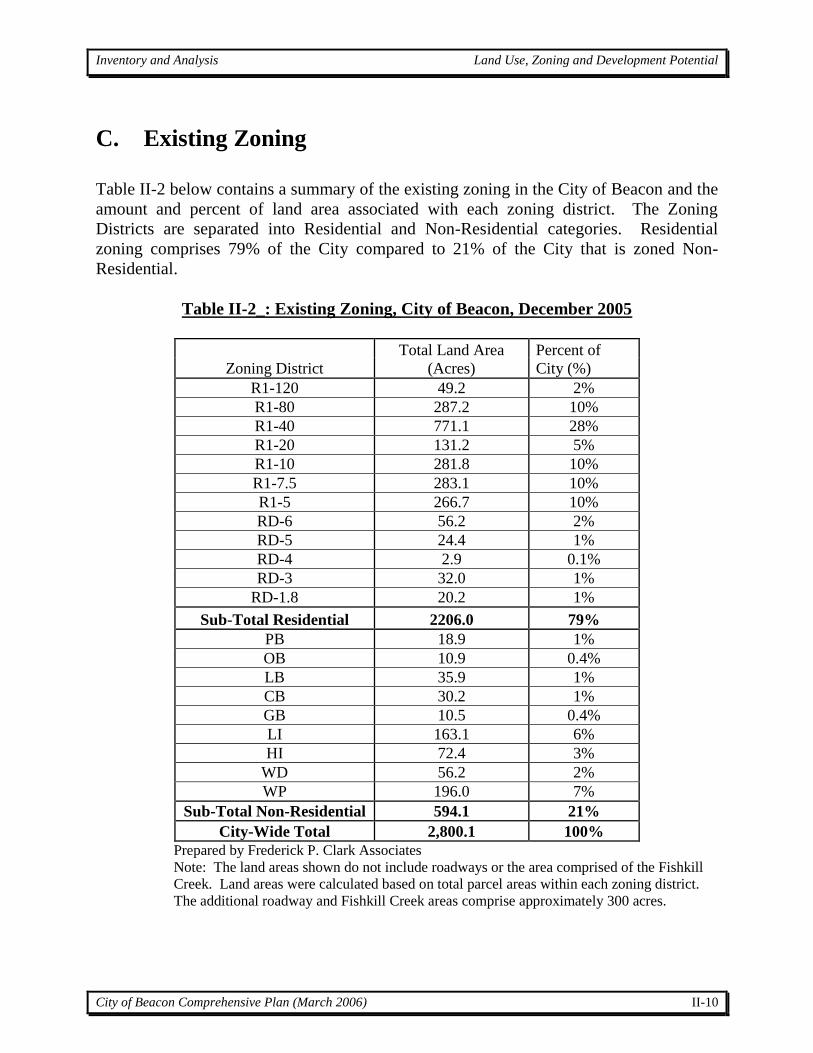
C. Existing Zoning
Table II-2 below contains a summary of the existing zoning in the City of Beacon and the
amount and percent of land area associated with each zoning district. The Zoning
Districts are separated into Residential and Non-Residential categories. Residential
zoning comprises 79% of the City compared to 21% of the City that is zoned Non-
Residential.
Table II-2_: Existing Zoning, City of Beacon, December 2005
Zoning District
Total Land Area
(Acres)
Percent of
City (%)
R1-120 49.2 2%
R1-80 287.2 10%
R1-40 771.1 28%
R1-20 131.2 5%
R1-10 281.8 10%
R1-7.5 283.1 10%
R1-5 266.7 10%
RD-6 56.2 2%
RD-5 24.4 1%
RD-4 2.9 0.1%
RD-3 32.0 1%
RD-1.8 20.2 1%
Sub-Total Residential 2206.0 79%
PB 18.9 1%
OB 10.9 0.4%
LB 35.9 1%
CB 30.2 1%
GB 10.5 0.4%
LI 163.1 6%
HI 72.4 3%
WD 56.2 2%
WP 196.0 7%
Sub-Total Non-Residential 594.1 21%
City-Wide Total 2,800.1 100%
Prepared by Frederick P. Clark Associates
Note: The land areas shown do not include roadways or the area comprised of the Fishkill
Creek. Land areas were calculated based on total parcel areas within each zoning district.
The additional roadway and Fishkill Creek areas comprise approximately 300 acres.
Inventory and Analysis Land Use, Zoning and Development Potential
City of Beacon Comprehensive Plan (March 2006) II-11
D. Development Potential Analysis
A development potential analysis identifies the potential location and amount of
additional development possible according to the land use regulations of a community.
This analysis represents an important step in evaluating the possible long-term
implications of Beacon’s existing zoning and other land use regulations. The analysis
does not, in any way, recommend the development of the City according to the scenarios
presented herein. Rather, the analysis allows a consideration of what the impact would
be if the City was built out to the maximum extent permitted by the laws currently in
place.
The Development Potential Analysis was divided into three groups:
1. The large undeveloped or underdeveloped properties in Beacon, identified by
numbers on the Study Areas map, and detailed in a table in the Appendix.
2. The industrial properties with vacant buildings and/or vacant land, identified by
letters on the Study Areas map, and detailed in a table in the Appendix.
3. The area around Main Street, which is shown on the Study Areas map and detailed
in a table in the Appendix.
A summary of the methods and results of the Development Potential Analysis for the
City of Beacon is provided below.
Large Undeveloped Properties and Vacant Industrial Properties
Using the land use map, an accumulated general knowledge of the City, and records of
the New York State Office of Real Property Services, the study identified all of the
properties capable of being developed in a manner that would result in at least 5 new
housing units, or significant areas of new or (for the vacant industrial properties)
renovated commercial space (see Study Areas map and Table X1, below). Properties in
recreational use that are owned by the City or the State, as well as other government-
owned properties such as the prison, the sewage treatment facility, and school properties
were considered to be undevelopable. On the other hand, privately-owned recreational
properties, such as the property owned by the Southern Dutchess Country Club, were
considered, for the purposes of this study, to be developable.
Once the lots are identified, the next step was to identify the factors that would affect the
development potential of each lot. The factors included:
City zoning classification;
City zoning regulations regarding parking requirements for various types of uses;
New York State Department of Environmental Conservation wetlands (DEC
wetlands) and the adjacent 100-foot regulated buffer;
Inventory and Analysis Land Use, Zoning and Development Potential
City of Beacon Comprehensive Plan (March 2006) II-12
Waterbodies, including the Fishkill River and the Dry Brook, including DEC
control over stream beds and banks, or 50-foot buffer areas where stream banks
cannot be identified;
Wetlands identified on the National Wetland Inventory (NWI wetlands);
Slopes in excess of 25%
Method of Analysis
The development potential of each single-family zoned lot selected in the manner
described above was calculated by subtracting 15 percent of gross lot area to account for
infrastructure (including roads and stormwater management systems), and for all lots by
subtracting for areas with steep slopes and wetlands and buffers, when applicable. The
City does not currently require buffers for wetlands, so only those properties with
wetlands or watercourses regulated by the DEC had land subtracted from gross lot area
for wetland buffers. Stormwater management infrastructure was not deducted from lot
area for lots allowing multi-family or commercial uses, since it is at least potentially
feasible to locate these facilities underground.
For the parcels zoned single-family residential, the remaining net developable lot area
was then divided by the minimum lot area of the respective district in which the property
is located to yield the estimated number of total lots and dwelling units on the properties
that were evaluated. Where properties have been or are currently in the development
process before the City’s Planning Board, actual proposed numbers of lots and units are
also included.
For parcels zoned for commercial uses, the net lot area was divided by 3.05, which is a
figure derived from an equation that assumed nearly total coverage of the property with
an on-site minimally landscaped parking area and a three story building of maximum size
according to the floor area ratio. The equation also used an average parking lot size of
545 square feet per parking space, and a parking requirement based on the more intense
types of commercial uses (such as offices and retail), which require one parking space for
every 200 square feet of floor area. The equation was:
(lot size) = (parking area) + (square foot floor area) / 3 , where
parking area = ((square foot floor area) / 200) * 545 and where
lot size is given for each lot based on previous calculations (net lot area) and
square foot floor area was the unknown variable for each lot.
Inventory and Analysis Land Use, Zoning and Development Potential
City of Beacon Comprehensive Plan (March 2006) II-13
Parcels zoned for multi-family uses employed the same method, but adjusted the equation
regarding parking area calculations to divide the square foot floor area by one parking
space for each 900 square feet of building area (a rough approximation of an average-size
apartment) plus a ½ parking space for each apartment with an assumed average of two
bedrooms, which was then multiplied by 545 square feet for each parking space. These
calculations reflect the parking spaces required by City Code.
The development potential analysis was facilitated by the use of Geographic Information
Systems (GIS) technology. The GIS links different sources of geographic data, such as
the City’s lot line base map and zoning map with environmental data such as the location
of wetlands and steep slopes. The use of GIS allowed the consideration of zoning
requirements, lot sizes, and environmental considerations on a parcel-by-parcel basis for
more precise and realistic measurements than would have been available in the past.
Results of Calculations and Analysis
The development potential of the large undeveloped parcels in Beacon is substantial, with
approximately 1,000 new residential units possible, and over 500,000 square feet of
additional commercial building area. A total of approximately 164 residential units have
already been proposed in these areas, and 167,100 square feet of commercial space has
been proposed (at Long Dock). Since the total of all the large undeveloped parcels is
approximately 425 acres, it is fairly likely that this potential development – particularly
the residential portion of it- will occur unless land use regulations are changed.
The large vacant and underutilized industrial properties also have significant
development potential, although the maximum developable floor area is no greater for the
total of these lots than the total of existing building floor areas. In general, the existing
buildings exceed the floor areas that would be permitted under current zoning and
parking regulations. The development potential for these properties includes
approximately 750,000 square feet of building space, and up to 1,827 residential units.
(The potential building space could be used for residential purposes or for other, non-
residential purposes. The development potential for these properties is not the sum of the
two.) With a total of 276 residential units and approximately 330,000 square feet of
building area currently proposed for the properties in this group, the likelihood of the
future redevelopment of these properties within the next 10 to 20 years is high. Site-
specific factors, such as the results of environmental testing and brownfield funding
sources will influence the rate of development of these properties.
Main Street Area
The development potential of properties in the Main Street Study Area was calculated
according to the relationship between the size of the existing structures on each property
and the maximum size structure permitted by the Central Business District regulations.
Inventory and Analysis Land Use, Zoning and Development Potential
City of Beacon Comprehensive Plan (March 2006) II-14
Since front setbacks are not required and side and rear setbacks are only required if
adjacent to residential districts, 100 percent of the area of most lots could theoretically be
developed. The significant constraints are: (1) the maximum floor area ratio of 2
(meaning a building’s floor area can be up to twice the lot area) and (2) parking
requirements according to use. There are no significant environmental constraints, such
as steep slopes or wetlands, along Main Street. For Main Street, two types of parking
requirements were used – one for commercial uses of the more intense types (such as
office or retail) at one parking space per 200 square feet of building floor area; and one
for residential uses based on the maximum number of residential units permitted in the
District (which allows a maximum of one unit per 1,500 square feet of lot area) which
translates to one unit for every 2,000 square feet of potential residential area. Assuming
an apartment of this size could be a 3-bedroom apartment, 1.75 parking spaces per
apartment was calculated. While stormwater management requirements are also a
potential constraint on the maximum development potential of a lot, in order to estimate
the fullest extent of development possible, it was assumed that stormwater facilities could
be located underground.
The calculations provided by the development potential analysis are just a first step in
determining the actual development potential of an area. A determination of what is
theoretically possible under existing regulations does not address the likelihood of a
collection of individual property owners actually investing in the kind of improvements
that would bring about maximum levels of development on multiple properties. These
economic realities and historical trends in the rate of development on Main Street are
discussed in the “Analysis of Results” section below.
Two Scenarios
Two scenarios were developed to project the effect of the ‘full build-out’ of Main Street.
In the first scenario, 100 percent of the uses along Main Street were calculated as
commercial, including all floors of each building. This generated a parking requirement
well beyond the capacity of the PB (Business Off-Street Parking) District. Since
residential uses require considerably less parking per square foot of building area, and
since one of the principles of creating vibrant downtown districts is including significant
amounts of residential space, a second scenario was generated where all buildings are
constructed to maximum capacity, but the second and third floors are used entirely for
residential purposes. This scenario, which nearly maximizes residential uses to the extent
allowed in the District, also generated a need (according to City parking standards) for
parking that exceeds the capacity of the area. Therefore, a third scenario in which
commercial uses occupied two-thirds of building area and residential uses one-third was
judged to be superfluous for the purposes of the exercise, which is to determine the
maximum development possible and the associated impacts of the new development.
Inventory and Analysis Land Use, Zoning and Development Potential
City of Beacon Comprehensive Plan (March 2006) II-15
Method of Analysis
The development potential of each lot on Main Street was estimated by calculating the
total area of each lot and multiplying that figure by a factor of 2 (the maximum floor
area ratio for the CB District). Total building floor area was calculated by estimating the
building footprint using GIS and aerial photography, and then by multiplying the
building footprint area by the number of floors for each building, which was determined
through field work.
Under the ‘Existing Conditions’ section, the parking spaces that would be required by
existing City Code were calculated assuming one parking space for every 200 square
feet of first floor area, and 1½ parking spaces for every 900 square feet of floor area
above the first floor. These calculations were not adjusted according to the actual uses
occurring on each property, but rather were general in nature in order to establish a
collective benchmark for the entire existing condition of Main Street. The lot area not
covered by the building was calculated under the column titled “Area Available for
Parking.” This is not, of course, a recommendation to use all outdoor areas on Main
Street for parking, but rather an important step in determining the existing conditions
regarding a major development constraint.
Scenario 1, which assumed 100 percent commercial uses (retail, service businesses, and
offices) and three-story buildings for all of Main Street, calculated the total building
area, lot area available for parking, parking spaces and parking area of each property, as
well as the grand total of these. Then these figures were compared with existing
conditions to estimate the additional floor area, loss of lot area available for parking,
additional required parking spaces, and additional parking area that could occur beyond
what is already existing.
Scenario 2 followed the same methods of Scenario 1, except that the total floor area was
divided into two uses: two-thirds of the maximum floor area was considered residential
(the top two floors) and one-third was considered commercial. Since the building
envelopes of Scenario 1 and Scenario 2 are identical, lot area available for parking is the
same in each scenario. The number of required parking spaces, however, is considerably
different, due to the lower number of parking spaces required per square foot of
residential floor space. Total lot area was divided by 1,500 square feet per residential
unit, rounding down for fractions. In the section of the table titled “Additional
(Excluding Existing)” the scenario was compared with existing conditions as if the uses
of existing properties were divided in the same way, with commercial on the first floor
and residential on any floors that may be above that. This broad assumption was
necessary to arrive at a generalized figure comparing the total effects of the build-out of
this scenario with existing conditions.
Inventory and Analysis Land Use, Zoning and Development Potential
City of Beacon Comprehensive Plan (March 2006) II-16
Parking Requirements
The parking requirements described in the City Code generally require each lot to
provide its own off-street parking on-site, but also allow businesses located within the
Parking Overlay District – which covers the entire CB (Central Business) District – to
pay a fee to the City in lieu of providing parking on-site. The Code also allows the
conveyance of land to the City for the same purposes, as well as parking on an adjoining
lot with sufficient legal arrangements preserving the parking arrangement. Therefore,
parking requirements do not constrain the development potential of an individual lot on
Main Street, but the entire area faces a collective constraint of providing enough parking
for the total of all of the uses of the area.
The PB (Business Off-Street Parking) District currently provides a total of approximately
434 off-street parking spaces, which consumes approximately 190,000 square feet of land
area. An additional 740,000 square feet of non-parking developed area remains within
the district, with the numerous existing land uses detailed above. The PB District is
approximately 825,000 square feet (19 acres) in area and presently consists of a mix of
uses, including one office use, three retail or service uses, and 83 lots with residential
uses, totaling approximately 116 residential units. The District also includes vacant lots,
5 of which are devoted to parking uses. Some lots also run continuously through both the
CB and the PB districts, and parking is often found in the rear portion of these lots. The
District allows for uses typical of a residential zone or business parking.
The CB (Central Business) District currently provides a total of approximately 203
parking spaces in public and patron parking lots (approximately 183,000 square feet),
plus 263 on-street parking spaces. These spaces combined with those parking spaces in
the PB District add up to 900 parking spaces and 373,000 square feet.
An analysis of parking must also take into account existing and potential parking areas
within the CB District. There are 26 existing lots in the CB District without buildings on
them, comprising 190,000 square feet. Many of these lots are currently used for parking.
If Main Street were developed to its fullest, approximately two-thirds of this area would
be covered by buildings, resulting in a loss of 127,000 square feet of potential parking
area. Also, most existing buildings in the CB District do not completely cover the lots,
with approximately 790,000 square feet of undeveloped land area (mostly in back yards)
in parcels that also contain buildings. Currently, due to a fragmented development
pattern at the rear of these lots, and due to the lack of demand for parking, most of this
land area is not used for parking. Under either of the two scenarios, up to one-third of
each lot would still be available for parking. Due to design and layout considerations,
perhaps a maximum of two-thirds of this area could actually be used for parking. These
parking areas would total 320,000 square feet.
Inventory and Analysis Land Use, Zoning and Development Potential
City of Beacon Comprehensive Plan (March 2006) II-17
The amount of parking that would be required of the existing buildings if they were all
built according to today’s City Code would be approximately 3,123 off-street parking
spaces, which would require between 1.25 million and 1.7 million square feet of parking
area, depending upon the amount of landscaping required and the efficiency of the layout.
The existing 900 parking spaces are 2,223 parking spaces short of what would currently
be required. In terms of percentages, the parking currently provided represents
approximately 29 percent of what would be required by City Code.
The total parking area that could theoretically be provided under both scenarios would be
approximately 1,145,000 square feet, consisting of the 825,000 square feet in the PB
District and 320,000 square feet in the CB District. This represents 870,000 square feet
of potential new parking area, consisting of 130,000 square feet in the CB District and
740,000 square feet in the PB District. Scenario 1 would require approximately 14,700
parking spaces in the downtown area, which would consume between 5.9 million and 8
million square feet, depending on the amount of landscaping required in the parking
areas, and the level of layout efficiency achievable. Scenario 2 would require
approximately 6,500 parking spaces, which would consume between 2.6 million and 3.5
million square feet of land for parking areas.
All available surface parking areas, including the back yard areas within the CB District
and the entire PB (Business Off-Street Parking) District area would be completely
consumed by surface parking (and the associated landscaping required) at between 18
and 25 percent of full build-out of Scenario 1, and between 55 and 75 percent of full
build-out of Scenario 2. If some or all of the area of the PB District were to be converted
to surface parking, this would reduce the net residential and non-residential building
areas by the amount currently existing in the District. This development potential model
does not attempt to estimate additional development in this area if developed to the
maximum extent allowed. If structured parking were introduced, the development
potential of Main Street would also increase beyond the percentages stated above. This
analysis does not attempt to estimate the additional development potential of Main Street
if one or more parking structures were introduced, since these do not appear to be
permitted uses within the District.
Results of Calculations
The land along Beacon’s Main Street, zoned CB (Central Business) currently supports
buildings with approximately 890,000 square feet of floor area. The floor area could be
expanded to nearly 3 million square feet under existing zoning. Therefore, the built
environment of Beacon’s Main Street could theoretically triple in size, if parking were
not a consideration.
But parking considerations ultimately limit what is possible to develop on Main Street.
As discussed above, both Scenario 1 (100 percent commercial uses) and Scenario 2 (one-
Inventory and Analysis Land Use, Zoning and Development Potential
City of Beacon Comprehensive Plan (March 2006) II-18
third commercial and two-thirds residential) would run out of the parking area required
by City Code at between 18 and 72 percent of potential additional building area.
Under Scenario 1, the maximum floor area that could be developed is approximately
508,000 square feet. Depending on the amount of landscaping required by the City for
parking areas and the efficiency of the lot layout, the figure may be lower, at 373,000
square feet. For more detailed results, please see the table in the appendix.
Under Scenario 2, the maximum floor area that could be developed would be 1,568,000
square feet, which would consist of approximately 390,000 square feet of commercial
space and 1,178,000 square feet of residential space. The additional residential space
would translate into 521 additional residential units, using the density allowed by the
RMF-1.5, which is what is required in the CB District. This works out to 2,000 square-
foot minimum sized apartments. Again, depending on the amount of landscaping
required by the City and the efficiency of the lot layout, these figures may be less: the
total square footage could be as low as 1,151,000 square feet, which would break down to
286,000 square feet of commercial uses and 865,000 square feet of residential uses, and
383 new apartments. For more detailed results, please see the table in the appendix.
Because these calculations examine only theoretical maximums and not likely futures in
the near term, the development potential analysis does not attempt to study the impacts of
the potential new development. Impacts would include additional vehicles on the
roadways and, under Scenario 2, additional population.
Analysis of Results
We feel that this study shows that Beacon’s Main Street has considerable development
potential, but we would caution against interpreting this potential as a prediction.
Because all but 26 of the 184 properties in this study area are developed with buildings,
and because most lots in the District are relatively small and narrow, most properties
would be very costly to develop to the fullest extent permitted by zoning. Furthermore,
only four new buildings have been constructed on Main Street in the past 25 years, and
few if any additions have been constructed during the same time period.
The buildings constructed on Main Street since 1981 include:
297 Main Street, on the corner of Brett and Main (2 buildings that total 3,737
square feet)
381-391 Main Street, on the corner of Veterans Place and Main (1 building with
16,500 square feet)
340 Main Street, on the corner of Eliza and Main (1 building with 7,414 square
feet)
403 Main Street, on the corner of Teller Avenue and Main (1 building with 1,591
square feet)
Inventory and Analysis Land Use, Zoning and Development Potential
City of Beacon Comprehensive Plan (March 2006) II-19
Construction on Main Street is certainly occurring, but the focus has been on renovations
and alterations of existing structures. The Building Department reports that there were 27
significant building permits issued in 2005 for properties on Main Street, ranging from
several thousand dollars of work to approximately 1 million dollars invested. The
Building Department estimates that more than half of the buildings on Main Street have
been renovated within the last decade. This level of investment in improvements of real
property on Main Street exceeds that of the past several decades. Currently, there are
only 6 to 8 vacant properties that are not currently being actively used or renovated on
Main Street. If this trend were to continue, it is possible that developers would have
sufficient incentive to engage in new construction projects within the District, ranging
from additions to demolitions and reconstruction.
In conclusion, we feel that it is reasonable to expect within the next 20 to 25 years as
much as three times the development that occurred on Main Street in the past 25 years.
This would be approximately 87,000 square feet of new building floor area. This rate of
development is highly dependent on local and regional economic factors, including the
population and income levels of households in local and regional market areas, the fate of
competing regional commercial centers, and other factors. We feel that, in spite of the
large theoretical development potential of Main Street, the City has sufficient control of
development through the Environmental Quality Review process, and through the option
to review and update zoning regulations as local conditions change.
Summary – Combined Development Potential of All Study Areas
The development potential of all of the study areas combined is 3,365 new residential
units and 1.8 million square feet of non-residential building floor area. It should be noted
that these two figures are generally mutually exclusive regarding the Main Street study
area and the Vacant Industrial areas, as well as three commercially zoned properties in
the study area containing large undeveloped parcels. This means that the non-residential
building floor areas calculated for these areas would apply only if these areas were
developed wholly for non-residential purposes, and vice-versa. Since a mix of uses in
each study area is more likely, the maximum development potential of a mix both
residential and non-residential uses is approximately 2,000 residential units and 1 million
square feet of non-residential building floor area. Please refer to the tables on the next
page for an itemization of these totals by study area, and a comparison with existing and
proposed units and building areas.
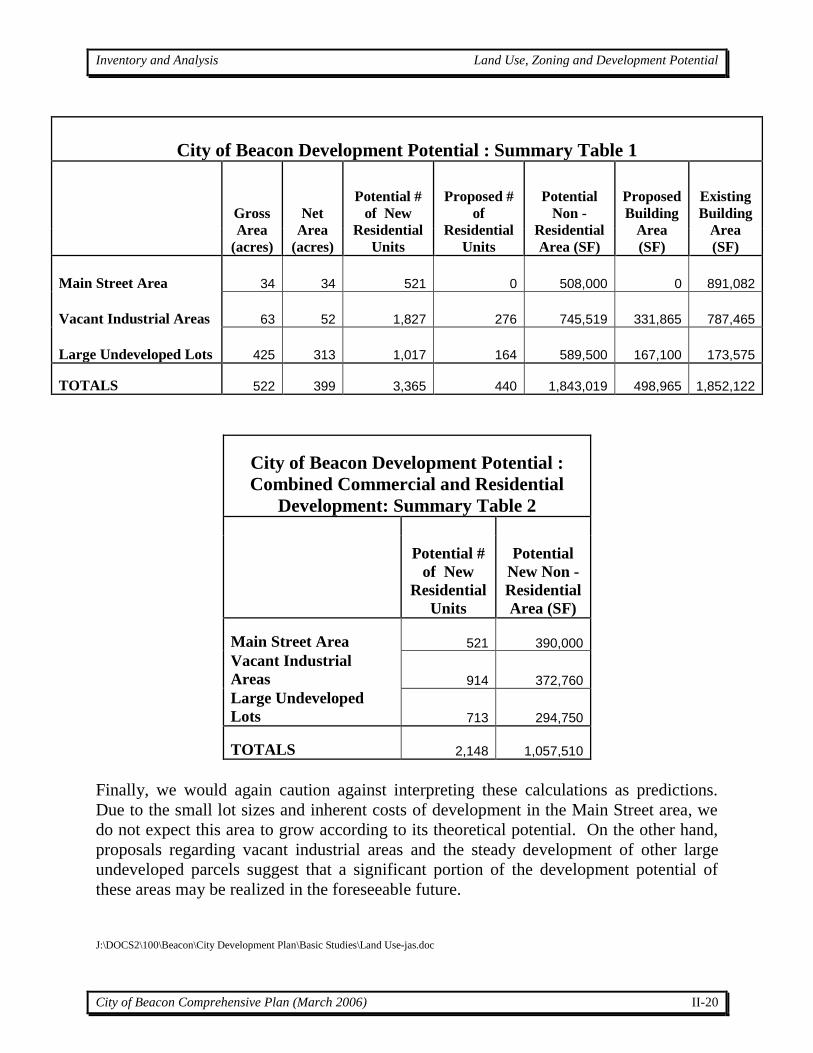
Inventory and Analysis Land Use, Zoning and Development Potential
City of Beacon Comprehensive Plan (March 2006) II-20
City of Beacon Development Potential : Summary Table 1
Gross
Area
(acres)
Net
Area
(acres)
Potential #
of New
Residential
Units
Proposed #
of
Residential
Units
Potential
Non -
Residential
Area (SF)
Proposed
Building
Area
(SF)
Existing
Building
Area
(SF)
Main Street Area 34 34 521 0 508,000 0 891,082
Vacant Industrial Areas 63 52 1,827 276 745,519 331,865 787,465
Large Undeveloped Lots 425 313 1,017 164 589,500 167,100 173,575
TOTALS 522 399 3,365 440 1,843,019 498,965 1,852,122
City of Beacon Development Potential :
Combined Commercial and Residential
Development: Summary Table 2
Potential #
of New
Residential
Units
Potential
New Non -
Residential
Area (SF)
Main Street Area 521 390,000
Vacant Industrial
Areas 914 372,760
Large Undeveloped
Lots 713 294,750
TOTALS 2,148 1,057,510
Finally, we would again caution against interpreting these calculations as predictions.
Due to the small lot sizes and inherent costs of development in the Main Street area, we
do not expect this area to grow according to its theoretical potential. On the other hand,
proposals regarding vacant industrial areas and the steady development of other large
undeveloped parcels suggest that a significant portion of the development potential of
these areas may be realized in the foreseeable future.
J:\DOCS2\100\Beacon\City Development Plan\Basic Studies\Land Use-jas.doc
Inventory and Analysis Traffic Circulation and Parking Facilities
City of Beacon Comprehensive Plan (March 2006) III-1
III. TRAFFIC CIRCULATION AND PARKING FACILITITES
A. Traffic Circulation Frederick P. Clark Associates has conducted a review of traffic conditions along the Main Street Corridor. As part of this effort, we conducted an inventory of Main Street and the intersecting roadways and performed a general analysis of traffic and circulation in and around the Main Street Business District. Main Street, also designated Business Route 52, provides access to commercial, retail and residential properties. Main Street begins at the intersection of North Avenue and Wolcott Avenue, also designated Route 9D, and extends to the east before terminating at a dead end north of Herbert Street. It provides two travel lanes, a double yellow centerline, curbs and on-street parking. The posted speed limit for the City of Beacon is 30 miles per hour. A majority of the roadways intersecting with Main Street are unsignalized with the exception of three locations. The following intersections with Main Street are controlled with traffic signals; North Avenue/Wolcott Avenue (Route 9D), Chestnut Street and Fishkill Avenue/Teller Avenue. The remaining intersections are two-way stop sign controlled with right-of-way provided to Main Street. The unsignalized intersections are typically one-way streets and all permit on-street parking. The following is an inventory of all roadways intersecting with Main Street; North Avenue/Wolcott Avenue (Route 9D) – two-way, signalized intersections with
left turns lanes provided on the northbound and southbound approaches and a designated right turn lane on the westbound approach of Main Street;
South Avenue – two-way, unsignalized, “T”-type intersection with signage prohibiting left turn movements onto Main Street;
Cross Street – one-way northbound, unsignalized “T”-type intersection; Cliff Street - one-way southbound, unsignalized “T”-type intersection; Willow Street – two-way, unsignalized “T”-type intersection; Digger Phelps Court - one-way northbound, unsignalized “T”-type intersection; Elm Street - one-way northbound, unsignalized intersection; Walnut Street - one-way southbound, unsignalized intersection; Brett Street - one-way northbound, unsignalized intersection; Ceder Street - one-way northbound and one-way southbound, unsignalized
intersection;
Inventory and Analysis Traffic Circulation and Parking Facilities
City of Beacon Comprehensive Plan (March 2006) III-2
Chestnut Street – two-way, signalized intersection; Eliza Street - one-way northbound, unsignalized “T”-type intersection; Veterans Place - two-way, unsignalized, “T”-type intersection; Fishkill Avenue/Teller Avenue – two-way, signalized intersection; Schenck Avenue - two-way, unsignalized, “T”-type intersection; Tioronda Avenue - two-way, unsignalized, “T”-type intersection; Churchill - two-way, unsignalized, “T”-type intersection; South Street - one-way eastbound, unsignalized “T”-type intersection; North Street - one-way eastbound, unsignalized “T”-type intersection; East Main Street – two-way, unsignalized “T” type intersection with small traffic
circle created by ground-mounted yellow beacon; Verplanck Avenue - two-way, unsignalized “T” type intersection; Ackerman Street - two-way, unsignalized “T” type intersection; and Herbert Street - two-way, unsignalized “T” type intersection with additional STOP
sign directed toward the southbound approach of Main Street. The Beacon Shuttle provides service along the full length of Main Street. The Shuttle is part of the Dutchess County LOOP Bus System and provides service throughout the day on Saturdays and Sundays from the downtown area to the Metro-North Train Station. The time schedule for the Shuttle is coordinated with the arrival and departure times of the Metro-North Train Schedule. At most Shuttle stop locations, the shuttle will stop 13 times during the day. Field observations during the weekday peak periods identify acceptable levels of traffic congestion and delays. These delays are considered typical for a downtown area. At the signalized intersections, vehicle queues of three to four vehicles were routinely observed. These queues cleared without difficulty during the green phase. The attached figure, titled Traffic Circulation Plan, presents the street characteristics of Main Street and the adjacent roadways. The figure identifies traffic control, lane designations and roadway orientations and is provided at the end of this report.
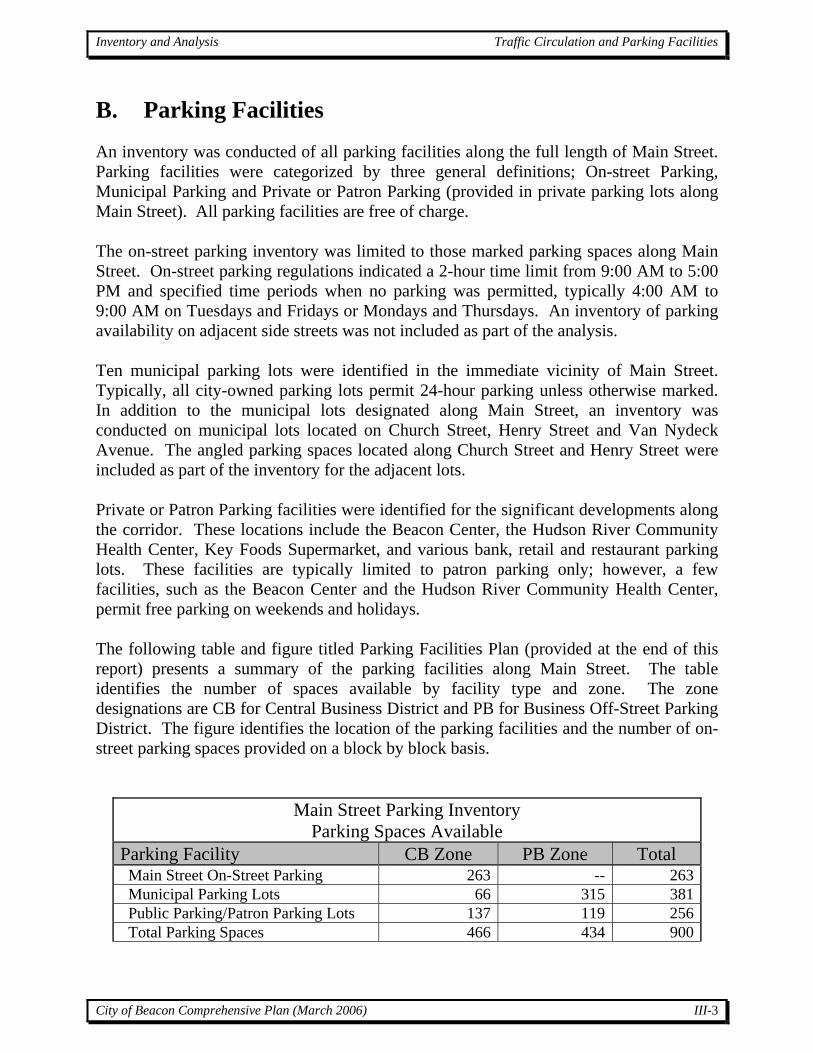
Inventory and Analysis Traffic Circulation and Parking Facilities
City of Beacon Comprehensive Plan (March 2006) III-3
B. Parking Facilities An inventory was conducted of all parking facilities along the full length of Main Street. Parking facilities were categorized by three general definitions; On-street Parking, Municipal Parking and Private or Patron Parking (provided in private parking lots along Main Street). All parking facilities are free of charge. The on-street parking inventory was limited to those marked parking spaces along Main Street. On-street parking regulations indicated a 2-hour time limit from 9:00 AM to 5:00 PM and specified time periods when no parking was permitted, typically 4:00 AM to 9:00 AM on Tuesdays and Fridays or Mondays and Thursdays. An inventory of parking availability on adjacent side streets was not included as part of the analysis. Ten municipal parking lots were identified in the immediate vicinity of Main Street. Typically, all city-owned parking lots permit 24-hour parking unless otherwise marked. In addition to the municipal lots designated along Main Street, an inventory was conducted on municipal lots located on Church Street, Henry Street and Van Nydeck Avenue. The angled parking spaces located along Church Street and Henry Street were included as part of the inventory for the adjacent lots. Private or Patron Parking facilities were identified for the significant developments along the corridor. These locations include the Beacon Center, the Hudson River Community Health Center, Key Foods Supermarket, and various bank, retail and restaurant parking lots. These facilities are typically limited to patron parking only; however, a few facilities, such as the Beacon Center and the Hudson River Community Health Center, permit free parking on weekends and holidays. The following table and figure titled Parking Facilities Plan (provided at the end of this report) presents a summary of the parking facilities along Main Street. The table identifies the number of spaces available by facility type and zone. The zone designations are CB for Central Business District and PB for Business Off-Street Parking District. The figure identifies the location of the parking facilities and the number of on-street parking spaces provided on a block by block basis.
Main Street Parking Inventory Parking Spaces Available
Parking Facility CB Zone PB Zone Total Main Street On-Street Parking 263 -- 263 Municipal Parking Lots 66 315 381 Public Parking/Patron Parking Lots 137 119 256 Total Parking Spaces 466 434 900
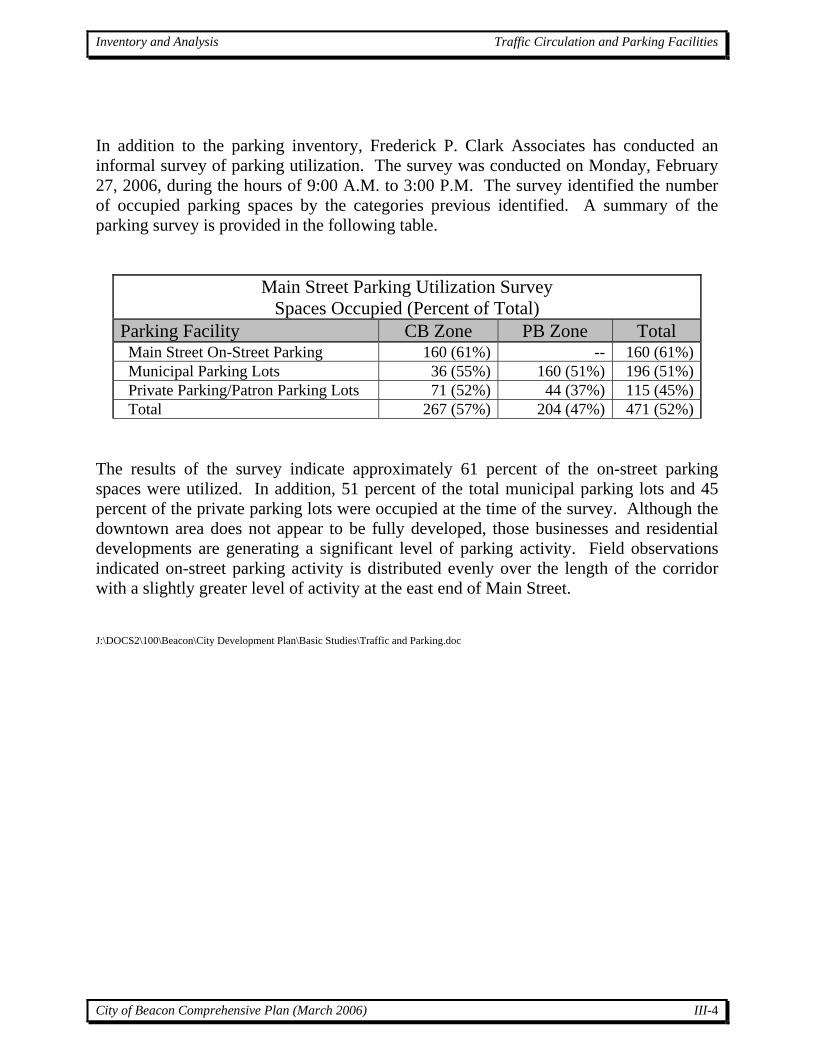
Inventory and Analysis Traffic Circulation and Parking Facilities
City of Beacon Comprehensive Plan (March 2006) III-4
In addition to the parking inventory, Frederick P. Clark Associates has conducted an informal survey of parking utilization. The survey was conducted on Monday, February 27, 2006, during the hours of 9:00 A.M. to 3:00 P.M. The survey identified the number of occupied parking spaces by the categories previous identified. A summary of the parking survey is provided in the following table.
Main Street Parking Utilization Survey Spaces Occupied (Percent of Total)
Parking Facility CB Zone PB Zone Total Main Street On-Street Parking 160 (61%) -- 160 (61%) Municipal Parking Lots 36 (55%) 160 (51%) 196 (51%) Private Parking/Patron Parking Lots 71 (52%) 44 (37%) 115 (45%) Total 267 (57%) 204 (47%) 471 (52%)
The results of the survey indicate approximately 61 percent of the on-street parking spaces were utilized. In addition, 51 percent of the total municipal parking lots and 45 percent of the private parking lots were occupied at the time of the survey. Although the downtown area does not appear to be fully developed, those businesses and residential developments are generating a significant level of parking activity. Field observations indicated on-street parking activity is distributed evenly over the length of the corridor with a slightly greater level of activity at the east end of Main Street. J:\DOCS2\100\Beacon\City Development Plan\Basic Studies\Traffic and Parking.doc
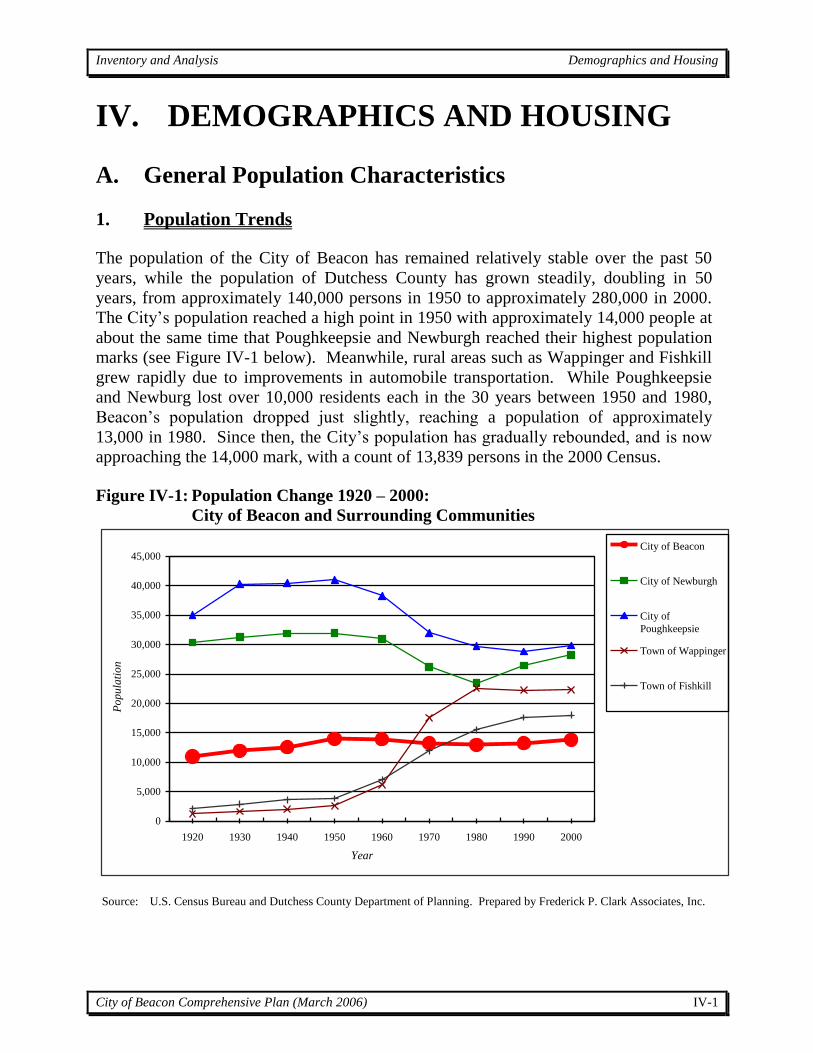
Inventory and Analysis Demographics and Housing
City of Beacon Comprehensive Plan (March 2006) IV-1
IV. DEMOGRAPHICS AND HOUSING
A. General Population Characteristics
1. Population Trends
The population of the City of Beacon has remained relatively stable over the past 50
years, while the population of Dutchess County has grown steadily, doubling in 50
years, from approximately 140,000 persons in 1950 to approximately 280,000 in 2000.
The City’s population reached a high point in 1950 with approximately 14,000 people at
about the same time that Poughkeepsie and Newburgh reached their highest population
marks (see Figure IV-1 below). Meanwhile, rural areas such as Wappinger and Fishkill
grew rapidly due to improvements in automobile transportation. While Poughkeepsie
and Newburg lost over 10,000 residents each in the 30 years between 1950 and 1980,
Beacon’s population dropped just slightly, reaching a population of approximately
13,000 in 1980. Since then, the City’s population has gradually rebounded, and is now
approaching the 14,000 mark, with a count of 13,839 persons in the 2000 Census.
Figure IV-1: Population Change 1920 – 2000:
City of Beacon and Surrounding Communities
0
5,000
10,000
15,000
20,000
25,000
30,000
35,000
40,000
45,000
1920 1930 1940 1950 1960 1970 1980 1990 2000
Year
Popula
tion
City of Beacon
City of Newburgh
City of
Poughkeepsie
Town of Wappinger
Town of Fishkill
Source: U.S. Census Bureau and Dutchess County Department of Planning. Prepared by Frederick P. Clark Associates, Inc.
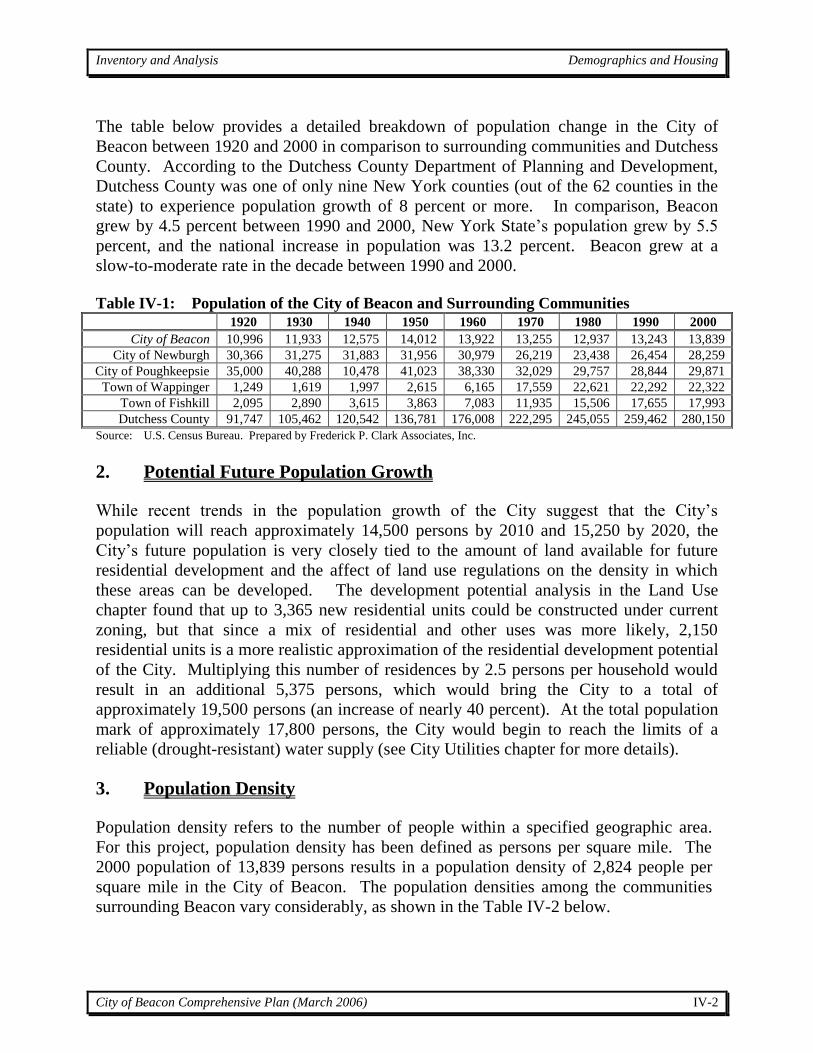
Inventory and Analysis Demographics and Housing
City of Beacon Comprehensive Plan (March 2006) IV-2
The table below provides a detailed breakdown of population change in the City of
Beacon between 1920 and 2000 in comparison to surrounding communities and Dutchess
County. According to the Dutchess County Department of Planning and Development,
Dutchess County was one of only nine New York counties (out of the 62 counties in the
state) to experience population growth of 8 percent or more. In comparison, Beacon
grew by 4.5 percent between 1990 and 2000, New York State’s population grew by 5.5
percent, and the national increase in population was 13.2 percent. Beacon grew at a
slow-to-moderate rate in the decade between 1990 and 2000.
Table IV-1: Population of the City of Beacon and Surrounding Communities
1920 1930 1940 1950 1960 1970 1980 1990 2000
City of Beacon 10,996 11,933 12,575 14,012 13,922 13,255 12,937 13,243 13,839
City of Newburgh 30,366 31,275 31,883 31,956 30,979 26,219 23,438 26,454 28,259
City of Poughkeepsie 35,000 40,288 10,478 41,023 38,330 32,029 29,757 28,844 29,871
Town of Wappinger 1,249 1,619 1,997 2,615 6,165 17,559 22,621 22,292 22,322
Town of Fishkill 2,095 2,890 3,615 3,863 7,083 11,935 15,506 17,655 17,993
Dutchess County 91,747 105,462 120,542 136,781 176,008 222,295 245,055 259,462 280,150
Source: U.S. Census Bureau. Prepared by Frederick P. Clark Associates, Inc.
2. Potential Future Population Growth
While recent trends in the population growth of the City suggest that the City’s
population will reach approximately 14,500 persons by 2010 and 15,250 by 2020, the
City’s future population is very closely tied to the amount of land available for future
residential development and the affect of land use regulations on the density in which
these areas can be developed. The development potential analysis in the Land Use
chapter found that up to 3,365 new residential units could be constructed under current
zoning, but that since a mix of residential and other uses was more likely, 2,150
residential units is a more realistic approximation of the residential development potential
of the City. Multiplying this number of residences by 2.5 persons per household would
result in an additional 5,375 persons, which would bring the City to a total of
approximately 19,500 persons (an increase of nearly 40 percent). At the total population
mark of approximately 17,800 persons, the City would begin to reach the limits of a
reliable (drought-resistant) water supply (see City Utilities chapter for more details).
3. Population Density
Population density refers to the number of people within a specified geographic area.
For this project, population density has been defined as persons per square mile. The
2000 population of 13,839 persons results in a population density of 2,824 people per
square mile in the City of Beacon. The population densities among the communities
surrounding Beacon vary considerably, as shown in the Table IV-2 below.
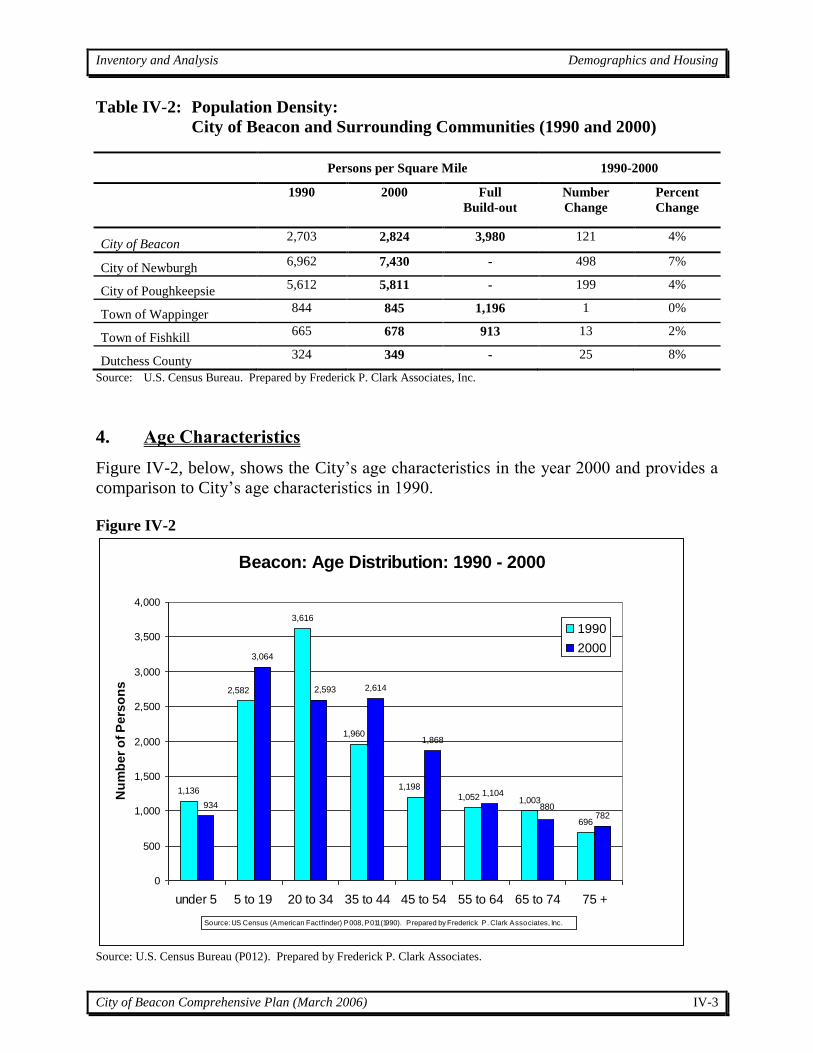
Inventory and Analysis Demographics and Housing
City of Beacon Comprehensive Plan (March 2006) IV-3
Table IV-2: Population Density:
City of Beacon and Surrounding Communities (1990 and 2000)
Persons per Square Mile 1990-2000
1990 2000 Full
Build-out
Number
Change
Percent
Change
City of Beacon 2,703 2,824 3,980 121 4%
City of Newburgh 6,962 7,430 - 498 7%
City of Poughkeepsie 5,612 5,811 - 199 4%
Town of Wappinger 844 845 1,196 1 0%
Town of Fishkill 665 678 913 13 2%
Dutchess County 324 349 - 25 8%
Source: U.S. Census Bureau. Prepared by Frederick P. Clark Associates, Inc.
4. Age Characteristics
Figure IV-2, below, shows the City’s age characteristics in the year 2000 and provides a
comparison to City’s age characteristics in 1990.
Figure IV-2
Beacon: Age Distribution: 1990 - 2000
1,136
3,616
1,003
696
3,064
2,614
1,868
782
2,582
1,960
1,198
1,052880934
2,593
1,104
0
500
1,000
1,500
2,000
2,500
3,000
3,500
4,000
under 5 5 to 19 20 to 34 35 to 44 45 to 54 55 to 64 65 to 74 75 +
Nu
mb
er
of
Pe
rso
ns
1990
2000
Source: US Census (American Factfinder) P008, P011 (1990). Prepared by Frederick P. Clark Associates, Inc.
Source: U.S. Census Bureau (P012). Prepared by Frederick P. Clark Associates.
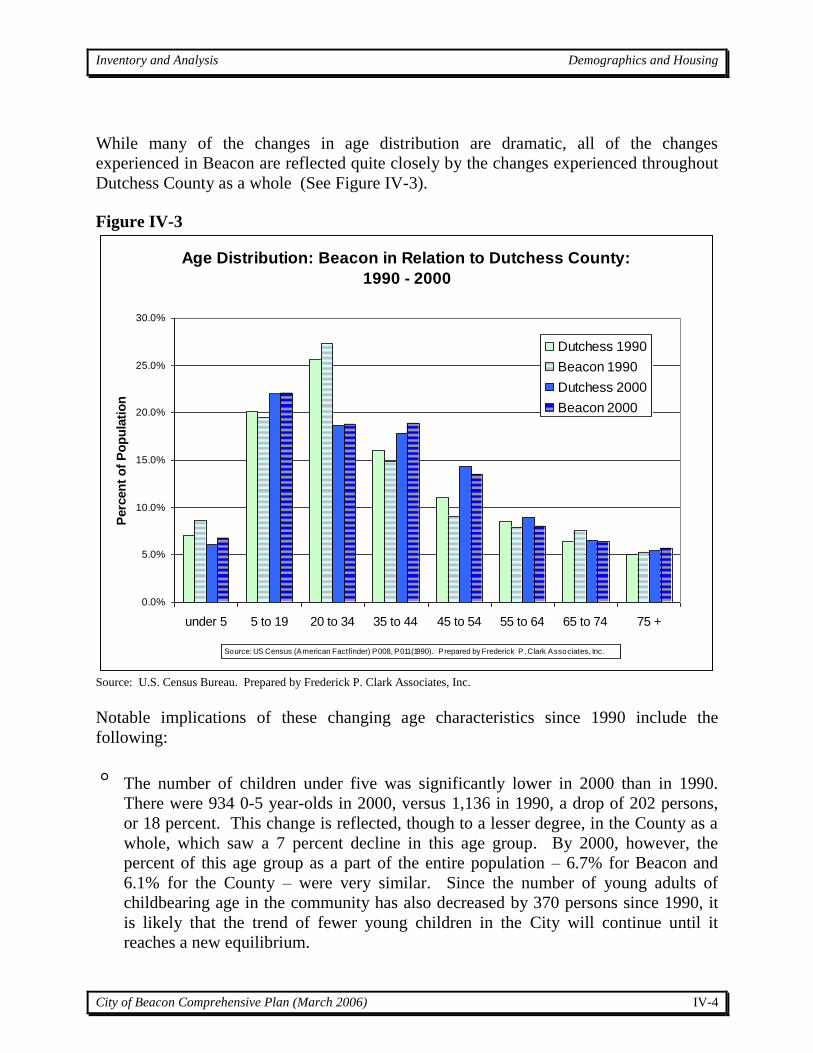
Inventory and Analysis Demographics and Housing
City of Beacon Comprehensive Plan (March 2006) IV-4
While many of the changes in age distribution are dramatic, all of the changes
experienced in Beacon are reflected quite closely by the changes experienced throughout
Dutchess County as a whole (See Figure IV-3).
Figure IV-3
Age Distribution: Beacon in Relation to Dutchess County:
1990 - 2000
0.0%
5.0%
10.0%
15.0%
20.0%
25.0%
30.0%
under 5 5 to 19 20 to 34 35 to 44 45 to 54 55 to 64 65 to 74 75 +
Perc
en
t o
f P
op
ula
tio
n
Dutchess 1990
Beacon 1990
Dutchess 2000
Beacon 2000
Source: US Census (American Factfinder) P008, P011 (1990). Prepared by Frederick P. Clark Associates, Inc.
Source: U.S. Census Bureau. Prepared by Frederick P. Clark Associates, Inc.
Notable implications of these changing age characteristics since 1990 include the
following:
° The number of children under five was significantly lower in 2000 than in 1990.
There were 934 0-5 year-olds in 2000, versus 1,136 in 1990, a drop of 202 persons,
or 18 percent. This change is reflected, though to a lesser degree, in the County as a
whole, which saw a 7 percent decline in this age group. By 2000, however, the
percent of this age group as a part of the entire population – 6.7% for Beacon and
6.1% for the County – were very similar. Since the number of young adults of
childbearing age in the community has also decreased by 370 persons since 1990, it
is likely that the trend of fewer young children in the City will continue until it
reaches a new equilibrium.
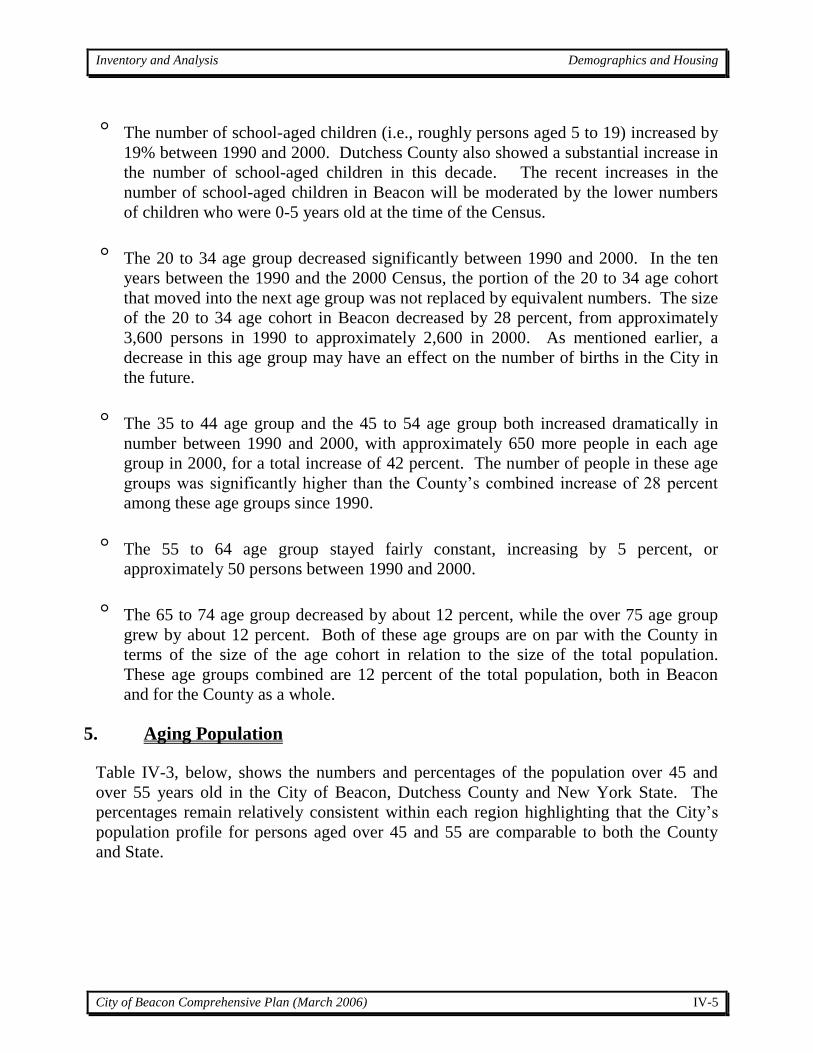
Inventory and Analysis Demographics and Housing
City of Beacon Comprehensive Plan (March 2006) IV-5
° The number of school-aged children (i.e., roughly persons aged 5 to 19) increased by
19% between 1990 and 2000. Dutchess County also showed a substantial increase in
the number of school-aged children in this decade. The recent increases in the
number of school-aged children in Beacon will be moderated by the lower numbers
of children who were 0-5 years old at the time of the Census.
° The 20 to 34 age group decreased significantly between 1990 and 2000. In the ten
years between the 1990 and the 2000 Census, the portion of the 20 to 34 age cohort
that moved into the next age group was not replaced by equivalent numbers. The size
of the 20 to 34 age cohort in Beacon decreased by 28 percent, from approximately
3,600 persons in 1990 to approximately 2,600 in 2000. As mentioned earlier, a
decrease in this age group may have an effect on the number of births in the City in
the future.
° The 35 to 44 age group and the 45 to 54 age group both increased dramatically in
number between 1990 and 2000, with approximately 650 more people in each age
group in 2000, for a total increase of 42 percent. The number of people in these age
groups was significantly higher than the County’s combined increase of 28 percent
among these age groups since 1990.
° The 55 to 64 age group stayed fairly constant, increasing by 5 percent, or
approximately 50 persons between 1990 and 2000.
° The 65 to 74 age group decreased by about 12 percent, while the over 75 age group
grew by about 12 percent. Both of these age groups are on par with the County in
terms of the size of the age cohort in relation to the size of the total population.
These age groups combined are 12 percent of the total population, both in Beacon
and for the County as a whole.
5. Aging Population
Table IV-3, below, shows the numbers and percentages of the population over 45 and
over 55 years old in the City of Beacon, Dutchess County and New York State. The
percentages remain relatively consistent within each region highlighting that the City’s
population profile for persons aged over 45 and 55 are comparable to both the County
and State.

Inventory and Analysis Demographics and Housing
City of Beacon Comprehensive Plan (March 2006) IV-6
Table IV-3: Beacon’s Population over 45
Persons % of Population
45 + 55+ 45+ 55+
Beacon 4,634 2,766 33.5% 20.0%
Dutchess County 99,023 58,884 35.3% 21.0%
New York State 6,689,275 4,136,339 35.3% 21.8% Source: U.S. Census Bureau. Prepared by Frederick P. Clark Associates, Inc.
Table IV-6, below, shows the calculation of age group shifts in Beacon over time taking
into account average cohort survival rates drawn from the New York State averages. It
should be noted that the effects of in-migration and out-migration are unaccounted for.
Table IV-4: Calculation of Age Group Shifts in Beacon over Time
Population (2000)
Projected
Deaths
Population
Adjusted with Age
Group Shift (2010)
Projected
Deaths
Population
Adjusted with Age
Group Shift (2020)
(2000-
2010)
(2010-
2020)
2,614 46 45-54 2,568 106 55-64 2,462
1,868 77 55-64 1,791 167 65-74 1,624
1,104 103 65-74 1,001 223 75-84 778
880 196 75-84 684 363 85+ 386
573 304 85+ 312 248
209 166
Sources: U.S. Census Bureau, using average death rates from the CDC. Prepared by Frederick P. Clark Associates, Inc.
Figure IV-5, below, shows the dramatic increases that will occur over the next twenty
years in the elderly segments of the population. In the next twenty years, the number of
people in the 55-64 age group will increase from 2,238 to 3,870, an increase of 73%. The
65-74 age group will double (from 1,419 to 2,888). Similarly, the 75-84 age group will
more than double (from 614 to 1,578), and the most elderly age group will increase
dramatically as well.
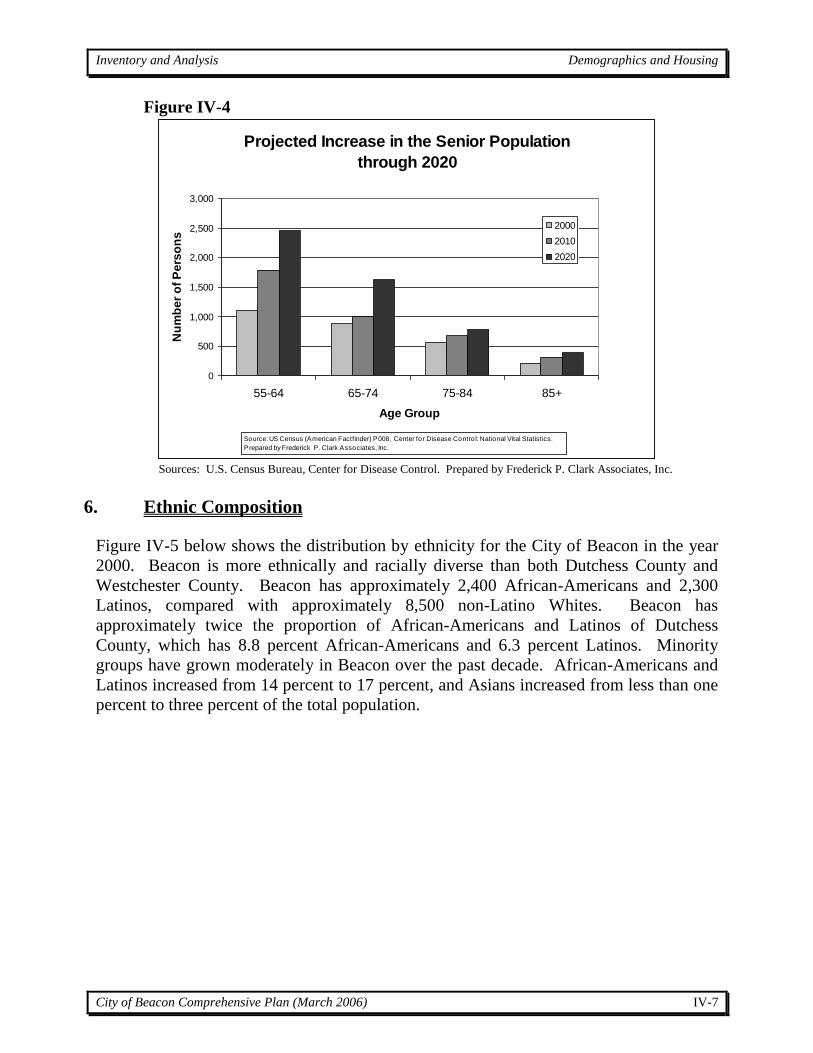
Inventory and Analysis Demographics and Housing
City of Beacon Comprehensive Plan (March 2006) IV-7
Figure IV-4
Projected Increase in the Senior Population
through 2020
0
500
1,000
1,500
2,000
2,500
3,000
55-64 65-74 75-84 85+
Age Group
Nu
mb
er
of
Pe
rso
ns
2000
2010
2020
Source: US Census (American Factfinder) P008, Center for Disease Contro l: National Vital Statistics.
Prepared by Frederick P. Clark Associates, Inc.
Sources: U.S. Census Bureau, Center for Disease Control. Prepared by Frederick P. Clark Associates, Inc.
6. Ethnic Composition
Figure IV-5 below shows the distribution by ethnicity for the City of Beacon in the year
2000. Beacon is more ethnically and racially diverse than both Dutchess County and
Westchester County. Beacon has approximately 2,400 African-Americans and 2,300
Latinos, compared with approximately 8,500 non-Latino Whites. Beacon has
approximately twice the proportion of African-Americans and Latinos of Dutchess
County, which has 8.8 percent African-Americans and 6.3 percent Latinos. Minority
groups have grown moderately in Beacon over the past decade. African-Americans and
Latinos increased from 14 percent to 17 percent, and Asians increased from less than one
percent to three percent of the total population.
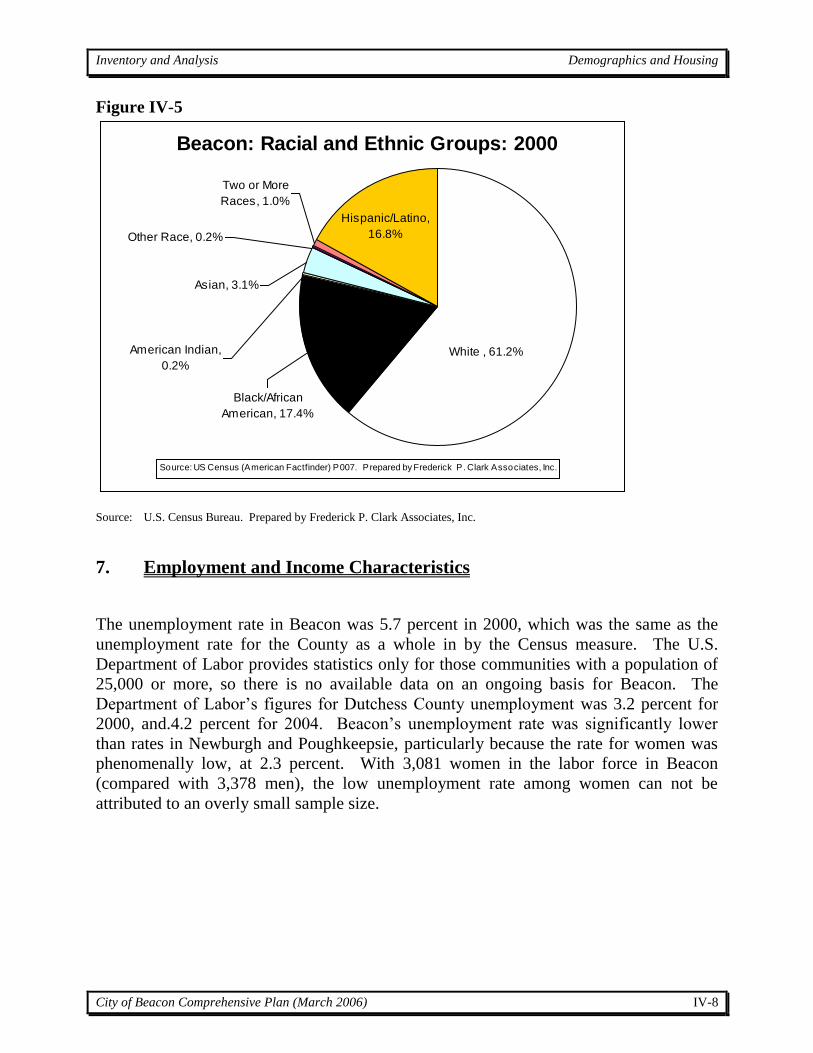
Inventory and Analysis Demographics and Housing
City of Beacon Comprehensive Plan (March 2006) IV-8
Figure IV-5
Beacon: Racial and Ethnic Groups: 2000
American Indian,
0.2%
Other Race, 0.2%
White , 61.2%
Black/African
American, 17.4%
Two or More
Races, 1.0%
Hispanic/Latino,
16.8%
Asian, 3.1%
Source: US Census (American Factfinder) P007. Prepared by Frederick P. Clark Associates, Inc.
Source: U.S. Census Bureau. Prepared by Frederick P. Clark Associates, Inc.
7. Employment and Income Characteristics
The unemployment rate in Beacon was 5.7 percent in 2000, which was the same as the
unemployment rate for the County as a whole in by the Census measure. The U.S.
Department of Labor provides statistics only for those communities with a population of
25,000 or more, so there is no available data on an ongoing basis for Beacon. The
Department of Labor’s figures for Dutchess County unemployment was 3.2 percent for
2000, and.4.2 percent for 2004. Beacon’s unemployment rate was significantly lower
than rates in Newburgh and Poughkeepsie, particularly because the rate for women was
phenomenally low, at 2.3 percent. With 3,081 women in the labor force in Beacon
(compared with 3,378 men), the low unemployment rate among women can not be
attributed to an overly small sample size.
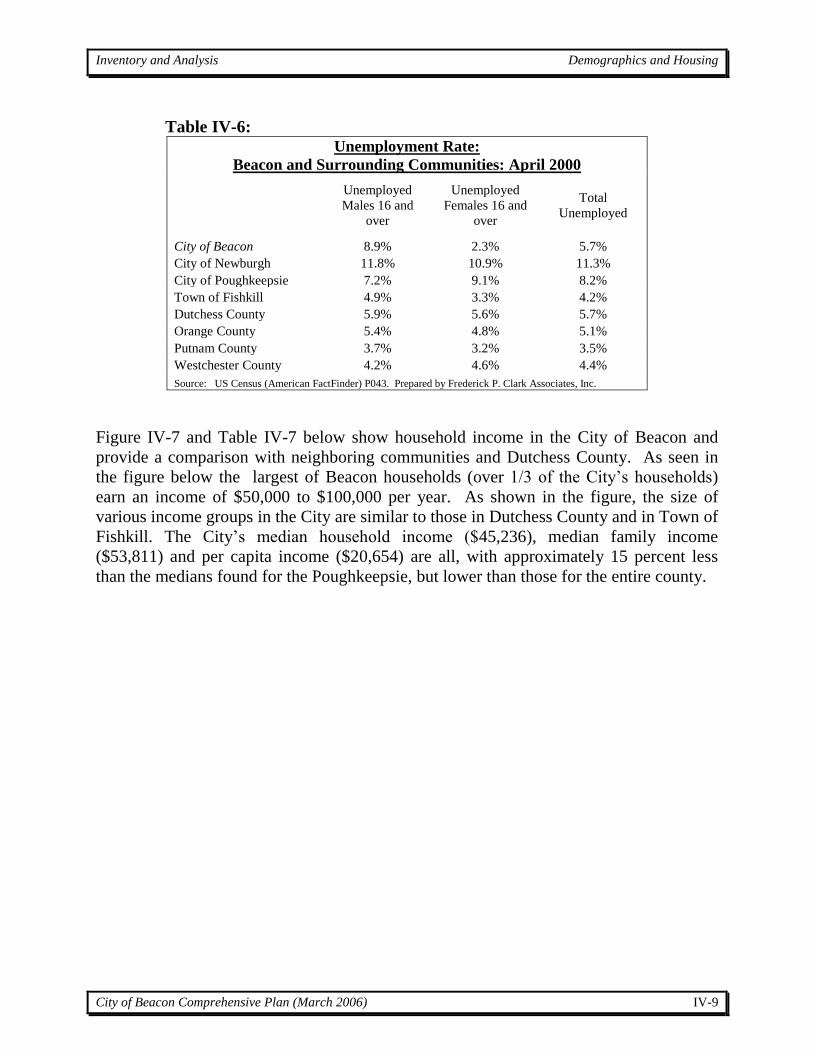
Inventory and Analysis Demographics and Housing
City of Beacon Comprehensive Plan (March 2006) IV-9
Table IV-6: Unemployment Rate:
Beacon and Surrounding Communities: April 2000
Unemployed
Males 16 and
over
Unemployed
Females 16 and
over
Total
Unemployed
City of Beacon 8.9% 2.3% 5.7%
City of Newburgh 11.8% 10.9% 11.3%
City of Poughkeepsie 7.2% 9.1% 8.2%
Town of Fishkill 4.9% 3.3% 4.2%
Dutchess County 5.9% 5.6% 5.7%
Orange County 5.4% 4.8% 5.1%
Putnam County 3.7% 3.2% 3.5%
Westchester County 4.2% 4.6% 4.4%
Source: US Census (American FactFinder) P043. Prepared by Frederick P. Clark Associates, Inc.
Figure IV-7 and Table IV-7 below show household income in the City of Beacon and
provide a comparison with neighboring communities and Dutchess County. As seen in
the figure below the largest of Beacon households (over 1/3 of the City’s households)
earn an income of $50,000 to $100,000 per year. As shown in the figure, the size of
various income groups in the City are similar to those in Dutchess County and in Town of
Fishkill. The City’s median household income ($45,236), median family income
($53,811) and per capita income ($20,654) are all, with approximately 15 percent less
than the medians found for the Poughkeepsie, but lower than those for the entire county.
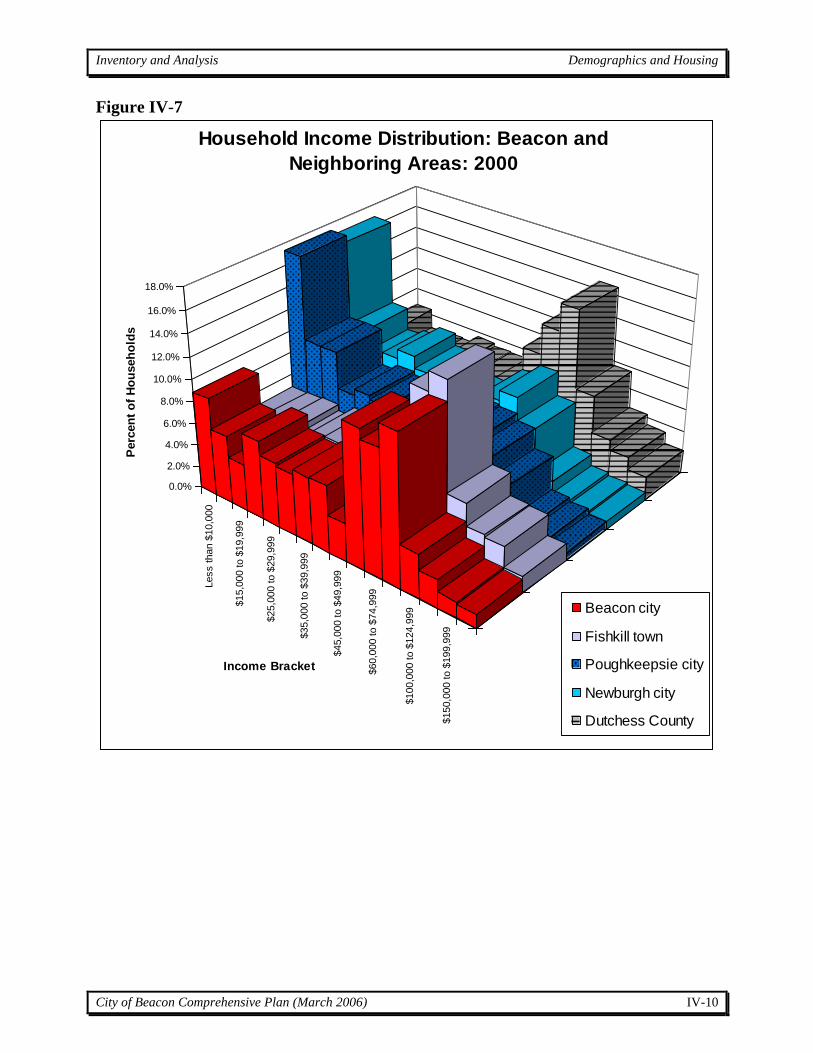
Inventory and Analysis Demographics and Housing
City of Beacon Comprehensive Plan (March 2006) IV-10
Figure IV-7
Less than $
10,0
00
$15,0
00 to $
19,9
99
$25,0
00 to $
29,9
99
$35,0
00 to $
39,9
99
$45,0
00 to $
49,9
99
$60,0
00 to $
74,9
99
$100,0
00 to $
124,9
99
$150,0
00 to $
199,9
99
0.0%
2.0%
4.0%
6.0%
8.0%
10.0%
12.0%
14.0%
16.0%
18.0%
Perc
en
t o
f H
ou
seh
old
s
Income Bracket
Household Income Distribution: Beacon and
Neighboring Areas: 2000
Beacon city
Fishkill town
Poughkeepsie city
Newburgh city
Dutchess County
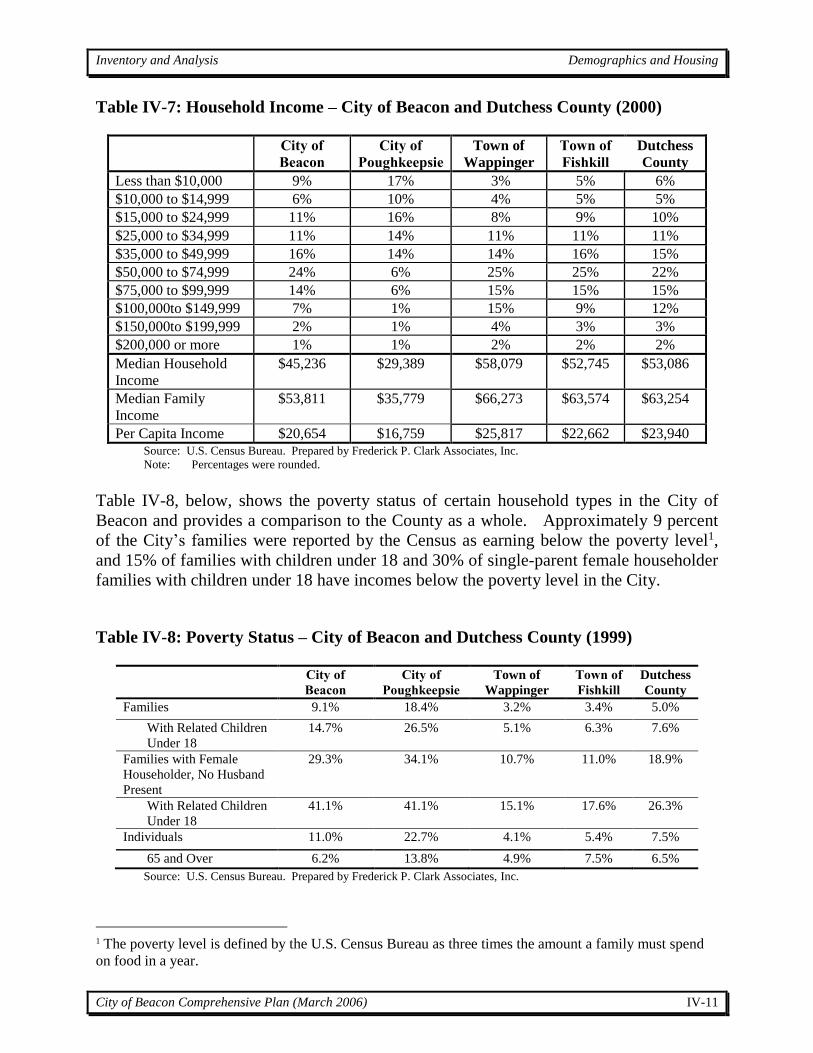
Inventory and Analysis Demographics and Housing
City of Beacon Comprehensive Plan (March 2006) IV-11
Table IV-7: Household Income – City of Beacon and Dutchess County (2000)
City of
Beacon
City of
Poughkeepsie
Town of
Wappinger
Town of
Fishkill
Dutchess
County
Less than $10,000 9% 17% 3% 5% 6%
$10,000 to $14,999 6% 10% 4% 5% 5%
$15,000 to $24,999 11% 16% 8% 9% 10%
$25,000 to $34,999 11% 14% 11% 11% 11%
$35,000 to $49,999 16% 14% 14% 16% 15%
$50,000 to $74,999 24% 6% 25% 25% 22%
$75,000 to $99,999 14% 6% 15% 15% 15%
$100,000to $149,999 7% 1% 15% 9% 12%
$150,000to $199,999 2% 1% 4% 3% 3%
$200,000 or more 1% 1% 2% 2% 2%
Median Household
Income
$45,236 $29,389 $58,079 $52,745 $53,086
Median Family
Income
$53,811 $35,779 $66,273 $63,574 $63,254
Per Capita Income $20,654 $16,759 $25,817 $22,662 $23,940 Source: U.S. Census Bureau. Prepared by Frederick P. Clark Associates, Inc.
Note: Percentages were rounded.
Table IV-8, below, shows the poverty status of certain household types in the City of
Beacon and provides a comparison to the County as a whole. Approximately 9 percent
of the City’s families were reported by the Census as earning below the poverty level1,
and 15% of families with children under 18 and 30% of single-parent female householder
families with children under 18 have incomes below the poverty level in the City.
Table IV-8: Poverty Status – City of Beacon and Dutchess County (1999)
City of
Beacon
City of
Poughkeepsie
Town of
Wappinger
Town of
Fishkill
Dutchess
County
Families 9.1% 18.4% 3.2% 3.4% 5.0%
With Related Children
Under 18
14.7% 26.5% 5.1% 6.3% 7.6%
Families with Female
Householder, No Husband
Present
29.3% 34.1% 10.7% 11.0% 18.9%
With Related Children
Under 18
41.1% 41.1% 15.1% 17.6% 26.3%
Individuals 11.0% 22.7% 4.1% 5.4% 7.5%
65 and Over 6.2% 13.8% 4.9% 7.5% 6.5%
Source: U.S. Census Bureau. Prepared by Frederick P. Clark Associates, Inc.
1 The poverty level is defined by the U.S. Census Bureau as three times the amount a family must spend
on food in a year.
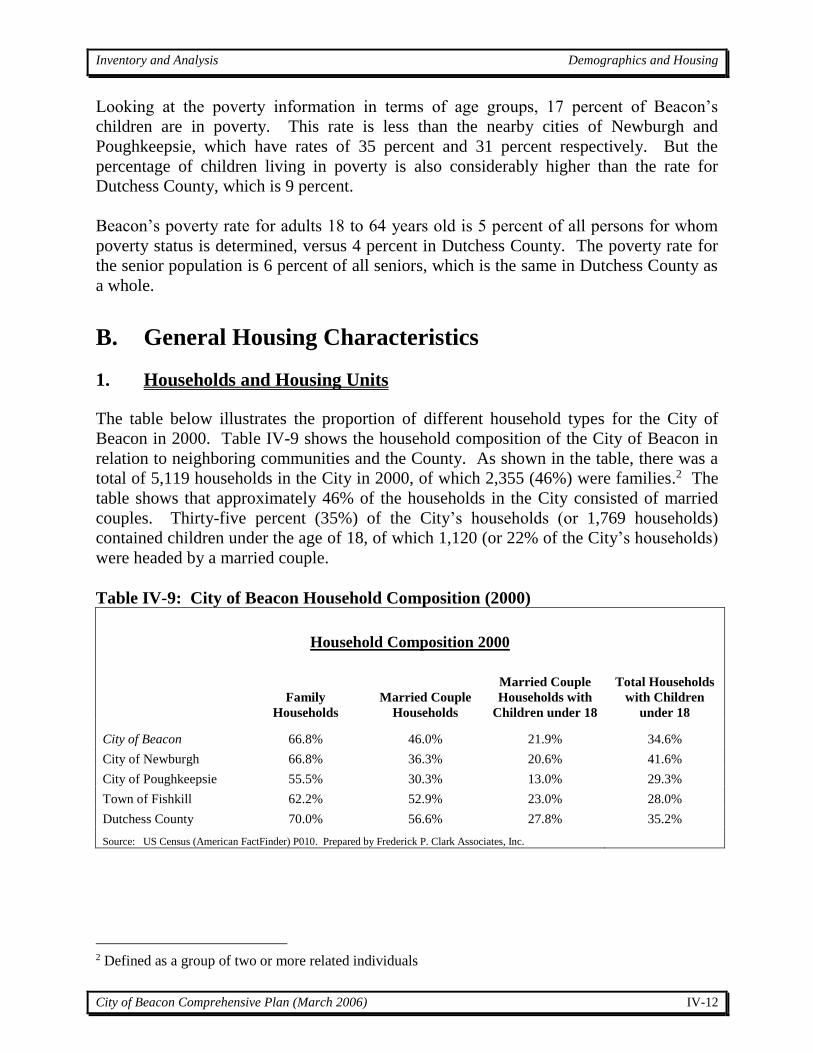
Inventory and Analysis Demographics and Housing
City of Beacon Comprehensive Plan (March 2006) IV-12
Looking at the poverty information in terms of age groups, 17 percent of Beacon’s
children are in poverty. This rate is less than the nearby cities of Newburgh and
Poughkeepsie, which have rates of 35 percent and 31 percent respectively. But the
percentage of children living in poverty is also considerably higher than the rate for
Dutchess County, which is 9 percent.
Beacon’s poverty rate for adults 18 to 64 years old is 5 percent of all persons for whom
poverty status is determined, versus 4 percent in Dutchess County. The poverty rate for
the senior population is 6 percent of all seniors, which is the same in Dutchess County as
a whole.
B. General Housing Characteristics
1. Households and Housing Units
The table below illustrates the proportion of different household types for the City of
Beacon in 2000. Table IV-9 shows the household composition of the City of Beacon in
relation to neighboring communities and the County. As shown in the table, there was a
total of 5,119 households in the City in 2000, of which 2,355 (46%) were families.2 The
table shows that approximately 46% of the households in the City consisted of married
couples. Thirty-five percent (35%) of the City’s households (or 1,769 households)
contained children under the age of 18, of which 1,120 (or 22% of the City’s households)
were headed by a married couple.
Table IV-9: City of Beacon Household Composition (2000)
Household Composition 2000
Family
Households
Married Couple
Households
Married Couple
Households with
Children under 18
Total Households
with Children
under 18
City of Beacon 66.8% 46.0% 21.9% 34.6%
City of Newburgh 66.8% 36.3% 20.6% 41.6%
City of Poughkeepsie 55.5% 30.3% 13.0% 29.3%
Town of Fishkill 62.2% 52.9% 23.0% 28.0%
Dutchess County 70.0% 56.6% 27.8% 35.2%
Source: US Census (American FactFinder) P010. Prepared by Frederick P. Clark Associates, Inc.
2 Defined as a group of two or more related individuals
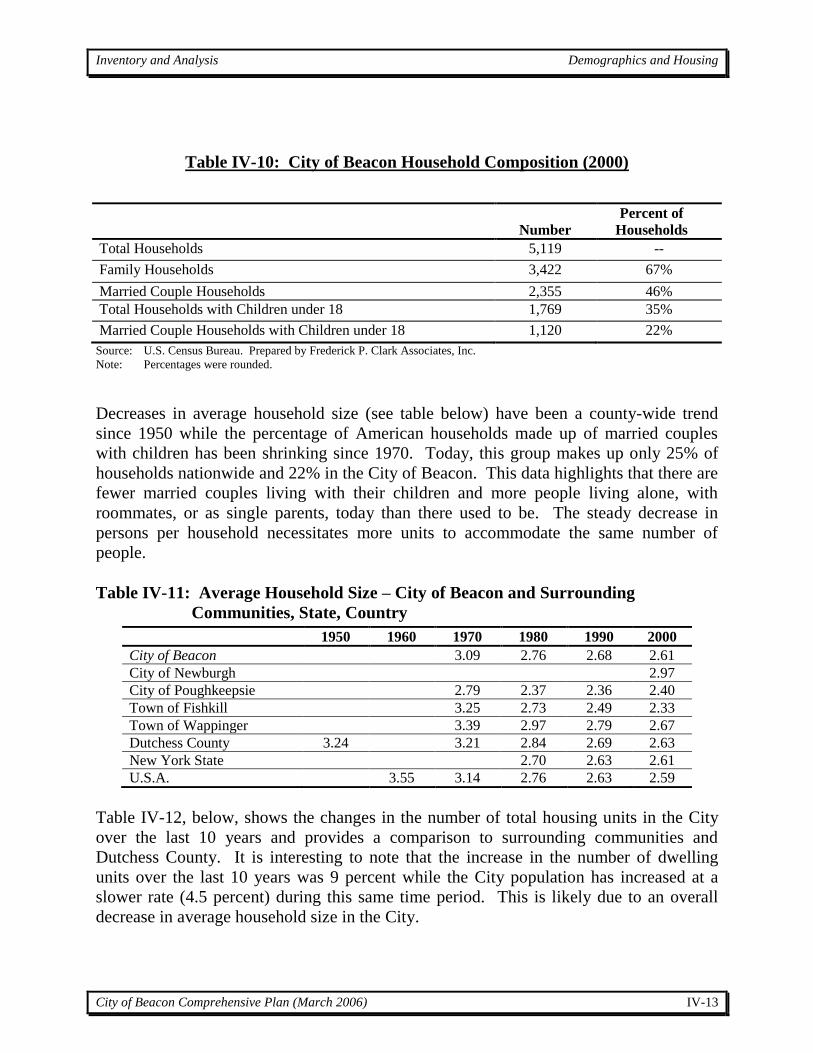
Inventory and Analysis Demographics and Housing
City of Beacon Comprehensive Plan (March 2006) IV-13
Table IV-10: City of Beacon Household Composition (2000)
Source: U.S. Census Bureau. Prepared by Frederick P. Clark Associates, Inc.
Note: Percentages were rounded.
Decreases in average household size (see table below) have been a county-wide trend
since 1950 while the percentage of American households made up of married couples
with children has been shrinking since 1970. Today, this group makes up only 25% of
households nationwide and 22% in the City of Beacon. This data highlights that there are
fewer married couples living with their children and more people living alone, with
roommates, or as single parents, today than there used to be. The steady decrease in
persons per household necessitates more units to accommodate the same number of
people.
Table IV-11: Average Household Size – City of Beacon and Surrounding
Communities, State, Country
Table IV-12, below, shows the changes in the number of total housing units in the City
over the last 10 years and provides a comparison to surrounding communities and
Dutchess County. It is interesting to note that the increase in the number of dwelling
units over the last 10 years was 9 percent while the City population has increased at a
slower rate (4.5 percent) during this same time period. This is likely due to an overall
decrease in average household size in the City.
Number
Percent of
Households
Total Households 5,119 --
Family Households 3,422 67%
Married Couple Households 2,355 46%
Total Households with Children under 18 1,769 35%
Married Couple Households with Children under 18 1,120 22%
1950 1960 1970 1980 1990 2000
City of Beacon 3.09 2.76 2.68 2.61
City of Newburgh 2.97
City of Poughkeepsie 2.79 2.37 2.36 2.40
Town of Fishkill 3.25 2.73 2.49 2.33
Town of Wappinger 3.39 2.97 2.79 2.67
Dutchess County 3.24 3.21 2.84 2.69 2.63
New York State 2.70 2.63 2.61
U.S.A. 3.55 3.14 2.76 2.63 2.59
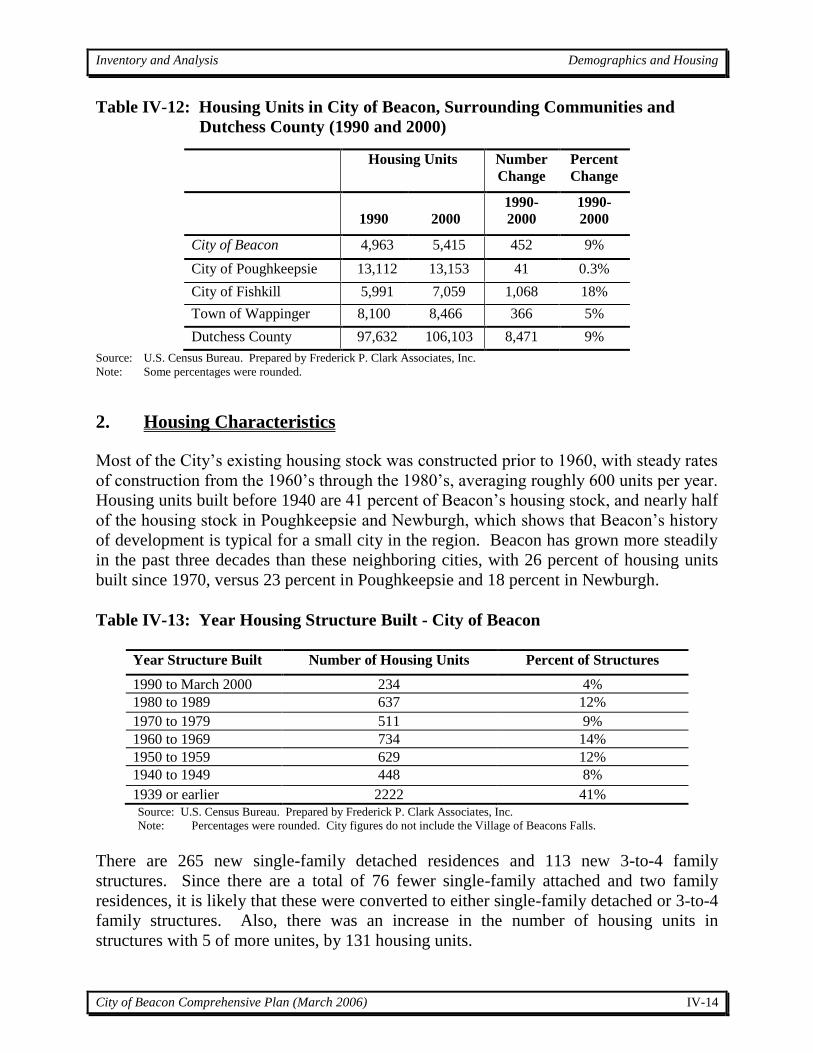
Inventory and Analysis Demographics and Housing
City of Beacon Comprehensive Plan (March 2006) IV-14
Table IV-12: Housing Units in City of Beacon, Surrounding Communities and
Dutchess County (1990 and 2000)
Housing Units Number
Change
Percent
Change
1990
2000
1990-
2000
1990-
2000
City of Beacon 4,963 5,415 452 9%
City of Poughkeepsie 13,112 13,153 41 0.3%
City of Fishkill 5,991 7,059 1,068 18%
Town of Wappinger 8,100 8,466 366 5%
Dutchess County 97,632 106,103 8,471 9%
Source: U.S. Census Bureau. Prepared by Frederick P. Clark Associates, Inc. Note: Some percentages were rounded.
2. Housing Characteristics
Most of the City’s existing housing stock was constructed prior to 1960, with steady rates
of construction from the 1960’s through the 1980’s, averaging roughly 600 units per year.
Housing units built before 1940 are 41 percent of Beacon’s housing stock, and nearly half
of the housing stock in Poughkeepsie and Newburgh, which shows that Beacon’s history
of development is typical for a small city in the region. Beacon has grown more steadily
in the past three decades than these neighboring cities, with 26 percent of housing units
built since 1970, versus 23 percent in Poughkeepsie and 18 percent in Newburgh.
Table IV-13: Year Housing Structure Built - City of Beacon
Year Structure Built Number of Housing Units Percent of Structures
1990 to March 2000 234 4%
1980 to 1989 637 12%
1970 to 1979 511 9%
1960 to 1969 734 14%
1950 to 1959 629 12%
1940 to 1949 448 8%
1939 or earlier 2222 41% Source: U.S. Census Bureau. Prepared by Frederick P. Clark Associates, Inc.
Note: Percentages were rounded. City figures do not include the Village of Beacons Falls.
There are 265 new single-family detached residences and 113 new 3-to-4 family
structures. Since there are a total of 76 fewer single-family attached and two family
residences, it is likely that these were converted to either single-family detached or 3-to-4
family structures. Also, there was an increase in the number of housing units in
structures with 5 of more unites, by 131 housing units.
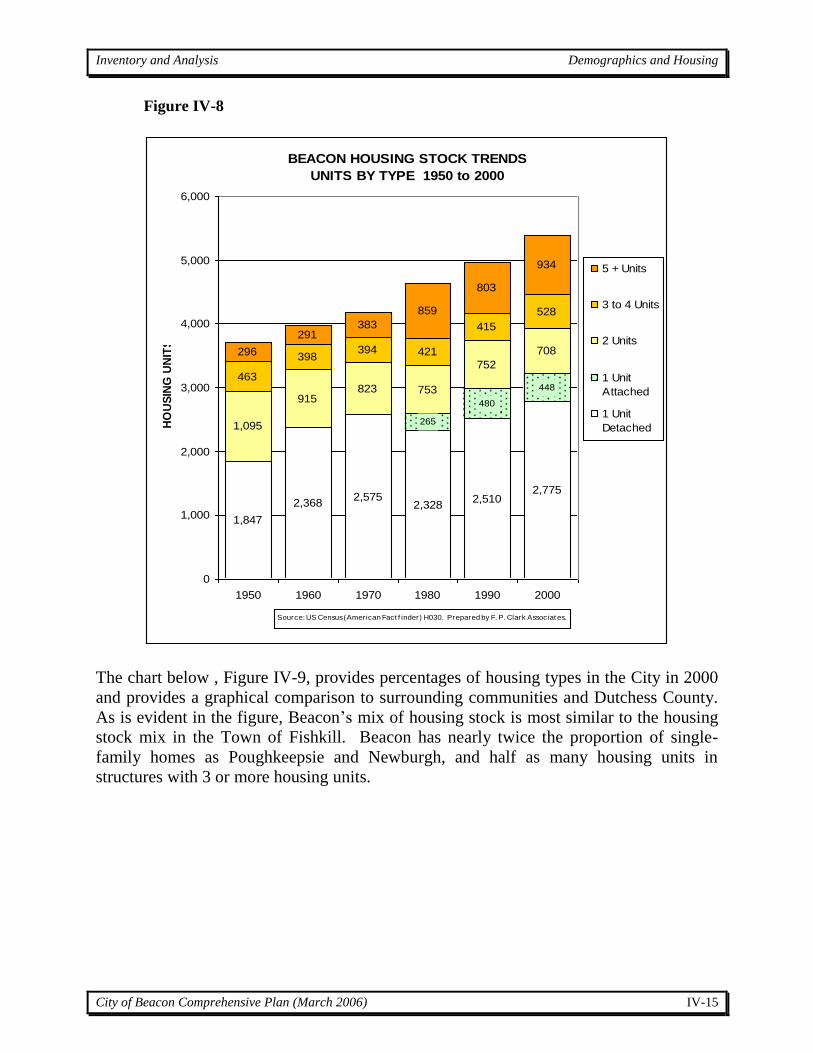
Inventory and Analysis Demographics and Housing
City of Beacon Comprehensive Plan (March 2006) IV-15
Figure IV-8
BEACON HOUSING STOCK TRENDS
UNITS BY TYPE 1950 to 2000
1,847
2,3682,575
2,3282,510
2,775
265
480
448
1,095
915823 753
752
708
463
398394 421
415
528
296
291383
859
803
934
0
1,000
2,000
3,000
4,000
5,000
6,000
1950 1960 1970 1980 1990 2000
HO
US
ING
UN
ITS
5 + Units
3 to 4 Units
2 Units
1 Unit
Attached
1 Unit
Detached
Source: US Census (American Fact f inder) H030. Prepared by F. P. Clark Associat es.
The chart below , Figure IV-9, provides percentages of housing types in the City in 2000
and provides a graphical comparison to surrounding communities and Dutchess County.
As is evident in the figure, Beacon’s mix of housing stock is most similar to the housing
stock mix in the Town of Fishkill. Beacon has nearly twice the proportion of single-
family homes as Poughkeepsie and Newburgh, and half as many housing units in
structures with 3 or more housing units.
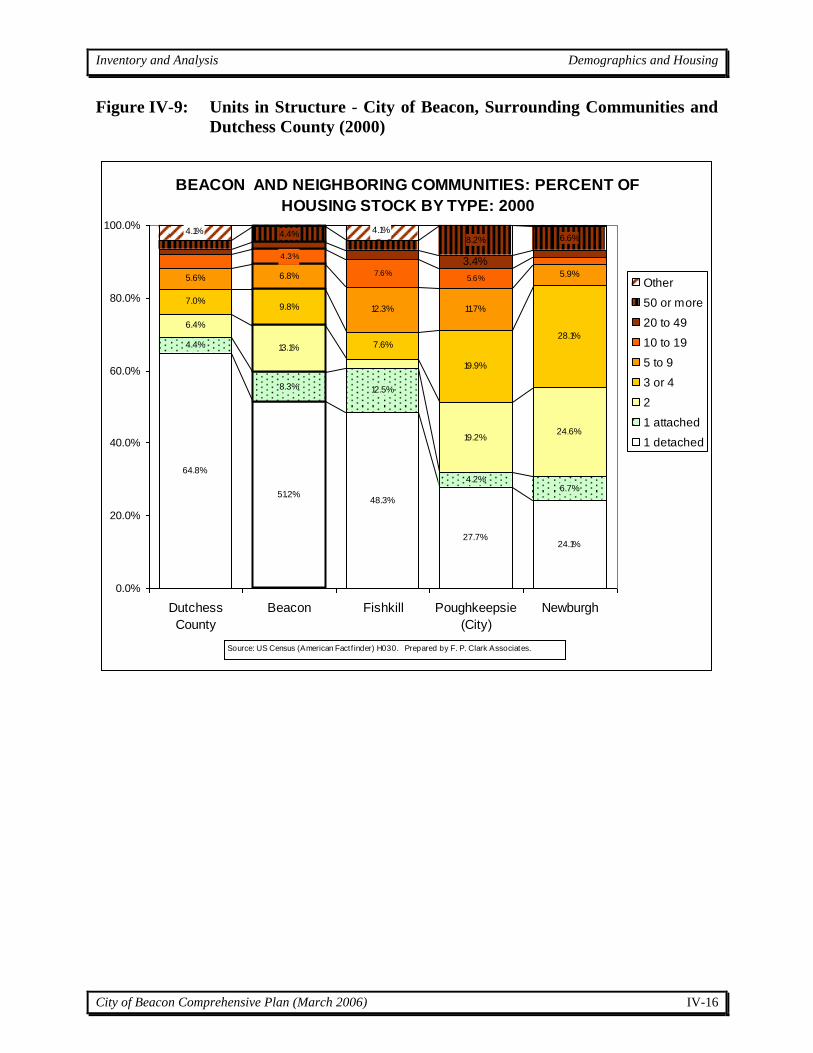
Inventory and Analysis Demographics and Housing
City of Beacon Comprehensive Plan (March 2006) IV-16
Figure IV-9: Units in Structure - City of Beacon, Surrounding Communities and
Dutchess County (2000)
BEACON AND NEIGHBORING COMMUNITIES: PERCENT OF
HOUSING STOCK BY TYPE: 2000
64.8%
51.2%48.3%
27.7%24.1%
4.2%6.7%
6.4%
13.1%
19.2%24.6%
7.0%9.8%
7.6%
19.9%
28.1%
5.6% 6.8%
12.3% 11.7%
5.9%
4.3%
7.6%5.6%
3.4%
4.4%8.2%
4.4%
8.3% 12.5%
6.6%4.1% 4.1%
0.0%
20.0%
40.0%
60.0%
80.0%
100.0%
Dutchess
County
Beacon Fishkill Poughkeepsie
(City)
Newburgh
Other
50 or more
20 to 49
10 to 19
5 to 9
3 or 4
2
1 attached
1 detached
Source: US Census (American Factf inder) H030. Prepared by F. P. Clark Associates.

Inventory and Analysis Demographics and Housing
City of Beacon Comprehensive Plan (September 2003) IV-17
Table IV-14, below, shows the changes in overall tenancy status of occupied housing in the City over the last 20 years and
provides a comparison to surrounding communities and Dutchess County as a whole. Both owner-occupied units and renter-
occupied units have grown in number since 1980, but renter-occupied units have grown at a faster rate (20 percent versus 13
percent).
Table IV-14: Status of Occupied Housing (1980 and 2000)
1980 1990 2000 1980-2000 1990-2000
Owner-
Occupied
Renter-
Occupied
Owner-
Occupied
Renter-
Occupied
Owner-
Occupied
Renter-
Occupied
Owner-
Occupied
Renter-
Occupied
Owner-
Occupied
Renter-
Occupied
# of
units
% of
units
# of
units
% of
units
# of
units
% of
units
# of
units
% of
units
# of
units
% of
units
# of
units
% of
units
#
change
%
change
#
change
%
change
#
change
%
change
#
change
%
change
City of Beacon 2,546 58% 1,845 42% 2,810 59% 1,911 41% 2,881 56% 2,220 44% 335 13% 375 20% 71 3% 309 16%
City of
Poughkeepsie
4,668 38% 7,594 62% 4,773 40% 7,101 60% 4,419 37% 7,595 63% -249 -5% 1 0% -354 -7% 494 7%
Town of Fishkill
3,244 62% 1,963 38% 3,711 65% 1,999 35% 4,484 65% 2,391 35% 1,240 38% 428 22% 773 21% 392 20%
Town of
Wappinger
5,454 61% 3,507 39% 6,438 70% 2,808 30% 6,433 66% 3,377 34% 979 18% -130 -4% -5 0% 569 20%
Dutchess
County
53,591 63% 27,051 32% 61,899 69% 27,668 31% 68,628 69% 30,908 31% 15,037 28% 3,857 14% 6,729 11% 3,240 12%
Source: U.S. Census Bureau. Prepared by Frederick P. Clark Associates, Inc.
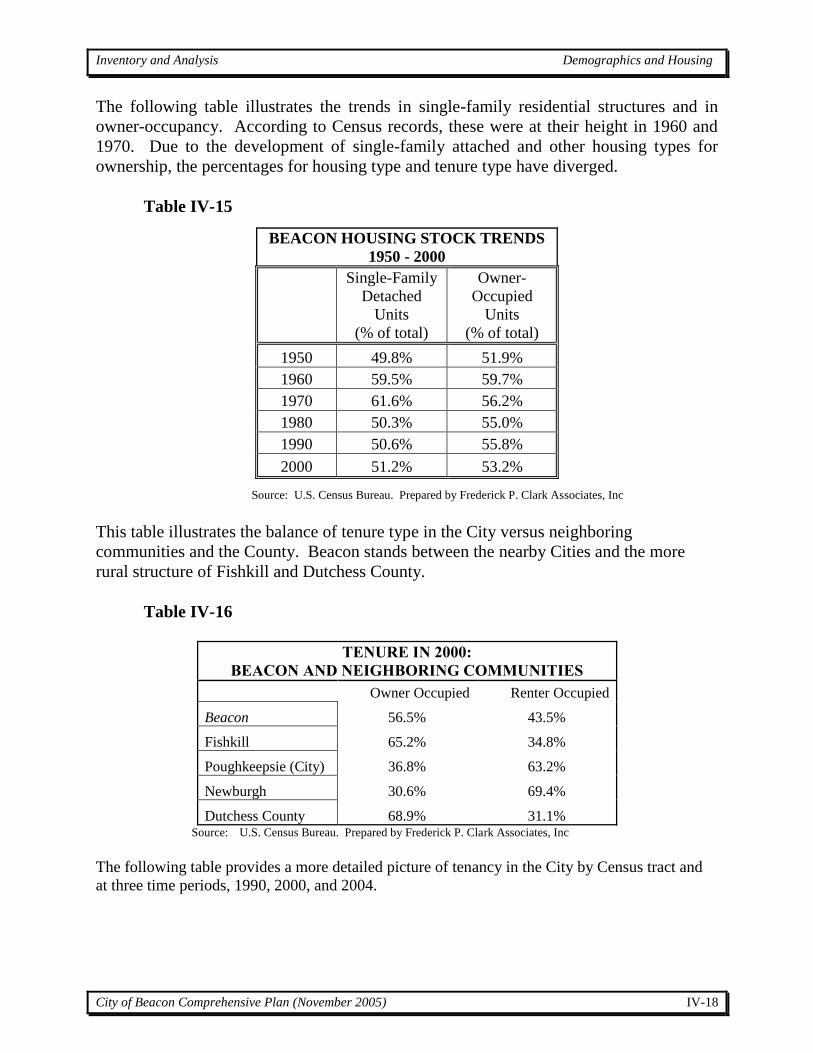
Inventory and Analysis Demographics and Housing
City of Beacon Comprehensive Plan (November 2005) IV-18
The following table illustrates the trends in single-family residential structures and in
owner-occupancy. According to Census records, these were at their height in 1960 and
1970. Due to the development of single-family attached and other housing types for
ownership, the percentages for housing type and tenure type have diverged.
Table IV-15
Source: U.S. Census Bureau. Prepared by Frederick P. Clark Associates, Inc
This table illustrates the balance of tenure type in the City versus neighboring
communities and the County. Beacon stands between the nearby Cities and the more
rural structure of Fishkill and Dutchess County.
Table IV-16
TENURE IN 2000:
BEACON AND NEIGHBORING COMMUNITIES
Owner Occupied Renter Occupied
Beacon 56.5% 43.5%
Fishkill 65.2% 34.8%
Poughkeepsie (City) 36.8% 63.2%
Newburgh 30.6% 69.4%
Dutchess County 68.9% 31.1% Source: U.S. Census Bureau. Prepared by Frederick P. Clark Associates, Inc
The following table provides a more detailed picture of tenancy in the City by Census tract and
at three time periods, 1990, 2000, and 2004.
BEACON HOUSING STOCK TRENDS
1950 - 2000
Single-Family
Detached
Units
(% of total)
Owner-
Occupied
Units
(% of total)
1950 49.8% 51.9%
1960 59.5% 59.7%
1970 61.6% 56.2%
1980 50.3% 55.0%
1990 50.6% 55.8%
2000 51.2% 53.2%
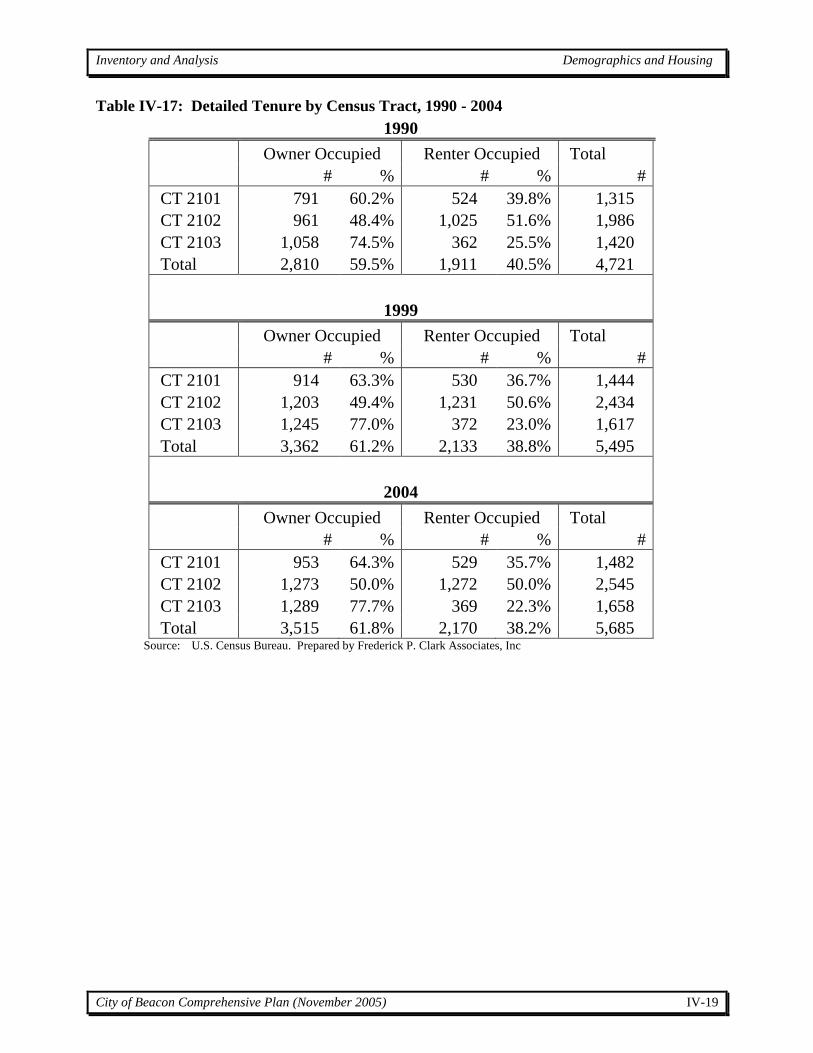
Inventory and Analysis Demographics and Housing
City of Beacon Comprehensive Plan (November 2005) IV-19
Table IV-17: Detailed Tenure by Census Tract, 1990 - 2004
1990
Owner Occupied Renter Occupied Total
# % # % #
CT 2101 791 60.2% 524 39.8% 1,315
CT 2102 961 48.4% 1,025 51.6% 1,986
CT 2103 1,058 74.5% 362 25.5% 1,420
Total 2,810 59.5% 1,911 40.5% 4,721
1999
Owner Occupied Renter Occupied Total
# % # % #
CT 2101 914 63.3% 530 36.7% 1,444
CT 2102 1,203 49.4% 1,231 50.6% 2,434
CT 2103 1,245 77.0% 372 23.0% 1,617
Total 3,362 61.2% 2,133 38.8% 5,495
2004
Owner Occupied Renter Occupied Total
# % # % #
CT 2101 953 64.3% 529 35.7% 1,482
CT 2102 1,273 50.0% 1,272 50.0% 2,545
CT 2103 1,289 77.7% 369 22.3% 1,658
Total 3,515 61.8% 2,170 38.2% 5,685 Source: U.S. Census Bureau. Prepared by Frederick P. Clark Associates, Inc
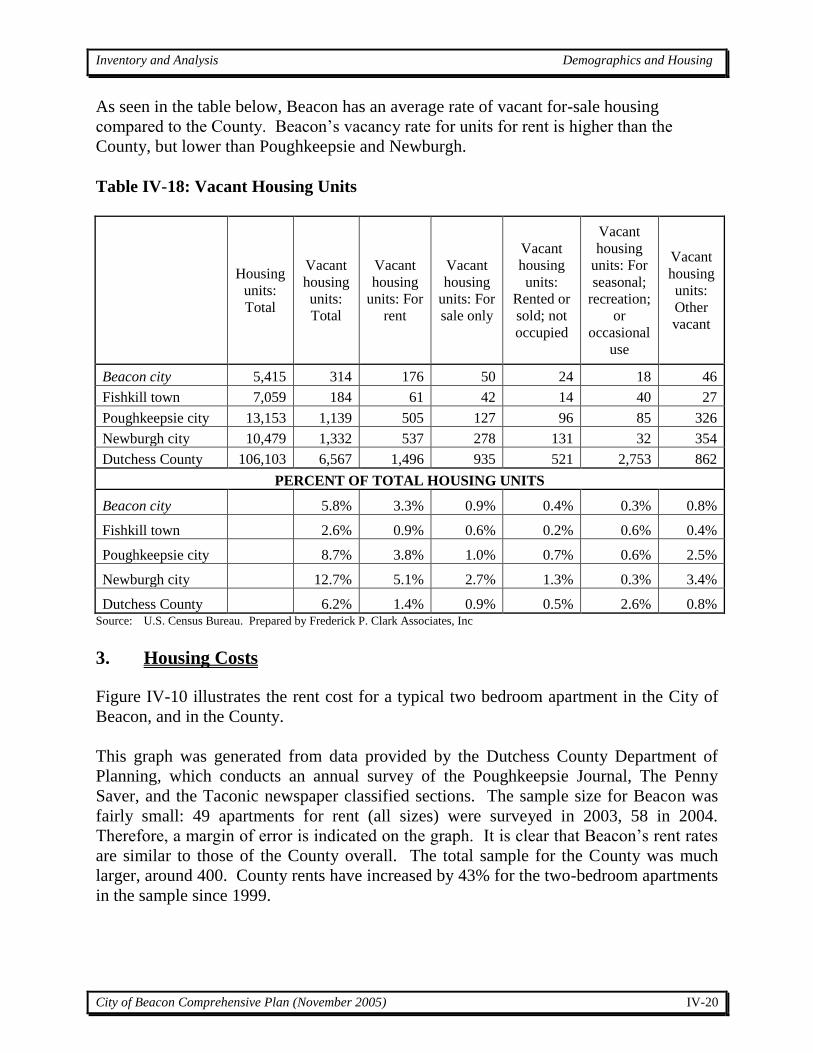
Inventory and Analysis Demographics and Housing
City of Beacon Comprehensive Plan (November 2005) IV-20
As seen in the table below, Beacon has an average rate of vacant for-sale housing
compared to the County. Beacon’s vacancy rate for units for rent is higher than the
County, but lower than Poughkeepsie and Newburgh.
Table IV-18: Vacant Housing Units
Housing
units:
Total
Vacant
housing
units:
Total
Vacant
housing
units: For
rent
Vacant
housing
units: For
sale only
Vacant
housing
units:
Rented or
sold; not
occupied
Vacant
housing
units: For
seasonal;
recreation;
or
occasional
use
Vacant
housing
units:
Other
vacant
Beacon city 5,415 314 176 50 24 18 46
Fishkill town 7,059 184 61 42 14 40 27
Poughkeepsie city 13,153 1,139 505 127 96 85 326
Newburgh city 10,479 1,332 537 278 131 32 354
Dutchess County 106,103 6,567 1,496 935 521 2,753 862
PERCENT OF TOTAL HOUSING UNITS
Beacon city 5.8% 3.3% 0.9% 0.4% 0.3% 0.8%
Fishkill town 2.6% 0.9% 0.6% 0.2% 0.6% 0.4%
Poughkeepsie city 8.7% 3.8% 1.0% 0.7% 0.6% 2.5%
Newburgh city 12.7% 5.1% 2.7% 1.3% 0.3% 3.4%
Dutchess County 6.2% 1.4% 0.9% 0.5% 2.6% 0.8% Source: U.S. Census Bureau. Prepared by Frederick P. Clark Associates, Inc
3. Housing Costs
Figure IV-10 illustrates the rent cost for a typical two bedroom apartment in the City of
Beacon, and in the County.
This graph was generated from data provided by the Dutchess County Department of
Planning, which conducts an annual survey of the Poughkeepsie Journal, The Penny
Saver, and the Taconic newspaper classified sections. The sample size for Beacon was
fairly small: 49 apartments for rent (all sizes) were surveyed in 2003, 58 in 2004.
Therefore, a margin of error is indicated on the graph. It is clear that Beacon’s rent rates
are similar to those of the County overall. The total sample for the County was much
larger, around 400. County rents have increased by 43% for the two-bedroom apartments
in the sample since 1999.
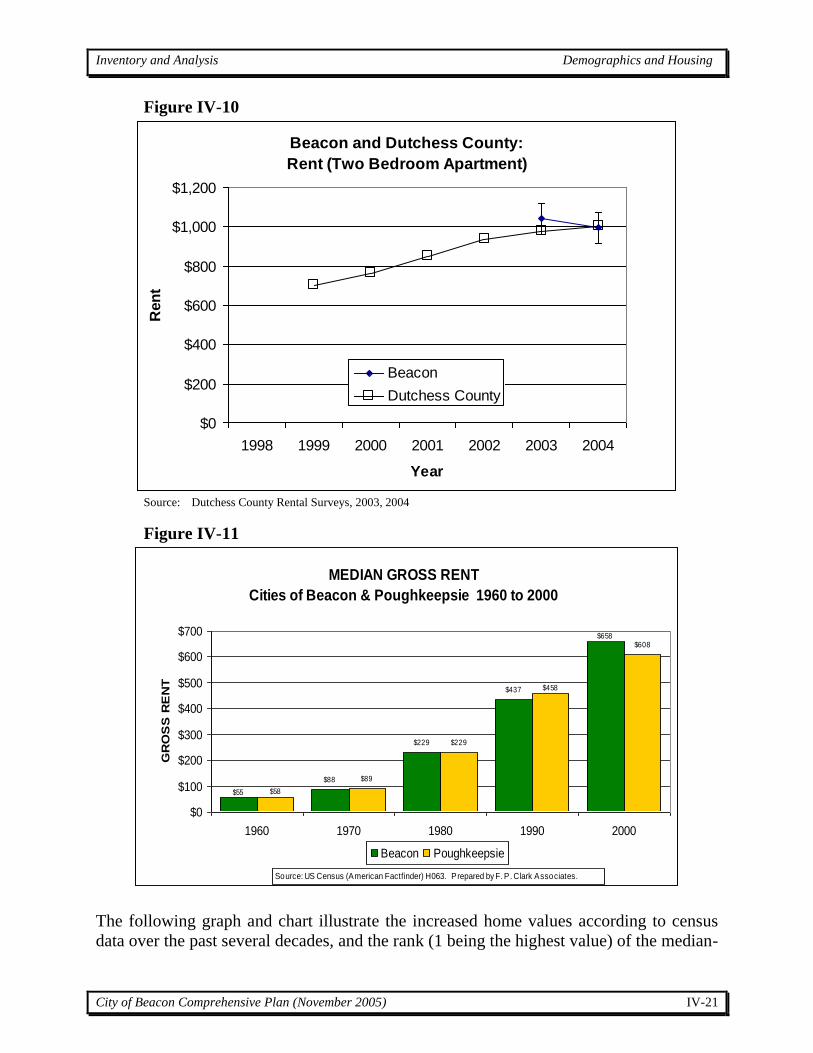
Inventory and Analysis Demographics and Housing
City of Beacon Comprehensive Plan (November 2005) IV-21
Figure IV-10
Beacon and Dutchess County:
Rent (Two Bedroom Apartment)
$0
$200
$400
$600
$800
$1,000
$1,200
1998 1999 2000 2001 2002 2003 2004
Year
Ren
t
Beacon
Dutchess County
Source: Dutchess County Rental Surveys, 2003, 2004
Figure IV-11
MEDIAN GROSS RENT
Cities of Beacon & Poughkeepsie 1960 to 2000
$88
$229
$437
$89
$229
$608
$55
$658
$58
$458
$0
$100
$200
$300
$400
$500
$600
$700
1960 1970 1980 1990 2000
GR
OS
S R
EN
T
Beacon Poughkeepsie
Source: US Census (American Factfinder) H063. Prepared by F. P. Clark Associates.
The following graph and chart illustrate the increased home values according to census
data over the past several decades, and the rank (1 being the highest value) of the median-
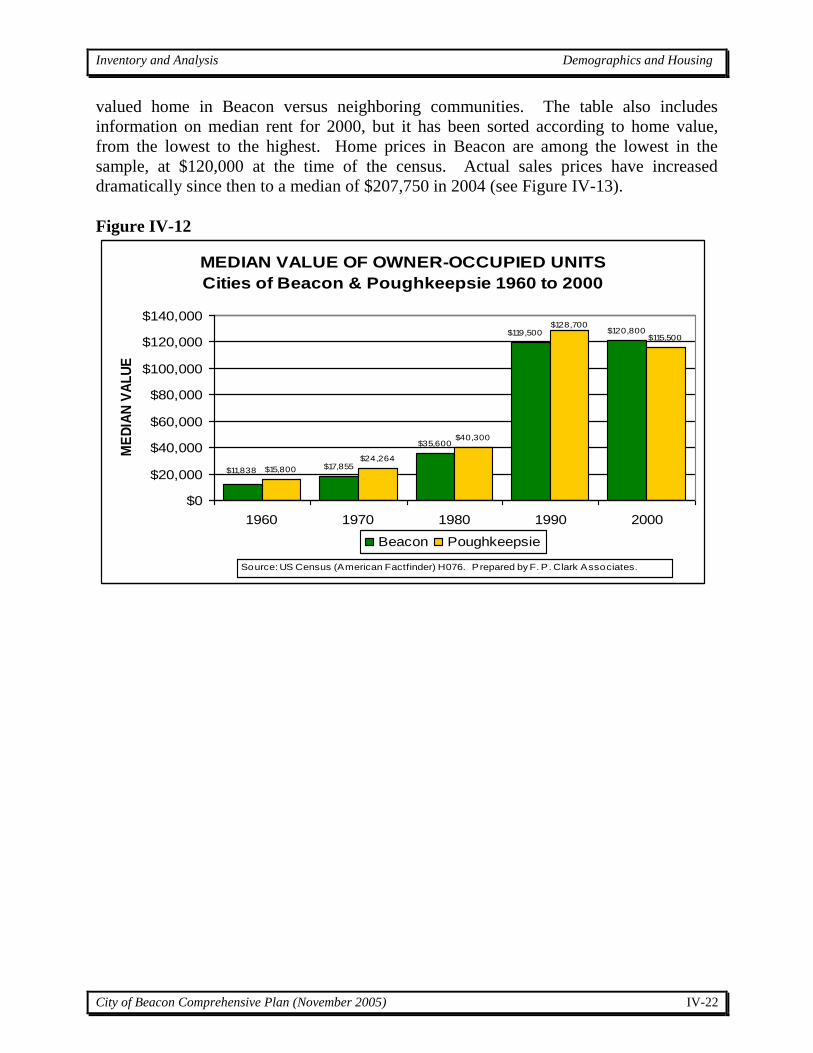
Inventory and Analysis Demographics and Housing
City of Beacon Comprehensive Plan (November 2005) IV-22
valued home in Beacon versus neighboring communities. The table also includes
information on median rent for 2000, but it has been sorted according to home value,
from the lowest to the highest. Home prices in Beacon are among the lowest in the
sample, at $120,000 at the time of the census. Actual sales prices have increased
dramatically since then to a median of $207,750 in 2004 (see Figure IV-13).
Figure IV-12
MEDIAN VALUE OF OWNER-OCCUPIED UNITS
Cities of Beacon & Poughkeepsie 1960 to 2000
$17,855
$35,600
$120,800
$15,800
$24,264
$40,300
$115,500
$11,838
$119,500$128,700
$0
$20,000
$40,000
$60,000
$80,000
$100,000
$120,000
$140,000
1960 1970 1980 1990 2000
ME
DIA
N V
AL
UE
Beacon Poughkeepsie
Source: US Census (American Factfinder) H076. Prepared by F. P. Clark Associates.

Inventory and Analysis Demographics and Housing
City of Beacon Comprehensive Plan (November 2005) IV-23
Table IV-19
Specified renter-
occupied housing units
paying cash rent: Median
gross rent
Rent: Rank Owner-occupied housing
units: Median value
Value:
Rank
Poughkeepsie city $608 22 $108,800 23
Pine Plains town $635 20 $118,400 22
Beacon city $658 18 $120,000 21
Amenia town $607 23 $122,000 20
Hyde Park town $690 14 $125,600 19
North East town $677 16 $128,200 18
Dover town $649 19 $130,900 17
Poughkeepsie town $745 8 $139,800 16
Fishkill town $813 4 $143,200 15
Red Hook town $622 21 $143,900 14
Dutchess County $707 11 $150,800 13
Milan town $675 17 $151,300 12
Pleasant Valley
town $747 7 $154,600 11
Wappinger town $798 5 $155,700 10
Clinton town $748 6 $169,200 9
Rhinebeck town $714 9 $174,500 8
Pawling town $713 10 $177,200 7
La Grange town $869 1 $177,800 6
Stanford town $691 13 $182,100 5
Beekman town $859 2 $182,300 4
Union Vale town $851 3 $192,400 3
Washington town $702 12 $192,700 2
East Fishkill town $690 14 $197,900 1
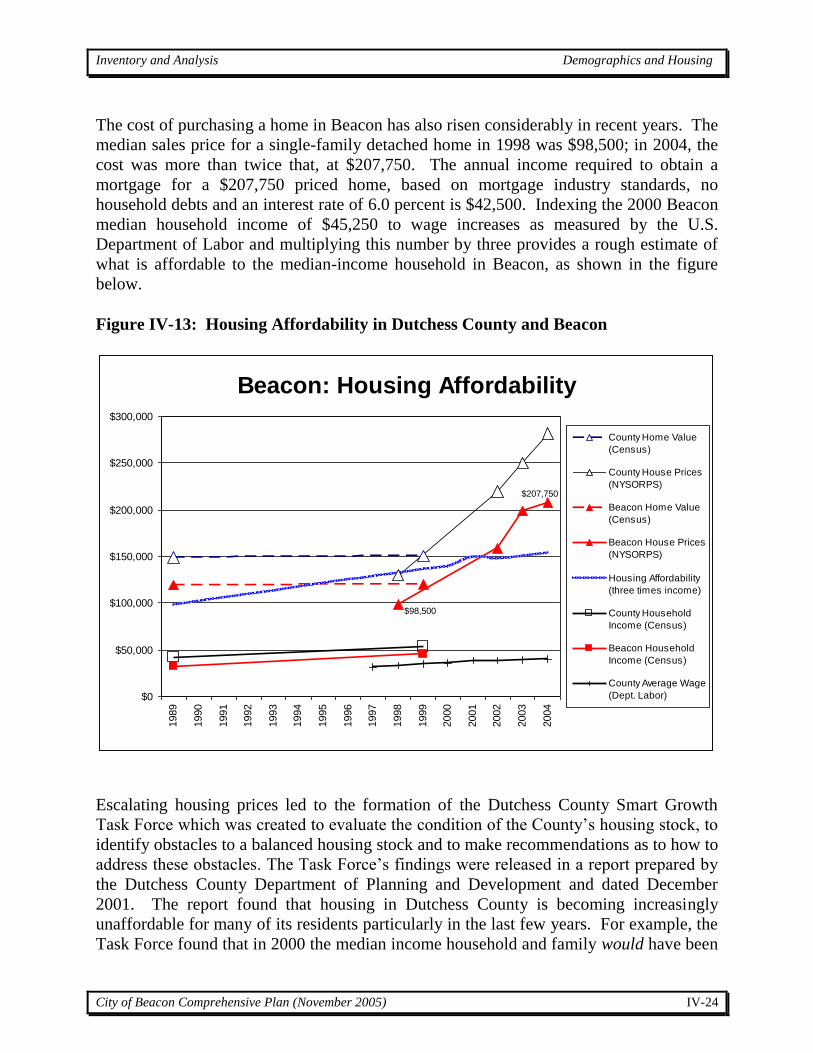
Inventory and Analysis Demographics and Housing
City of Beacon Comprehensive Plan (November 2005) IV-24
The cost of purchasing a home in Beacon has also risen considerably in recent years. The
median sales price for a single-family detached home in 1998 was $98,500; in 2004, the
cost was more than twice that, at $207,750. The annual income required to obtain a
mortgage for a $207,750 priced home, based on mortgage industry standards, no
household debts and an interest rate of 6.0 percent is $42,500. Indexing the 2000 Beacon
median household income of $45,250 to wage increases as measured by the U.S.
Department of Labor and multiplying this number by three provides a rough estimate of
what is affordable to the median-income household in Beacon, as shown in the figure
below.
Figure IV-13: Housing Affordability in Dutchess County and Beacon
Beacon: Housing Affordability
$98,500
$207,750
$0
$50,000
$100,000
$150,000
$200,000
$250,000
$300,000
1989
1990
1991
1992
1993
1994
1995
1996
1997
1998
1999
2000
2001
2002
2003
2004
County Home Value
(Census)
County House Prices
(NYSORPS)
Beacon Home Value
(Census)
Beacon House Prices
(NYSORPS)
Housing Affordability
(three times income)
County Household
Income (Census)
Beacon Household
Income (Census)
County Average Wage
(Dept. Labor)
Escalating housing prices led to the formation of the Dutchess County Smart Growth
Task Force which was created to evaluate the condition of the County’s housing stock, to
identify obstacles to a balanced housing stock and to make recommendations as to how to
address these obstacles. The Task Force’s findings were released in a report prepared by
the Dutchess County Department of Planning and Development and dated December
2001. The report found that housing in Dutchess County is becoming increasingly
unaffordable for many of its residents particularly in the last few years. For example, the
Task Force found that in 2000 the median income household and family would have been
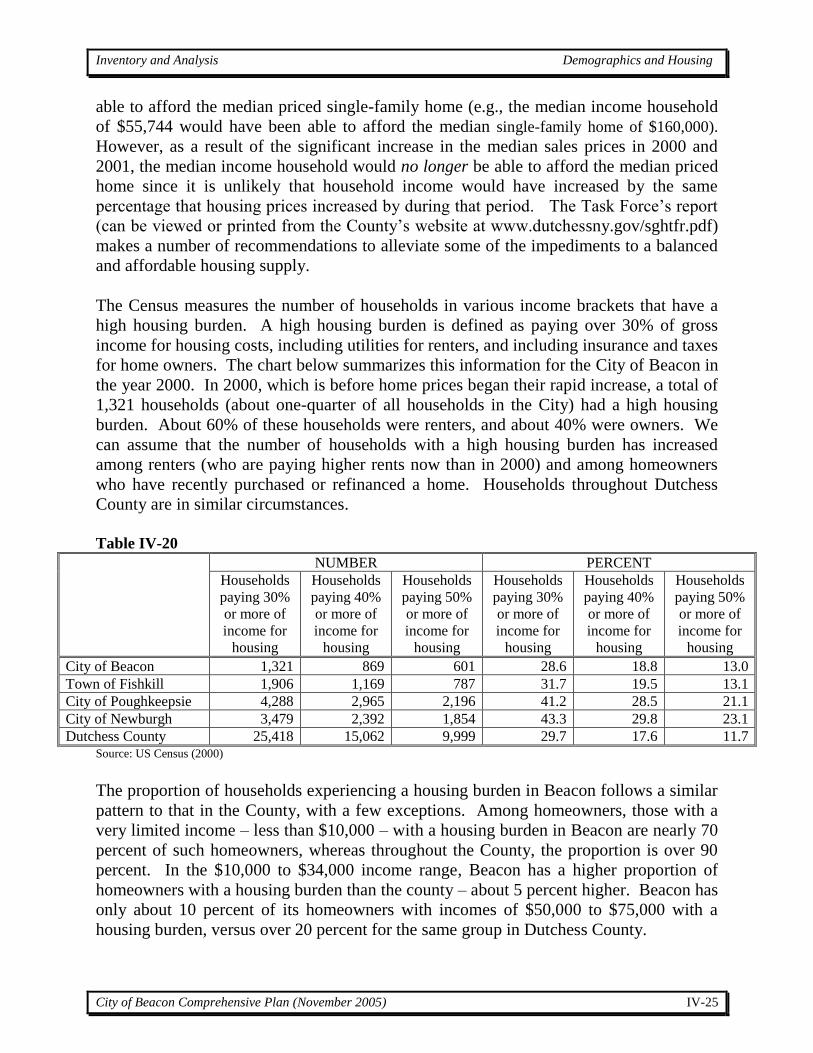
Inventory and Analysis Demographics and Housing
City of Beacon Comprehensive Plan (November 2005) IV-25
able to afford the median priced single-family home (e.g., the median income household
of $55,744 would have been able to afford the median single-family home of $160,000).
However, as a result of the significant increase in the median sales prices in 2000 and
2001, the median income household would no longer be able to afford the median priced
home since it is unlikely that household income would have increased by the same
percentage that housing prices increased by during that period. The Task Force’s report
(can be viewed or printed from the County’s website at www.dutchessny.gov/sghtfr.pdf)
makes a number of recommendations to alleviate some of the impediments to a balanced
and affordable housing supply.
The Census measures the number of households in various income brackets that have a
high housing burden. A high housing burden is defined as paying over 30% of gross
income for housing costs, including utilities for renters, and including insurance and taxes
for home owners. The chart below summarizes this information for the City of Beacon in
the year 2000. In 2000, which is before home prices began their rapid increase, a total of
1,321 households (about one-quarter of all households in the City) had a high housing
burden. About 60% of these households were renters, and about 40% were owners. We
can assume that the number of households with a high housing burden has increased
among renters (who are paying higher rents now than in 2000) and among homeowners
who have recently purchased or refinanced a home. Households throughout Dutchess
County are in similar circumstances.
Table IV-20
NUMBER PERCENT
Households
paying 30%
or more of
income for
housing
Households
paying 40%
or more of
income for
housing
Households
paying 50%
or more of
income for
housing
Households
paying 30%
or more of
income for
housing
Households
paying 40%
or more of
income for
housing
Households
paying 50%
or more of
income for
housing
City of Beacon 1,321 869 601 28.6 18.8 13.0
Town of Fishkill 1,906 1,169 787 31.7 19.5 13.1
City of Poughkeepsie 4,288 2,965 2,196 41.2 28.5 21.1
City of Newburgh 3,479 2,392 1,854 43.3 29.8 23.1
Dutchess County 25,418 15,062 9,999 29.7 17.6 11.7 Source: US Census (2000)
The proportion of households experiencing a housing burden in Beacon follows a similar
pattern to that in the County, with a few exceptions. Among homeowners, those with a
very limited income – less than $10,000 – with a housing burden in Beacon are nearly 70
percent of such homeowners, whereas throughout the County, the proportion is over 90
percent. In the $10,000 to $34,000 income range, Beacon has a higher proportion of
homeowners with a housing burden than the county – about 5 percent higher. Beacon has
only about 10 percent of its homeowners with incomes of $50,000 to $75,000 with a
housing burden, versus over 20 percent for the same group in Dutchess County.
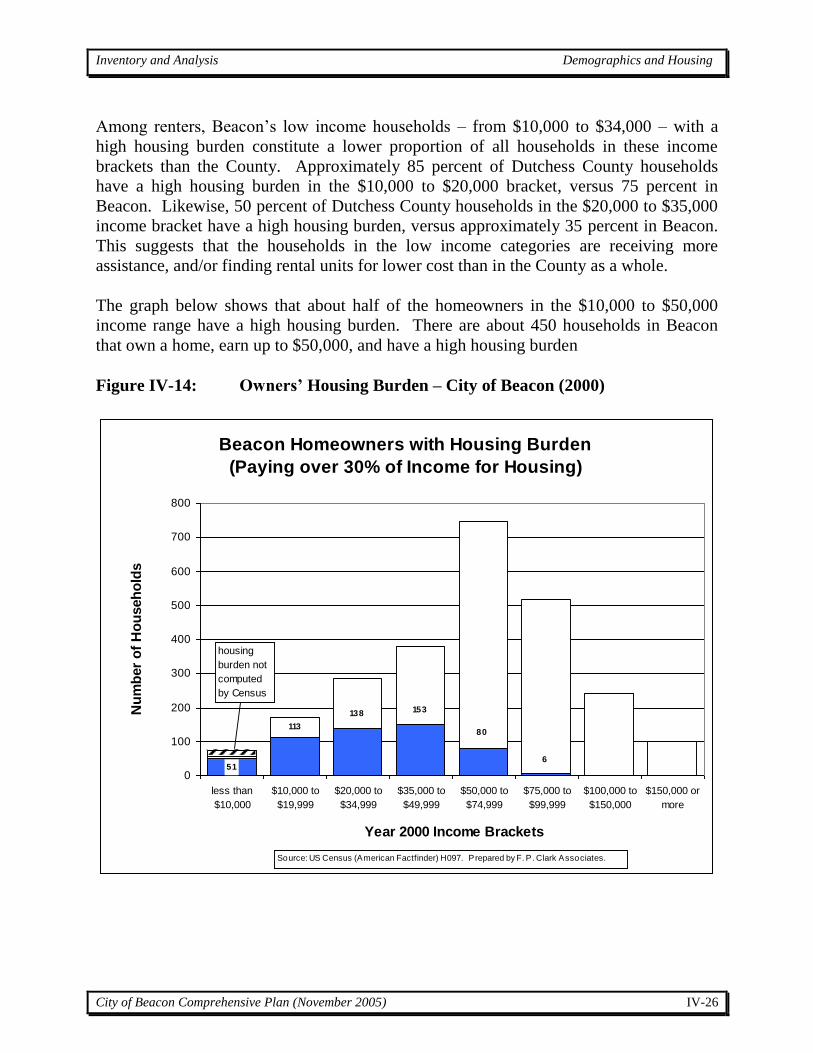
Inventory and Analysis Demographics and Housing
City of Beacon Comprehensive Plan (November 2005) IV-26
Among renters, Beacon’s low income households – from $10,000 to $34,000 – with a
high housing burden constitute a lower proportion of all households in these income
brackets than the County. Approximately 85 percent of Dutchess County households
have a high housing burden in the $10,000 to $20,000 bracket, versus 75 percent in
Beacon. Likewise, 50 percent of Dutchess County households in the $20,000 to $35,000
income bracket have a high housing burden, versus approximately 35 percent in Beacon.
This suggests that the households in the low income categories are receiving more
assistance, and/or finding rental units for lower cost than in the County as a whole.
The graph below shows that about half of the homeowners in the $10,000 to $50,000
income range have a high housing burden. There are about 450 households in Beacon
that own a home, earn up to $50,000, and have a high housing burden
Figure IV-14: Owners’ Housing Burden – City of Beacon (2000)
Beacon Homeowners with Housing Burden
(Paying over 30% of Income for Housing)
51
113
138 153
80
6
0
100
200
300
400
500
600
700
800
less than
$10,000
$10,000 to
$19,999
$20,000 to
$34,999
$35,000 to
$49,999
$50,000 to
$74,999
$75,000 to
$99,999
$100,000 to
$150,000
$150,000 or
more
Year 2000 Income Brackets
Nu
mb
er
of
Ho
useh
old
s
housing
burden not
computed
by Census
Source: US Census (American Factfinder) H097. Prepared by F. P. Clark Associates.
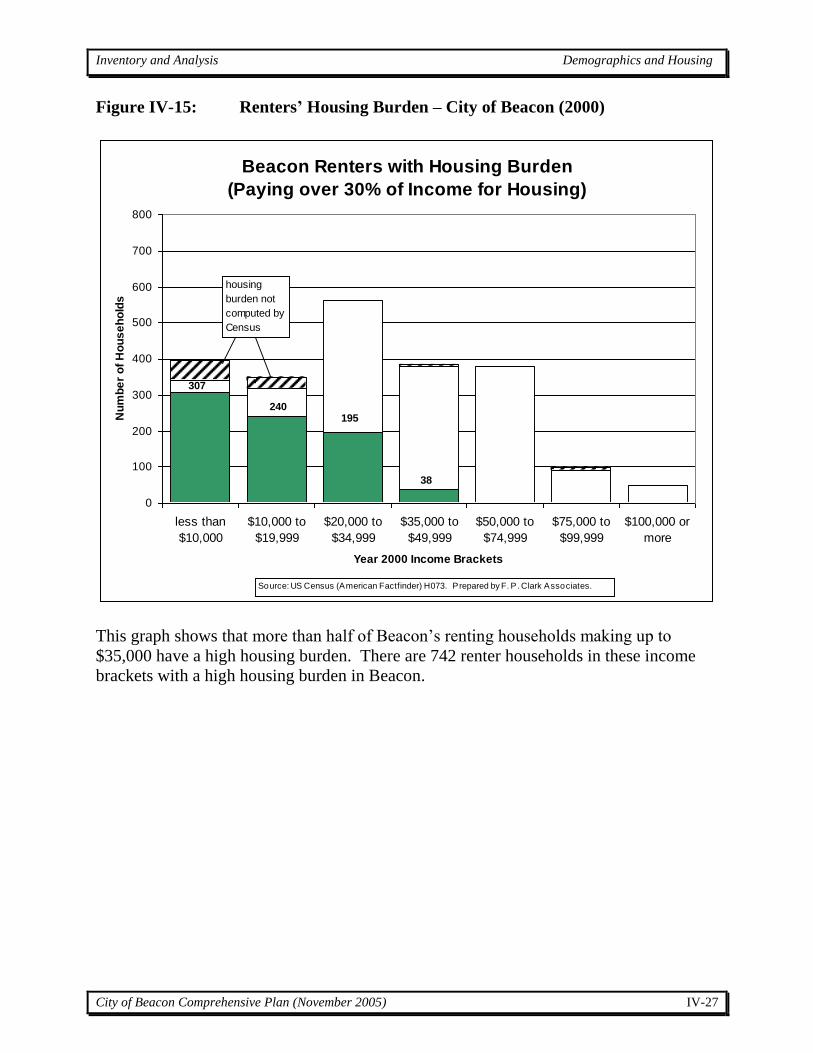
Inventory and Analysis Demographics and Housing
City of Beacon Comprehensive Plan (November 2005) IV-27
Figure IV-15: Renters’ Housing Burden – City of Beacon (2000)
Beacon Renters with Housing Burden
(Paying over 30% of Income for Housing)
38
195240
307
0
100
200
300
400
500
600
700
800
less than
$10,000
$10,000 to
$19,999
$20,000 to
$34,999
$35,000 to
$49,999
$50,000 to
$74,999
$75,000 to
$99,999
$100,000 or
more
Year 2000 Income Brackets
Nu
mb
er
of
Ho
us
eh
old
s
housing
burden not
computed by
Census
Source: US Census (American Factfinder) H073. Prepared by F. P. Clark Associates.
This graph shows that more than half of Beacon’s renting households making up to
$35,000 have a high housing burden. There are 742 renter households in these income
brackets with a high housing burden in Beacon.
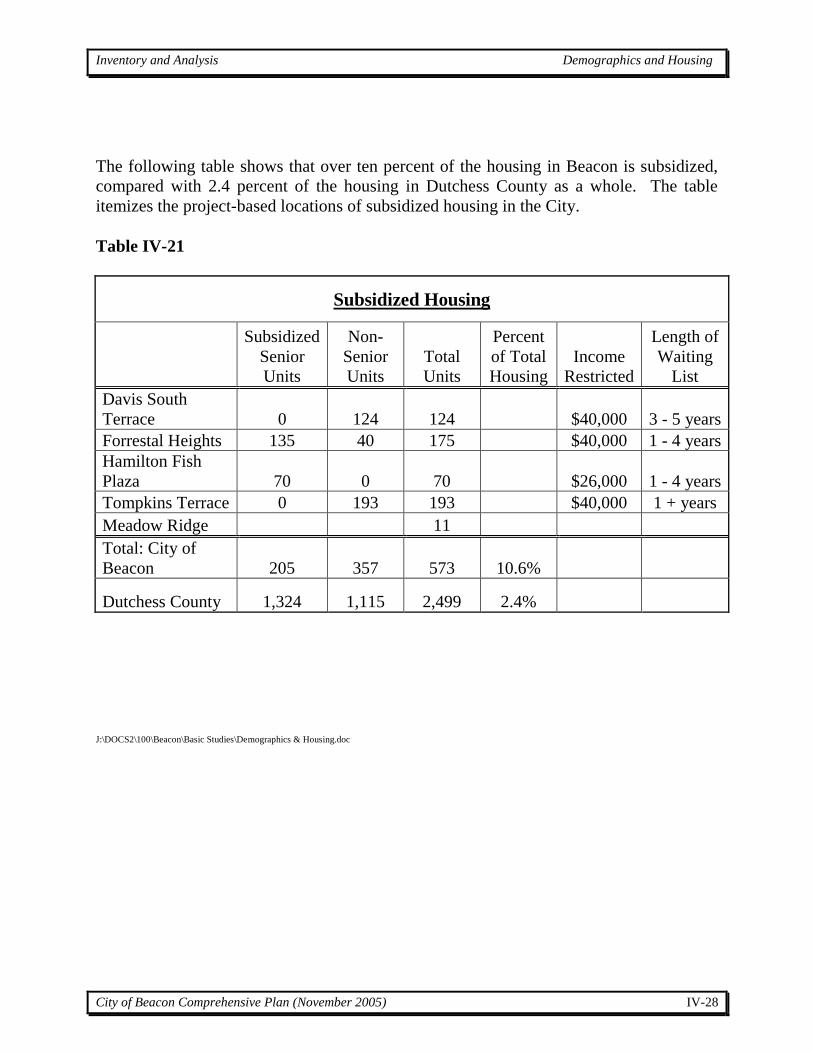
Inventory and Analysis Demographics and Housing
City of Beacon Comprehensive Plan (November 2005) IV-28
The following table shows that over ten percent of the housing in Beacon is subsidized,
compared with 2.4 percent of the housing in Dutchess County as a whole. The table
itemizes the project-based locations of subsidized housing in the City.
Table IV-21
Subsidized Housing
Subsidized
Senior
Units
Non-
Senior
Units
Total
Units
Percent
of Total
Housing
Income
Restricted
Length of
Waiting
List
Davis South
Terrace 0 124 124 $40,000 3 - 5 years
Forrestal Heights 135 40 175 $40,000 1 - 4 years
Hamilton Fish
Plaza 70 0 70 $26,000 1 - 4 years
Tompkins Terrace 0 193 193 $40,000 1 + years
Meadow Ridge 11
Total: City of
Beacon 205 357 573 10.6%
Dutchess County 1,324 1,115 2,499 2.4%
J:\DOCS2\100\Beacon\Basic Studies\Demographics & Housing.doc
Inventory and Analysis Community Services and Facilities
City Beacon Comprehensive Plan (March 2006) V-1
V. COMMUNITY SERVICES AND FACILITIES
This chapter provides information on the essential community services and facilities
available to City of Beacon residents: fire and police protection, emergency services,
education, recreation, open space and public water and sewer services.
A. Protection Services
Police Department
The City of Beacon Police Department, located at 1 Municipal Center in Beacon,
provides coverage to the citizens of Beacon on a 24/7 basis. The department
operates with 37 full time police officers and 3 civilian clerical staff. The
department is tied into Dutchess County 911 Emergency Phone System by a direct
line. The department handles approximately 14,000 calls for service a year. The
department operates the following divisions:
Patrol Division
Three shifts of officers are on duty during a 24 hour period. They are known as the
uniform division and their primary responsibility is to respond to any calls for
service or crimes in progress reported within the boundaries of the City. The patrol
shift working is further broken into units with specialties to support their mission:
o The K 9 Unit includes two working teams that are trained in routine patrol
methods, suspect tracking and narcotic identification.
o The Traffic Enforcement assigned for radar enforcement, parking
enforcement, accident investigation and commercial vehicle enforcement.
o Bike Patrol Unit operates at various times during the year and patrols the
Main Street area, City Park and densely settled residential areas
Detective Division
The Detective Division is responsible for case preparation and criminal
prosecution and receives all felony investigations that are reported. This unit is
also responsible for all adult narcotic investigations.
Inventory and Analysis Community Services and Facilities
City Beacon Comprehensive Plan (March 2006) V-2
Juvenile Division
The Juvenile Division is responsible for all juvenile crimes (crimes committed by
people under the age of 16 years old), crimes against juveniles, all reported sex
crimes and all child protective cases reported.
Fire Department
The City of Beacon Fire Department is a volunteer and career fire department that
has been protecting the City of Beacon since the city's establishment in 1913. In
addition to providing primary coverage to the City of Beacon, the department also
serves the Town of Fishkill with a population of about 10,000 people in an area of
about 20 square miles.
The department provides fire and rescue services with a staff of roughly 75
volunteer firefighters, 13 full-time career firefighters and 2 part-time support
personnel. The department operates out of three fire houses that house 6 fire-
fighting vehicles. The department responds to over 1,200 runs a year, while
boasting the County's fastest response time. The City of Beacon Fire Department
is in Battalion 7 of the Dutchess County Department of Emergency Response and
operates as department 33. The Battalion Chief is responsible for acting as a
liaison between the county and departments in the battalion. The City’s Fire
Department, which dates back to 1886, is one of the few that has operated from
the same three companies throughout its history. These companies are as follows:
1. Station 1 (Beacon Engine Co): Beacon Engine Company runs out of its
historic 1889 station house and is located at 57 East Main Street in the City
of Beacon.
2. Station 2 (Lewis Tompkins Hose Co:Lewis Tompkins Hose Company
operates out of the city's newest 1982 station which is located at One South
Avenue in the City of Beacon.
3. Fire Headquarters (Mase Hook and Ladder Co): Mase Hook and Ladder
Company has a large 3 story 1911 station house which is located at 417-
419 Main Street in the City of Beacon.
The City of Beacon Fire Department also has many other support divisions that
allow the fire suppression division to operate successfully. The other divisions that
Beacon operates with are the Fire Prevention Division, Fire-Police Unit, and Fire
Investigation Unit.
Inventory and Analysis Community Services and Facilities
City Beacon Comprehensive Plan (March 2006) V-3
The Beacon Fire-Police Unit is an eleven person unit that is known as the "Safety
Unit of the Fire Department." The Beacon Fire Police Unit serves as many of the
same functions as police officers at fires and other emergency scenes. These
functions can include traffic control, crowd control, scene security, and other
functions which may be required.
Fire Police are volunteers who benefit the city by reducing the number of police
needed to serve these vital functions at emergency scenes and wherever their
services are requested. Although they are not paid, Fire Police carry the same
authority and powers as police officers at any location to which they are
dispatched or requested to serve.
The City Fire Investigation Unit is a joint unit between the city fire and police
department. The team is made up of a total of 7 members, 3 of which are New
York State Certified Fire Investigators. The team is responsible for determining
the origin and cause of fires. They investigate all aspects of fires that occur
throughout the city.
The City of Beacon Fire Prevention Division is responsible for setting up and
running the Department’s various fire prevention events. These events include
going to local daycare facilities and schools as well as various businesses in town
to perform various prevention and activism classes. In addition the Department
invites many groups and organizations to visit the various stations in the city to
also have these events.
Emergency Services
In addition to its "traditional" firefighting duties, the City of Beacon Fire
Department responds with at least two Emergency Medical Technicians (EMT’s)
to all life threatening medical calls within the city with the local ambulance
providers, Beacon Volunteer Ambulance and Alamo EMS. The Department's
personnel are also trained in confined space, technical, and specialized rescue. The
Fire Department is also trained in and capable of commanding each and every
emergency in the city whether it’s an auto accident, a hazardous materials
incident, or a natural disaster.
The Beacon Volunteer Ambulance Corps (BVAC) was first started in 1958 and its
initial ambulance was housed at the Beacon Engine Company. The BVAC
Headquarters located at 1 Arquilla Drive in Beacon was dedicated in May of 1980.
Today the Beacon Volunteer Ambulance Corps runs a fleet of three modern, fully
equipped, New York State Certified ambulances, a Basic Life Support First
Response vehicle and a Mass Casualty Incident Trailer. The BVAC responds
Inventory and Analysis Community Services and Facilities
City Beacon Comprehensive Plan (March 2006) V-4
approximately 1900-2000 calls per year, which makes it one of the busiest
volunteer services in the county.
B. Education
The City of Beacon School District (CBSD) is one of the 13 school districts that
are affiliated with the Dutchess County Board of Cooperative Extension Services
(BOCES), a government-funded agency that provides local school districts with a
variety of educational services for adults and children. In addition to the seven
schools that are part of the CBSD, the City of Beacon also has one private school.
The district has one high school, one middle school and four elementary schools;
five out of six are located within the City of Beacon. The CBSD has a bus
transportation system for students in grades K-12 who reside more than 1.5 miles
from school. The location of the schools is shown in the map, Community
Facilities.
Public Schools:
Beacon High School Beacon High School is a secondary grade organization that houses students in
grades 9 to 12. It is located 101 Matteawan Road in Beacon. 1,093 students
were enrolled in the school in 2003-04 school year.
Rombout Middle School Rombout Middle School is a middle grade organization and houses students in
grades 6 to 8. It is located 84 Matteawan Road in Beacon. 839 students were
enrolled in the school in 2003-04 school year.
J.V. Forrestal School J.V. Forrestal School is an elementary grade organization and houses students
in grades PK to 5. It is located 125 Liberty Street in Beacon. 324 students
were enrolled in this elementary school in 2003-04 school year.
Sargent School Sargent School is an elementary grade organization and houses students in
grades K to 5. It is located 60 South Avenue in Beacon. 397 students were
enrolled in this elementary school in 2003-04 school year.

Inventory and Analysis Community Services and Facilities
City Beacon Comprehensive Plan (March 2006) V-5
South Avenue School South Avenue School is an elementary grade organization and houses students
in grades K to 5. It is located 29 Education Drive in Beacon. 432 students
were enrolled in this elementary school in 2003-04 school year.
Glenhem School Glenhem School is an elementary grade organization and houses students in
grades K to 5. It is located 20 Chase Drive in Fishkill. 391 students were
enrolled in this elementary school in 2003-04 school year.
According to records maintained by Beacon City School District, 3,476 students were
enrolled in public schools in the district in 2003-2004. Between 1998 and 2004, school
enrollment has increased steadily, from 3,234 to 3,476 students.
Private Schools:
Oasis Christian School Oasis Christian School houses students in grades K to 12 and is located 7
Delavan Avenue in Beacon.
C. Health
Nursing Homes The City of Beacon has two nursing homes for those individuals who are in need
of skilled nursing care or supervision on a 24 hour per day basis. The City’s two
nursing homes that are licensed and monitored by the New York State Department
of Health are as follows:
Fishkill Health Center:
Fishkill Health Center, located at 22 Robert R. Kasin Way in the City of Beacon,
is a for-profit corporation. It has been certified since 1991 and has 160 certified
beds. The nursing home currently houses 155 residents.
Wingate at St. Francis:
Wingate at St. Francis, a for-profit organization, is located at 10 Hastings Drive in
the City of Beacon. It has been certified since 2001 with 160 beds. This nursing
home currently houses 149 residents.
Inventory and Analysis Community Services and Facilities
City Beacon Comprehensive Plan (March 2006) V-6
Adult Homes The City of Beacon has two adult care facilities. Adult Care Facilities are one of
the two types of adult homes recognized by the New York State. These facilities
are licensed by the New York State Department of Social Services and are
monitored locally by the Dutchess County Department of Social Services. The
City’s two adult care facilities are as follows:
Hedgewood Home has a capacity of 200 beds and is located at 355 Fishkill
Avenue in Beacon.
McClelland’s Home for Adults has a capacity of 70 beds and is located at 126 Old
Castle Point Road in Beacon.
D. Community Recreation and Open Space
The City of Beacon has numerous recreation opportunities that are managed by the
Beacon Recreation Commission. The Recreation Department is located in the
lower level of the Municipal Building and provides safe and positive recreation
programs to the residents of the City of Beacon.
Events:
Children's Easter Egg Hunt
Children’s Easter egg hunt is held at Riverfront Park for children up to age 8 the
week before Easter.
Halloween Parade
Halloween Parade is held the Sunday before Halloween at the Municipal Center.
It begins at Rombout School, marches down Wilkes St. and concludes at the
pavilion. This event offer prizes and candy.
Holiday Tree Lighting and Dessert with Santa
Tree lighting event is held outside of Lewis Tompkins Hose Firehouse and is
followed by dessert with Santa inside the firehouse. This event also offers
refreshments to all that attend and candy to children age 8 and under.
Community Day & Fireworks This is a full day of activities with a Flea Market, events and entertainment for
children, a four day carnival and fireworks in the evening. This event is held on
Saturday before the 4th of July at Memorial Park.

Inventory and Analysis Community Services and Facilities
City Beacon Comprehensive Plan (March 2006) V-7
University Settlement Camp Pool University Settlement Camp Pool is open to the public from Memorial Day to
Labor Day on Saturdays and Sundays.
Sports Activities:
Women’s Volleyball
The women play on Wednesday evenings at Rombout Jr. High, October through
April. Members include age 16 and older.
Women’s Softball
The women play on Wednesday evenings at Memorial Park, May through July.
Members include age 16 and older.
Men’s Open Basketball
Open to men on Wednesday evenings at Rombout Jr. High and Forrestal School,
and Tuesday evenings at Glenham School, October through March. Members
include age 35 and older.
Men’s Over 35 Softball
Open to men on Thursday evenings at Memorial Park, April through October.
Members include age 35 and older.
Jazzercise
Open to men, women and teens every Tuesday and Thursday at Rombout Jr. High.
Girls Babe Ruth Softball
Open to ages 7 to 18 on weeknights, April through July at Memorial Park.
POP Warner Football
This program consists of Flag Teams, Pee Wee, Jr. Pee Wee and Midgets for ages
6 through 14. The games are played in the fall in Memorial Park.
Beacon Junior Baseball
This program consists of T Ball for ages 5 and 6, Little League for ages 7 through
12 and Babe Ruth for ages 13 through 15. The games are played at Memorial Park
from April to July.
Junior Bowling
The junior bowling program for ages 4 to 18 is played from September to May.
The program also includes bumper bowling and takes place at Southern Dutchess.

Inventory and Analysis Community Services and Facilities
City Beacon Comprehensive Plan (March 2006) V-8
Karate This program is for ages 7 and up and taught every Friday evening at Sargent
Elementary School from September to June. Additional class for advanced
students taught at Forrestal Elem on Tuesday evenings.
Soccer The soccer program consists of 4 divisions: Midgets age 4-5, Pee Wee age 6-8,
Intermediate age 9-12 and Senior age 13-16. The games are played at Sargent and
Kerr Fields through fall and spring.
Tennis The six-week program is held once a week for 6 weeks at Memorial Park and is
for ages 9 and older. Tennis Clinic held at Beacon High School courts.
Beacon Community Center Program for Teens This program offers dances, movies, sega, the use of the gym and a drop in center
on Friday evenings in the Beacon Community Center located at 23 W. Center
Street in Beacon.
Youth Summer Basketball The program, for ages 6 to18, played in the summer at Green Street, South
Avenue, Martin Luther King Cultural Center and Riverfront Park. Youth
Basketball is held at Riverfront and South Avenues.
Baseball Camp The baseball camp is held one week in August at Memorial Park for boys and girls
aged 8 to 12.
Summer Playground Program This program is held for six weeks at Memorial Park and Green Street Park
beginning the first full week school is out. Registration is held in May for any
child ages 6 and older. The program offers arts and crafts, games, trips, swim
lessons and much more. Playground is for ages 6 through 12.
Senior Citizens:
Bowling This program is a 34-week season that is held at Southern Dutchess Bowl every
Friday afternoon.
Drop-In-Center The Beacon Community Center, located at 23 W. Center Street in Beacon, offers
activities such as art classes, arts and crafts, ceramics, aerobics, games, movies,
Inventory and Analysis Community Services and Facilities
City Beacon Comprehensive Plan (March 2006) V-9
trips, and a light lunch every Thursday from 10:00 am to 2:00 pm. Transportation
is also available if needed.
Beacon Seniors Beacon seniors meet first Wednesday of the month in the First Presbyterian
Church on Liberty Street in Beacon.
Forrestal Heights Forrestal Heights meets second Wednesday of the month in the Forrestal Heights
High-Rise on Wolcott Avenue in Beacon.
Gadabouts Gadabouts meet first and third Wednesday of the month at the Beacon Community
Center at 23 W. Center Street in Beacon.
St. John's Seniors St. John Seniors meets first Friday of the month in St. John's RC Church basement
on Willow Avenue in Beacon.
Parks:
The City of Beacon Park Department maintains all City owned parks - Memorial
Park located on Wilkes Street, South Avenue Park located on South Avenue,
Riverfront Park (10 acres) located on Red Flynn Drive, and Flannery Park located
on Green Street. All parks are open daily. The City’s park system include three
softball and three baseball fields, one football field, one soccer field, two tennis
courts, three basketball courts and three playgrounds. The Department marks
fields for all recreation programs and flood and maintain the ice rink when
weather permits.
The City also has two privately owned parks - Madam Brett Park (12 acres)
located on Tioranda Avenue and Mount Beacon park (235 acres) located at the
intersection of Howland and Wolcott Avenues.
E. Cultural Centers and Historic Places
Dia: Beacon Riggio Galleries The 300 square-foot art museum is located at 3 Beekman Street in Beacon. It
houses Dia Art Foundation’s renowned collection, comprising art from 1960s to
the present. The museum offers guided and unguided education tours for school
groups in grades K to12 as well as guided, unguided and group tours for others.
The facility also includes a bookshop and a café. Days and hours of operation
change with the season.
Inventory and Analysis Community Services and Facilities
City Beacon Comprehensive Plan (March 2006) V-10
Howland Cultural Center The Howland Cultural Center is located at 477 Main Street in Beacon. The center
promotes arts and serves the community by welcoming groups to use the Center
for their special events, i.e.: meetings, recitals, rehearsals, fundraisers, etc. The
historic building, originally built as a library in 1872, is listed on National
Registers of Historic Places since 1972. The Center offers programs Thursday
through Sunday.
Tallix Art Foundry This fine art sculpture facility is located at 310 Fishkill Avenue in Beacon. It
fabricates and casts world-famous works Monday through Friday.
Howland Public Library The public Library is located at 313 Main Street in Beacon.
Madam Brett Homestead This Historic building is located at 50 Van Nydeck Avenue in Beacon. The
building which has 17 rooms of furnishings, porcelain, paintings, books, tools and
gardens is built in 1709 and is considered as the oldest homestead of the Dutchess
County. It is open second Saturday of the month April through December.
Mount Gulian Historic Site Mount Gulian Historic Site is a reconstructed 18th century Dutch homestead on 44
acres with unique 1740's Dutch barn and restored garden located at145 Sterling
Street in Beacon. It is open year-round for school and group tours.
Martin Luther King Cultural Center, Inc. It is located at 19 South Avenue in Beacon.
J:\DOCS2\100\Beacon\Basic Studies\Beacon Community Services and Facilities.draft.euk.doc
Inventory and Analysis City Utilities
City of Beacon Comprehensive Plan (March 2006) VI-1
VI. CITY UTILITIES
A. Water Supply
The City of Beacon is the major water supply source in the Southern Dutchess Area.
Beacon owns and operates its water supply, transmission and distribution system which
serves the entire City. The system also serves several households in the Town of Fishkill
in the Glenham / Dutchess Stadium area north of the City and west of Route 9D and the
Dutchess Junction area to the south of the City. The Fishkill Correctional Facility, with
over 4,000 inmates, uses approximately one-third of the City’s water supply, and is the
single largest water user.
The City’s estimated safe water yield, which is the amount of water that would be
available at a time of severe drought, currently exceeds demand by approximately 1.0
mgd (million gallons per day). The current reliable supply, estimated in 1992 by the
engineering firm O’Brien and Gere, is 3.45 mgd, while the current demand is
approximately 2.4 mgd. This situation is the reverse of Beacon’s water supply status at
the time of the 1974 Plan, when the safe yield was estimated to be 0.6 mgd below
average demand. Since that time, Beacon has drilled an additional high-volume well and
has entered into a lease with the Village of Fishkill for the rights to another high-output
well. Please refer to the table on the following page for a summary of the City’s water
supply information.
The water district's primary storage system is contained in three reservoirs outside of the
City’s boundaries. The Melzingah Reservoir, located south of Beacon in Dutchess
Junction, has a reported capacity of fifty million (50,000,000) gallons in a watershed area
of approximately 1.42 square miles. Although the Reservoir has a fairly large drainage
area, its small storage capacity causes frequent depletion during periods of low rainfall.
The Mount Beacon Reservoir has a storage capacity of approximately one hundred and
eighty-two million (182,000,000) gallons (the estimate included in the 1974 Development
Plan was 200 million gallons), more than three times that of Melzingah, but an extremely
small watershed area of 0.25 square miles. As a result, Mt. Beacon Reservoir is
frequently under its holding capacity while water flows over at Melzingah.
The Cargill Reservoir, located in Putnam County south of the Town of Fishkill, has a
storage capacity of one hundred and fifty-eight million (158,000,000) gallons and a
watershed area of 1.29 square miles. This reservoir now serves the City exclusively.
Formerly, the reservoir served portions of the Town of Fishkill and provided emergency
service to the Village of Fishkill; when the water treatment system of the City was
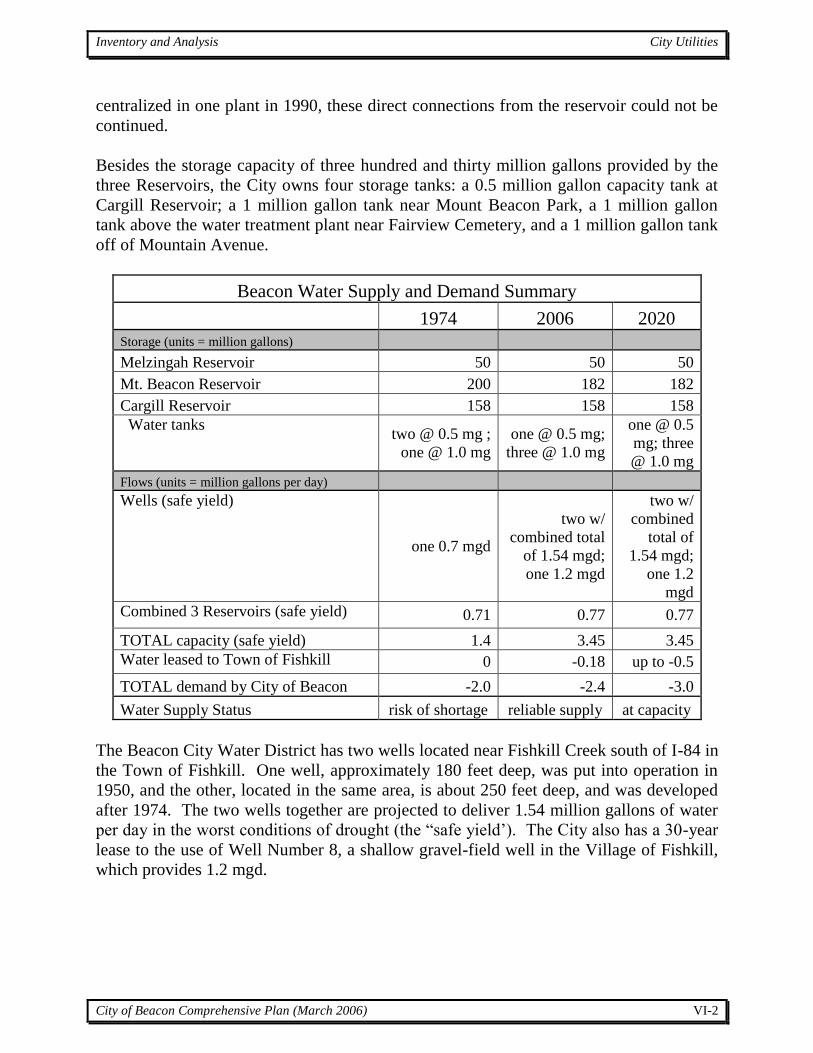
Inventory and Analysis City Utilities
City of Beacon Comprehensive Plan (March 2006) VI-2
centralized in one plant in 1990, these direct connections from the reservoir could not be
continued.
Besides the storage capacity of three hundred and thirty million gallons provided by the
three Reservoirs, the City owns four storage tanks: a 0.5 million gallon capacity tank at
Cargill Reservoir; a 1 million gallon tank near Mount Beacon Park, a 1 million gallon
tank above the water treatment plant near Fairview Cemetery, and a 1 million gallon tank
off of Mountain Avenue.
Beacon Water Supply and Demand Summary
1974 2006 2020
Storage (units = million gallons)
Melzingah Reservoir 50 50 50
Mt. Beacon Reservoir 200 182 182
Cargill Reservoir 158 158 158
Water tanks two @ 0.5 mg ;
one @ 1.0 mg
one @ 0.5 mg;
three @ 1.0 mg
one @ 0.5
mg; three
@ 1.0 mg
Flows (units = million gallons per day)
Wells (safe yield)
one 0.7 mgd
two w/
combined total
of 1.54 mgd;
one 1.2 mgd
two w/
combined
total of
1.54 mgd;
one 1.2
mgd
Combined 3 Reservoirs (safe yield) 0.71 0.77 0.77
TOTAL capacity (safe yield) 1.4 3.45 3.45
Water leased to Town of Fishkill 0 -0.18 up to -0.5
TOTAL demand by City of Beacon -2.0 -2.4 -3.0
Water Supply Status risk of shortage reliable supply at capacity
The Beacon City Water District has two wells located near Fishkill Creek south of I-84 in
the Town of Fishkill. One well, approximately 180 feet deep, was put into operation in
1950, and the other, located in the same area, is about 250 feet deep, and was developed
after 1974. The two wells together are projected to deliver 1.54 million gallons of water
per day in the worst conditions of drought (the “safe yield’). The City also has a 30-year
lease to the use of Well Number 8, a shallow gravel-field well in the Village of Fishkill,
which provides 1.2 mgd.
Inventory and Analysis City Utilities
City of Beacon Comprehensive Plan (March 2006) VI-3
The City built a water treatment plant in 1990 near the point at which the Fishkill Creek
enters the City. The plant has a current capacity to treat up to 4.0 mgd, and was designed
so that it could be expanded to treat up to 6.0 mgd.
The City has a contract to sell up to 0.5 mgd directly to the Town of Fishkill. Currently,
approximately 0.18 mgd is actually utilized by the Town. This usage is above and
beyond the water usage of properties within the City system that are outside of municipal
boundaries. These properties pay, on an individual basis, an out-of-town rate that is
twice the regular rate.
The distribution network system for the Beacon Water District consists primarily of 8",
10" and 12" feeder mains. The City has been continuously upgrading the water mains
since the 1970s. A 16" main was installed on Main Street in the late 1970s, which
relieved a water pressure problem during periods of high consumption. Water mains
under large portions of Route 9D, Tironda Avenue, and Leonard Street were also
replaced with 12", 12" and 8" mains, respectively. The water line from Cargill was
increased from a 10" main to an 18" main in order to accommodate the additional volume
from the two wells that it picks up along the Fishkill Creek, before emptying into the
water filtration plant. The mains from Melzingah and Mt. Beacon reservoirs have also
been replaced. The next priority for the distribution system is to replace a handful of
smaller undersized mains, such as 2" mains in low-density areas, which is necessary to
provide adequate pressure and volume for fire-fighting purposes. Also, as much as 20
percent of the distribution system consists of asbestos-based pipes installed from the late
1940s to the late 1950s. While it is generally accepted that these pipes do not pose a
threat to public health through drinking, there is a concern that when the water is
distributed through the air – such as when a person is taking a shower – the asbestos
fibers could be inhaled. These pipes continue to be replaced whenever roads are
upgraded throughout the City.
The City conducted a leak survey of the entire system in 2002, which detected leaks
totaling an estimated 180,000 gallons per day. All the leaks detected in this survey were
repaired.
Inventory and Analysis City Utilities
City of Beacon Comprehensive Plan (March 2006) VI-4
B. Sewage Disposal
The City of Beacon has a comprehensive public sewerage system comprised of lateral
sewers serving most of the City. The 24 inch intercepting sewer, extending from the
prison at Asylum Road to Route 52 at Franklin Avenue and then running parallel to
Fishkill Creek, receives flow from a number of mains and sub-mains, and conducts the
sewage to the treatment plant for treatment and disposal, discharging into the Hudson
River via a subaquaeous outfall at the mouth of Fishkill Creek.
In 1972 the City completed the upgrading of its 1963 primary treatment plant. The $4.5
million project provided secondary treatment (removal of 90% BOD and SS) for the
City's residential, commercial and industrial wastes. The plant, expanded to a design
flow of 6 mgd, and with present usage of 3.0 to 3.5 mgd, has sufficient capacity to handle
flow from the entire drainage basin area for the foreseeable future. The City’s plant
handles approximately 1.0 mgd pumped into the City’s system from the Town of Fishkill.
The Village of Fishkill has its own sewage treatment plant, which empties into Fishkill
Creek.
While the City’s treatment plant is more than adequate to handle sewage volume, during
rainstorms or other weather events that increase water flow within the drainage basin, the
treatment plant receives up to 10 or more mgd, or 4.0 mgd more than its effective
capacity. The combined sewage and stormwater does not overflow the system, but the
plant is not able to treat the combined flows for the appropriate time periods. Over the
past ten years, the City has spent one million dollars in capital improvement funds
detecting sewer and stormwater linkages and separating them. Technologies used to
detect problem areas have included smoke testing, video cameras, and sewer flow meters.
J:\DOCS2\100\Beacon\City Development Plan\Basic Studies\City Utilities 3.doc
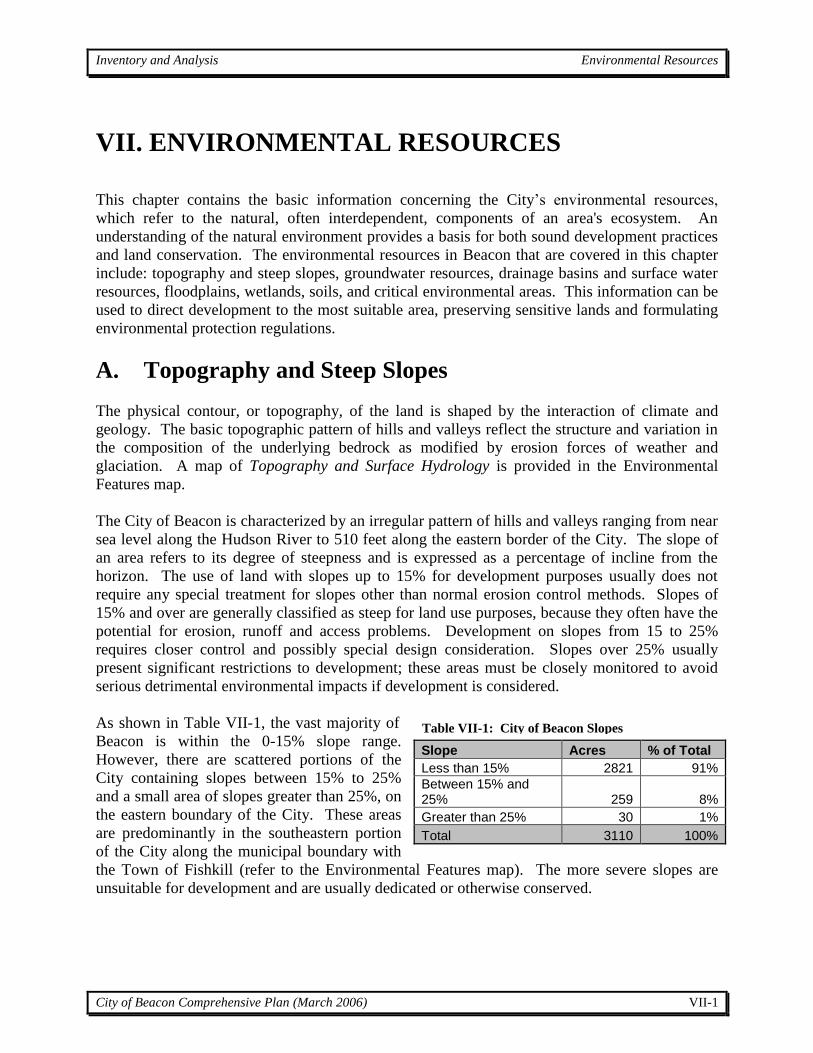
Inventory and Analysis Environmental Resources
City of Beacon Comprehensive Plan (March 2006) VII-1
Table VII-1: City of Beacon Slopes
VII. ENVIRONMENTAL RESOURCES
This chapter contains the basic information concerning the City’s environmental resources,
which refer to the natural, often interdependent, components of an area's ecosystem. An
understanding of the natural environment provides a basis for both sound development practices
and land conservation. The environmental resources in Beacon that are covered in this chapter
include: topography and steep slopes, groundwater resources, drainage basins and surface water
resources, floodplains, wetlands, soils, and critical environmental areas. This information can be
used to direct development to the most suitable area, preserving sensitive lands and formulating
environmental protection regulations.
A. Topography and Steep Slopes
The physical contour, or topography, of the land is shaped by the interaction of climate and
geology. The basic topographic pattern of hills and valleys reflect the structure and variation in
the composition of the underlying bedrock as modified by erosion forces of weather and
glaciation. A map of Topography and Surface Hydrology is provided in the Environmental
Features map.
The City of Beacon is characterized by an irregular pattern of hills and valleys ranging from near
sea level along the Hudson River to 510 feet along the eastern border of the City. The slope of
an area refers to its degree of steepness and is expressed as a percentage of incline from the
horizon. The use of land with slopes up to 15% for development purposes usually does not
require any special treatment for slopes other than normal erosion control methods. Slopes of
15% and over are generally classified as steep for land use purposes, because they often have the
potential for erosion, runoff and access problems. Development on slopes from 15 to 25%
requires closer control and possibly special design consideration. Slopes over 25% usually
present significant restrictions to development; these areas must be closely monitored to avoid
serious detrimental environmental impacts if development is considered.
As shown in Table VII-1, the vast majority of
Beacon is within the 0-15% slope range.
However, there are scattered portions of the
City containing slopes between 15% to 25%
and a small area of slopes greater than 25%, on
the eastern boundary of the City. These areas
are predominantly in the southeastern portion
of the City along the municipal boundary with
the Town of Fishkill (refer to the Environmental Features map). The more severe slopes are
unsuitable for development and are usually dedicated or otherwise conserved.
Slope Acres % of Total
Less than 15% 2821 91%
Between 15% and 25% 259 8%
Greater than 25% 30 1%
Total 3110 100%

Inventory and Analysis Environmental Resources
City of Beacon Comprehensive Plan (March 2006) VII-2
B. Groundwater Resources Groundwater is the supply of water beneath the earth’s surface. After precipitation is absorbed
by the soil, it travels beneath the surface and is stored in a water-saturated underground layer of
earth, unconsolidated deposits, or porous stone. An aquifer is any soil or rock formation that
contains water and permits sufficient water movement to yield water to wells and springs.
There is an aquifer located in the eastern portion of the city, running in a northeast to southwest
direction following Fishkill Creeks. Aquifers play an important role in the regional water supply
and should be an important component in land use decisions.
C. Drainage Basins and Surface Water Resources
A drainage basin is a large watershed that catches precipitation and drains it over or below the
earth’s surface to a specific waterbody. Flowing from high ground to low and following the
contours of the land, surface water flows from the headwaters where streams begin, to the mouth
where the stream reaches its destination in a larger waterbody, such as a lake or river. The
topographical ridges that nearly encircle a drainage basin and separate the drainage of one basin
from another define watershed drainage basin boundaries. It is important to note, however, that a
hierarchy of drainage basins covers any land area, such that each major drainage basin is made
up of smaller sub-basins, and which a combination of several major drainage basins may form a
larger regional drainage basin.
The City falls within one major drainage basin known as the Hudson-Wappinger River Basin, as
designated by the New York State Department of Environmental Conservation. Fishkill Creek is
the main stream that flows in a northeast to southwesterly direction through the City of Beacon
toward the Hudson River which forms the western boundary of the City. A portion of the
headwaters of Dry Brook are located within the eastern portion of the City, before flowing south
to Beacon Reservoir in the Town of Fishkill. The City’s drainage basins can be further
subdivided into two sub-basins: Fishkill Creek which contains the stream by the same name as
well as Dry Brook, and Hudson River which contains all lands northeast of the Fishkill Creek
where surface water flows directly toward the Hudson River.
D. Floodplains
Floodplains are low-lying land areas adjacent to rivers and streams that are subject to recurring
inundation from heavy rains or severe snowmelts. Left undisturbed, floodplains provide many
beneficial functions, including natural moderation of floods, water quality maintenance, and
ground water recharge. A "100-year floodplain" describes an area subject to a 1% probability of
a certain size flood occurring in any given year. Since floodplains can be mapped, the boundary
of the 100-year flood is commonly used in floodplain mitigation programs to identify areas
where the risk of flooding is significant. In reviewing floodplains maps, however, it is important
to note that the locations of floodplain boundaries are not static. Floodplain filling, changes in
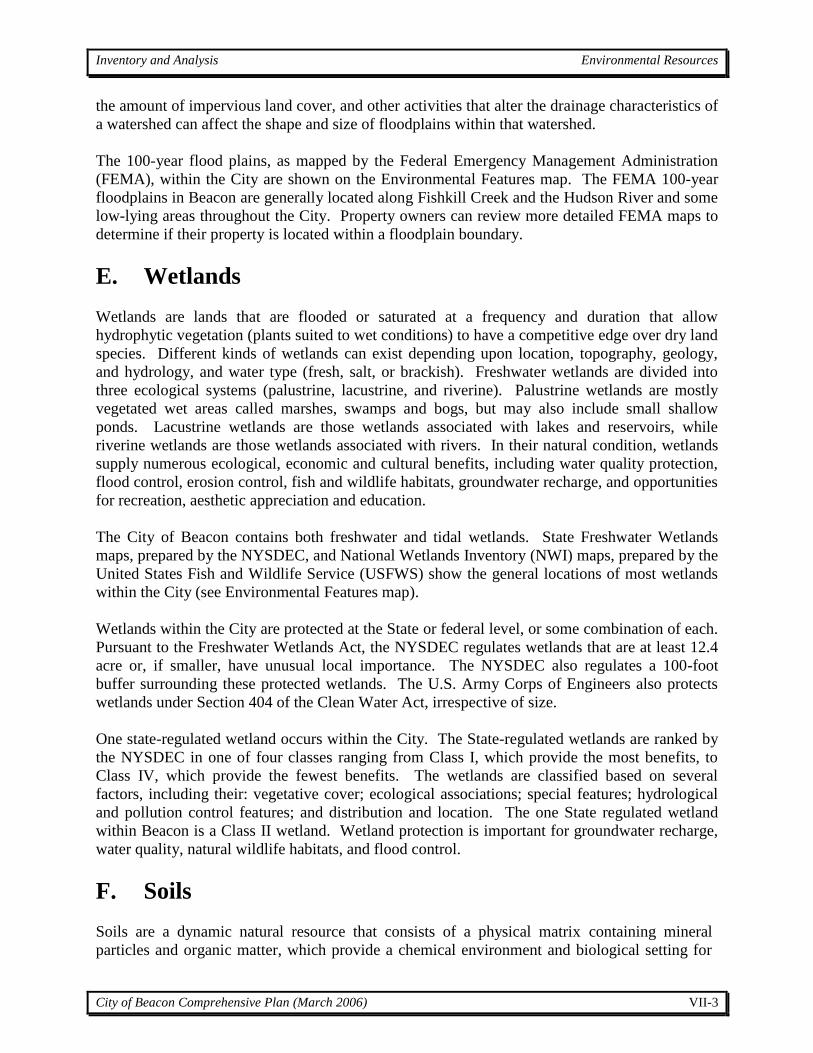
Inventory and Analysis Environmental Resources
City of Beacon Comprehensive Plan (March 2006) VII-3
the amount of impervious land cover, and other activities that alter the drainage characteristics of
a watershed can affect the shape and size of floodplains within that watershed.
The 100-year flood plains, as mapped by the Federal Emergency Management Administration
(FEMA), within the City are shown on the Environmental Features map. The FEMA 100-year
floodplains in Beacon are generally located along Fishkill Creek and the Hudson River and some
low-lying areas throughout the City. Property owners can review more detailed FEMA maps to
determine if their property is located within a floodplain boundary.
E. Wetlands
Wetlands are lands that are flooded or saturated at a frequency and duration that allow
hydrophytic vegetation (plants suited to wet conditions) to have a competitive edge over dry land
species. Different kinds of wetlands can exist depending upon location, topography, geology,
and hydrology, and water type (fresh, salt, or brackish). Freshwater wetlands are divided into
three ecological systems (palustrine, lacustrine, and riverine). Palustrine wetlands are mostly
vegetated wet areas called marshes, swamps and bogs, but may also include small shallow
ponds. Lacustrine wetlands are those wetlands associated with lakes and reservoirs, while
riverine wetlands are those wetlands associated with rivers. In their natural condition, wetlands
supply numerous ecological, economic and cultural benefits, including water quality protection,
flood control, erosion control, fish and wildlife habitats, groundwater recharge, and opportunities
for recreation, aesthetic appreciation and education.
The City of Beacon contains both freshwater and tidal wetlands. State Freshwater Wetlands
maps, prepared by the NYSDEC, and National Wetlands Inventory (NWI) maps, prepared by the
United States Fish and Wildlife Service (USFWS) show the general locations of most wetlands
within the City (see Environmental Features map).
Wetlands within the City are protected at the State or federal level, or some combination of each.
Pursuant to the Freshwater Wetlands Act, the NYSDEC regulates wetlands that are at least 12.4
acre or, if smaller, have unusual local importance. The NYSDEC also regulates a 100-foot
buffer surrounding these protected wetlands. The U.S. Army Corps of Engineers also protects
wetlands under Section 404 of the Clean Water Act, irrespective of size.
One state-regulated wetland occurs within the City. The State-regulated wetlands are ranked by
the NYSDEC in one of four classes ranging from Class I, which provide the most benefits, to
Class IV, which provide the fewest benefits. The wetlands are classified based on several
factors, including their: vegetative cover; ecological associations; special features; hydrological
and pollution control features; and distribution and location. The one State regulated wetland
within Beacon is a Class II wetland. Wetland protection is important for groundwater recharge,
water quality, natural wildlife habitats, and flood control.
F. Soils
Soils are a dynamic natural resource that consists of a physical matrix containing mineral
particles and organic matter, which provide a chemical environment and biological setting for
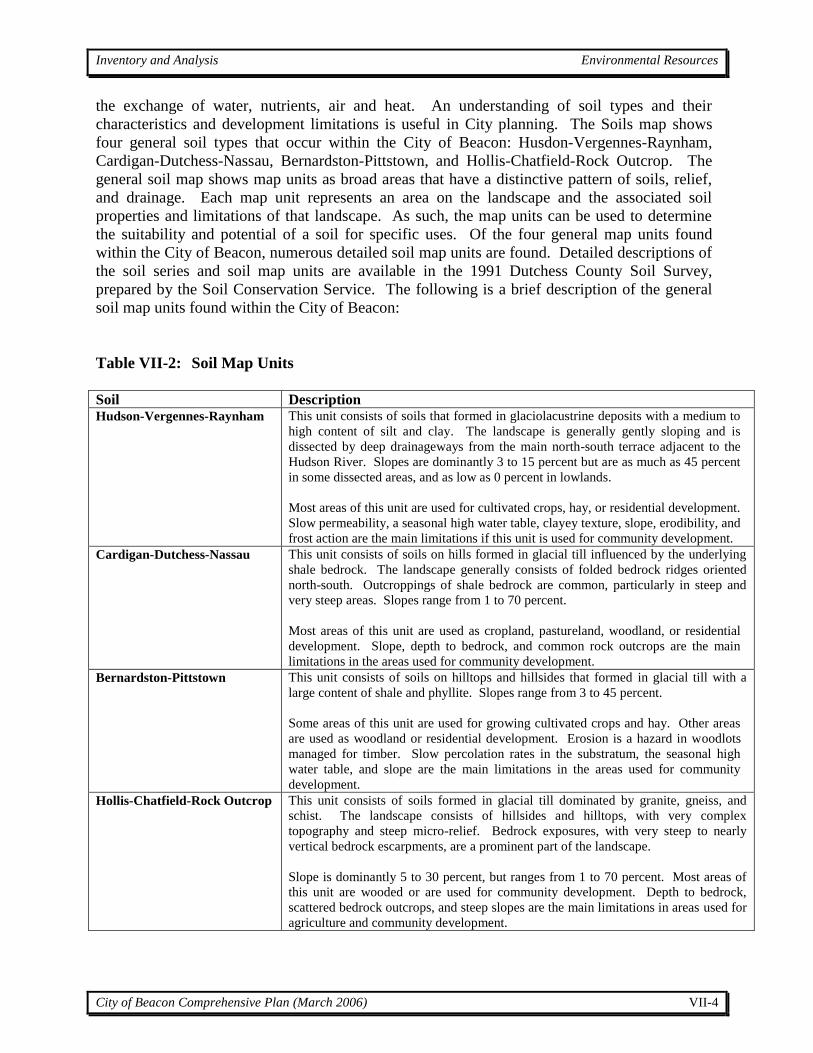
Inventory and Analysis Environmental Resources
City of Beacon Comprehensive Plan (March 2006) VII-4
the exchange of water, nutrients, air and heat. An understanding of soil types and their
characteristics and development limitations is useful in City planning. The Soils map shows
four general soil types that occur within the City of Beacon: Husdon-Vergennes-Raynham,
Cardigan-Dutchess-Nassau, Bernardston-Pittstown, and Hollis-Chatfield-Rock Outcrop. The
general soil map shows map units as broad areas that have a distinctive pattern of soils, relief,
and drainage. Each map unit represents an area on the landscape and the associated soil
properties and limitations of that landscape. As such, the map units can be used to determine
the suitability and potential of a soil for specific uses. Of the four general map units found
within the City of Beacon, numerous detailed soil map units are found. Detailed descriptions of
the soil series and soil map units are available in the 1991 Dutchess County Soil Survey,
prepared by the Soil Conservation Service. The following is a brief description of the general
soil map units found within the City of Beacon:
Table VII-2: Soil Map Units
Soil Description Hudson-Vergennes-Raynham
This unit consists of soils that formed in glaciolacustrine deposits with a medium to
high content of silt and clay. The landscape is generally gently sloping and is
dissected by deep drainageways from the main north-south terrace adjacent to the
Hudson River. Slopes are dominantly 3 to 15 percent but are as much as 45 percent
in some dissected areas, and as low as 0 percent in lowlands.
Most areas of this unit are used for cultivated crops, hay, or residential development.
Slow permeability, a seasonal high water table, clayey texture, slope, erodibility, and
frost action are the main limitations if this unit is used for community development.
Cardigan-Dutchess-Nassau
This unit consists of soils on hills formed in glacial till influenced by the underlying
shale bedrock. The landscape generally consists of folded bedrock ridges oriented
north-south. Outcroppings of shale bedrock are common, particularly in steep and
very steep areas. Slopes range from 1 to 70 percent.
Most areas of this unit are used as cropland, pastureland, woodland, or residential
development. Slope, depth to bedrock, and common rock outcrops are the main
limitations in the areas used for community development. Bernardston-Pittstown
This unit consists of soils on hilltops and hillsides that formed in glacial till with a
large content of shale and phyllite. Slopes range from 3 to 45 percent.
Some areas of this unit are used for growing cultivated crops and hay. Other areas
are used as woodland or residential development. Erosion is a hazard in woodlots
managed for timber. Slow percolation rates in the substratum, the seasonal high
water table, and slope are the main limitations in the areas used for community
development. Hollis-Chatfield-Rock Outcrop This unit consists of soils formed in glacial till dominated by granite, gneiss, and
schist. The landscape consists of hillsides and hilltops, with very complex
topography and steep micro-relief. Bedrock exposures, with very steep to nearly
vertical bedrock escarpments, are a prominent part of the landscape.
Slope is dominantly 5 to 30 percent, but ranges from 1 to 70 percent. Most areas of
this unit are wooded or are used for community development. Depth to bedrock,
scattered bedrock outcrops, and steep slopes are the main limitations in areas used for
agriculture and community development.
Inventory and Analysis Environmental Resources
City of Beacon Comprehensive Plan (March 2006) VII-5
G. Depth to Bedrock
In the City of Beacon, the depth to bedrock ranges from greater than five feet (60 inches) to 10
inches. Soils where the bedrock is near the surface may present many problems for
development. Blasting is often required to build foundations. Septic disposal is a problem
because the effluent flows along the impermeable rock rather than percolating down through the
soil. Shallow depth to bedrock soils are also a problem for maintaining mature forest cover.
Since roots cannot penetrate the rock to any great extent, trees are susceptible to being blown
over during storms with heavy rains and high winds. The Depth to Bedrock map shows areas of
the City that have a shallow depth to bedrock (less than 60 inches).
J:\DOCS2\100\Beacon\City Development Plan\Basic Studies\Inventory and Analysis Document\Environmental Resources.doc