Embed Size (px)
Citation preview
5/7/2018 Inventary Mgnt - slidepdf.com
http://slidepdf.com/reader/full/inventary-mgnt 1/126
1
A STUDY ON
INVENTORY MANAGEMENT
WITH REFERENCE TO
NAGARJUNA FERTILIZERS AND CHEMICALS LTD
KAKINADA
A project report submitted to the Department of Management Studies, jntuk,
Kakinada, in partial Fulfillment for the award of the degree of
MASTER OF BUSINESS ADMINISTRATION
Submitted by
G PRABHAKAR REDDY
NALANDA INSTITUTE OF TECHNOLOGY
SATTENAPALLI(KANTEPUDI)
2009 - 2011

5/7/2018 Inventary Mgnt - slidepdf.com
http://slidepdf.com/reader/full/inventary-mgnt 2/126
2
ACKNOWLEDGMENT
I take this opportunity to express my gratitude to
SRI.S.KRISHNA MURTHY,DGM(PLANT HPD),
Mr. P.S.N. MURTHY, D.G.M (FINANCE),
for giving me the privilege to undergo project work on
³A STUDY on Inventory management in NFCL.´
I would like to express my sincere thanks to
Smt Y.RAMADEVI ,HEAD TRAINING &DEVELOPMENT,
of NFCL, who guided me throughout tenure of this project, work
in innumerable ways.
In the presentation of this report I recall with a sincere
gratitude to each of those who have been a source of immense help
and inspiration during the process of my project work. I feel grateful
to my family members and friends for their kind co-operation.
5/7/2018 Inventary Mgnt - slidepdf.com
http://slidepdf.com/reader/full/inventary-mgnt 3/126
3
DECLARATION
I hereby declare that this project entitled
³INVENTORY MANAGEMENT´ with reference to
³NAGARJUNA FERTILIZERS AND CHEMICALS LTD,
KAKINADA´ is the original work done by me and submitted
to JNTUK, KAKINADA in partial fulfillment of the
requirement for the award of the degree of
MASTER OF BUSINESS ADMINISTRATION and this
has not been submitted to any other university or publication
any time.
5/7/2018 Inventary Mgnt - slidepdf.com
http://slidepdf.com/reader/full/inventary-mgnt 4/126
4
CONTENTS
CHAPTER-I
INTRODUCTION
SCOPE OF THE STUDY
SIGNIFICANCE OF THE STUDY
OBJECTIVES
METHODOLOGY
LIMITATIONS
CHAPTER-II
INDUSTRY PROFILE
CHAPTER-III
COMPANY PROFILE
CHAPTER-IV
THEORETICAL FRAMEWORK
CHAPTER-V
ANALSIS &INTERPRETATIONS
CHAPTER-VI
FINDINGS
SUGGESTIONS
CONCLUSION
BIBLOGRAPHY
5/7/2018 Inventary Mgnt - slidepdf.com
http://slidepdf.com/reader/full/inventary-mgnt 5/126
5
INTRODUCTION
Finance is regarded as ́ THE LIFE BLOOD OF BUSINESS
ENTERPRISEµ. Finance function has become so important that it has given
birth to financial management as a separate subject. So, this subject is
acquiring universal applicability. Financial Management is that managerial
activity which is concerned with the planning and controlling of the firm·s
financial resources. As a separate activity or discipline is of recent origin it
was a branch of economics till 1890. Still today it has no unique knowledge
of its own, and it draws heavily on economy for its theoretical co ncepts.
The subject of financial management is of immense interest to both
academicians and practicing managers. It is of great interest to
academicians because the subject is still developing, and there are still
certain areas where controversies exist for which no unanimous solutions
have been reached as yet. Practicing Managers are interested in this subject
because among the most crucial decisions of the firm are those which relate
to finance and an understanding of the theory of financial managemen t
provides them with conceptual and analytical insights .
5/7/2018 Inventary Mgnt - slidepdf.com
http://slidepdf.com/reader/full/inventary-mgnt 6/126
6
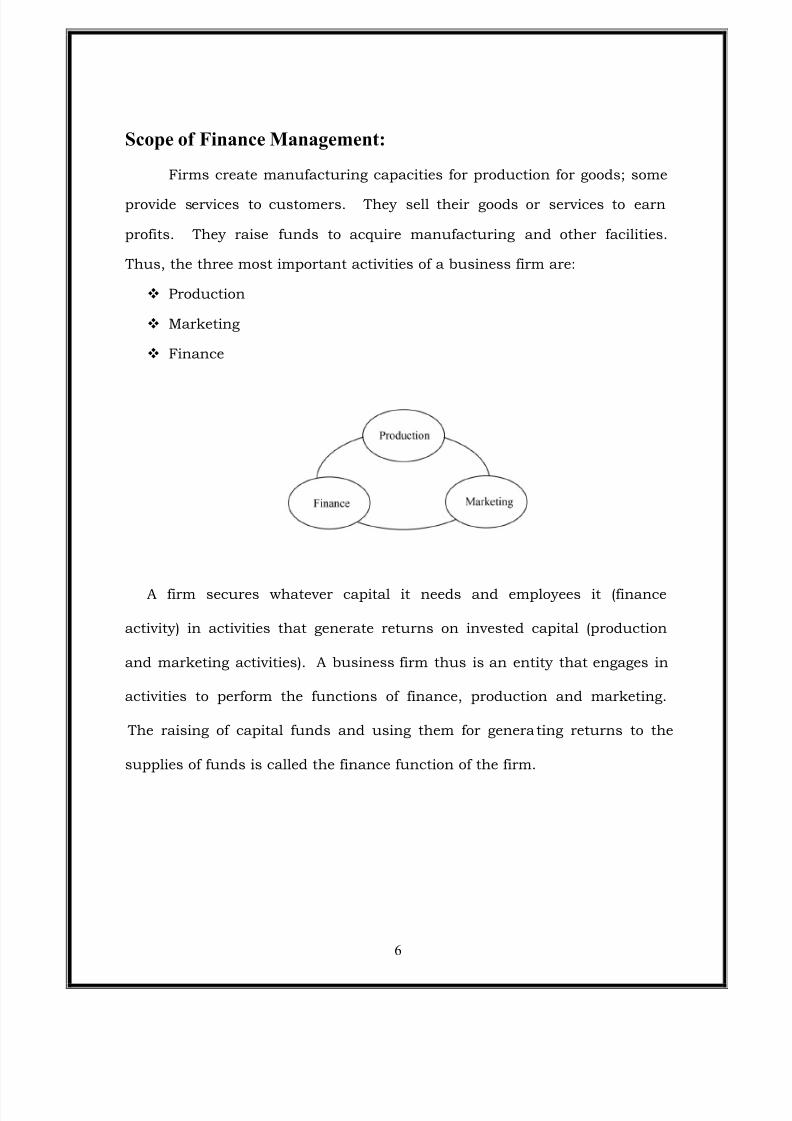
Scope of Finance Management:
Firms create manufacturing capacities for production for goods; some
provide services to customers. They sell their goods or services to earn
profits. They raise funds to acquire manufacturing and other facilities.
Thus, the three most important activities of a business firm are:
Production
Marketing
Finance
A firm secures whatever capital it needs and employees it (finance
activity) in activities that generate returns on invested capital (production
and marketing activities). A business firm thus is an entity that engages in
activities to perform the functions of finance, production and marketing.
The raising of capital funds and using them for generating returns to the
supplies of funds is called the finance function of the firm.
5/7/2018 Inventary Mgnt - slidepdf.com
http://slidepdf.com/reader/full/inventary-mgnt 7/126
7
FUNCTIONS OF FINANCIAL MANAGEMENT
Two significant contribution to the development of
modern theory of financial management are:
Theory of Portfolio Management developed by Harry Markowitz in
1950, which deals with portfolio selection with risky investment. This
theory uses statistical concepts to quantify the risk -return
characteristics of holding a group/portfolio of securities, investment
or assets.
The theory of Leverage and Valuation of Fire developed by Modigliani
and Miller in 1958. They have shown by introducing analytical
approach as to how the financial decision making in any firm be
oriented towards maximization of the value of the firm and the
maximization of the shareholders wealth.
Type of Financial Actions:
1. The Financial Management of trading or manufacturing firms
2. Financial Management of Financial Institutions.
3. Financial activities relating to investment activities.
5/7/2018 Inventary Mgnt - slidepdf.com
http://slidepdf.com/reader/full/inventary-mgnt 8/126
8
International Finance:
Public Finance:
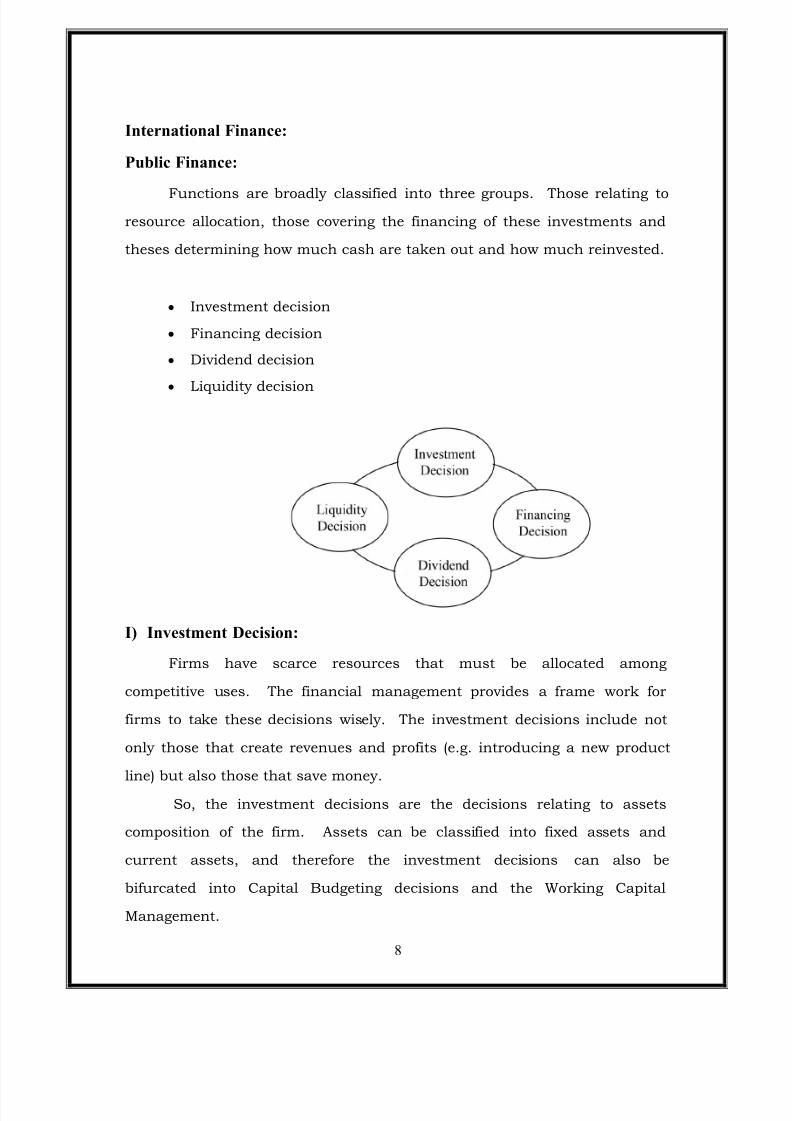
Functions are broadly classified into three groups. Those relating to
resource allocation, those covering the financing of these investments and
theses determining how much cash are taken out and how much reinvested.
y Investment decision
y Financing decision
y Dividend decision
y
Liquidity decision
I) Investment Decision:
Firms have scarce resources that must be allocated among
competitive uses. The financial management provides a frame work for
firms to take these decisions wisely. The investment decisions include not
only those that create revenues and profits (e.g. introducing a new product
line) but also those that save money.So, the investment decisions are the decisions relating to assets
composition of the firm. Assets can be classified into fixed assets and
current assets, and therefore the investment decisions can also be
bifurcated into Capital Budgeting decisions and the Working Capital
Management.
5/7/2018 Inventary Mgnt - slidepdf.com
http://slidepdf.com/reader/full/inventary-mgnt 9/126
9
The Capital Budgeting decisions are more crucial for any firm. A
finance manager may be asked to decide about.
1. Which asset should be purchased out of different alternative options;
2. To buy an asset or to get it on lease;
3. To produce a part of the final product or to procure it from some other
supplier;
4. To by or not an other firm as a running concern;
5. Proposal of merger of other group firms to avail the synergies o f
consolidation.
Working Capital Management, on the other hand, deals with the
Management of current assets of the firm. Though the current assets do not
contribute directly to the earnings, yet their existence is necessitated for the
proper, efficient and optimum utilization of fixed assets. There are dangers
of both the excessive working capital as well as the shortage of working
capital. A finance manager has to ensure sufficient and adequate working
capital to the firm.
II) Financing Decisions:
As firms make decisions concerning where to invest these resources,
they have also to decide two they should raise resources. There are two
main sources of finance for nay firm, the shareholders funds and the
borrowed funds. The borrowed funds are always repayable and require
payment of a committed cost in the form of interest on a periodic basis. The
borrowed funds are relatively cheaper but always entail risk.
5/7/2018 Inventary Mgnt - slidepdf.com
http://slidepdf.com/reader/full/inventary-mgnt 10/126
10
The risk is known as the financial risk i.e., the risk of insolvency due to non -
payment of interest or non-repayment of capital amount. The shareholders
fund is the main source of funds to any firm.
This may comprise of the equity share capital, preference share capital and
the accumulated profits. Firms usually adopt a policy of employing both the
borrowed funds as well as the shareholders funds to finance their activities.
The employment of these sources in combination is also known as financial
management.
III) Dividend Decisions:
Another major area of the decision marking by a finance manager is
known as the Dividend decisions which deal with the appropriation of after
tax profits. These profits are available to be distributed among the
shareholders or can be retained by the firm for reinvestment with in the
firm. The profits which are not distributed are impliedly retained in the
firm. Al firms whether small or big, have to decide how much of the profits
should be reinvested back in the business and how much should be taken
out in form of dividends i.e., return on capital. On one hand, paying out
more to the owners may help satisfying their expectations; on the other
hand, doing so has other implications as a business that reinvests less will
tend to grow slower.
Reinvestment opportunities available to the firm,
The opportunity rate of the shareholders .
5/7/2018 Inventary Mgnt - slidepdf.com
http://slidepdf.com/reader/full/inventary-mgnt 11/126
11
IV) Liquidity Decisions:
Current assets management that affects a firm·s
liquidity is yet another important finance function, in addition to the
management of long-term assets. Current assets should be managed
efficiently for safeguarding the firm against the dangers of illiquidity
and insolvency. Investment in current assets a ffects the firm·s
profitability, liquidity and risk.
The Identification of the relevant groups:
The various groups which may have stakes in the financial decisions
making of a firm and therefore required to be3 considered while taking
financial decisions are:
The shareholders
The debt investors,
The employees,
The customer and the suppliers,
The public,
The Government, and
The Management
Objective of the Financial Decision Making
The following two are often considered as the objectives of the
financial management.
The maximization of the profits of the firm, and
The maximization of the shareholders wealth
5/7/2018 Inventary Mgnt - slidepdf.com
http://slidepdf.com/reader/full/inventary-mgnt 12/126
12
Maximization of the Profits of the firm:
For any business firm, the maximization of the profits is often
considered as the implied objective and therefore it is natural to retain the
maximization of profit as the goal of the financial also.
The profit maximization as the objective of financial management has
a built in favour for its choice. The profit is regarded as yard stick for the
economic efficiency of any form. If all business firm of the society are
working towards profit maximization then the economic resources of the
society as a whole would have been most efficiently, economically and
profitably used. The profit maximization by one firm and if targeted by all,
will ensure the maximization of the welfare of the society. So, the profit
maximization as objective of financial management will result inefficient
allocation of resources not only from the point of view of the firm but also for
the society as such.
It ignores the risk.
The profit maximization concentrates on the profitability only and
ignores the financing aspect of that decision and the risk associated
with that financing.
It ignores the timings of costs and returns and thereby ignores the
time value of money
The profit maximization as an objective is ague and ambiguous.
The profit maximization may widen the gap between the perception of
the management and that of the shareholders.
5/7/2018 Inventary Mgnt - slidepdf.com
http://slidepdf.com/reader/full/inventary-mgnt 13/126
13
The profit maximization borrows the concept of profit from the field of
accounting and thus tends to concentrate on the immediate effect of a
financial decisions as reflected in the increase in the profit of that year
or in near future.
Maximization of Shareholder Wealth:
This objective is generally expressed in term of maximization of the
value of a share of a firm. It is necessary to know and determine as to how
the maximization of shareholders wealth is to be measured.
The measure of wealth which is used in financial management is the
concept of economic value. The economic value is defined as the present
value of the future cash flows generated by a decision, discounted as
appropriate rate of discount which reflects the degree of associated risk.
This measure of economic value is based on cash flows rather than profit.
The economic value concept is objective in its approach and also takes into
account the timing of cash flows and the level of risk through the
discounting process .
Profit Maximization Versus Wealth Maximization:
The objective of profit maximization measures the performance of a
firm by a looking at its total profit. The objective of maximization of the
shareholders wealth is operational and objective in its approa ch. A firm that
wishes to maximize the profits may opt to pay no dividend and to reinvest
the retained earnings, whereas a firm that wishes to maximize the

5/7/2018 Inventary Mgnt - slidepdf.com
http://slidepdf.com/reader/full/inventary-mgnt 14/126
14
shareholders wealth may pay regular dividends .
5/7/2018 Inventary Mgnt - slidepdf.com
http://slidepdf.com/reader/full/inventary-mgnt 15/126
15
THE CHANGING ROLE OF FINANCIAL MANAGEMENT:
Many changes in the contemporary world, financial management has
undergone significant changes over the years. The financial management
has a very limited role in business enterprise. Finance Manger is responsible
only for maintaining financial records, preparing reports of the company·s
status, performance and arranging funds recorded by company so that it
would meet its obligations in time.
Financial Manager as a matter of act was regarded as specializes
officers in the company concerned only with administer ing sources of funds,
he has called upon only when the company experimental the problem
relates the financial managers to locate the suitable sources for funds and
additional funds. The emphasis on decision making has continued in recent
years.
First there was been increased belief the cost of capital producer the
required accurate measurement of the cost of capital.
Secondly, capital has been in short supplies the old interest in the
ways of raising funds.
Thirdly, there was has been a continued managerial activity that has
led to revealed interests in takeovers.
Fourthly, accelerated progress in transportation and communication
has brought the countries of the world close together.
They in turn have stimulated interest in the international finance.
5/7/2018 Inventary Mgnt - slidepdf.com
http://slidepdf.com/reader/full/inventary-mgnt 16/126
16
IMPORTANCE OF FINANCIAL MANGEMENT:
Finance Management is of greater importance on the present
corporate world. It is a science of money, which permits the authorizes to go
further.
SIGNIFICANCE OF FINANCIAL MANAGEMENT CAN BESUMMARISED AS:
It assists in the assessment of financial needs of industry large or
small and indicates the internal and external resources for meeting them. It
assesses the efficiency and effectiveness of the financial institution in
mobilizing individual or corporate science. It also prescribes various means
for such mobilization of savings into desirable investment channels.
It assists the management while investing the funds in profitable
projects by analyzing the viability of that project through capital budgeting
techniques. It permits the management to safeguard against the interest of
shareholders by properly utilizing the funds procured from different sources
and it also regulates and controls the funds to get maximize use.
5/7/2018 Inventary Mgnt - slidepdf.com
http://slidepdf.com/reader/full/inventary-mgnt 17/126
17
SCOPE OF THE STUDY:-
The scope of my study is confined to one of the key areas of finance i.e.
inventory management. The study concentrates on the methods and techniques
followed by NAGARJUNA FERTILIZERS AND CHEMICALS LTD for its
inventory management and its relative merits and demerits.
The study appraises the company¶s success in meeting the requirements of the
company and the country by helping the farmers to raise agriculture output to
meet the requirement of the country¶s growing population for food grains.
PURPOSE OF THE STUDY:-
To study about the inventory management at NAGARJUNA
FERTILIZERS AND CHEMICALS LTD and to have an idea about the
utilization of the inventory and little more about the storage procedure that are
practically implemented in organization. Inventory plays a vital role in every
manufacturing organization to have an uninterrupted production process by
maintaining an optimum level of raw materials available at all time.
5/7/2018 Inventary Mgnt - slidepdf.com
http://slidepdf.com/reader/full/inventary-mgnt 18/126
18
OBJECTIVES OF THE STUDY:-
The study titled ³INVENTORY MANAGEMENT´- A case study of
Nagarjuna fertilizers and chemicals ltd., has been carried out with the following
objectives.
To find whether the NFCL ensures a continuous supply of materials to
facilitate uninterrupted production.
To study the inventory management policies, techniques and their
effectiveness.
To give suggestions to increase inventory turnover.
To make an appropriate investment in inventories and keep it at an optimum
level.
To study the efficiency with which the firm is utilizing its inventory management
skills in generating more sales
To study the extent to which the firm has used its inventory management skills and
maximize the wealth of the organization.
This study is made to know whether the inventory is properly managed or not.
To review the structure, original growth and performance of NFCL during the study
period.
5/7/2018 Inventary Mgnt - slidepdf.com
http://slidepdf.com/reader/full/inventary-mgnt 19/126
19
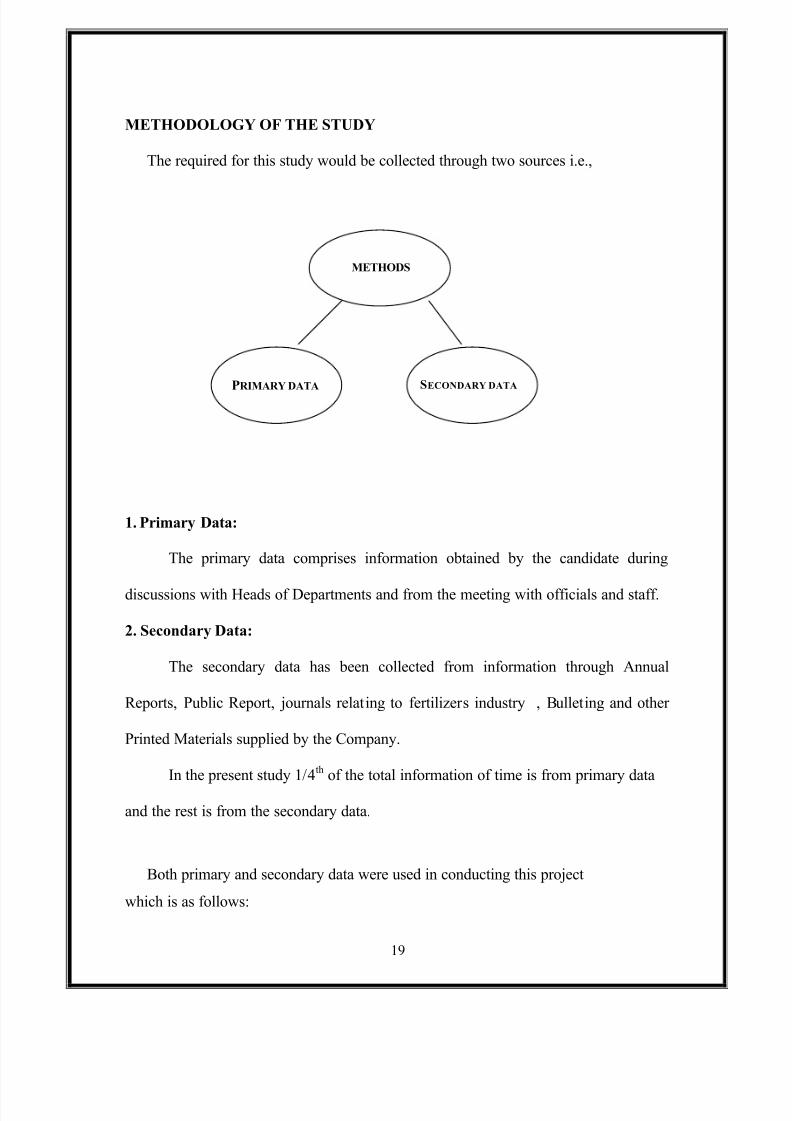
METHODOLOGY OF THE STUDY
The required for this study would be collected through two sources i.e.,
1. Primary Data:
The primary data comprises information obtained by the candidate during
discussions with Heads of Departments and from the meeting with officials and staff.
2. Secondary Data:
The secondary data has been collected from information through Annual
Reports, Public Report, journals relating to fertilizers industry , Bulleting and other
Printed Materials supplied by the Company.
In the present study 1/4
th
of the total information of time is from primary data
and the rest is from the secondary data.
Both primary and secondary data were used in conducting this project
which is as follows:
METHODS
PRIMARY DATA SECONDARY DATA
5/7/2018 Inventary Mgnt - slidepdf.com
http://slidepdf.com/reader/full/inventary-mgnt 20/126
20
LIMITATIONS:-
The below mentioned are the constraints under which my study has been
carried out
The study is limited to NFCL, Kakinada; it does not relate to any other
company of Nagarjuna Group or other firm¶s of Fertilizer Industry.
The smaller time frame for understanding this study is also a significant
limitation.
The ratios are calculated on the basis of past data; these are not future
indicators.
The scope of study is limited to the last five years balance sheets.
The analysis is made basing only on the Annual Reports of NFCL.
Most of the information has been kept confidential and as such is not passed on
as a part of the policy of the company.
Since the number and size of inventory is very large, all the raw materials
could not be included in the analysis.

5/7/2018 Inventary Mgnt - slidepdf.com
http://slidepdf.com/reader/full/inventary-mgnt 21/126
21
5/7/2018 Inventary Mgnt - slidepdf.com
http://slidepdf.com/reader/full/inventary-mgnt 22/126
22
INDUSTRY PROFILE
India has been predominantly considered as an agricultural dependent
economy. Agriculture plays a very dominant role as more than one-fourth of our GDP
come from this sector. Nearly 70% of population depends on the agriculture for their
lively-hood. The basic need for an agricultural dependant economy is fertilizers and
urea is one of the main fertilizers. India is the second largest manufacturing country
in the world.
All fertilizers consist if three main ingredients.
Nitrogen²(N) -- which promotes general plant growth
Phosphorous²(P) -- which promotes flowering
Potassium ± (K) ± which promotes strong roots.
The ingredients are mixed in various combinations because plants have different
needs.
The combinations are indicated by a three number code:
The first number is the percent of nitrogen (N)
The second number is the percent of phosphorus (P)
The third number is the percent of potassium (K)
About Fertilizer:
Fertilizer is simply, plant food. Just like the human body needs vitamins and
minerals, plants need nutrients in order to grow. Plants need large amounts of three
nutrients ± nitrogen, phosphorus, and potassium. These are commonly referred to as
macronutrients. Fertilizer makers take those three nutrients from nature and put them
into soluble forms that plants can easily use.
There are a number of other nutrients plants need in small amounts. These are
referred to as the minor nutrients, or micronutrients. These many nutrients are
typically produced separately, but end up being mixed together in varying amou nts to
match the needs of a particular crop. The analysis found on each bag or bulk
shipment of fertilizer tells the farmer or consumer the amount of nutrients being
5/7/2018 Inventary Mgnt - slidepdf.com
http://slidepdf.com/reader/full/inventary-mgnt 23/126
23
supplied. States have a system of laws and regulations that ensure the fertilizer is
properly labeled and delivers the amount for nutrients stated on the bag.
Our world would be vastly different without commercial fertilizers. Following
the World War II, new technologies allowed for the rapid expansion of fertilizer
production. Coupled with growing food demand and the development of higher -
yielding crop varieties, fertilizer helped fuel the Green Revolution. Today, the
abundance of food we enjoy is just one way fertilizers help enrich the world around
us.
While fertilizers provide many important benefits that are necessary for our
way of life, the improper use of fertilizers can harm our environment. We¶ve used the
most recent developments in science to study our products and make sure safety
comes first.
FERTILIZER:
Fuel for growing plants just like humans and animals, plants need adequate
water, sufficient food, and protection from diseases and pests to be healthy.
Commercially produced fertilizers give growing plants the nutrients they crave in the
form they can most readily absorb and use: nitrogen (N), available phosphate (P) and
soluble potash (K), Elements needed in smaller amounts, or micronutrients, include
iron (Fe); zinc (Zn), copper (Cu) and boron (B).
Each crop year, certain amounts of these nutrients are depleted and must be
returned to the soil to maintain fertility and ensure continued, healthy future crops.
Scientists project that the earth¶s soil contains less than 20 percent of the organic plant
nutrients needed to meet our current food production needs. Therefore, through the
scientific application of manufactured fertilizers, farmers are meeting the challenge of
the future, today.
Another component of plant DNA is phosphate, which helps plants to usewater efficiently. It also helps to promote root growth and improves the quality of
grain and accelerates its ripening. And potassium, commonly called potash, is
important because it is necessary for photosynthesis, which is the production,
transportat ion and accumulation of sugars in the plant. Potash makes plants hardy and
helps them to withstand the stress of drought and fight off disease.
5/7/2018 Inventary Mgnt - slidepdf.com
http://slidepdf.com/reader/full/inventary-mgnt 24/126
24
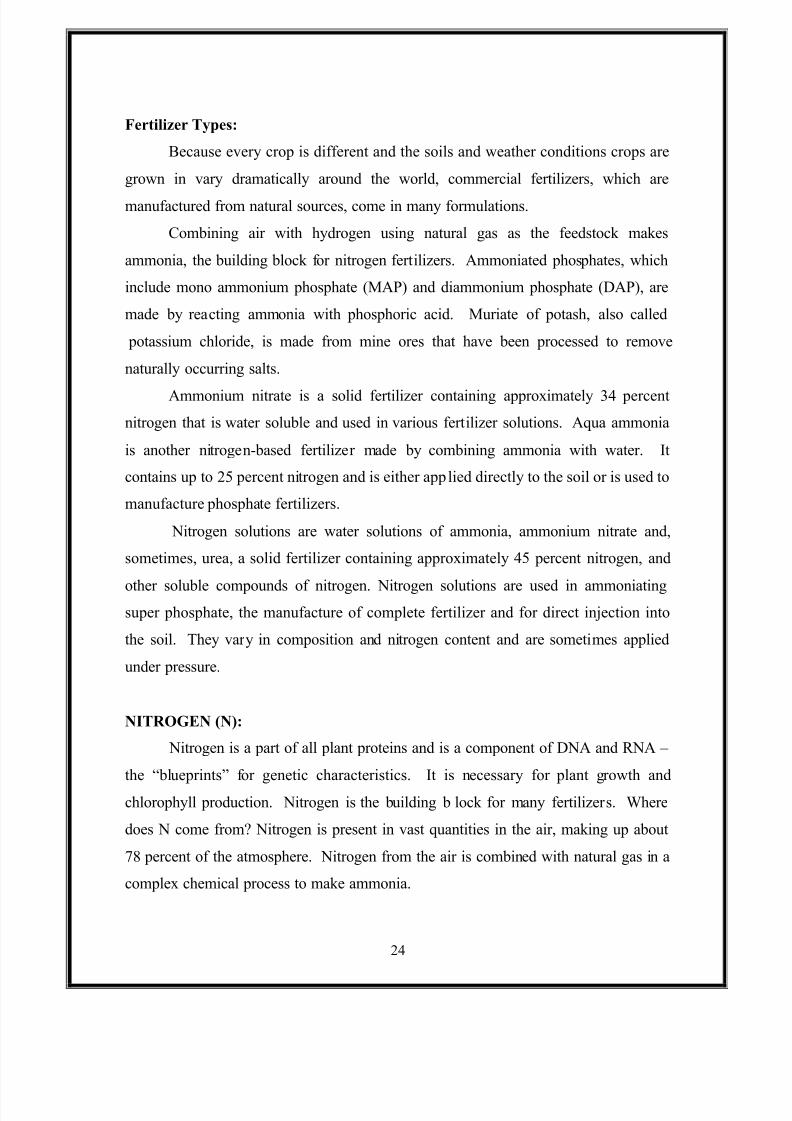
Fertilizer Types:
Because every crop is different and the soils and weather conditions crops are
grown in vary dramatically around the world, commercial fertilizers, which are
manufactured from natural sources, come in many formulations.
Combining air with hydrogen using natural gas as the feedstock makes
ammonia, the building block for nitrogen fertilizers. Ammoniated phosphates, which
include mono ammonium phosphate (MAP) and diammonium phosphate (DAP), are
made by reacting ammonia with phosphoric acid. Muriate of potash, also called
potassium chloride, is made from mine ores that have been processed to remove
naturally occurring salts.
Ammonium nitrate is a solid fertilizer containing approximately 34 percent
nitrogen that is water soluble and used in various fertilizer solutions. Aqua ammonia
is another nitrogen-based fertilizer made by combining ammonia with water. It
contains up to 25 percent nitrogen and is either app lied directly to the soil or is used to
manufacture phosphate fertilizers.
Nitrogen solutions are water solutions of ammonia, ammonium nitrate and,
sometimes, urea, a solid fertilizer containing approximately 45 percent nitrogen, and
other soluble compounds of nitrogen. Nitrogen solutions are used in ammoniating
super phosphate, the manufacture of complete fertilizer and for direct injection into
the soil. They vary in composition and nitrogen content and are sometimes applied
under pressure.
NITROGEN (N):
Nitrogen is a part of all plant proteins and is a component of DNA and RNA ±
the ³blueprints´ for genetic characteristics. It is necessary for plant growth andchlorophyll production. Nitrogen is the building b lock for many fertilizers. Where
does N come from? Nitrogen is present in vast quantities in the air, making up about
78 percent of the atmosphere. Nitrogen from the air is combined with natural gas in a
complex chemical process to make ammonia.
5/7/2018 Inventary Mgnt - slidepdf.com
http://slidepdf.com/reader/full/inventary-mgnt 25/126
25
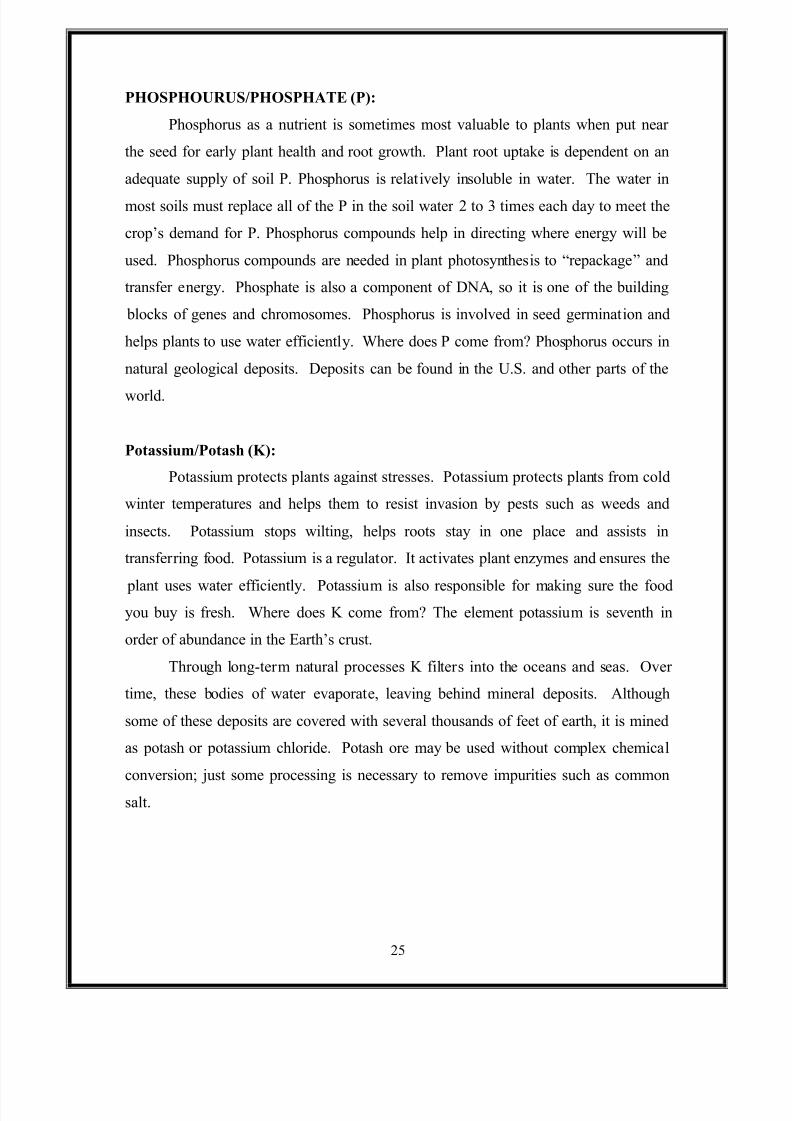
PHOSPHOURUS/PHOSPHATE (P):
Phosphorus as a nutrient is sometimes most valuable to plants when put near
the seed for early plant health and root growth. Plant root uptake is dependent on an
adequate supply of soil P. Phosphorus is relatively insoluble in water. The water in
most soils must replace all of the P in the soil water 2 to 3 times each day to meet the
crop¶s demand for P. Phosphorus compounds help in directing where energy will be
used. Phosphorus compounds are needed in plant photosynthesis to ³repackage´ and
transfer energy. Phosphate is also a component of DNA, so it is one of the building
blocks of genes and chromosomes. Phosphorus is involved in seed germination and
helps plants to use water efficiently. Where does P come from? Phosphorus occurs in
natural geological deposits. Deposits can be found in the U.S. and other parts of the
world.
Potassium/Potash (K):
Potassium protects plants against stresses. Potassium protects plants from cold
winter temperatures and helps them to resist invasion by pests such as weeds and
insects. Potassium stops wilting, helps roots stay in one place and assists in
transferring food. Potassium is a regulator. It activates plant enzymes and ensures the
plant uses water efficiently. Potassium is also responsible for making sure the food
you buy is fresh. Where does K come from? The element potassium is seventh in
order of abundance in the Earth¶s crust.
Through long-term natural processes K filters into the oceans and seas. Over
time, these bodies of water evaporate, leaving behind mineral deposits. Although
some of these deposits are covered with several thousands of feet of earth, it is mined
as potash or potassium chloride. Potash ore may be used without complex chemical
conversion; just some processing is necessary to remove impurities such as commonsalt.
5/7/2018 Inventary Mgnt - slidepdf.com
http://slidepdf.com/reader/full/inventary-mgnt 26/126
26
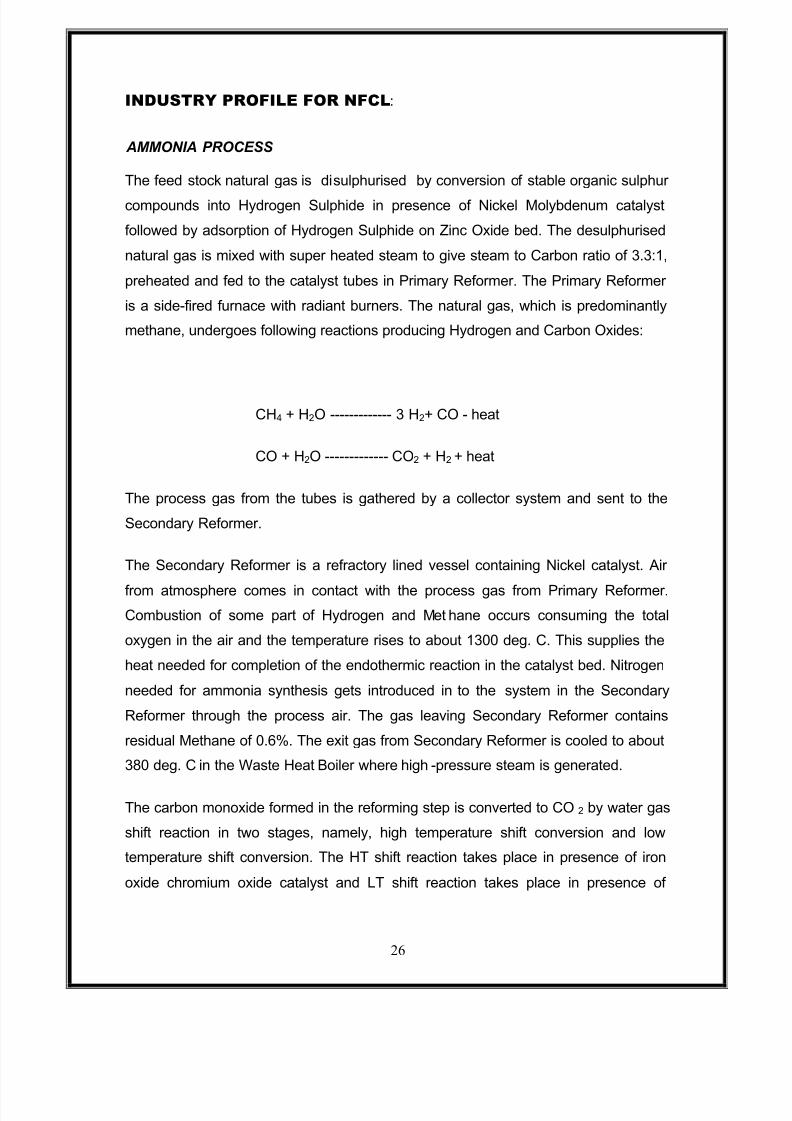
INDUSTRY PROFILE FOR NFCL:
AMMONIA PROCESS The feed stock natural gas is disulphurised by conversion of stable organic sulphur
compounds into Hydrogen Sulphide in presence of Nickel Molybdenum catalyst
followed by adsorption of Hydrogen Sulphide on Zinc Oxide bed. The desulphurised
natural gas is mixed with super heated steam to give steam to Carbon ratio of 3.3:1,
preheated and fed to the catalyst tubes in Primary Reformer. The Primary Reformer
is a side-fired furnace with radiant burners. The natural gas, which is predominantly
methane, undergoes following reactions producing Hydrogen and Carbon Oxides:
CH4 + H2O ------------- 3 H2+ CO - heat
CO + H2O ------------- CO2 + H2 + heat
The process gas from the tubes is gathered by a collector system and sent to the
Secondary Reformer.
The Secondary Reformer is a refractory lined vessel containing Nickel catalyst. Air
from atmosphere comes in contact with the process gas from Primary Reformer.
Combustion of some part of Hydrogen and Met hane occurs consuming the total
oxygen in the air and the temperature rises to about 1300 deg. C. This supplies the
heat needed for completion of the endothermic reaction in the catalyst bed. Nitrogen
needed for ammonia synthesis gets introduced in to the system in the Secondary
Reformer through the process air. The gas leaving Secondary Reformer contains
residual Methane of 0.6%. The exit gas from Secondary Reformer is cooled to about
380 deg. C in the Waste Heat Boiler where high -pressure steam is generated.
The carbon monoxide formed in the reforming step is converted to CO 2 by water gas
shift reaction in two stages, namely, high temperature shift conversion and low
temperature shift conversion. The HT shift reaction takes place in presence of iron
oxide chromium oxide catalyst and LT shift reaction takes place in presence of
5/7/2018 Inventary Mgnt - slidepdf.com
http://slidepdf.com/reader/full/inventary-mgnt 27/126
27
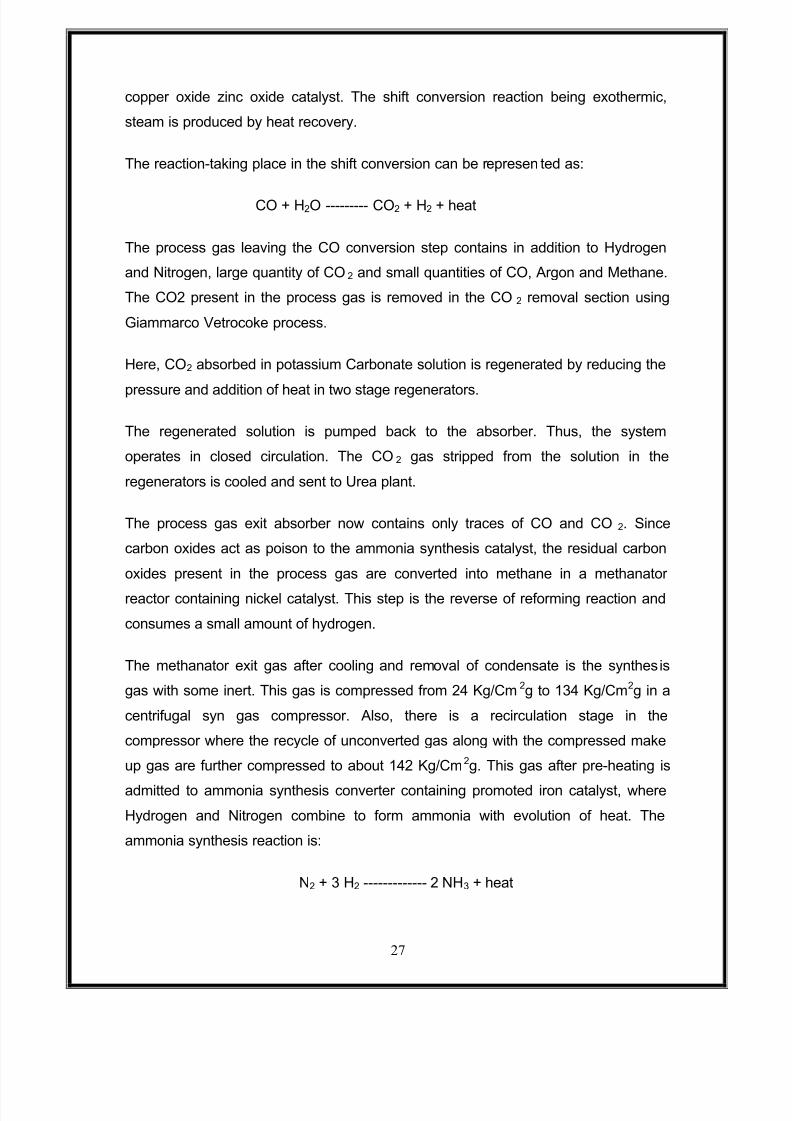
copper oxide zinc oxide catalyst. The shift conversion reaction being exothermic,
steam is produced by heat recovery.
The reaction-taking place in the shift conversion can be represen ted as:
CO + H2O --------- CO2 + H2 + heat
The process gas leaving the CO conversion step contains in addition to Hydrogen
and Nitrogen, large quantity of CO 2 and small quantities of CO, Argon and Methane.
The CO2 present in the process gas is removed in the CO 2 removal section using
Giammarco Vetrocoke process.
Here, CO2 absorbed in potassium Carbonate solution is regenerated by reducing the
pressure and addition of heat in two stage regenerators.
The regenerated solution is pumped back to the absorber. Thus, the system
operates in closed circulation. The CO 2 gas stripped from the solution in the
regenerators is cooled and sent to Urea plant.
The process gas exit absorber now contains only traces of CO and CO 2. Since
carbon oxides act as poison to the ammonia synthesis catalyst, the residual carbon
oxides present in the process gas are converted into methane in a methanator
reactor containing nickel catalyst. This step is the reverse of reforming reaction and
consumes a small amount of hydrogen.
The methanator exit gas after cooling and removal of condensate is the synthesis
gas with some inert. This gas is compressed from 24 Kg/Cm 2g to 134 Kg/Cm2g in a
centrifugal syn gas compressor. Also, there is a recirculation stage in the
compressor where the recycle of unconverted gas along with the compressed make
up gas are further compressed to about 142 Kg/Cm2g. This gas after pre-heating is
admitted to ammonia synthesis converter containing promoted iron catalyst, where
Hydrogen and Nitrogen combine to form ammonia with evolution of heat. The
ammonia synthesis reaction is:
N2 + 3 H2 ------------- 2 NH3 + heat
5/7/2018 Inventary Mgnt - slidepdf.com
http://slidepdf.com/reader/full/inventary-mgnt 28/126
28
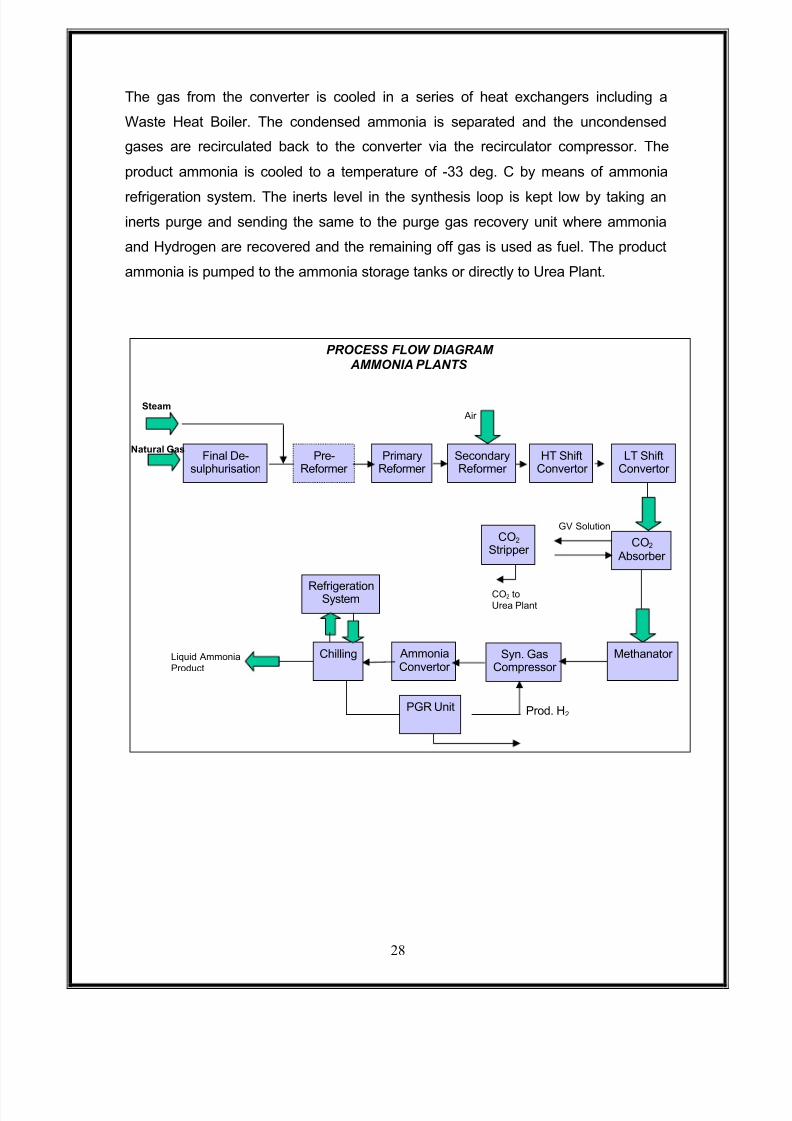
The gas from the converter is cooled in a series of heat exchangers including a
Waste Heat Boiler. The condensed ammonia is separated and the uncondensed
gases are recirculated back to the converter via the recirculator compressor. The
product ammonia is cooled to a temperature of -33 deg. C by means of ammonia
refrigeration system. The inerts level in the synthesis loop is kept low by taking an
inerts purge and sending the same to the purge gas recovery unit where ammonia
and Hydrogen are recovered and the remaining off gas is used as fuel. The product
ammonia is pumped to the ammonia storage tanks or directly to Urea Plant.
PROCESS FLOW DIAGRAM AMMONIA PLANTS
Steam
Final De-sulphurisation
Pre-Reformer
PrimaryReformer
SecondaryReformer
HT ShiftConvertor
LT ShiftConvertor
RefrigerationSystem
CO2 Stripper
CO2 Absorber
Chilling AmmoniaConvertor
Syn. GasCompressor
Methanator
PGR Unit
GV Solution
CO2 to
Urea Plant
Prod. H2
Liquid Ammonia
Product
Air
Natural Gas
5/7/2018 Inventary Mgnt - slidepdf.com
http://slidepdf.com/reader/full/inventary-mgnt 29/126
29
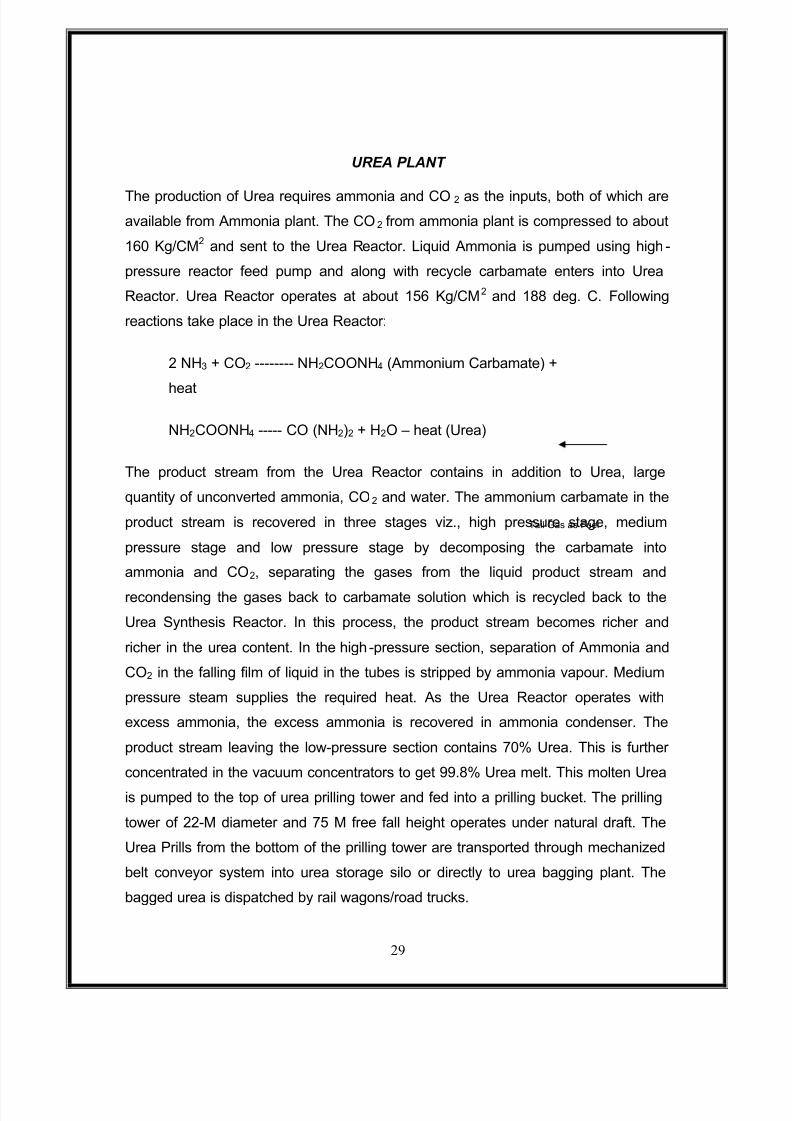
U REA PLANT The production of Urea requires ammonia and CO 2 as the inputs, both of which are
available from Ammonia plant. The CO 2 from ammonia plant is compressed to about
160 Kg/CM2
and sent to the Urea Reactor. Liquid Ammonia is pumped using high -
pressure reactor feed pump and along with recycle carbamate enters into Urea
Reactor. Urea Reactor operates at about 156 Kg/CM2 and 188 deg. C. Following
reactions take place in the Urea Reactor:
2 NH3 + CO2 -------- NH2COONH4 (Ammonium Carbamate) +
heat
NH2COONH4 ----- CO (NH2)2 + H2O ± heat (Urea)
The product stream from the Urea Reactor contains in addition to Urea, large
quantity of unconverted ammonia, CO2 and water. The ammonium carbamate in the
product stream is recovered in three stages viz., high pressure stage, medium
pressure stage and low pressure stage by decomposing the carbamate into
ammonia and CO2, separating the gases from the liquid product stream and
recondensing the gases back to carbamate solution which is recycled back to the
Urea Synthesis Reactor. In this process, the product stream becomes richer and
richer in the urea content. In the high -pressure section, separation of Ammonia and
CO2 in the falling film of liquid in the tubes is stripped by ammonia vapour. Medium
pressure steam supplies the required heat. As the Urea Reactor operates with
excess ammonia, the excess ammonia is recovered in ammonia condenser. The
product stream leaving the low-pressure section contains 70% Urea. This is further
concentrated in the vacuum concentrators to get 99.8% Urea melt. This molten Urea
is pumped to the top of urea prilling tower and fed into a prilling bucket. The prilling
tower of 22-M diameter and 75 M free fall height operates under natural draft. The
Urea Prills from the bottom of the prilling tower are transported through mechanized
belt conveyor system into urea storage silo or directly to urea bagging plant. The
bagged urea is dispatched by rail wagons/road trucks.
Tail Gas as Fuel
5/7/2018 Inventary Mgnt - slidepdf.com
http://slidepdf.com/reader/full/inventary-mgnt 30/126
30
Process Flow Diagram for U rea Plant
PROCESS FLOW DIAGRAM U REA PLANTS
AmmoniaReceiver
NH3 Condensor
MP Absorber
CO2 Compressor
CO2
HP Condensor
MP Condensor
LP Condensor
Waste Water Section
Vacuum Conc.Section
LP Decomposer
MP Decomposer
Stripper
Urea Reactor Ammonia
Treated Water toDM Plant for reuse
Urea Melt
Water Vapor
NH3, CO2, H2O,Vapor
NH3, CO2, H2O,Vapor
NH3, CO2, H2O,Vapor
Passivation Air
Urea Solution
Prilling
Product Urea toBagging Plant
5/7/2018 Inventary Mgnt - slidepdf.com
http://slidepdf.com/reader/full/inventary-mgnt 31/126
31
PROCESS DESCRIPTION OF
CARBON-DI-OXIDE RECOVERY (CDR) PLANT
Technology Supplier: Mitsubishi Heavy Industries (MHI), Japan.
CO2 Absorbent: KS-1 Solution, Proprietary Supply from MHI, Japan.
The Flue Gas from Primary Reformer enters the Flue Gas Quencher, where it is
cooled to 40°C. The Flue Gas is compressed to a pressure of 1.113 Ksca and enters
the CO2 Absorber. The CO2 in Flue Gas is absorbed by KS-1 Solvent, which is
distributed from top through packed bed system. Subsequent to contact with KS-1
Solution the Flue Gas is further washed with DM Water in the top section of CO2
Absorber. The Flue Gas after removal of CO 2 is sent out to atmosphere through a
stack provided at CO2 Absorber top. The CO2 rich solution at 55°C is pumped to the
Lean / Rich Heat Exchanger. The Lean Solution is recycled back to CO 2 Absorber.
The rich solution stream is heated up to 114 °C and sent to CO 2 Regenerator,
wherein CO2 is stripped off from rich solution by providing necessary heat to Reboiler
using Low Pressure Steam. The CO 2 thus liberated is washed with DM water at the
top of CO2 Regenerator, cooled to ambient temperature in an overhead condenser
and sent to Urea Plants.
5/7/2018 Inventary Mgnt - slidepdf.com
http://slidepdf.com/reader/full/inventary-mgnt 32/126
32
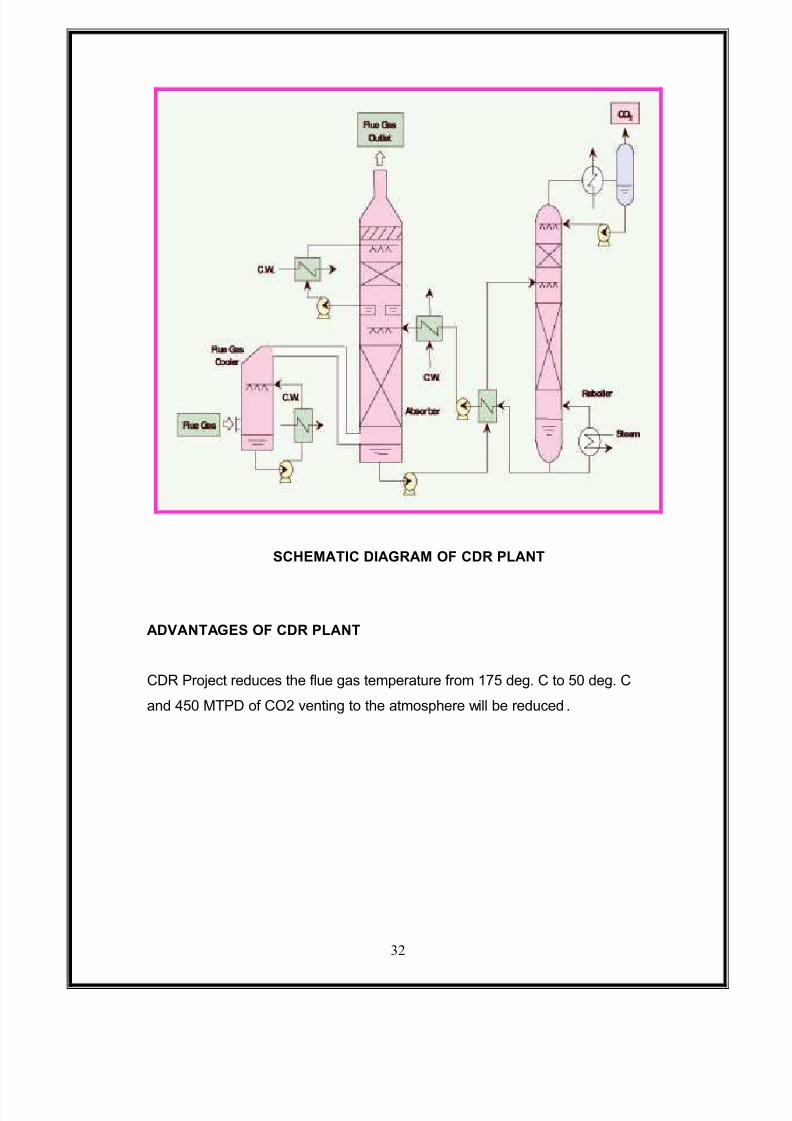
SCHEMATIC DIAGRAM OF CDR PLANT
ADVANTAGES OF CDR PLANT
CDR Project reduces the flue gas temperature from 175 deg. C to 50 deg. C
and 450 MTPD of CO2 venting to the atmosphere will be reduced .
5/7/2018 Inventary Mgnt - slidepdf.com
http://slidepdf.com/reader/full/inventary-mgnt 33/126
33
FOOD FOR THE GROWING WORLD
Industry at a glance:
Since 1883 the industry has worked to promote the advances in the
development and application of fertilizers that have helped to feed a hungry world.
The revolutionary concept of plant nutrition was born from the discovery of the
biological role of chemical elements in plant nutrition and the need to feed a growing
population concentrated away from the farm in the rising industrial centers of the
world.
Because of modern fertilizers, world food production since 1960 has more than
doubled, keeping pace with the population explosion. Today, the fertilizer industry is
poised to help produce the food that will be needed to feed the world¶s projected 9
billion people in 2025.
The fertilizer industry is essentially concerned with the provision of three
major plant nutrients ± nitrogen (N), phosphorous (P) and potassium (K) ± in plant
available form. Each nutrient is responsible for different aspects of plant growth and
health.
Fertilizers:
Regulated for quality and safety like other manufactured goods, fertilizers are
regulated for quality and safety at the federal and state levels. Every state in the
country, plus Puerto Rico, has its own fertilizer regulatory program, usually
administered by the state department of agriculture.
State Regulation:
State regulation is concerned with consumer protection, labeling, the protection
of human health and the environment, and the proper handling and application of
fertilizers. Fertilizers are regulated at the state level because soil conditions vary
dramatically from state to state across the country. For example, the rocky, thin soils
5/7/2018 Inventary Mgnt - slidepdf.com
http://slidepdf.com/reader/full/inventary-mgnt 34/126
34
of New England are vastly different from the deep, rich black soils of the Midwest
Corn Belt. A different level of fertilizer nutrients in the soil, different crops (potatoes
versus corn, for instance) and different weather and cropping patterns require state-
specific regulation.
Where Science and safety come first the modern commercial fertilizer industry
was founded on the revolutionary scientific discovery in the last part of the 18th
century that chemical elements play a direct role in plant nutrition. This initial
concept was supported by direct scientific experiment and opened the way for
industrial-scale manufacturing of fertilizers of all types in the 19th
century, beginning
with superphosphate in 1843. This was followed by ammonium Sulphate, sodium
nitrate and, finally, in the first two decades of the 20th
century, the manufacturing of
synthetic nitrogen fertilizers directly from atmospheric nitrogen.
Assessing Fertilizer Safety:
Fertilizer research and development historically have been focused on
maximizing economic crop yields from given rates of nutrient application. Since the
advent of the modern environmental movement in the 1960s, research has also been
concerned with minimizing potentially adverse human health and environmental
effects from fertilizer manufacture and application.
As part of its continuing commitment to safety, in 1996, the Fertilizer Institute
initiated a comprehensive safety assessment project to determine the risks, if any, of
metals in fertilizer. Small amounts of metals are found in phosphate and potash
fertilizers due to their presence in the mined ore bodies. In addition to phosphate and
potash products, some micronutrient fertilizers, which come from both mined ores and
recycled wastes, also contain metals.
Fertilizers Enrich our World:
5/7/2018 Inventary Mgnt - slidepdf.com
http://slidepdf.com/reader/full/inventary-mgnt 35/126
35
Improvements in agricultural efficiency through research and technology
increase food output while protecting the environment and enriching our world in
numerous ways.
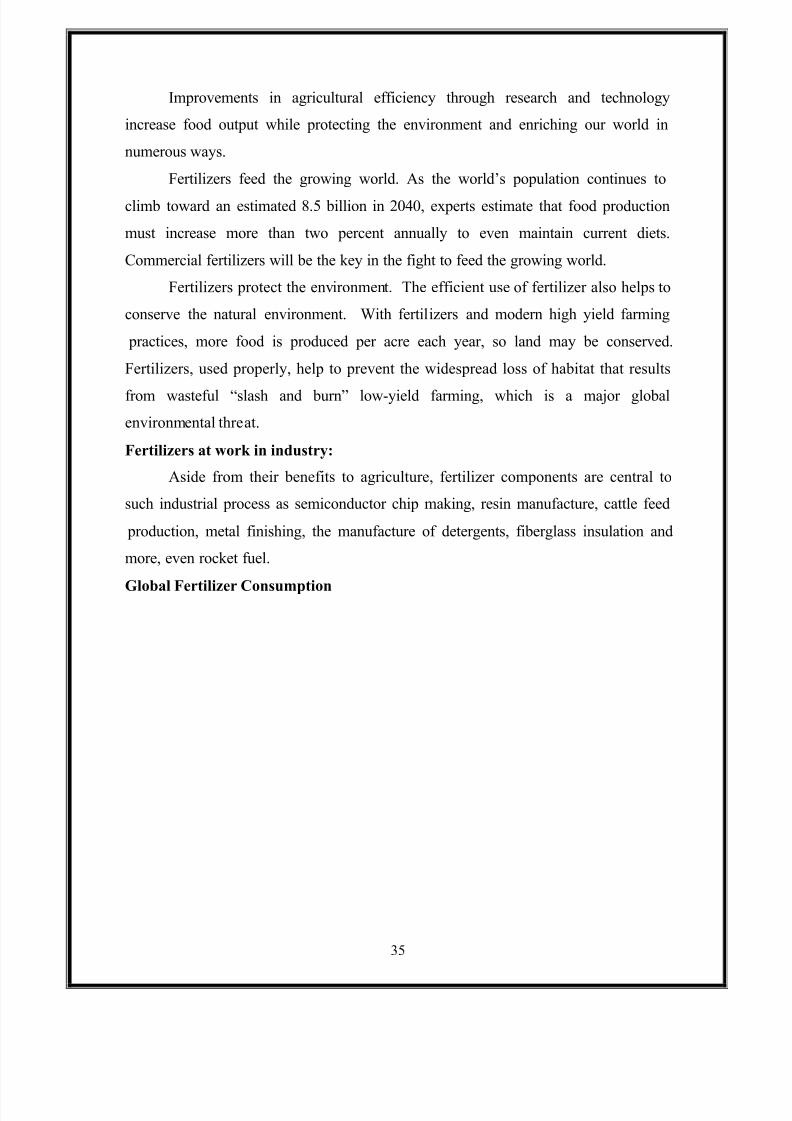
Fertilizers feed the growing world. As the world¶s population continues to
climb toward an estimated 8.5 billion in 2040, experts estimate that food production
must increase more than two percent annually to even maintain current diets.
Commercial fertilizers will be the key in the fight to feed the growing world.
Fertilizers protect the environment. The efficient use of fertilizer also helps to
conserve the natural environment. With fertilizers and modern high yield farming
practices, more food is produced per acre each year, so land may be conserved.
Fertilizers, used properly, help to prevent the widespread loss of habitat that results
from wasteful ³slash and burn´ low-yield farming, which is a major global
environmental threat.
Fertilizers at work in industry:
Aside from their benefits to agriculture, fertilizer components are central to
such industrial process as semiconductor chip making, resin manufacture, cattle feed
production, metal finishing, the manufacture of detergents, fiberglass insulation and
more, even rocket fuel.
Global Fertilizer Consumption
5/7/2018 Inventary Mgnt - slidepdf.com
http://slidepdf.com/reader/full/inventary-mgnt 36/126
36
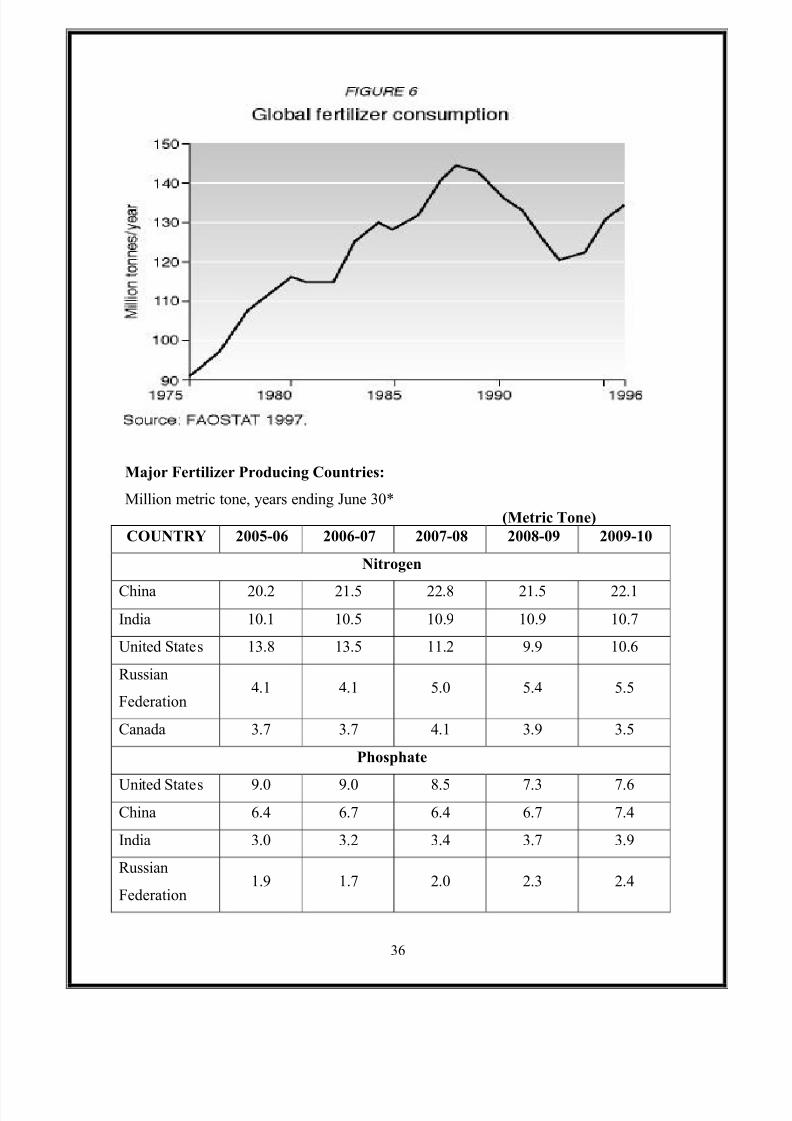
Major Fertilizer Producing Countries:
Million metric tone, years ending June 30*
(Metric Tone)
COUNTRY 2005-06 2006-07 2007-08 2008-09 2009-10
Nitrogen
China 20.2 21.5 22.8 21.5 22.1
India 10.1 10.5 10.9 10.9 10.7
United States 13.8 13.5 11.2 9.9 10.6
Russian
Federation4.1 4.1 5.0 5.4 5.5
Canada 3.7 3.7 4.1 3.9 3.5
Phosphate
United States 9.0 9.0 8.5 7.3 7.6
China 6.4 6.7 6.4 6.7 7.4
India 3.0 3.2 3.4 3.7 3.9
Russian
Federation1.9 1.7 2.0 2.3 2.4
5/7/2018 Inventary Mgnt - slidepdf.com
http://slidepdf.com/reader/full/inventary-mgnt 37/126
37
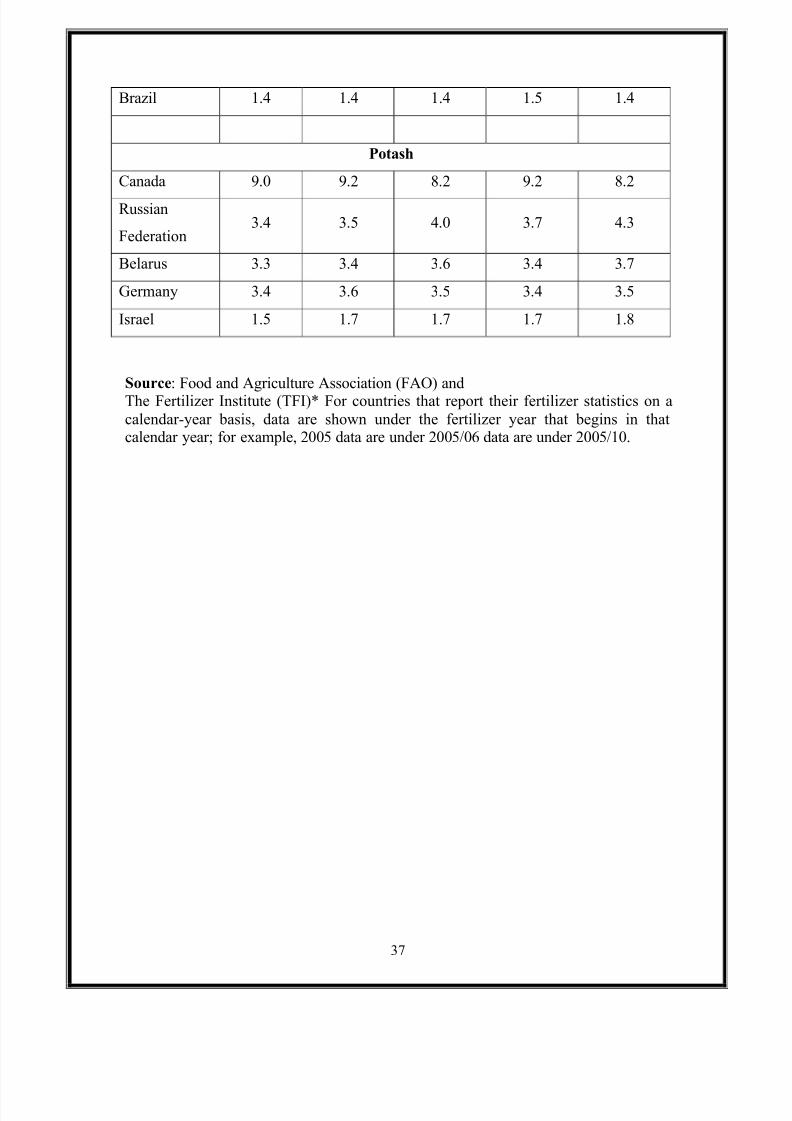
Brazil 1.4 1.4 1.4 1.5 1.4
Potash
Canada 9.0 9.2 8.2 9.2 8.2
Russian
Federation3.4 3.5 4.0 3.7 4.3
Belarus 3.3 3.4 3.6 3.4 3.7
Germany 3.4 3.6 3.5 3.4 3.5
Israel 1.5 1.7 1.7 1.7 1.8
Source: Food and Agriculture Association (FAO) andThe Fertilizer Institute (TFI)* For countries that report their fertilizer statistics on a
calendar-year basis, data are shown under the fertilizer year that begins in thatcalendar year; for example, 2005 data are under 2005/06 data are under 2005/10.
5/7/2018 Inventary Mgnt - slidepdf.com
http://slidepdf.com/reader/full/inventary-mgnt 38/126
38
5/7/2018 Inventary Mgnt - slidepdf.com
http://slidepdf.com/reader/full/inventary-mgnt 39/126
39
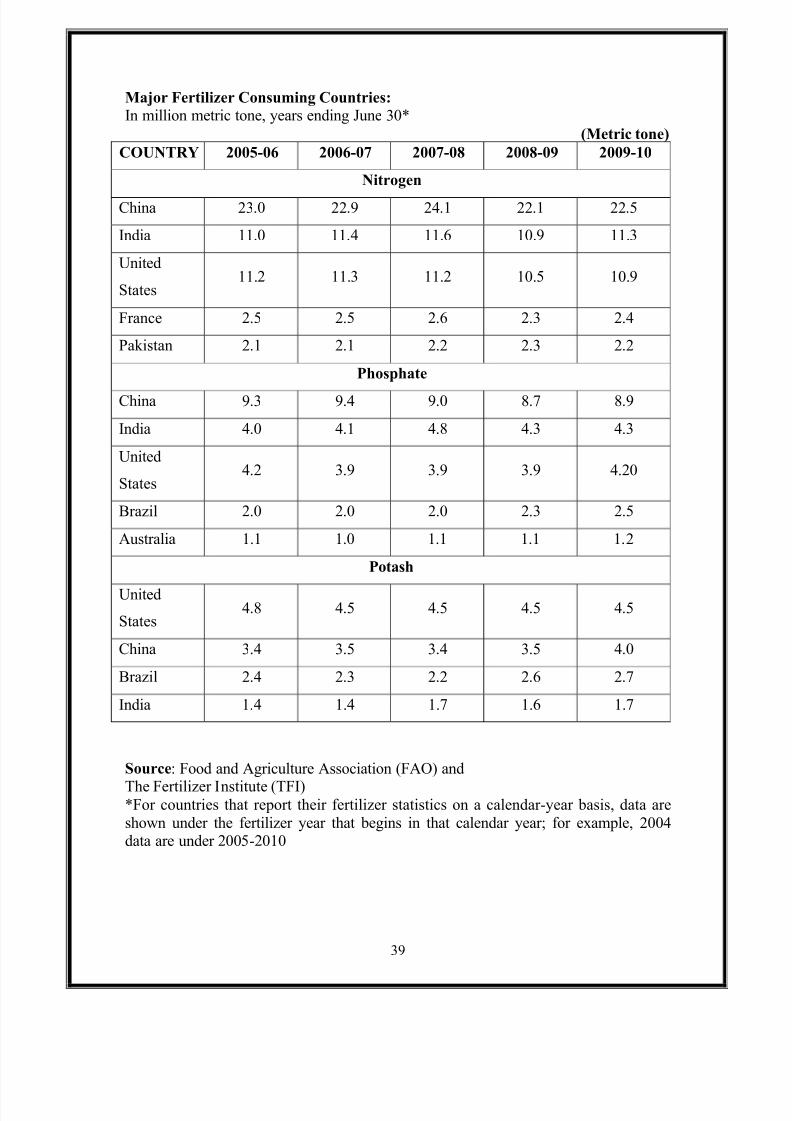
Major Fertilizer Consuming Countries:
In million metric tone, years ending June 30*
(Metric tone)
COUNTRY 2005-06 2006-07 2007-08 2008-09 2009-10
Nitrogen
China 23.0 22.9 24.1 22.1 22.5
India 11.0 11.4 11.6 10.9 11.3
United
States11.2 11.3 11.2 10.5 10.9
France 2.5 2.5 2.6 2.3 2.4
Pakistan 2.1 2.1 2.2 2.3 2.2
Phosphate
China 9.3 9.4 9.0 8.7 8.9
India 4.0 4.1 4.8 4.3 4.3
United
States4.2 3.9 3.9 3.9 4.20
Brazil 2.0 2.0 2.0 2.3 2.5
Australia 1.1 1.0 1.1 1.1 1.2
Potash
United
States4.8 4.5 4.5 4.5 4.5
China 3.4 3.5 3.4 3.5 4.0
Brazil 2.4 2.3 2.2 2.6 2.7
India 1.4 1.4 1.7 1.6 1.7
Source: Food and Agriculture Association (FAO) and
The Fertilizer Institute (TFI)*For countries that report their fertilizer statistics on a calendar-year basis, data are
shown under the fertilizer year that begins in that calendar year; for example, 2004 data are under 2005-2010

5/7/2018 Inventary Mgnt - slidepdf.com
http://slidepdf.com/reader/full/inventary-mgnt 40/126
40
5/7/2018 Inventary Mgnt - slidepdf.com
http://slidepdf.com/reader/full/inventary-mgnt 41/126
41
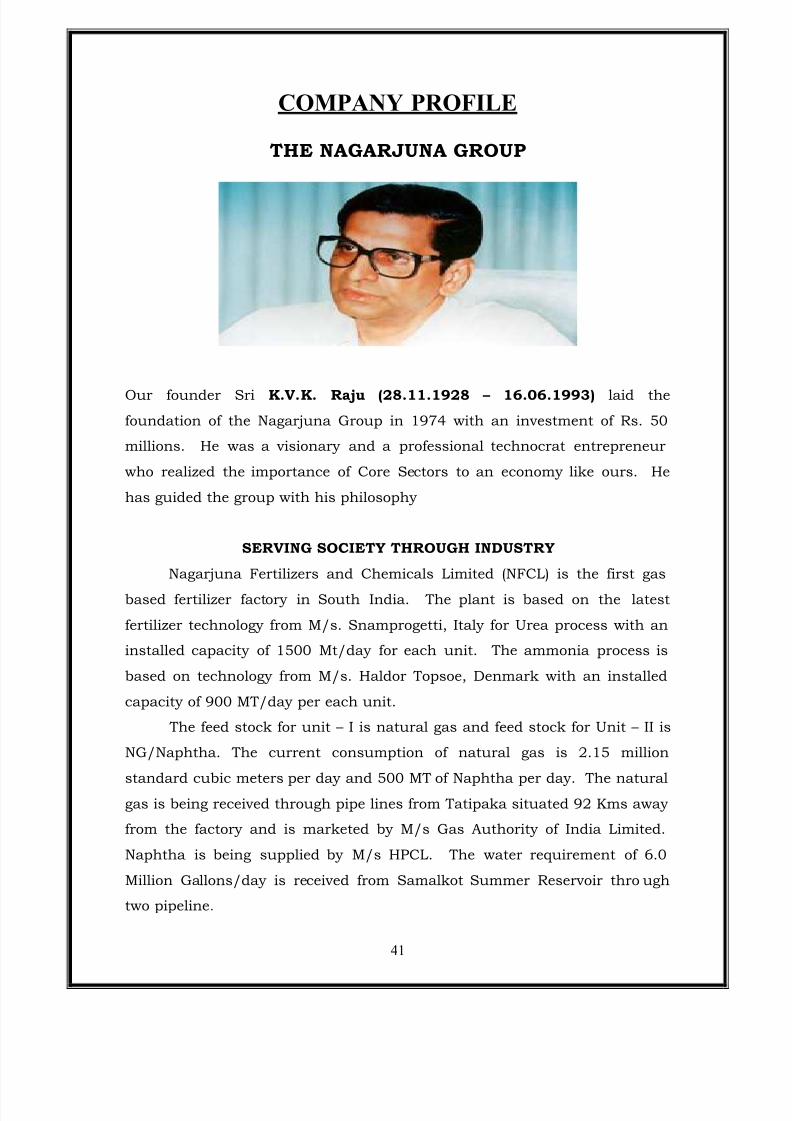
COMPANY PROFILE
THE NAGARJUNA GROUP
Our founder Sri K.V.K. Raju (28.11.1928 ² 16.06.1993) laid the
foundation of the Nagarjuna Group in 1974 with an investment of Rs. 50
millions. He was a visionary and a professional technocrat entrepreneur
who realized the importance of Core Sectors to an economy like ours. He
has guided the group with his philosophy
SERVING SOCIETY THROUGH INDUSTRY
Nagarjuna Fertilizers and Chemicals Limited (NFCL) is the first gas
based fertilizer factory in South India. The plant is based on the latest
fertilizer technology from M/s. Snamprogetti, Italy for Urea process with an
installed capacity of 1500 Mt/day for each unit. The ammonia process is
based on technology from M/s. Haldor Topsoe, Denmark with an installed
capacity of 900 MT/day per each unit.
The feed stock for unit ² I is natural gas and feed stock for Unit ² II is
NG/Naphtha. The current consumption of natural gas is 2.15 million
standard cubic meters per day and 500 MT of Naphtha per day. The naturalgas is being received through pipe lines from Tatipaka situated 92 Kms away
from the factory and is marketed by M/s Gas Authority of India Limited.
Naphtha is being supplied by M/s HPCL. The water requirement of 6.0
Million Gallons/day is received from Samalkot Summer Reservoir thro ugh
two pipeline.
5/7/2018 Inventary Mgnt - slidepdf.com
http://slidepdf.com/reader/full/inventary-mgnt 42/126
42
Finance:
The total cost of the existing complex is Rs. 2156 crores (Rs. 1186
crores for Unit-I and Rs. 970 crores for Unit ² II). This consists
of loan of Rs. 1,162 crores (Rs. 515 crores for Unit-I and Rs. 647 crores for
Unit ² II) sanctioned by IDBI, IFCI, ICICI, UTI, LIC, GIC and also Banks.
The foreign exchange component of Rs. 781.07 cores was met by the Indian
Financial Institutions like IDBI, IFCI & ICICI and also by Italian Buyers
credit.
LIVING IN HARMONY WITH NATURE ± NFCL¶S
CONTRIBUTION TO ECOLOGY
Environmental protection is an avowed corporate philosophy and the
plant is built on the principle of zero-effluent discharge and is totally eco-
friendly. NFCL·s aim is to maintain ecological harmony, which is NATURE·S
INVALUABLE AND BEAUTIFUL GIFT TO MANKIND.
Man can live in harmony with the environment only when mankind is
guided by respect for the Mother Earth and all living things. Nagarjuna
Fertilizers and Chemicals Limited believe that Industry should exist in
harmony with nature. In pursuance of the corporate vision, and as a
humble contribution to the Mother Nature, the complete ecological system
in and around the factory has been changed by establishing a K.V.K.RAJU
SUNDARAVANAMU in an area of 747 acres surrounding the Complex.
5/7/2018 Inventary Mgnt - slidepdf.com
http://slidepdf.com/reader/full/inventary-mgnt 43/126
43
The entire area has been covered with 4,50,000 plants consisting of 170
species, transforming a once highly saline marshy area devoid of any
vegetation into a lush green arboreal park. The establishment of 1 KM wide
KVK Sundaravanam is an integral part of overall natural ecological system
consisting of eleven water bodies for fish, habitat for animal life and
sanctuary for both indigenous as well as migratory birds with the factory
nestled in the most natural and idyllic surroundings cre ated with
dedication.
An integrated Environmental Management Plan (EMP) has been
incorporated in the basic design itself to ensure strict adherence to
International Standards. The investment on pollution control equipment in
the Plant is close to Rs. 110 crores of capital investment
and recurring expenditure of Rs. 6 crores being spent annually for operating
and maintaining the equipment.
MAIN FEATURES OF ECO-SYSTEM:
A forestation:
740 acres of area has been planted with 4.5 lakh saplings of 170
species. Weak areas have been planted with selected species based on
criteria like tolerance to salinity, availability from local sources and their
ability survive with least maintenance. A full -fledged nursery with mist
chamber and sprinkler irrigation system has been developed for supply of
plants to a forestation programmed .
Animal Enclosures:
A deer park with spotted deer has been set up in an area of six
hectares with chain-link fence on all sides. Separate enclosures for birds,
rabbits and certain other animals are made available. Some of these
animals like jungle cat, fox, jackals, mongooses, squirrels, bats, snakes, and
turtles are also being let out freely in this eco-system as a part of our animal
conservation programme.
5/7/2018 Inventary Mgnt - slidepdf.com
http://slidepdf.com/reader/full/inventary-mgnt 44/126
44
Use of Treated Effluent:
The total treated effluent generated from the factory is being utilized
through a network of over 17 KM of PVC pipeline for sustenance of the eco-
system to show the purity levels of the effluents and the technological
efficiency of the plant equipment.
Awareness Programme:
As a part of NFCL·s sincere endeavor to bring awareness about the
benefits of cleaner environment on the general standards of life,
company has started ´GREENING THE ROADSµ of Kakinada in Phases. As
a part of this programme, flowering trees were planted on either side of the 4
km length of roads from Bhanugudi Junction to Nagamallithota and from
Nagamallithota to NFCL. This programme is being extended to further areas
in phases.
5/7/2018 Inventary Mgnt - slidepdf.com
http://slidepdf.com/reader/full/inventary-mgnt 45/126
45
VALUES STATEMENT OF NFCL
COMMITMENT
We the Associates of NFCL are committed to continuously evokingcustomer delight through constant review and monitoring and delivering
proactive value added solutions. We are also committed to strive for
satisfaction of all stakeholders in a balanced manner through sustainable
growth and profitability
Excellence:
We shall continuously strive for Excellence in all dimensions of the
Company through teamwork, creativity and other means.
Ethics:
We shall strive for wholesome business relationships by adhering to
the principles of trusteeship, fair play and transparency in all our dealings
that we shall practice a work cultural, which is performance driven and
conducive to in proving discipline, accountability and depth of character,
team spirit and honesty in all our personal and professional relationships.
We shall build a learning organization where creativity, innovation,
entrepreneurship and knowledge sharing are encouraged and fostered
actively
Concern:
We consciously recognize that the development of associates is
inextricably linked to the sustainable growth and profitability of the
organization. Therefore, mutual care and concern between the associates
and the organization shall be our abiding value.
5/7/2018 Inventary Mgnt - slidepdf.com
http://slidepdf.com/reader/full/inventary-mgnt 46/126
46
NFCL¶S VISION STATEMENT
SERVING SOCIETY THROUGH INDUSTRY
´For close to two decades, we at NFCL have predominantly been in the
business of manufacturing and marketing Urea, a segment of the plant
Nutrition business space. Given our cumulated experience and strengths in
understanding the farmer, the agriculture, various initiatives taken in the
past, the exposure of Indian agriculture to global economy and therefore the
need for Indian farmers to be globally competitive, have realized the need to
provide innovative and comprehensive Plant Nutrition Solutions.
´The leadership we refer to in our Vision Statement is in terms of
providing innovative and creative solutions.µ
5/7/2018 Inventary Mgnt - slidepdf.com
http://slidepdf.com/reader/full/inventary-mgnt 47/126
47
NFCL¶S MISSION STATEMENT
We shall:
- Pioneer transformation in the approach to plant nutrition
- Deliver holistic plant nutrition solutions to the farmers
- Be the most preferred organization to be associated with
Pioneer transformation in the approach to plant nutrition we shall
develop crop, site and stage specific wholesome plant nutrition solutions.
NFCL shall focus on all necessary initiatives towards this ² be it
manufacturing technology, regulatory, logistics and using a mix of several
sciences and skills. The most preferred organization to be associated with in
the process of providing these solutions , NFCL shall delight all the
stakeholders ² employees, investors, suppliers, customers and society at
large. The stakeholders would prefer to be associated with us not only for
the higher value we offer, but also shall cherish their relationship with us
due to the way we deal with them ² with full commitment, responsibility and
accountability.
EMPLOYEE FOCUS:
NFCL·s aim to have the most satisfied employee base by the turn of
the century through its commitment to Personal and professional
development of the individual.
y Rewarding teamwork, innovation and quality behavior
y
Through job satisfactiony Creating and sustaining a close-knit family culture wherein every
individual experience a sense of belonging .
5/7/2018 Inventary Mgnt - slidepdf.com
http://slidepdf.com/reader/full/inventary-mgnt 48/126
48
Marketing:
NFCL is operating in Andhra Pradesh, Orissa, West Bengal,
Maharastra, Karnataka, Pondicherry (Yanam territory). A professional team,
with a wide range of products, that include Urea, traded fertilizers (DAP,
MOP, Complex fertilizers), Micro-nutrients, Pesticides, Organic fertilizers
and Bio-Pesticides, has taken NFCL very close to the farmers and made
NAGARJUNA a household name among the farming community
Keeping pace with the changes in agricultural practices NFCL has
developed organic-fertilizers and bio-pesticides with support from NARDI. A
new concept in fertilizers i.e., Customized Fertilizer Granules (CFGs) has
been developed and the product is in trials.
NFCL·s Development activities focus on imparting training to farmers
and dealers on the latest package of practices in various crop sand
technology transfer. Training programs are carried out both on campus at
KVK, Kakinada and off-campus at villages and towns. A Well-equipped and
trained development tem organizes the programs using audio -visual vans,
jeeps, slide projectors and literature on products and crops, etc. State
Governments, Agriculture Universities and the farming community as awhole have acknowledged the effectiveness of development programs being
carried out by NFCL.
5/7/2018 Inventary Mgnt - slidepdf.com
http://slidepdf.com/reader/full/inventary-mgnt 49/126
49
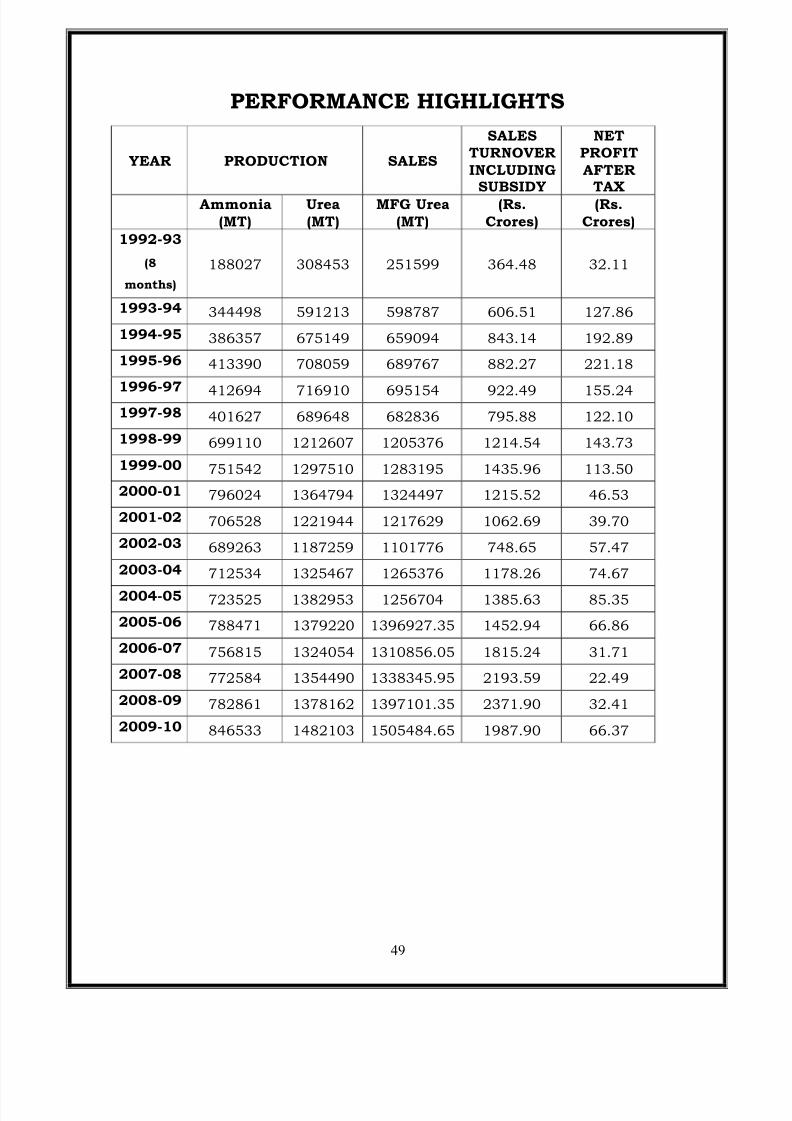
PERFORMANCE HIGHLIGHTS
YEAR PRODUCTION SALES
SALES
TURNOVER
INCLUDINGSUBSIDY
NET
PROFIT
AFTERTAX
Ammonia
(MT)
Urea
(MT)
MFG Urea
(MT)
(Rs.
Crores)
(Rs.
Crores)
1992-93
(8
months)
188027 308453 251599 364.48 32.11
1993-94 344498 591213 598787 606.51 127.86
1994-95 386357 675149 659094 843.14 192.89
1995-96 413390 708059 689767 882.27 221.18
1996-97 412694 716910 695154 922.49 155.241997-98 401627 689648 682836 795.88 122.10
1998-99 699110 1212607 1205376 1214.54 143.73
1999-00 751542 1297510 1283195 1435.96 113.50
2000-01 796024 1364794 1324497 1215.52 46.53
2001-02 706528 1221944 1217629 1062.69 39.70
2002-03 689263 1187259 1101776 748.65 57.47
2003-04 712534 1325467 1265376 1178.26 74.67
2004-05 723525 1382953 1256704 1385.63 85.35
2005-06 788471 1379220 1396927.35 1452.94 66.86
2006-07 756815 1324054 1310856.05 1815.24 31.71
2007-08 772584 1354490 1338345.95 2193.59 22.49
2008-09 782861 1378162 1397101.35 2371.90 32.41
2009-10 846533 1482103 1505484.65 1987.90 66.37
5/7/2018 Inventary Mgnt - slidepdf.com
http://slidepdf.com/reader/full/inventary-mgnt 50/126
50
CUSTOMER FOCUS:
In recognition that business is based on quality and integrity, NFCL·s
aim to have the most satisfied customer base by enhancing farmer
productivity through forward integration on the one hand, and through
catering to industrial needs on the other. Unto this end, NFCL shall:
y Produce high quality products that give value for money
y Offer, both products and services
y Innovate to satisfy the real needs of customers
y Engage in fair, open and ethical practices.
SHAREHOLDER FOCUSNFCL aim to keep its shareholders satisfied by:
y Delivering the best long-term return on investment amongst all
companies in the Indian agri-business industry.
y Continuous growth and excellence in business performance.
5/7/2018 Inventary Mgnt - slidepdf.com
http://slidepdf.com/reader/full/inventary-mgnt 51/126
51
AWARDS AND HONOURS
´EPICµ Award for Anti-Pollution measures taken by the Industry by
Environment Public interest Committee, Kakinada in 1993.
Good Housekeeping Award for 1994 by National Safety Council, A.P.
Chapter.
Best Industrial Canteen Award for 1994 by National Safety Council, A.P.
Chapter.
Indian Chemical Manufacturer·s Association (ICMA) Award for
´Environmental Control Strategies and Safety in Chemical Plantsµ for
the year 1994.
Award of Merit for 1994-95 by National Safety Council, U.S.A. for
completing 2 Million Accident Freeman Hours.
ISO 9002 Certification from Bureau Verities Quality International (BVQI),
Netherlands, in 1995.
Golden Peacock National Quality Award by Institute of Directors, New
Delhi, India for 1995.
British Safety Council·s National Safety Award for the five consecutive
years, 1994, 1995, 1996, 1997 & 1998 and also for the year 2000.
´Rajiv Gandhi Parti Bhoomi Mitraµ Award for 1994-96 by Wasteland
Development Board, Government of India.
National Safety Award for 1996 by National Safety Council, U.S.A.
Award for Innovative and Purposeful Programme for Social Progress for
the year 1996 by Indian Chemical Manufacturer·s Association (ICMA),
Mumbai.
5/7/2018 Inventary Mgnt - slidepdf.com
http://slidepdf.com/reader/full/inventary-mgnt 52/126
52
Merit Award for 1997 and 1998 by Royal Society for the Prevention of
Accident (RSPA)
´Best Workersµ Welfare (including Family Planning) effort by an Industri al
or Commercial Unit in the Stateµ for the year 1997-98 by Andhra
Pradesh Chambers of Commerce & Industry (FAPCCI)
Golden Peacock National Award for environmental Management by World
Environment Foundation for the year 1998
Paryavarana Parirakshak Award by Rotary International at
Visakhapatnam for the year 1998
VANAMITRA ² 1999 from Govt., of A.P. for Developing and Maintaining
Greenbelt.
Achieved 84% in OH & S ² Audit conducted by British Safety Council,
U.K. in January 2000.
Best School Industry Linkage Award 2000 by NCERT ² an Autonomous
Organization of Government of India ² December 2000.
Best Environmental Management Plan ² 2000-01 in Vizag Zone by
Andhra Pradesh Pollution Control Board, Visakhapatnam.
National Safety award for 2000-01 from British Safety Council, U.K.
Best Environmental Improvement Effort by Industries located in the
State in 2000-2001 from Federation of A.P. Chamber of Commerce and
Industry, Andhra Pradesh.
Bronze Award for Occupational Safety for the year 2001 by Royal Society
for the Prevention of Accident (ROSPA), UK.
5/7/2018 Inventary Mgnt - slidepdf.com
http://slidepdf.com/reader/full/inventary-mgnt 53/126
53
Commendation Trophy jointly given by National Safety Council, A.P.
Chapter & Director of Factories, A.P. for Implementing OHSAS 18001 in
March 2001.
¶ Environmental Protection Award· in Nitrogenous Fertilizer plants
category for the year 2001-02 from Fertilizer Association of India, New
Delhi.
´Perfect Recordµ in Occupational Safety/Health Award Programme for
operating two million employee hours without occupational injury or
illness for the period from 10.10.01 to 1 3.11.02 from National Safety
Council (NSC) of USA.
Commendation prize under the process stream category for its energy
conversation initiatives by Andhra Pradesh productivity council,
Hyderabad in 2007.
National award for ´Water efficient unit 2007µ by confederation of Indian
industry Hyderabad in 2007.
Certificate of Appreciation for implementing the process safety
management system (PSMS) by national safety council, A.P. Chapter,
Hyderabad in 2008.
NFCL bagged two awards from the Fertilizer Association of India (FAI),
New Delhi for the year 2008. It won the prestigious FAI Environmental
Protection Award in the nitrogenous fertilizer plants category and award
for the best article in ¶ Production and Technology·.
5/7/2018 Inventary Mgnt - slidepdf.com
http://slidepdf.com/reader/full/inventary-mgnt 54/126
54
NFCL has bagged ICC AWARD for Excellence in Management of
Health/Safety/Environment from Indian Chemical Council, Mumbai for
the year 2008.
NFCL bagged two awards from the Fertilizer Association of India (FAI),
New Delhi for the year 2009. It won the prestigious FAI Environmental
Protection Award in the nitrogenous fertilizer plants category and stood
as joint winner for excellence in Safety Award.
NFCL has bagged Green Leaf 2nd runner-up award in the Global
Competition for Excellence and Innovation in Safety, Health and
Environment held by International Fertilizer Industry Association (IFA)
in 2009.
5/7/2018 Inventary Mgnt - slidepdf.com
http://slidepdf.com/reader/full/inventary-mgnt 55/126
55
OTHER GROUP COMPANY / INSTITUTION
y Nagarjuna Investors Services Limited
y Nagarjuna Agric hem Limited
y Nagarjuna Palma India Limited
y
Nagarjuna Agricultural Research & Development Institute
y KVK Raju International Leadership Academy
y Nagarjuna power Corporation Limited
y Nagarjuna Haifa India Limited
y Nagarjuna Oil Corporation Limited
y Bijam Biosciences Limited
y Nagarjuna Foundation
5/7/2018 Inventary Mgnt - slidepdf.com
http://slidepdf.com/reader/full/inventary-mgnt 56/126
56
FUTURE PLANS OF THE COMPANY
1) To improve the capacity utilization and energy efficiency through
technology up gradation.
2) Switching over to 100% natural gas as raw material instead of
Naphtha in Ammonia plant II
3) To continue to improve environmental performance under the
framework of ISO 14000 ² EMS.
4) To achieve British Safety convenience sword of honor in safety
management.
5) To enhance the standards in the present quality management system
(ISO 9002) by adopting the ISO 9001-2000 revision.
6) To enhance the standard in the present quality management system
(ISO 9002) by adopting the ISO 9001-2000 revision.
7) To widen the scope and offer technical services to various external
agencies including overs as a excitement .
5/7/2018 Inventary Mgnt - slidepdf.com
http://slidepdf.com/reader/full/inventary-mgnt 57/126
57
Diversification:
Nagarjuna Group is on the threshold of major growth phase. Nagarjuna·s
aim is not just to meet the challenges of change, but to be the leaders in
all the businesses that we are in namely, Agri Inputs/Outputs, Energy
Sector and Refinery. Nagarjuna Group will thus have significant presence
in the core sectors of the economy, which will have a multiplier effect on
the industrial and socio-economic development of the country.
Nagarjuna Fertilizers and Chemicals Limited (NFCL) has sought the Center·spermission to expand the existing production capacity of urea from 12 lakh
metric tones per annum to 17 lakh tones per annum, reports Business
Standard.
NFCL is also undertaking several activities for the development of the
surrounding villages by providing free medical, educational and drinking
water facilities besides supporting the mental ly-retarded children.
The Kakinada facility of Nagarjuna Fertilizers and Chemicals Limited
(NFCL), has achieved a record Urea production of 113.1%, producing a total
of 13.79 lakh Metric Tonne of Urea during 2005-06. The Plant has repeated
this phenomenal feat, producing Urea more than its capacity, for the
consecutive second year. NFCL produces Urea in two units. While the Unit
one Produced 7,03,645 Metric Tonne, unit two also surpassed its capacity
by producing 6,75,571 Metric Tonne making this phenomenal feat repeated
during 2005-06 too. Total capacity of the plant is 11,94,600 Metric Tonne.
5/7/2018 Inventary Mgnt - slidepdf.com
http://slidepdf.com/reader/full/inventary-mgnt 58/126
58
The Plant also has achieved this record production at a very
optimal utilization of energy of 5.662 MKcal/MT of Urea against
Internal target of 5.67 McCall/MT, which is already much lower than
the standard Fertilizer Industry Coordination Committee·s (FICC)
norm of 5.712 MKcal/MT. NFCL has one more reason to celebrate that
full production of Urea i.e., 13.79 lakh Metric Tonne has been
dispatched to the farmers.
Along with the production, NFCL has also done well in sales and
distribution wings. It·s products, which include Mahazinc, Zinc Sulphate,
zeta specialty fertilizers besides Urea have been sold out during 2005 -06.
NFCL WINS GAS CONSERVATION AWARD FROM GAIL:
Fertilizer facility of Nagarjuna Fertilizers and Chemicals Limited in
Kakinada has been selected for the ¶Award for Excellence in Natural Gas
Conservation· in the ¶ Fertilizers Sector· category for it·s outstanding
contribution to natural gas conservation in the country during 2004 -05.
This annual award has been instituted by Gas Authority of India
Limited (GAIL) as recognition of the excellent work done by the o rganizations
in Gas Conservation. GAIL has been conducting a nation -wide Natural Gas
Conservation Programme, meant to spread the word of conservation of this
precious natural resource. All the natural gas using industries like power,
fertilizer, steel, sponge iron, transport, glass, ceramic and petrochemicals
would be considered for this award.
This is the 4th achievement of NFCL for it·s excellence in different
departments during 2005. these include; 5 star rating in O.H & S Audit
from British Safety Council, UK. Commendation Award in ´Leadership and
Excellence Awards in Safety, Health & Environment (SHE) 2004µ, by
Confederation of Indian Industry,
5/7/2018 Inventary Mgnt - slidepdf.com
http://slidepdf.com/reader/full/inventary-mgnt 59/126
59
Southern Region, Chennai. Re-certification for ISO 9001:2000 by
Bureau Verities Quality International (BVAI) for quality management
systems. And NFCL also received Environment Protection Award from
Fertilizers Association of India.
NFCL wins the prestigious Environment Protection Award from the
Fertilizer Association of India
Nagarjuna Fertilizers and Chemicals Limited (NFCL) the flagship
company of the Nagarjuna Group has won the prestigious FAI (Fertilizer
Association of India) Environment Protection Award in the Nitrogenous
fertilizer plants category for the year 2004-05. NFCL had
won the same award for 2001-02 also. Going much beyond the statutory
requirements of law for environment protection, NFCL has implemented a
comprehensive protection plan in its plant at Kakinada. NFCL has been
widely acknowledged for its Commitment to the betterment of Environment
and this award further adds to the long list of recognition.
NFCL has also won two more awards from FAI. A video film titled
´The Sugarcaneµ produced by NFCL was adjudged Runner-up in the Annual
Video Film Competition by FAI for the yea r 2004-05. The video film has
been developed with the objective to transfer technology and to enhance the
yield of sugarcane farmers in Andhra Pradesh. For NFCL, this is the second
consecutive year of winning in this category. An article titled ´From
Products to Solutions ² Exploring Opportunitiesµ published in the
September 2005 issue of the Indian Journal of Fertilizers was awarded the
Second prize in the category of Shriram Award for Best article in Marketing.
5/7/2018 Inventary Mgnt - slidepdf.com
http://slidepdf.com/reader/full/inventary-mgnt 60/126
60
Bureau Verities Quality International (BVQI) awards re-
certification of ISO 9001:2000 for Nagarjuna Fertilizers and
Chemicals Limited.
Nagarjuna Fertilizers and Chemicals Limited (NFCL) have been re -
certified of ISO 9001:2000 by Bureau Verities Quality International (BVQI),
for its Quality Management Systems. The Flagship Company of the
Nagarjuna Group has already been an ISO 9001:2000 organization since
1995. This re-certification, which is valid up to February 2008, is only an
extension of recognition for company·s excellent quality management
systems.
BVQI team has done the re-certification audit during February at NFCL
plant Kakinada. After conducting audit in Plant Operations and Area
Marketing Offices BVQI sent a certificate to NFCL in which it mentioned
´Quality Management System of the Nagarjuna Fertilizers and Chemicals
Limited has been audited and found to be in accordance with the
requirements of the standards ISO 9001:2000µ.
BVQI is today the most widely recognized certification body in the
world, offering solutions in the key strategic fields of companies operations:
Quality, Health and Safety, Environment and Social Responsibility. It is
recognized by more than 30 national and international accreditation bodies
across the world to deliver ISO 9001 certification.
Nagarjuna Fertilizers and Chemicals Limited Awarded the
prestigious 5 star Rating by the British Safety Council, U.K
:Nagarjuna Fertilizers and Chemicals Limited (NFCL), the flagship
company of the Nagarjuna Group has been awarded the hi ghly coveted 5
star rating by the British Safety Council, U.K. After a detailed Health and
Safety Management System Audit conducted during the month of January
2005, the British Safety Council has awarded an ¶ Excellent· rating (Score of
5/7/2018 Inventary Mgnt - slidepdf.com
http://slidepdf.com/reader/full/inventary-mgnt 61/126
61
92.39%) to NFCL·s manufacturing facility at Kakinada. The audit covered
eight areas of NFCL·s management systems leading to best practices, Fire
Control Systems, Measurement and Control Systems, Workplace
implementation, Verification, Best practice and Continuous improveme nt.
The British Safety Council (BSC) is one of the world·s
leading occupational health, safety and environmental organizations. BSC·s
Five Star Health and Safety Management System Audit is a benchmark for
best practices. It provides a detailed examina tion of the organization·s
current practices, and gives a comprehensive report and plan for
implementing, monitoring and achieving continuous improvement.
It is based on the Business excellence Model and goes beyond HS(G)65 and
OHSAS 18001 to measure how far an organization has gone towards
achieving best practice.
Information Technology & Communications Department,
Government of Andhra Pradesh signs MoU with IKisan Limited
To provide Agriculture related information and services through
Rajiv Internet Village Centers / (RSDPs/Rural eSeva Centers)
In its efforts towards Grameen Vikas aimed at alleviating rural poverty
and ensuring agricultural development, the Information Technology &
Communications Department, Government of Andhra Pradesh today signed
a MoU with Ikisan Limited to provide agricultural related information and
services to the vast farming community of the state through Rajiv Internet
Village Centers (RSDPs/Rural eSeva Centres).
The Information Technology and Communications Department has
already set up 1200 kiosks spreading across the state under the Rural
Service Delivery Point Project (RSDP) in rural areas to serve as centers of e -
commerce and information dissemination. Ikisan Limited has partnered
with the Information Technology & Communications Department to provide
agriculture information software and services in these kiosks. The modules
5/7/2018 Inventary Mgnt - slidepdf.com
http://slidepdf.com/reader/full/inventary-mgnt 62/126
62
will be in Telugu and voice enabled addressing the needs of rural population
comprising mainly of farmers. The kiosk operators will be provided trai ning
by Ikisan Limited enabling them to effectively utilize the software and other
applications for the benefit of agriculturists.
Ikisan Limited is a pioneer in Agri-Portals in India. A Nagarjuna Group
initiative, Ikisan.com is a comprehensive Agri Port al addressing the
Information, knowledge and business requirements of various players in the
Agri arena viz., Farmers, Trade Channel partners and Agri Input/Output
companies. Leveraging Information Technology and extensive field presence,
Ikisan is positioned as an Information/Output companies. Leveraging
Information Technology and extensive field presence, Ikisan is positioned as
an Information/Knowledge exchange and an e-Marketplace. An integrated
agriculture group, Nagarjuna has core competencies in t he fields of plant
nutrition, plant protection, irrigation and farm services.
Our Values:
Deliver solutions that will please our customers deliver returns that
motivate out investors take actions that strengthen us and inspire the best
in others (by setting an example in relationship, integrity, honesty, humility
and hard work)
By understanding the deep and fundamental needs of our people, our
customers our Investors and our Ecosystem (Alliances, Community and
Environment).
5/7/2018 Inventary Mgnt - slidepdf.com
http://slidepdf.com/reader/full/inventary-mgnt 63/126
63
The Group:
Founded in 1973 by Shri K.V.K. Raju with a modest investment of
US$ 23 million, the Nagarjuna Group Today is a prominent industrial house
in India with an asset base of US$ 2.5 billion.
1974: Birth of a business group that pioneered several core sect or
enterprises in the coming decades. Starting with manufacturing steel,
Nagarjuna Steels Limited was launched.
1985: With focus on agriculture input business started plant
nutrition business with Nagarjuna Fertilizers and Chemicals Limited
1992: Forayed into the Crop Protection Business with Investments in
Pesticide Formulations manufacturing followed by Technical Grade
Manufacturing in the year 1994.
1994: Micro irrigation business started to address the irrigation
problems of farmers living in water and energy scarce regions.
1995: Ventured into Energy Sector. Entered into power generation by
setting up Nagarjuna Power Corporation Limited.
1997: Entered into petroleum by setting up Nagarjuna Oil
Corporation Limited.
Consolidating its core activities, today the Group·s major operations cover
Agri and Energy sectors.
5/7/2018 Inventary Mgnt - slidepdf.com
http://slidepdf.com/reader/full/inventary-mgnt 64/126
64
The new corporate logo of the
Nagarjuna Group symbolizes a
dynamic and value-based
organization, actualizing the
concept of Trusteeship.
The logo exemplifies the Group·s
inner strength through the
circles, which stand for the core
values of the organization viz.,
concern, commitment, quality
and integrity towards its
stakeholders viz., customers,
employees, investors andcommunity. The central circle
symbolizes the Sun, the source
of prime energy for the solar
system. The five circles also
symbolize the five elements of
the Universe and the spirit of
continuity.
The triangle represents
the planet Mars. Mars, from
time immemorial has
symbolized prosperity, success
and abundance of energy. The
triangle in the logo represents
the upward flow of perennial
energy towards the mission of
the group ´Serving Society
through Industryµ
5/7/2018 Inventary Mgnt - slidepdf.com
http://slidepdf.com/reader/full/inventary-mgnt 65/126
65
WELFARE MEASURES IN NFCL:
It has taken several welfare measures to improve the general working
conditions. They are given below.
A.C. Facilities
Drinking Water Facilities
Lockers given to employees for keeping their belongings
Annual Medical Examination
First Aid Boxes at several locations
Cultural Activities
Library Facilities
School for children of NFCL employees
Employees State Insurance Facilities
Uniform to all Employees
Group·s savings linked Insurance Scheme
Protective wear like helmets
Transport facilities
Canteen facilities
Housing Loan facilities

5/7/2018 Inventary Mgnt - slidepdf.com
http://slidepdf.com/reader/full/inventary-mgnt 66/126
66
5/7/2018 Inventary Mgnt - slidepdf.com
http://slidepdf.com/reader/full/inventary-mgnt 67/126
67
NFCL OBJECTIVES:
Performance management
High performance potential
Individual growth potential
Belief in Youth
High Result Orientation
Law procedure orientation
Entrepreneurial Development
Distinct Nagarjuna Group Ethos
High sense of respect for value of time and money Harmonious
employee relations
Development of Human Resources on a continuous basis
Highest importance to human values
Objectives assessment of individual performance
Disciplined behavior of all employees
Belief in system management
Belief dynamism
Belief in multi skilled concept
Continuous monitoring cost control
5/7/2018 Inventary Mgnt - slidepdf.com
http://slidepdf.com/reader/full/inventary-mgnt 68/126
68
SWOT ANALYSYS:
1. STRENGHTS: A broad and modern product range good corporate
image especially in Andhra Pradesh excellent dealer network in most
of the other states open work culture and good working environment
qualified trained and motivated team quality assurance system ISO ²
9000 location advantage of plant.
2. WEAKNESSES: Broad product range is not synergies yet. In adequate
information system and coordination between area offices and lead
offices. In adequate marketing database/market information.
Procedural bottlenecks some complacency about market retention.
Inadequate reporting systems.
3. THREATS: Decontrol, Joint ventures, International cartels. No
availability of raw materials in future.
4. OPPORTUNTIES: Huge gap between usage outside and inside India.
Expansion object offering double the quantity. New irrigation projects
increasing the demand.
5/7/2018 Inventary Mgnt - slidepdf.com
http://slidepdf.com/reader/full/inventary-mgnt 69/126
69
5/7/2018 Inventary Mgnt - slidepdf.com
http://slidepdf.com/reader/full/inventary-mgnt 70/126
70
THEORETICAL BACKGROUND OF
INVENTORY MANAGEMENT
Introduction:
Inventory management is very important in an organization in order to have a
smooth move of it. The term inventory refers to the stockpile of the products a firm is
offering for sale and the components that will be sold in future in the normal course of
business operations .Inventory as a current asset differ from other assets because only
financial managers are not involved, rather all functional areas finance, marketing,
production and purchasing also involved. The view concerning the appropriate level
of inventory would differ among the different functional areas. The job of the financialmanagers is to reconcile the viewpoints of the various functional areas regarding the
appropriate inventory levels in order to fulfill the overall objective of maximizing the
owner¶s wealth. Thus, inventory management should be related to the overall objective
of the firm. The basic responsibility of the financial manager is to make sure the firm¶s
cash flows are managed efficiently. Efficient management of inventory should
ultimately result in the maximization of owner¶s wealth.
Objectives of inventory management:
To meet the demand for the product by efficiency organizing the
production the production and sales operations.
To minimize investments in inventory.
To ensure against delays in deliveries.
To utilize the advantage of price fluctuations.
To take advantage of quality discount.
These Objectives can express in terms of cost and benefit association with inventory.
Inventories provide benefits to the extant that they facilitate the smooth functioning of
the firm.
Need to hold inventories:
Management inventories involve typing up of company¶s funds and incurrence
of storage and handling costs. There are three general motives for holding inventories.
5/7/2018 Inventary Mgnt - slidepdf.com
http://slidepdf.com/reader/full/inventary-mgnt 71/126
71
Transitive motive emphasizes the need to maintain inventories to
facilitate smooth production and operations.
Precautionary motive necessities holding of inventories to guard
against the risk of unpredictable changes in demand and supply forces and other
factors.
Speculative motive influences the decision to increase or reduce
inventory levels to take advantage of price fluctuations.
Nature of inventories:
Inventories are stock of product a company is manufacturing for sale and
components that make up the product. Inventories are composed in to:
Raw materials
Work in progress
Finished goods
Consumables
Bought out components
Packing materials
Spare parts
Raw materials:
Raw materials are those items purchased to be processed and are the major input into an organization and from the bulk which gets converted into output. The
function of raw materials is to act as a buffer between procurement and manufacturing.
There are two important factors:
Internal factors
External factors
5/7/2018 Inventary Mgnt - slidepdf.com
http://slidepdf.com/reader/full/inventary-mgnt 72/126
72
Internal factors:
y Production technology
y Criticality of the item
External factors:
y Lead time (administrative and suppliers)
y Vendors relations
y Availability of materials
y Government policy
y Seasonally
y Credit situation and govt.restriction
Consumables:
There are the materials which act as µcatalyst¶ in the production process and not
directly found in the end product. These enable the production process to function
smoothly. The inventory level of these consumables can be fixed based on the past
consumption.
Bought components:
Organizations especially those in consumer goods and engineering industry do
not always produce 100% of their out put from raw materials. At times they find it
chapter and more convenient to buy from regular vendors. This enables them to
concentrates more convenient to buy from regular vendors. This enables them to
concentrates more on critical parts and assembly.
The important factors that influence the bought components are:
Make or buy decisions
Source development
Vendor relations
Perfuctual inventory system
5/7/2018 Inventary Mgnt - slidepdf.com
http://slidepdf.com/reader/full/inventary-mgnt 73/126
73
Make or buy decisions must be taken after through ³tech economic analysis´.
Source development is laborious and consuming more if the unit is located in
backward area (or) region.
Vender relations are built up over the years depending up on the quality, regularly or
supply and financial transactions. Usually vendors operate at much smaller level.
Work- in -progress:
The process inventories exist so long as we have been considering inventory as
buffer between two or three subsystems. Work-in-progress acts as a buffer with in
manufacturing sub-systems. There can be group of machines, which can be termed as
a work centers. The raw materials will have to go through a combination of operations
before it take shape as a ³salvable product´.
The rate of production at each production center depend on the technology,
While the production executive tries his best to balance lines« there is certain break
downs which will effect down stream productions. To overcome this work-in-progress,
inventories is stored at work centers.
Finished goods:
Finished goods are those goods available for delivery to consumer. Finished
goods act as buffer between production and marketing department. The input is quit
predictable but output depends upon the behavior of the market. The purpose of this
inventory is to assure a constant supply in distribution channels.
Some of the factors that contribute to high finished goods inventory
Errors caused in forecasting
Eagerness to satisfy the customersEconomic bath production
Multiply stock points
Imports
Distribution system
5/7/2018 Inventary Mgnt - slidepdf.com
http://slidepdf.com/reader/full/inventary-mgnt 74/126
74
Packing materials:
Packing materials does not add to the value of product. It protects what it sells
and what it protects. Hence this cost some out of ones profits. Some consider packing
material subsystem to give a face lift to the product.
Spare parts:
Spare parts are the important inventory. Their consumption patterns differ from
raw materials, consumables or finished goods conversely stocking policies are
different.
Many problems occur in some case of these spares, some are:
Determination of level inventory for placing replenishment order and quantity to
be ordered.
The extent of delay in supplies and the extent of variations in demand which
Inventory should be able to withstand
Some spares are thus classified into:
Capital spares
Insurance spares
Routable spares
Maintenance spares
Over hauling spares
Capital spares and insurance spares are those spares of machine which have
nearly equal life of the machine. Characteristics of these spares are:
These are held as contingency against any break down
Their consumption is very low
The procurement lead time is very high
Normally these spares are produced along with original
equipment
5/7/2018 Inventary Mgnt - slidepdf.com
http://slidepdf.com/reader/full/inventary-mgnt 75/126
75
Maintenance spares are those which have definite requirement compared to
capital and insurance spares. These are required for the replacement of old parts
caused due to replacement of wear and tear. They are fast moving and are repetitive.
Ratable spares are costly so they are not usually scrapped but they are prepared
and stored for use. The demand for such a spare for any single machine is low but for
group of machines is high. Queuing theory is practiced to control ratable spares.
Over hauling spares include those items which are specially needed during
regular overhauls. These items are like valves; coupling etc.the strategy that adapted to
control these spares are based on past consumption. Therefore initial provisionin g
either when starting a new industry or machinery is problematic.
Cost of holding inventory:
One operating objective of inventory management is to minimize cost.
Excluding the cost of merchandise, the costs associated with inventory fall into two
basic categories:
o Ordering costs
o Carrying costs
Ordering costs are also known as acquisition or setup costs. Firms have to place
orders with the suppliers to replenish inventory of raw materials.
The expenses involved are referred to as ordering costs. A part from placing orders
outside, the various production departments have to acquire materials from the stores.
Any expenditure involved here is also a part of ordering cost. Included in the ordering
costs are costs involved in:
y Preparing a purchase order or requisition form
y
Receiving, inspecting to ensure both the quantity and quality.Carrying costs are the costs incurred for the maintaining a given level of
inventory. These are thus divided in to two categories:
Those that arise due to the storing of inventory
5/7/2018 Inventary Mgnt - slidepdf.com
http://slidepdf.com/reader/full/inventary-mgnt 76/126
76
The main components of this category are
y Storage cost
y Insurance of inventory
y Deterioration in inventory (for obsolescence)
y Servicing costs
The opportunity cost of funds consists of expenses in raising funds to finance
acquisition. If funds were not locked up in inventory, they would have earned a return.
Benefits of holding inventory:
The basic function of inventory is to act as a buffer to decouple or uncouple the
various activities of a firm so that all do not have to be purchased at exactly the same
rate the key activities are:
Purchasing
Production
Selling
Since inventory enables uncoupling of the key activities of a firm, each of them can be
operated at the most efficient rate. This has several beneficial effects on the firms
operation. The term uncoupling means these interrelated activities can be carried out
independently.
Benefits in purchasing:
If the purchasing of raw materials and other goods is not tied to production
/sales, a firm can purchase larger qualities than is warranted by usage in production or
the sales levels. This will enable to avail discounts that are available on bulk purchases
moreover it will lower the ordering costs as fewer acquisitions would be made. There
will, thus be a significant serving in costs. Second, firms can purchase goods in
anticipation of announced price increases. This will lead to a decline in the cost of
production. Inventory will thus serve as a hedge against price increases as well s
shortage of raw materials. This is a highly desirable inventory strategy.
5/7/2018 Inventary Mgnt - slidepdf.com
http://slidepdf.com/reader/full/inventary-mgnt 77/126
77
Benefits in production:
Finished goods inventory serves to uncouple production and sales. This enables
production at a rate different that of sales. That is production can be carried as a rate
higher or lower sales rate. This would be a special advantage to firms with a seasonal
sales pattern. In this case the sales rate. This would be a special advantage to firms
with a seasonal sales pattern. In case this sales rate will be higher than the production
rate during a part of the year and lower during the off season. The choice before the
firm is either to produce at a level to meet tactual demand i.e., higher production
during peak season, produce continuously throughout the year and build up inventory
which will be sold during the period of seasonal demand. The former involves
discontinuity in the production schedule while the latter ensures level production. The
level production is more economical as it allows the firm to reduce the cost of
discontinuation in the production process. This is possible because excess production
is kept in inventory to meet the further demands accompanying expenses. In brief and
since inventory permits least cost of production scheduling, production can be carried
more efficiently.
Benefits in sales
The maintenance of inventory also helps a firm to enhance its sales efforts. If
there are no inventories of finished goods the level of sales will depend upon the level
of current production. A firm will not be able to meet demand instantaneously. This
will be a lag depending upon the production processes. If the firm has inventory, actual
sales will not have to depend on lengthy manufacturing process. Thus, inventory
serves to bridge between the gap production and actual sales. A related aspect is that
the inventory services as a competitive marketing tool to meet customer demands. The
basic requirement in a firm¶s competitive position is its ability as well as its
competitors to supply goods rapidly, if not customers may shift to suppliers. Inve ntorythus ensures continued patronage of customers. Moreover in case of firm¶s having a
seasonal pattern to sales, there should be a sustainable finished goods inventory prior
to peak sales season.
5/7/2018 Inventary Mgnt - slidepdf.com
http://slidepdf.com/reader/full/inventary-mgnt 78/126
78
Inventory control:
The aim of production activity is t imely manufacture of desired product of
specified quality in proper quantity at least possible cost. To achieve production goals,
the production must simultaneously attempt to maintain stable operations, provide
customers with adequate service and keep investment in stock and equipment at
reasonable levels. Beyond the problems of management, there are certain questions
that business must face:
Where shell we maintain? How much stock?
Who will be responsible for it?
Why do we have inventories?
What effects the inventory balances we maintain?
The basic problem of inventory policy is to strike a balance between operation
savings and costs and capital requirements associated with larger stocks. Business
management now has wide range of techniques for attacking control and inventory
control.
Control systems approach:
Control over inventory means good, long-range and intermediate planning of
production operations. A comprehensive and integrated control system, including
production planning, scheduling and control must be closely coordinate with other
planning such as cash planning, capital budgeting and sales forecasting. The essentials
of inventory control are:
Long range planning, to budget capital for facilities and inventory investment.
Intermediate policy making and planning as a basis for short-term schedule.
Short ± term scheduling of work assignment to keep facilities and employed
and stock balanced in view of demand for output as it actually materialize.
Factors influencing inventory:
There are various factors which both internal and external which have
influence on inventory. Inventory conditions start right from forecasting a requirement
such that required materials are made available only at right time. External conditions
including supplies lag time, environmental conditions, govt. rules and regulations,
5/7/2018 Inventary Mgnt - slidepdf.com
http://slidepdf.com/reader/full/inventary-mgnt 79/126
79
credit availability, market conditions etc. all factors which have influence on inventory
could be summed up in to following categories:
o Lead time
o Relevant costs
o Ordering costs
o Inventory carrying costs
o Under stocking costs
o Over stocking costs
o Several levels
o Obsolete inventory
o Scrap
LEAD TIME:
Lead time is defined as a period that elapses between recognition of the need
and its fulfillment. In any industrial network one has to follow the following broad
pattern before ordering and making it available
o Fore cast the requirement
o Requisition the exact quantity
o Selection of sources of supply
o Negotiation of rates
o Annual ordering
o Follow up with supplies
o Receiving materials
o Inspection of materials
o Proper warehousing
o Preservation of material
o Proper issues and recording
o Payment of supplier¶s bills
The above steps show the total ordering cycle. But market is not available to
use till it is inspected and given to store. The whole cycle could be classified in four
lead time categories
5/7/2018 Inventary Mgnt - slidepdf.com
http://slidepdf.com/reader/full/inventary-mgnt 80/126
80
o Internal lead time
o External lead time
o Transportation lead time
Internal lead time, which is also known as administrative lead time, which
starts from identifying the need for an item till all order is placed for that item.
Requirement for an item has first to be identified before it is ordered. It may
take a long time before an actual need is finalized. The first activity is a location
of a source which can be done by data bank, magazines etc.the next activity is
negotiating the terms and conditions of supply. Thirdly, placing an order with
tight source. Internal lead time ceases once the order reaches the supplier and he
confirms it.
External lead time, which is also known as a manufacturing lead time,
depends on the business and the time taken to manufacture and dispatch a
product.
Transportation lead time is the period for the time a manufacturer dispatches
the goods to time of actual receipt of goods at stores of purchaser. Inspection
lead time, is the one where materials that comes to stores, has to be checked to
find out whether they supplied as per the requirement of the organization and
per the stipulated orders.\
Relevant costs:
There are several factors, which are affected by the conditions of excessive or
insufficient inventories. It is for many reasons stocked inventory will be useless that
we incurred high costs in general the costs of inventories will be under this
classification as:
Ordering cost (U)
Inventory cost (I)
Under stocking cost (KU)
Over stocking (KO)
Ordering cost is the one which, each order that is placed on the supplier costs money,
since lot of executive time, stationary, salary and wages etc will go in with a purchase
5/7/2018 Inventary Mgnt - slidepdf.com
http://slidepdf.com/reader/full/inventary-mgnt 81/126
81
order. It may be more in case of imported goods and may be less in those of cash
purchases. Ordering costs in the some result of the costs o fulfilling various activities
that go into finalizing an order. The cost of ordering (u) will include costs due to;
Stationary, typing, dispatching of orders.
Salaries and wages
Receiving and inspection costs
Cost of source development
The cost per purchase order can be calculated as,
Cost per purchases order = Total cost including on above heads / Total number of
orders
Inventory carrying costs are the costs which involve in the storage of materials this
cost can be calculated computing the following costs:
o Interest rate
o Obsolescence cost
o Over head costs
o Insurance costs
Under stocking costs (KU), are due to demand of an item and not being
provided for production. If a V is not made available to production there would be loss
of production, sales, good will. Computation of KU is very problematic.
Over stocking costs (OK), is the cost which insures high expenditure. It
involves loss of utilizing company¶s valuable fund. Over standing costs is therefore a
cost basically arising due to opportunity lost due to the investment in the inventory for
longer period.
Service level:
Service level is a relation between under stocking cost and over stocking costsof keeping an inventory and demand for that item arising leading to stock out.
KU
Service level= ____________
KU+OK
5/7/2018 Inventary Mgnt - slidepdf.com
http://slidepdf.com/reader/full/inventary-mgnt 82/126
82
Obsolete inventory:
Inventory that is purchased and which is of no importance for the organization
is termed as obsolete inventory. These can be due to any one of the following reasons
Technology change
Changes in product line
Changes in machines
Changes in design and layouts
Overbuying
Scrap:
When utilizing the inputs it is not possible to utilize 100% area, so certain scrap
generation is inevitable. Manufacturing process itself generates scrap. One may
generate scrap in the form of packing items, gunny bags, papers, which has resale
value.
INVENTORY CONTROL TECHNIQUES:
ABC analysis
VED analysis
SED analysis
HML analysis
FSN analysis
EOQ analysis
MAX analysis (MAX-MIN)
Two - bin system
MRP analysis
5/7/2018 Inventary Mgnt - slidepdf.com
http://slidepdf.com/reader/full/inventary-mgnt 83/126
83
ABC analysis (Always Better Control):
Where there are a large number of items in the inventory, it becomes essential
to have an efficient control over comparatively greater care should be given to the
higher values.
The movement of certain service concern may consist of a small number of
items a minor portion of inventory value. The modern technique for collecting the
inventory is a value item analysis popularly known as ABC analysis that attempts to
relate how the inventory value is concentrated among the individual items.
This analysis is based on the praetor¶s law, which states that a fewer item of
high usage having high investment value should be paid more than a bulk of items
having low usage value and having low invest mental in capital.
Category ±A, which includes the most important item which represents about
60 to 70% of values of stores but constitute only 10 to 15 % of items.
Category ±B, which includes less important items representing an invest mental
value of 20 to 25% and constitutes a similar % of items.
Category- C, which consists of the least important items of stores and
constitutes 60-70% of stores item representing only a capital investment between 10-
15%.
Steps in ABC analysis:
1. The money value of the items of the materials chosen should be calculated by
multiplying the quality of each item with the price.2. The item should be rearranged in the descending order of their values
irrespective of their qualities.
3. A running total of all values and items will than be taken and the figure so
obtained should be converted into % gross of total.
5/7/2018 Inventary Mgnt - slidepdf.com
http://slidepdf.com/reader/full/inventary-mgnt 84/126
84
4. It will be found that a small number of first item may to large % of total value
of items. The management then will have to take a decision as to the % of the
total value , which have to be converted by A,B&C categories.
Advantages of ABC analysis:
I. It ensures closer on costly items in large amount of capital invested.
II. Helps in developing a scientific method of controlling inventories.
III. Inventory control at minimum cost.
Parameters for ABC classes of item in inventory:
Class Control Lot size Buffer stock
A very close small very small
B medium medium moderate
C loose large large
EOQ analysis (Economic order quantity):
A strategic factor in the inventory management is the consumption of the
optimum size of normal purchase order. Decision about how much to order has great
significance in inventory management. The quality to be purchased should neither be
small nor big because costs of buying and carrying material are very high.
Economic order quantity is the size of the lot to be purchased which are
economically viable medium costs.
HML analysis:
This analysis is based on cost of items. H,M&L alphabets represent item
highest cost, medium cost and lower cost.
FSN analysis:
5/7/2018 Inventary Mgnt - slidepdf.com
http://slidepdf.com/reader/full/inventary-mgnt 85/126
85
Under this analysis the quality and rate of consumption are to be taken in to
consideration. Here µF¶ stands for fast moving items, µS¶ stands for slow & µN¶ for
non-moving items.
Two ± bin system:
Under this system all inventory items are grouped under two categories. In the
first group, a sufficient supply is kept to meet the current requirement over a
designated period of time. In the second group or bin, a safety is
maintained to meet the requirement of inventory at times when stock in the first bin is
exhausted and recording occurs.
MRP analysis:
Materials requirement planning is a computer based inventory and the
production schedule system that considers all that goes into completing an order for
large for shop situations were many products are manufactured in periodic lots via
several processing steps.
VED analysis:
The VED analysis is used generally for spare parts. The requirements and
urgency of is different from that of materials. Spare parts are classified as vital (V),
essential (E), and desirable (D).
SED analysis:
This analysis is based on the availability of materials and is useful where items
are scarcely available. µS¶ stands for scare items, µD¶ difficult items and µE¶ stands for
easily available in the market.
PURCHASING:
Purchasing is the first phase of material management. It means procurement of
goods and services from same external agencies. The objective of purchasing
department is to arrange the supply of materials, spare arts and services of semi
5/7/2018 Inventary Mgnt - slidepdf.com
http://slidepdf.com/reader/full/inventary-mgnt 86/126
86
finished goods, required by the organization to produce the desired products from
agency are source out side the organization.
DEF: According to Alford and Beauty, ³purchasing is the procuring of the
materials, supplies, machines and tools and services required for equipment,
maintenance and operation of the manufacturing plant´.
OBJECTIVES:
Purchase of satisfactory material
To control the quantity of material
Proper negotiations with suppliers
Control proper use of material
Coordination with other departments
Maintenance of good will
Exploration to locate new suppliers
Stores control
Store keeping:
It is servicing facility, inside an organization responsible for proper storage of
the material and then issuing into respective departments on proper requisition. Those
which are not in use specific duration.
According to Maynard, ³the duties of store keeping are to receive materials, to
protect them while in storage from damage and unauthorized removal to issue
materials in the right quantities, at the right time to the right place and to provide these
services promptly and at least cost´.
Receiving:
The item order in purchase department is receive by the section. the supplier
delivers the items along with the order documents to receiving section of stores
5/7/2018 Inventary Mgnt - slidepdf.com
http://slidepdf.com/reader/full/inventary-mgnt 87/126
87
department. The materials when received from the supplier are under the temporary
custody of receiving department. These materials are usually accompanied with one or
both of the documents:
I. Advice of dispatch, which is sent by the supplier intimating dispatch of
materials from his premises.
II. Delivery note of packing note which is received from the carriers who transport
and deliver the materials.
III. On receipt, the materials are checked with reference to the copy of purchase
order in possession of receiving department. The quantity received is verified
with quantity on order and the quantity specified on the purchase order is
checked din the inspection department.
Valuation of materials received:
The general rule is that the invoice price as billed by the supplier should be
accounted for in the ledger. Certain problems regarding the accounting of receipts are
specified as:
Cash discount, is a discount supplied by the supplier if payments of bills are
made with in the period specified.
Trade and quantity discount is the amount of those discounts is already deducted from
the invoice price no difficulty arises in their accounting.
Store section:
This is a place where all materials received by the stores department are kept with
protection against deterioration and pilferage. They are stored in such a way that is
stored in such a way that their location is easily identified at the time of issue.
The various stores operations are:
o Location in store section
o Layout of stores section
o Stores equipment
o Materials handling facilities
o Identification of stores
5/7/2018 Inventary Mgnt - slidepdf.com
http://slidepdf.com/reader/full/inventary-mgnt 88/126
88
Storage control & methods of pricing issues:
The stores produce mainly consists of stores control and issue control
Stores control:
After the materials on order are received, checked and approved, the stores
keeper takes them on charge. He is responsibility for placing the materials in their
appropriate places inside the store and for ensuring the they are maintained in good
condition during storage till required for utilization in production. The control duri ng
this stage is called as storage control.
Issue control:
Materials when required for consumption are issued to the departments
concerned as per authorized quality under proper authority. The issues are priced and
the values they are charged to the costs of the products. Any surplus of identification
by the departments to the store is properly accounted.
Classification & codification of materials:
For purpose of identification and for convince in storage and issue, each item of
stores is given a distinct name. Similar items are classified under sub- groups and a
number of such sub groups are classified under main or major groups.
Classification of stores should be accompanied with a suitable system of
codification is the producer for assign symbols, for each item in accordance with a
proper arrangement.
Codification has following advantages:
Ease in identification of storesWriting full names and particulars of materials on document is dispensed with so that
clerical work is reduced
In mechanized accounting, codification is essential
Quoting symbols along with nomenclature ensures clarity
Ensure secrecy
5/7/2018 Inventary Mgnt - slidepdf.com
http://slidepdf.com/reader/full/inventary-mgnt 89/126
89
Three methods of codification are
i. Numeric
ii. Alphabetic
iii. Alphabetic and numeric
Perpetual inventory system:
It is also known as automatic inventory. The control of materials while in
storage is affected through what is known as perpetual inventory. The two main
functions of perpetual inventory systems are:
Recording stores recipients and issued so as to determine at any time the stock
in hand, in the quantity or value or both with out the need for physical count of stock.
Continuous verification of physical stock with reference to the balance
according to recorded in the store records as any frequency, as convents for
management.
Perpetual inventory system comprises:
Bin cards (quantitative perpetual inventory)
Stores ledger (quantitative cum valued perpetual inventory)
Continuous stock-taking (physical perpetual inventory)
Bin cards, are quantitative record of recipients, issues and closing balances of
items of stores. Separate bin cards are maintained for each item and are placed in
shelves or bins or suitably hung up as convenient along side the materials in go downs.
Stores ledger, is maintained to record all recipient and issued transactions in
respect of materials with the difference that along with the quantities, the values are
entered in the receipt, issue and balance columns.Continuous physical stock verification, specific the physical check the
transactions, the physical stock verification can be done by some methods: \
Inventory tags
Record in bin cards
Stock verification
5/7/2018 Inventary Mgnt - slidepdf.com
http://slidepdf.com/reader/full/inventary-mgnt 90/126
90
Materials requisition: The document which authorizes and records the issue of
material requisition. The contents in the material requisition are
Number and date of requisition
Section demanding
Particulars and code for the materials
Authority for requisition
Quantity demanded
Unit cost
Total cost
Signature of person placing requisition
Materials return note: situations arise when materials have to be returned from
production departments to the store. The following types of return may be necessary:
1) Materials issued in bulk in excess of requirement.
2) Scrap, waste arising out of defective and spoiled work.
3) Excess materials on account reduction of production order.
4) Surplus on account provision in the bill of materials.
Pricing of materials issues:
The various methods used for the purpose are:
y Specific price method
y FIFO method
y LIFO method
y Average price method
y Standard price method
y Base stock method
y HIFO method
y Market price method
y NIFO method
y Inflated price method
5/7/2018 Inventary Mgnt - slidepdf.com
http://slidepdf.com/reader/full/inventary-mgnt 91/126
91
Specific price method, when stores are purchased specifically for
Utilization against a particular job or production. E.g. Repairs and capital
works.
First- in first ± out method, is one of the pricing of issues is done in the
Reverse order of purchase by adopting the price of latest available consignment.
Average price method, is one where pricing is done on the average cost basis.
This is suited for items of small values and also when the transactions are numerous
and there is a heavy fluctuation in the purchase price. Under this sharp pricing
fluctuations are smoothened.
Various methods in this category are:
Simple average method
Periodic simple average method
Moving simple average method
Weighted average method
Periodic weighted method
Moving weighted average method
Standard price method is one of when pricing of issues is predetermined for the
stated periodic taking into account all factors affecting the price.
Base stock method is used on the principle that only a portion of stores moves and a
core is always maintained in stock. This base stock represents the minimum balance of
the material and is computed on the estimated basis for each item.
Highest ±in first- out method, assume that closing stock should always remain at the
minimum value and so the issues should always be made at the higher value of the
recipient.
5/7/2018 Inventary Mgnt - slidepdf.com
http://slidepdf.com/reader/full/inventary-mgnt 92/126
92
Market price method, the market price is adopted as the basis for pricing of issues of
obsolete stores and items which have been lying in the stock for long periods in which
each case the net realizable price should be adopted at the issue price.
Practical problems in inventory management:
The important of balancing the requirements of a production outfit with the
inventory management. Achievement of a definite production plans is difficult, which
means balance among all aspects of production such as total strength, operating
efficiency, and facility utilization. Capacity was created with out the reference to
balancing concept. So inventory imbalances are inevitable and capacity utilization is
one of the main problems of capital investment in our country. This problem has many
ramifications in the form of excess capacity, imbalance in capacity etc. if utilization
and operating efficiency has to be optimized, disposal of inventory in the form of
finished goods is absolutely necessary.
All ³SOS¶s´ indents need not mean stock-out. If all stock out indents are analyses;
Certain stock outs in raw material section were due to certain components
getting lodged in components inventory build ups due to pressures for keeping
machines working there by causing ³premature consumption ³ of raw material.
Manufacture for stock quite often means processing of large batches, especially in the
case of automatic machine batches, especially in the case of automatic machine
batches, especially in the case of automatic machine shop. Settings on autos cannot be
distributed to promoted small quantities.
Organization for inventory management, by which is the major one by which a
firm is facing major problems. Systems analysis for stream lining the moment of
purchase files and making the organization more compact and efficient has been dealt.
However, one of the main causes of the actual internal lead time being organizationaldeficiencies, what it should be being organizational deficiencies, it is considered as a
problem of special significance in the working of the company.
5/7/2018 Inventary Mgnt - slidepdf.com
http://slidepdf.com/reader/full/inventary-mgnt 93/126
93
5/7/2018 Inventary Mgnt - slidepdf.com
http://slidepdf.com/reader/full/inventary-mgnt 94/126
94
INTRODUCTION TO NFCL INVENTORY
Inventory includes raw material, work in process and finished goods in case of
manufacturing raw materials and work in process inventories are needed for smooth
production. Inventory management is essential for production oriented company¶s
minimize the costs and to utilize funds properly.
NATURE OF INVENTORIES:
The following are the inventories maintained by the NFCL for production of
UREA:
y Raw materials
y Work in process
y Finished goods
y Stores and spares, packing materials
Raw materials:
For production of urea the basic raw material used in NFCL are naphtha,
natural gas, other chemicals and materials. Raw materials are purchased and stored in
tanks for smooth production. It is a continuous process.
Naphtha is an important raw material in production of urea. Naphtha and
natural gas are used to produce ammonia and ammonia is converted in to urea. NFCL
is drawing the raw material through pipeline from various agencies fro the production
of urea.
Work in process:
During normal operation ammonia produced in the ammonia plant goes
directly per urea manufacture. In case of raw materials plant stoppage or running at
low load, in order to avoid stopped or reduction of ammonia plant load, two ammonia
storage tanks each of 5000MT capacity are provided where liquid ammonia can be
store.
5/7/2018 Inventary Mgnt - slidepdf.com
http://slidepdf.com/reader/full/inventary-mgnt 95/126
95
Finished goods:
Finished goods in terms of NFCL mean urea. They are supplied to farmers, dealers in
villages, towns and cities. As per as the internal storage is concerned zero inventory
will be maintained. Mostly the products are seasonal so the production will be more in
karriff and rabbi season. In order to avoid the fluctuation in demand, NFCL is
maintaining bagged urea in 600 go downs. 4000 MT will be manufactured per day.
The go downs can be classified into:
Buffer go downs
Filed go downs
Go downs are belonged to government agencies and private agencies. The go downs
are taken on hire at cost as probable comparable with others. Demand is more in
season, so to meet seasonal demand it is produced urea at its full capacity through out
the year, approximately 4000 tones/day.
Here the holding cost of finished goods is very minimal(interest and storage
cost) on the year ending march 31st. it is unseasoned so that ever unsold stock is there
it should maintain for another four months up to khariff season.
Buffer go downs is huge area can be stored that is more than 1000 metric tones,
it is permanent go downs. Government can be under taken this type of go downs.
Filed go downs are a temporary in which less than 1000 urea can be stored. Urea can
be obtained from buffer go downs.
The rent paid during the year is 144.92 lakh it will be 12 lakh per month. When
goods are delivered to dealers, NFCL is following FREE ON LORRY SERVICE
(FOL)
Stores and spares:
The project work dealing with inventory of stores and spares in NFCL encompasses
the following aspects:As production is concerned no inventory is maintained except naphtha. So
these materials do not directly enter production but necessary for production process.
Even though certain huge amount of expenditure is incurred, the required
important spares are to be kept ready at stock for any emergency replacement.
5/7/2018 Inventary Mgnt - slidepdf.com
http://slidepdf.com/reader/full/inventary-mgnt 96/126
96
The cost incurred on stock of spares will be very less when compared to the revenue
loss due sudden shut down of production urea.
There are certain spares to be replaced frequently due to wear and tear. Those
are electrical spares, mechanical spares, and instrumental spares.
PROCESS DESCRIPTION OF UREA PLANT:
The method of valuation of WIP is at cost i.e. materials cost, labors,
Factory administrative over heads and depreciation but excludes interest on
borrowings.
UREA PLANT:
The production of urea requires ammonia and Co2 as the inputs, both of which
are available from ammonia plant. The pilling tower of 22 m diameter and 75 M free
fall high
Operates under natural draft. The urea perils from the bottom of pilling tower are
transported through mechanized belt conveyor system in to urea storage silo or
directly to urea bagging plant.
BAGGING:
The periled urea from the urea plant is transferred to the bagging plant in belt
conveyers. The pilled urea enters the bunkers designed for 50 Mt of urea capacity.
Bunkers are provided with load cells, which have 2 independent electronic bagging
machines
Materials management:
Materials management is an important function of an organization covering
various aspects of input process which are necessary for the production process and
spare parts fro the maintenance of plant. Thus in a production process materials
management can be preliminary to transformation process.
Objectives:
Materials management contributes to survival and profits of an enterprise by
providing adequate supply of materials at the lowest possible costs.
5/7/2018 Inventary Mgnt - slidepdf.com
http://slidepdf.com/reader/full/inventary-mgnt 97/126
97
THE FUNDAMENTAL OBJECTIVES ARE:
Material selection
Low operating costs
Receiving and controlling materials
Issue material
Purchase department:
Purchasing is the one phase of materials management. This department is
processing different goods and services from some internal agencies. The main
objective of this department is to arrange the supply of materials, spare parts and
services or semi-finished goods of desired quality, quantity at lowest price and at the
desired time. What ever required by the NFCL to produce the urea will procured from
some source out side the NFCL.
Purchase policies:
A policy is a statement which describes in a very general terms as intended
course of action.
Purpose of policy statement:
y To formulate operating procedures
y To guide in making decision about unusual problems
5/7/2018 Inventary Mgnt - slidepdf.com
http://slidepdf.com/reader/full/inventary-mgnt 98/126
98
Purchase procedure:
Indent
|
Selection of venders
|
Selection enquires to vendors
|
Receiving quotation from supplies
|
Preparing quotation comparison
|
Statement calling negotiation/minutes of meeting
|
Note for approval
|
Purchase order
ISSUE SECTION:
In NFCL issues and stores will be maintained by the issue section. No
documents were regarding the issue is concern. It is maintaining weighted average
method for issues.
Moving weighted average method:
The issue rate is calculated by dividing the sum of periodic weighted average
prices for a number by a total number of such periods. The procedure is seen in thetable.
For standing materials items can be classified and assigned bin number. The
two types of items.
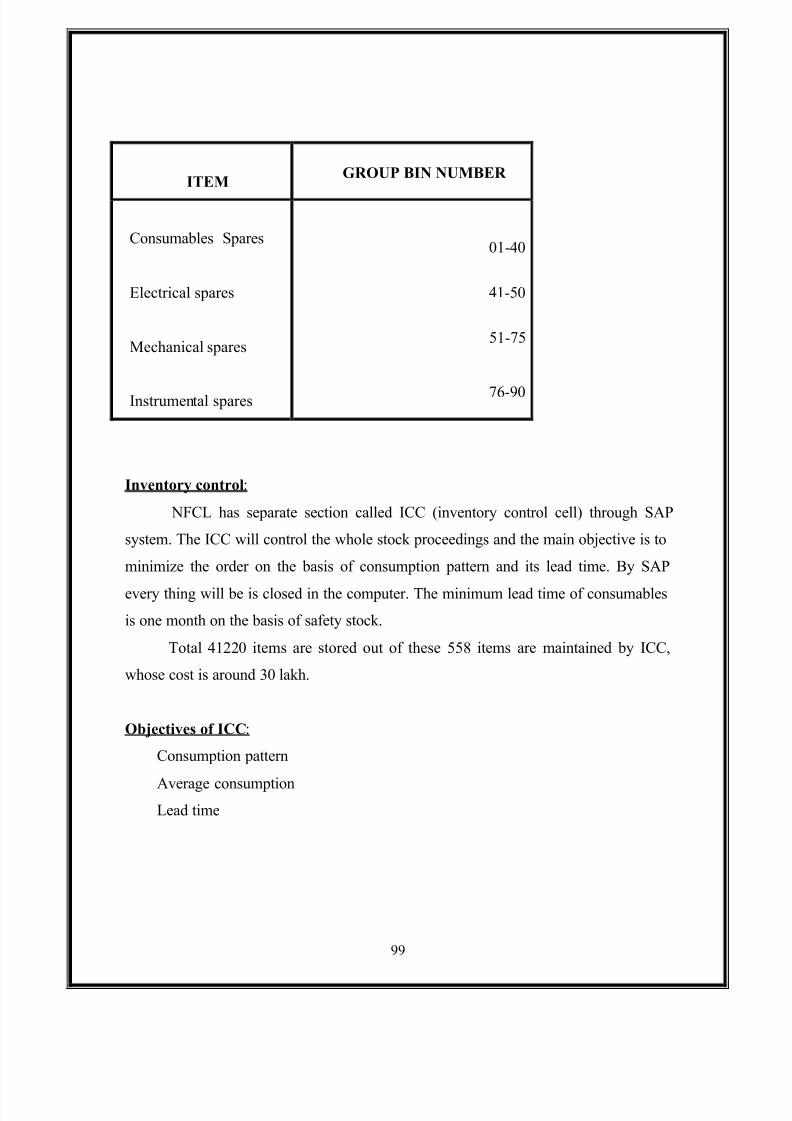
5/7/2018 Inventary Mgnt - slidepdf.com
http://slidepdf.com/reader/full/inventary-mgnt 99/126
99
ITEM GROUP BIN NUMBER
Consumables Spares
Electrical spares
Mechanical spares
Instrumental spares
01-40
41-50
51-75
76-90
Inventory control:
NFCL has separate section called ICC (inventory control cell) through SAP
system. The ICC will control the whole stock proceedings and the main objective is to
minimize the order on the basis of consumption pattern and its lead time. By SAP
every thing will be is closed in the computer. The minimum lead time of consumables
is one month on the basis of safety stock.
Total 41220 items are stored out of these 558 items are maintained by ICC,
whose cost is around 30 lakh.
Objectives of ICC:
Consumption pattern
Average consumption
Lead time
5/7/2018 Inventary Mgnt - slidepdf.com
http://slidepdf.com/reader/full/inventary-mgnt 100/126
100
Qualities of ICC:
Representative nature
Quality also considered
Multi ± user departments
Responsibility to control all issues
Regarding items in store.
Control techniques
NFCL is following mainly the following techniques
FSN ANALYSIS
ABC ANALYSIS
VED ANALYSIS
JIT
FSN Analysis:
FSN analysis discloses fast moving, slow moving and non moving items.
This is the better technique for ascertaining the high value of slowing and non moving
materials has blocked huge sum of money unnecessarily for raw materials. So to over
come this problem or to make arrangement for their exchange with inventories
required by concerned. There is no new requisition, for this process inventory turn
over ratio identifying slow moving items.
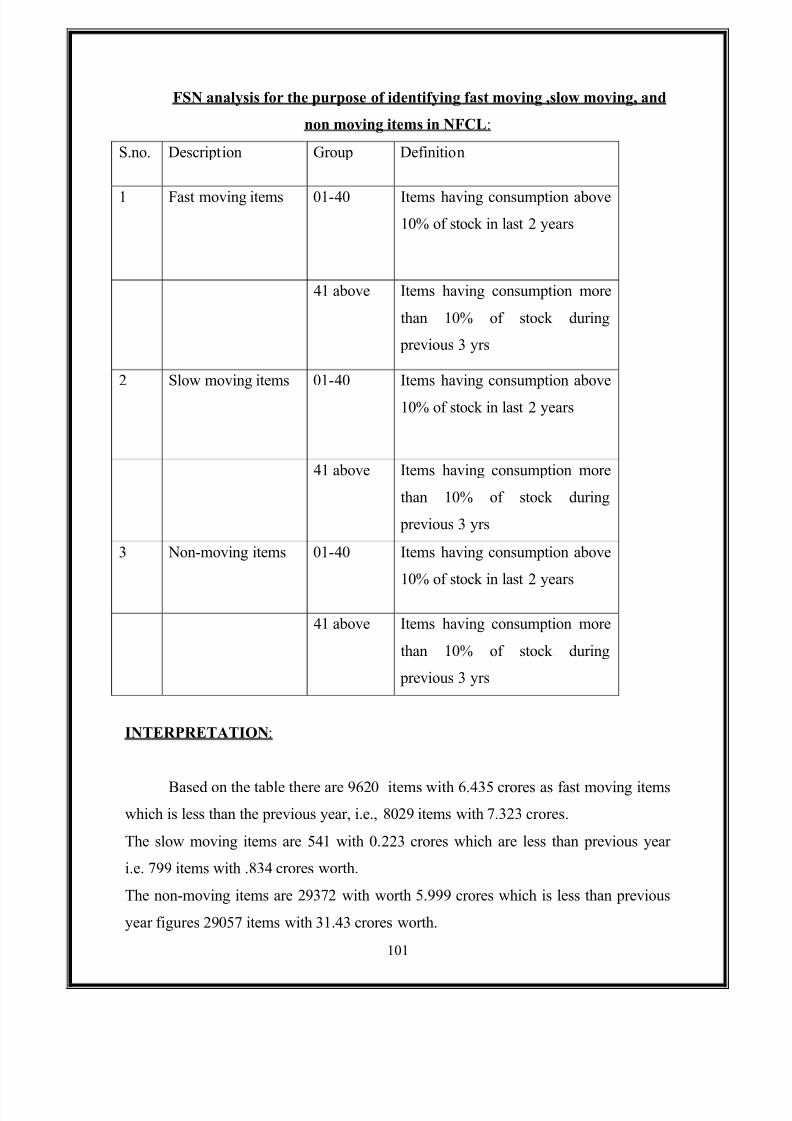
5/7/2018 Inventary Mgnt - slidepdf.com
http://slidepdf.com/reader/full/inventary-mgnt 101/126
101
FSN analysis for the purpose of identifying fast moving ,slow moving, and
non moving items in NFCL:
S.no. Description Group Definition
1 Fast moving items 01-40 Items having consumption above
10% of stock in last 2 years
41 above Items having consumption more
than 10% of stock during
previous 3 yrs
2 Slow moving items 01-40 Items having consumption above
10% of stock in last 2 years
41 above Items having consumption more
than 10% of stock during
previous 3 yrs
3 Non-moving items 01-40 Items having consumption above
10% of stock in last2
years
41 above Items having consumption more
than 10% of stock during
previous 3 yrs
INTERPRETATION:
Based on the table there are 9620 items with 6.435 crores as fast moving items
which is less than the previous year, i.e., 8029 items with 7.323 crores.
The slow moving items are 541 with 0.223 crores which are less than previous year
i.e. 799 items with .834 crores worth.
The non-moving items are 29372 with worth 5.999 crores which is less than previous
year figures 29057 items with 31.43 crores worth.
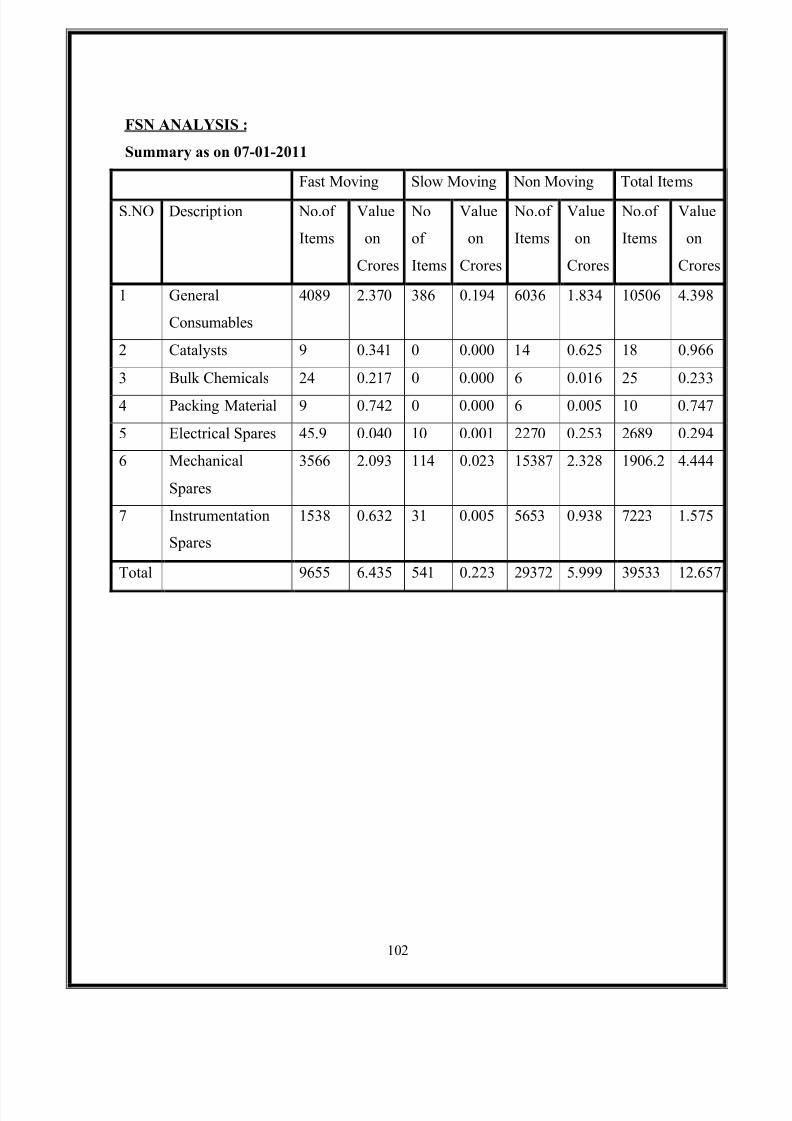
5/7/2018 Inventary Mgnt - slidepdf.com
http://slidepdf.com/reader/full/inventary-mgnt 102/126
102
FSN ANALYSIS :
Summary as on 07-01-2011
Fast Moving Slow Moving Non Moving Total Items
S.NO Description No.of
Items
Value
on
Crores
No
of
Items
Value
on
Crores
No.of
Items
Value
on
Crores
No.of
Items
Value
on
Crores
1 General
Consumables
4089 2.370 386 0.194 6036 1.834 10506 4.398
2 Catalysts 9 0.341 0 0.000 14 0.625 18 0.966
3 Bulk Chemicals 24 0.217 0 0.000 6 0.016 25 0.233
4 Packing Material 9 0.742 0 0.000 6 0.005 10 0.747
5 Electrical Spares 45.9 0.040 10 0.001 2270 0.253 2689 0.294
6 Mechanical
Spares
3566 2.093 114 0.023 15387 2.328 1906.2 4.444
7 Instrumentation
Spares
1538 0.632 31 0.005 5653 0.938 7223 1.575
Total 9655 6.435 541 0.223 29372 5.999 39533 12.657
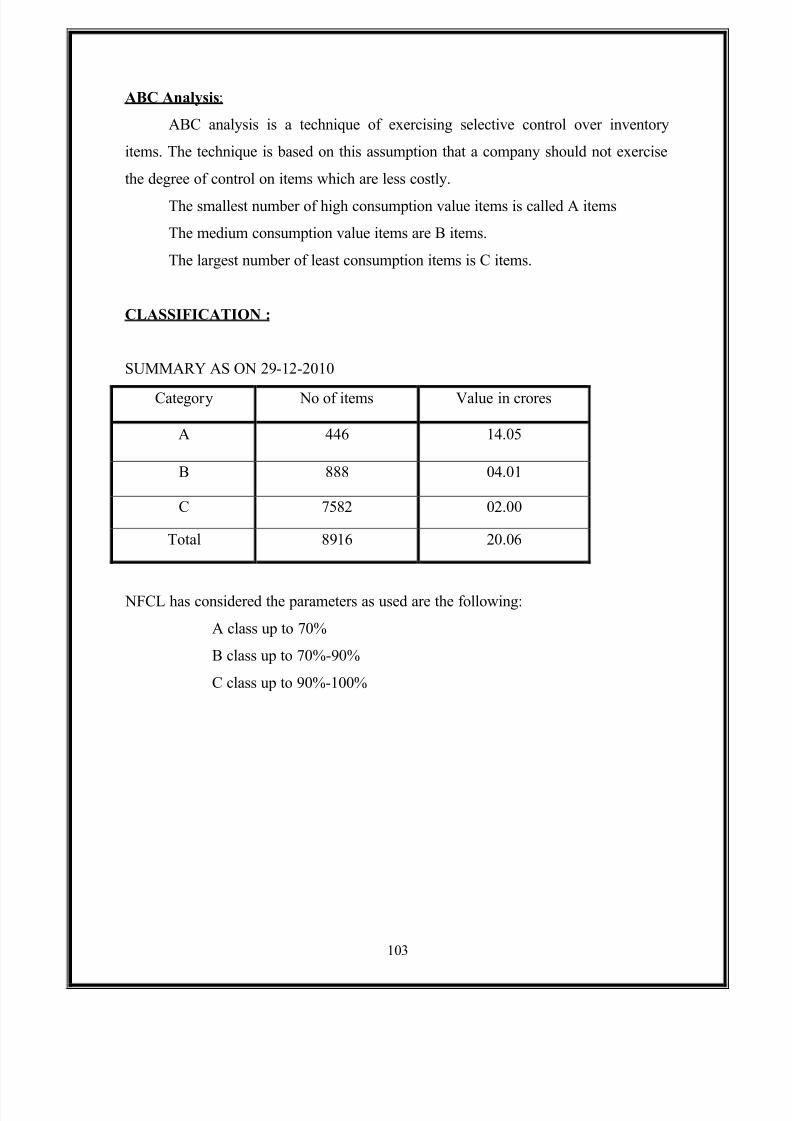
5/7/2018 Inventary Mgnt - slidepdf.com
http://slidepdf.com/reader/full/inventary-mgnt 103/126
103
ABC Analysis:
ABC analysis is a technique of exercising selective control over inventory
items. The technique is based on this assumption that a company should not exercise
the degree of control on items which are less costly.
The smallest number of high consumption value items is called A items
The medium consumption value items are B items.
The largest number of least consumption items is C items.
CLASSIFICATION :
SUMMARY AS ON 29-12-2010
Category No of items Value in crores
A 446 14.05
B 888 04.01
C 7582 02.00
Total 8916 20.06
NFCL has considered the parameters as used are the following:
A class up to 70%
B class up to 70%-90%
C class up to 90%-100%
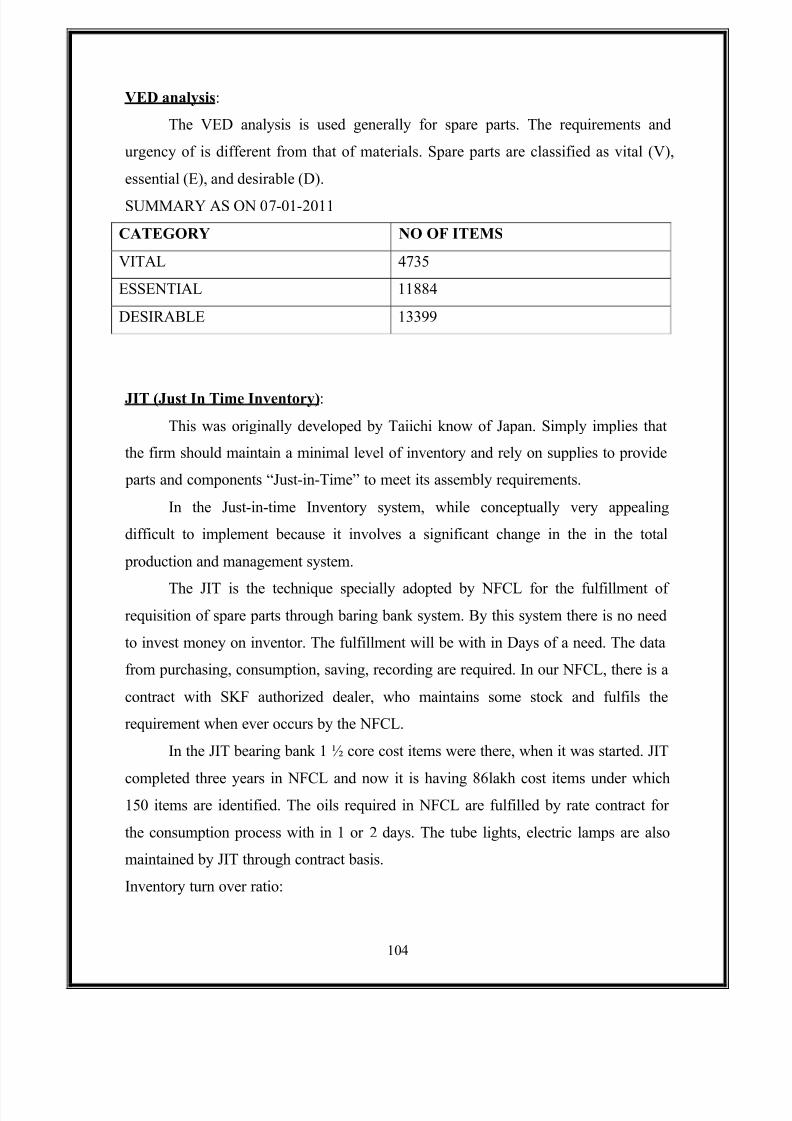
5/7/2018 Inventary Mgnt - slidepdf.com
http://slidepdf.com/reader/full/inventary-mgnt 104/126
104
VED analysis:
The VED analysis is used generally for spare parts. The requirements and
urgency of is different from that of materials. Spare parts are classified as vital (V),
essential (E), and desirable (D).
SUMMARY AS ON 07-01-2011
CATEGORY NO OF ITEMS
VITAL 4735
ESSENTIAL 11884
DESIRABLE 13399
JIT (Just In Time Inventory):
This was originally developed by Taiichi know of Japan. Simply implies that
the firm should maintain a minimal level of inventory and rely on supplies to provide
parts and components ³Just-in-Time´ to meet its assembly requirements.
In the Just-in-time Inventory system, while conceptually very appealing
difficult to implement because it involves a significant change in the in the total
production and management system.
The JIT is the technique specially adopted by NFCL for the fulfillment of
requisition of spare parts through baring bank system. By this system there is no need
to invest money on inventor. The fulfillment will be with in Days of a need. The data
from purchasing, consumption, saving, recording are required. In our NFCL, there is a
contract with SKF authorized dealer, who maintains some stock and fulfils the
requirement when ever occurs by the NFCL.
In the JIT bearing bank 1 ½ core cost items were there, when it was started. JIT
completed three years in NFCL and now it is having86
lakh cost items under which150 items are identified. The oils required in NFCL are fulfilled by rate contract for
the consumption process with in 1 or 2 days. The tube lights, electric lamps are also
maintained by JIT through contract basis.
Inventory turn over ratio:
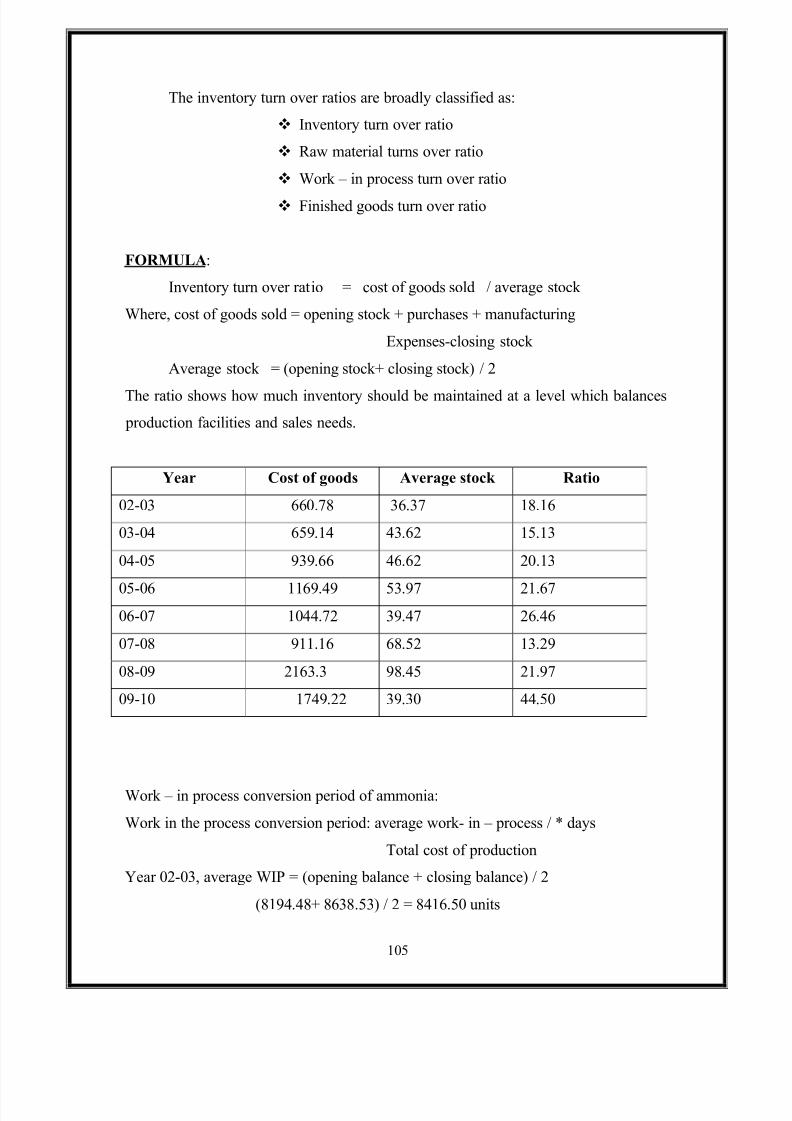
5/7/2018 Inventary Mgnt - slidepdf.com
http://slidepdf.com/reader/full/inventary-mgnt 105/126
105
The inventory turn over ratios are broadly classified as:
Inventory turn over ratio
Raw material turns over ratio
Work ± in process turn over ratio
Finished goods turn over ratio
FORMULA:
Inventory turn over ratio = cost of goods sold / average stock
Where, cost of goods sold = opening stock + purchases + manufacturing
Expenses-closing stock
Average stock = (opening stock+ closing stock) / 2
The ratio shows how much inventory should be maintained at a level which balances
production facilities and sales needs.
Year Cost of goods Average stock Ratio
02-03 660.78 36.37 18.16
03-04 659.14 43.62 15.13
04-05 939.66 46.62 20.13
05-06 1169.49 53.97 21.67
06-07 1044.72 39.47 26.46
07-08 911.16 68.52 13.29
08-09 2163.3 98.45 21.97
09-10 1749.22 39.30 44.50
Work ± in process conversion period of ammonia:
Work in the process conversion period: average work- in ± process / * days
Total cost of production
Year 02-03, average WIP = (opening balance + closing balance) / 2
(8194.48+ 8638.53) / 2 = 8416.50 units
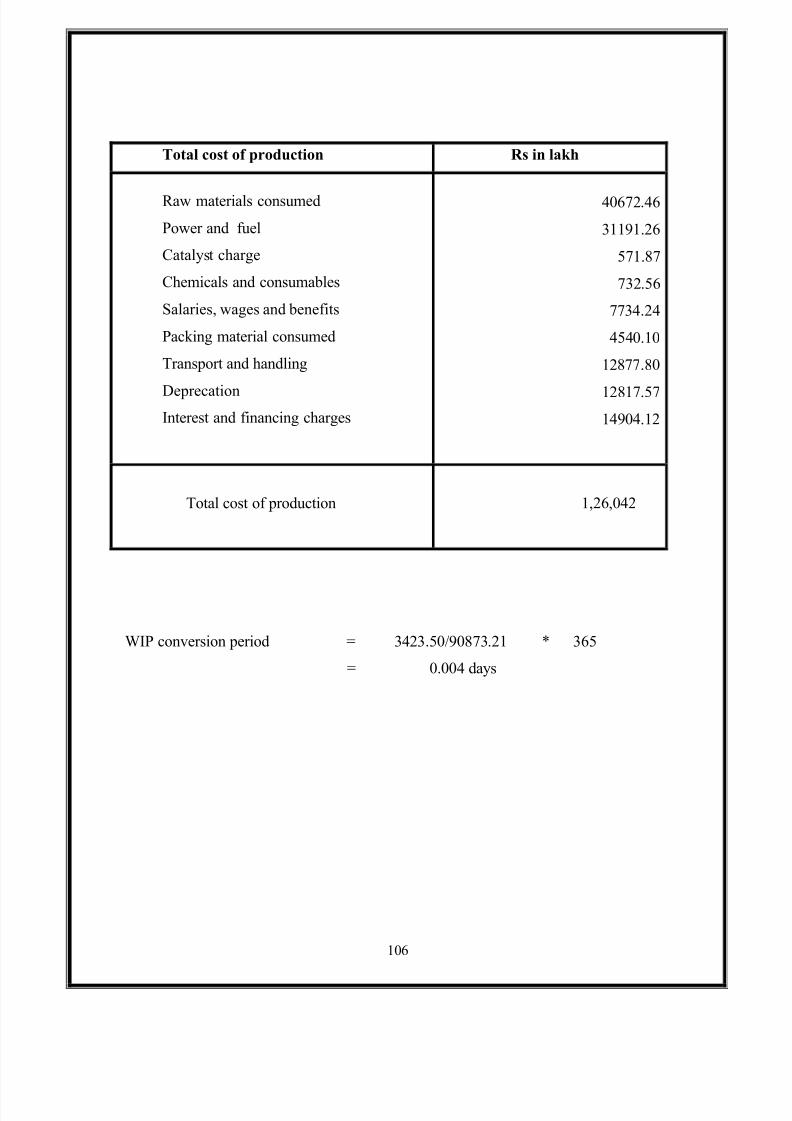
5/7/2018 Inventary Mgnt - slidepdf.com
http://slidepdf.com/reader/full/inventary-mgnt 106/126
106
Total cost of production Rs in lakh
Raw materials consumed
Power and fuel
Catalyst charge
Chemicals and consumables
Salaries, wages and benefits
Packing material consumed
Transport and handling
Deprecation
Interest and financing charges
40672.46
31191.26
571.87
732.56
7734.24
4540.10
12877.80
12817.57
14904.12
Total cost of production 1,26,042
WIP conversion period = 3423.50/90873.21 * 365
= 0.004 days
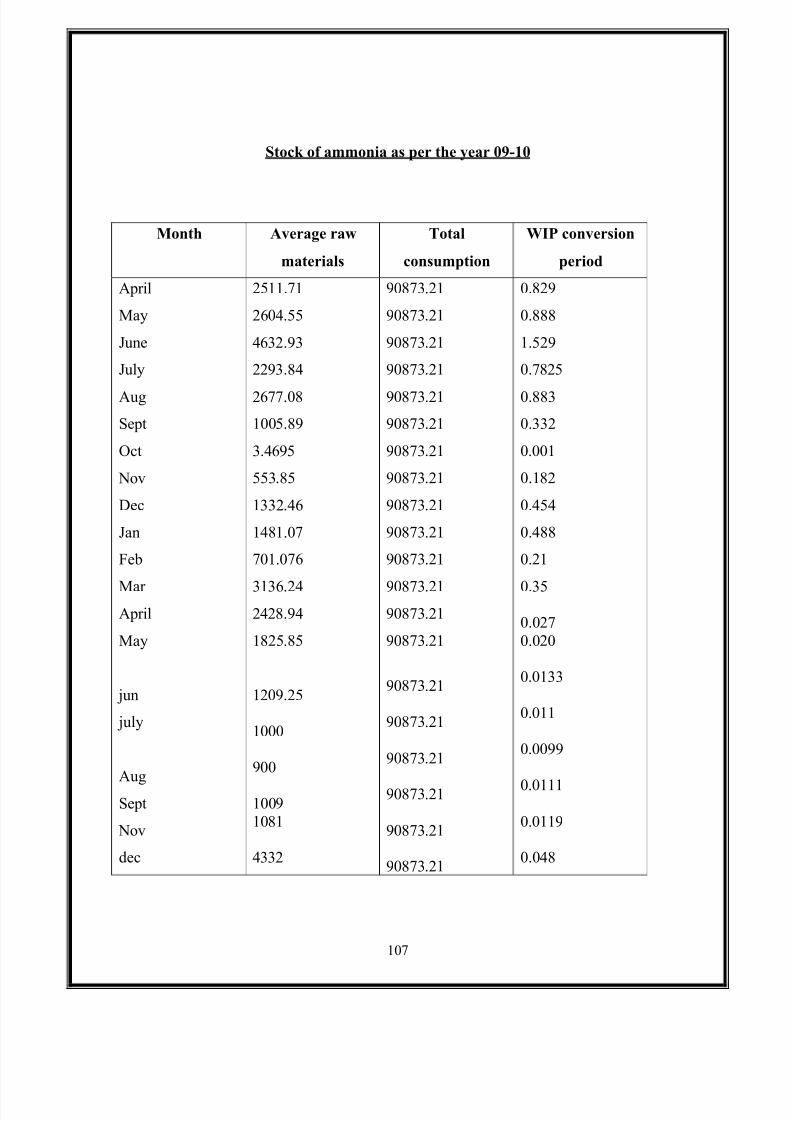
5/7/2018 Inventary Mgnt - slidepdf.com
http://slidepdf.com/reader/full/inventary-mgnt 107/126
107
Stock of ammonia as per the year 09-10
Month Average raw
materials
Total
consumption
WIP conversion
period
April
May
June
July
Aug
Sept
Oct
Nov
Dec
Jan
Feb
Mar
April
May
jun
july
AugSept
Nov
dec
2511.71
2604.55
4632.93
2293.84
2677.08
1005.89
3.4695
553.85
1332.46
1481.07
701.076
3136.24
2428.94
1825.85
1209.25
1000
900
1009
1081
4332
90873.21
90873.21
90873.21
90873.21
90873.21
90873.21
90873.21
90873.21
90873.21
90873.21
90873.21
90873.21
90873.21
90873.21
90873.21
90873.21
90873.21
90873.21
90873.21
90873.21
0.829
0.888
1.529
0.7825
0.883
0.332
0.001
0.182
0.454
0.488
0.21
0.35
0.027
0.020
0.0133
0.011
0.0099
0.0111
0.0119
0.048
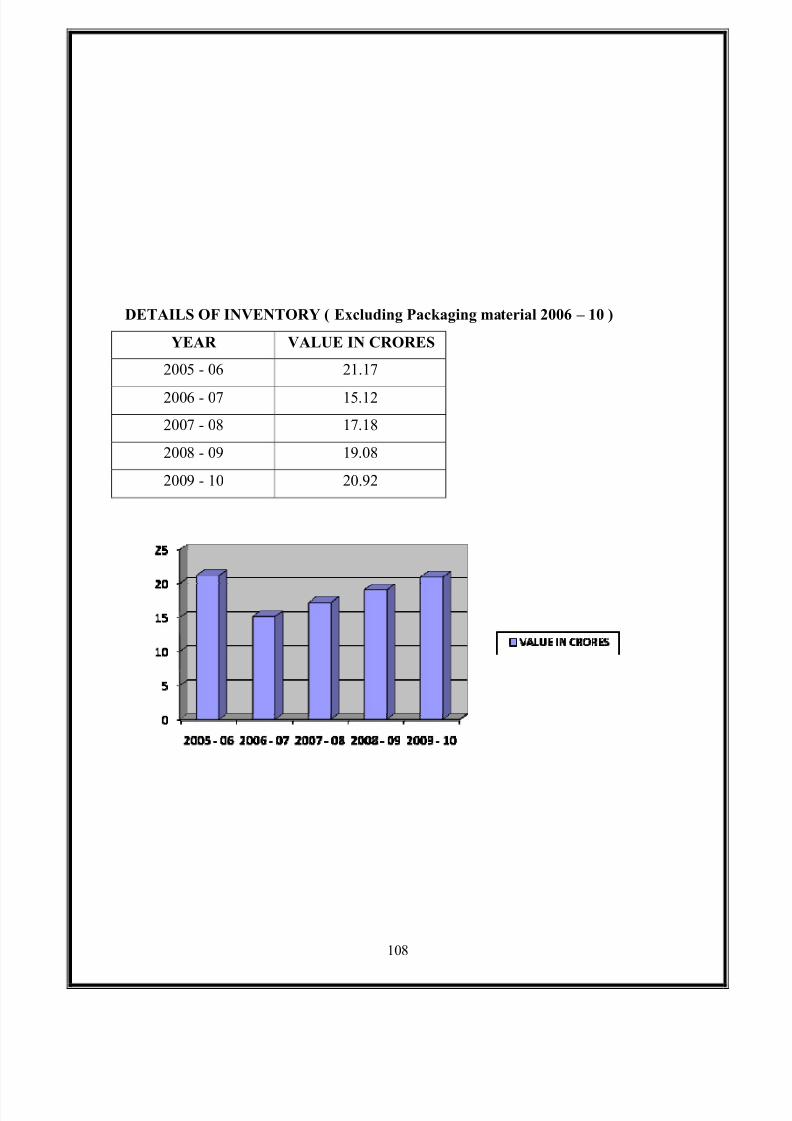
5/7/2018 Inventary Mgnt - slidepdf.com
http://slidepdf.com/reader/full/inventary-mgnt 108/126
108
DETAILS OF INVENTORY ( Excluding Packaging material 2006 ± 10 )
YEAR VALUE IN CRORES
2005 - 06 21.17
2006 - 07 15.12
2007 - 08 17.18
2008 - 09 19.08
2009 - 10 20.92
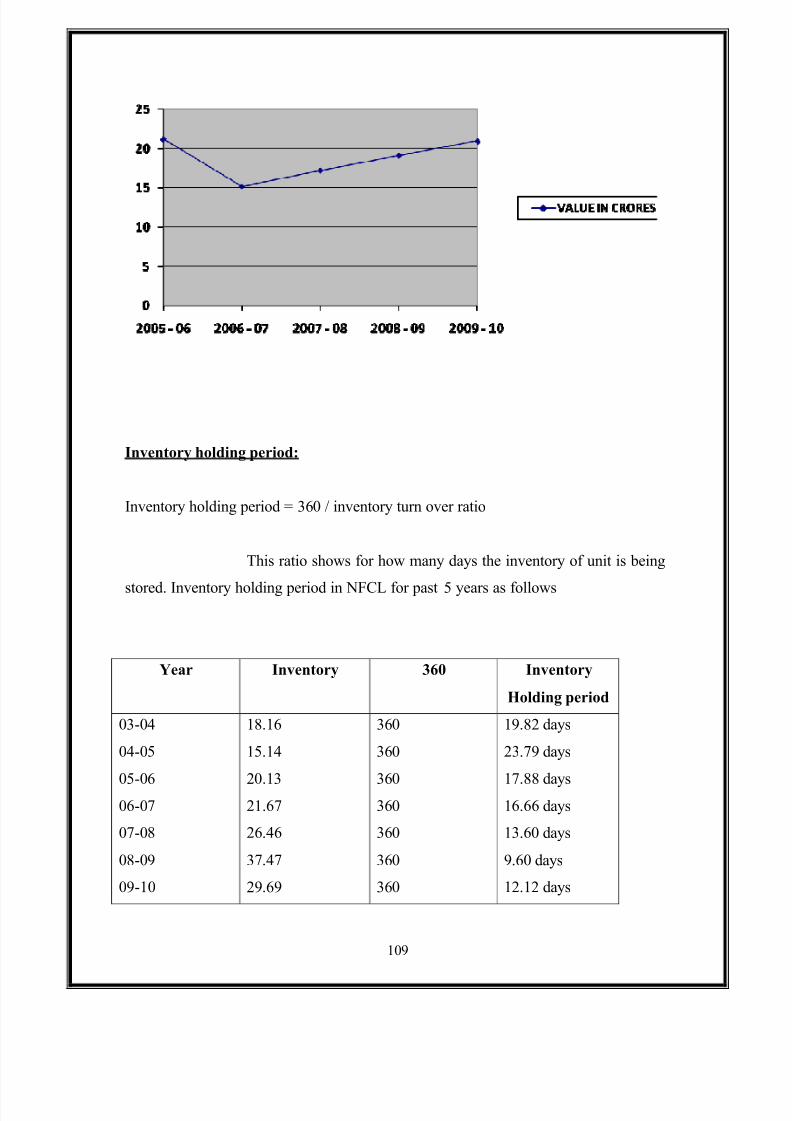
5/7/2018 Inventary Mgnt - slidepdf.com
http://slidepdf.com/reader/full/inventary-mgnt 109/126
109
Inventory holding period:
Inventory holding period = 360 / inventory turn over ratio
This ratio shows for how many days the inventory of unit is being
stored. Inventory holding period in NFCL for past 5 years as follows
Year Inventory 360 Inventory
Holding period
03-04
04-05
05-06 06-07
07-08
08-09
09-10
18.16
15.14
20.13 21.67
26.46
37.47
29.69
360
360
360360
360
360
360
19.82 days
23.79 days
17.88 days16.66 days
13.60 days
9.60 days
12.12 days
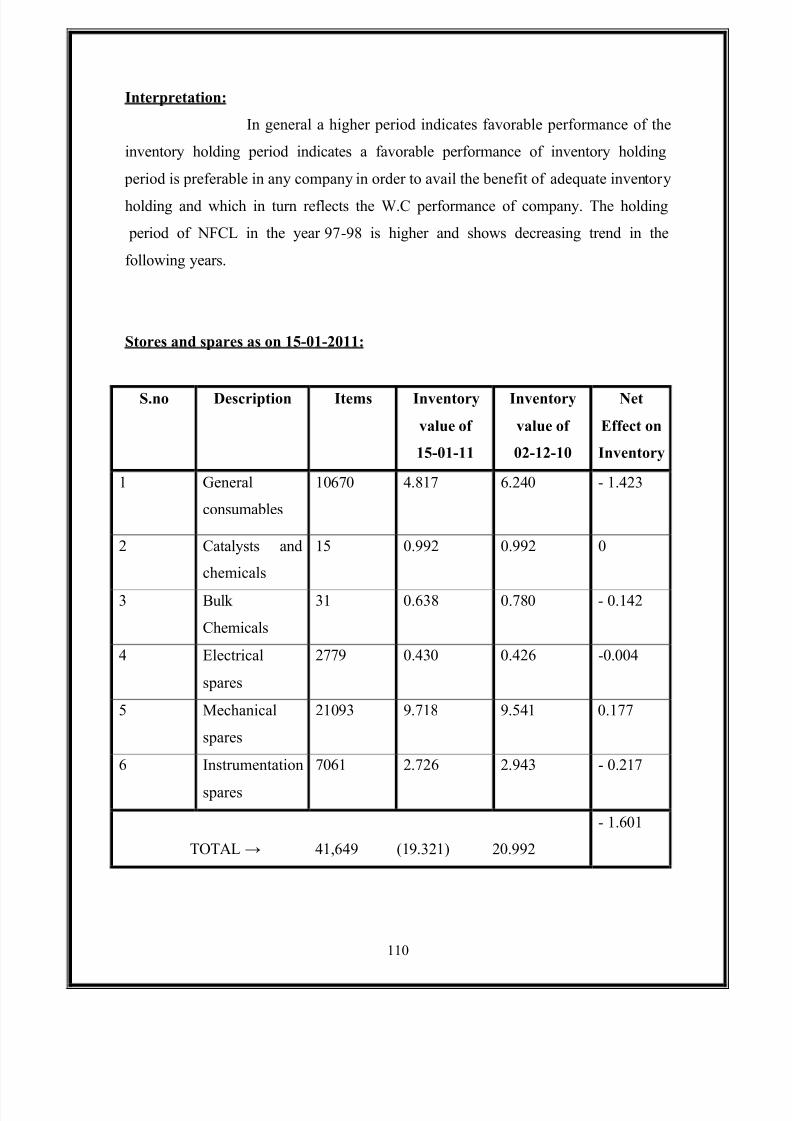
5/7/2018 Inventary Mgnt - slidepdf.com
http://slidepdf.com/reader/full/inventary-mgnt 110/126
110
Interpretation:
In general a higher period indicates favorable performance of the
inventory holding period indicates a favorable performance of inventory holding
period is preferable in any company in order to avail the benefit of adequate inventory
holding and which in turn reflects the W.C performance of company. The holding
period of NFCL in the year 97-98 is higher and shows decreasing trend in the
following years.
Stores and spares as on 15-01-2011:
S.no Description Items Inventory
value of
15-01-11
Inventory
value of
02-12-10
Net
Effect on
Inventory
1 General
consumables
10670 4.817 6.240 - 1.423
2 Catalysts and
chemicals
15 0.992 0.992 0
3 Bulk
Chemicals
31 0.638 0.780 - 0.142
4 Electrical
spares
2779 0.430 0.426 -0.004
5 Mechanical
spares
21093 9.718 9.541 0.177
6 Instrumentation
spares
7061 2.726 2.943 - 0.217
TOTAL 41,649 (19.321) 20.992
- 1.601
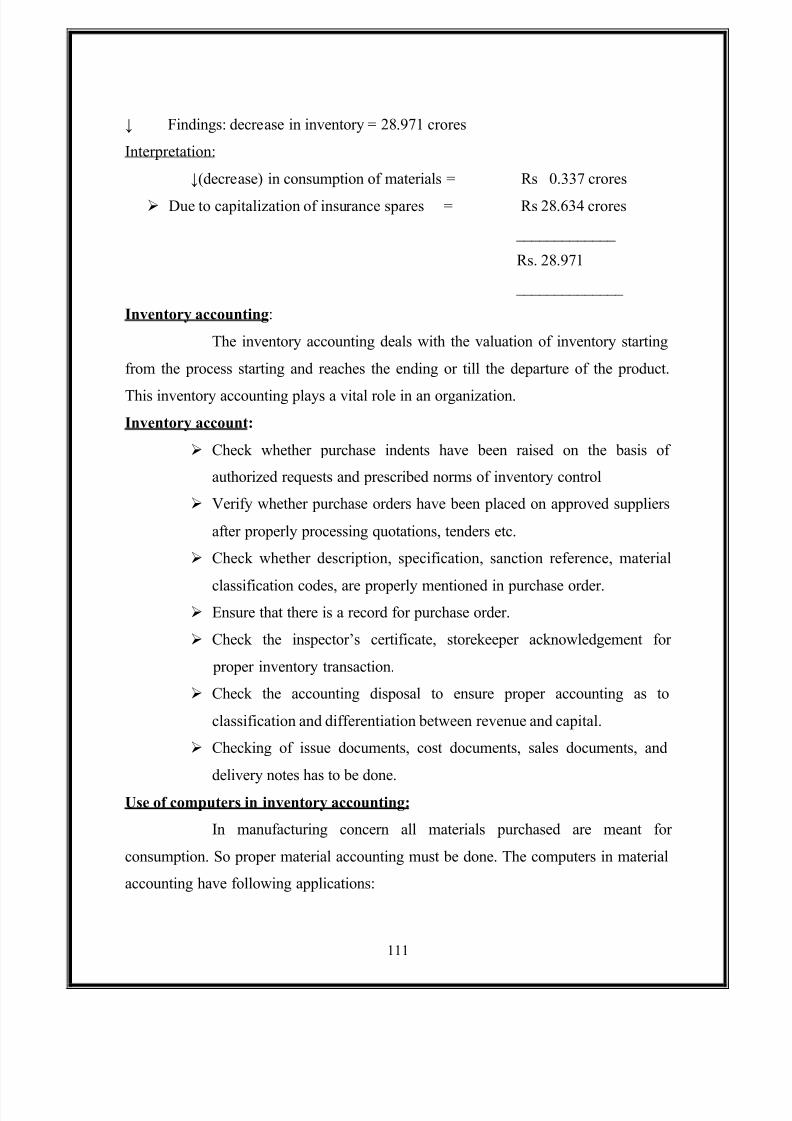
5/7/2018 Inventary Mgnt - slidepdf.com
http://slidepdf.com/reader/full/inventary-mgnt 111/126
111
Findings: decrease in inventory = 28.971 crores
Interpretation:
(decrease) in consumption of materials = Rs 0.337 crores
Due to capitalization of insurance spares = Rs 28.634 crores
_____________
Rs. 28.971
______________
Inventory accounting:
The inventory accounting deals with the valuation of inventory starting
from the process starting and reaches the ending or till the departure of the product.
This inventory accounting plays a vital role in an organization.
Inventory account:
Check whether purchase indents have been raised on the basis of
authorized requests and prescribed norms of inventory control
Verify whether purchase orders have been placed on approved suppliers
after properly processing quotations, tenders etc.
Check whether description, specification, sanction reference, material
classification codes, are properly mentioned in purchase order.
Ensure that there is a record for purchase order.
Check the inspector¶s certificate, storekeeper acknowledgement for
proper inventory transaction.
Check the accounting disposal to ensure proper accounting as to
classification and differentiation between revenue and capital.
Checking of issue documents, cost documents, sales documents, and
delivery notes has to be done.Use of computers in inventory accounting:
In manufacturing concern all materials purchased are meant for
consumption. So proper material accounting must be done. The computers in material
accounting have following applications:
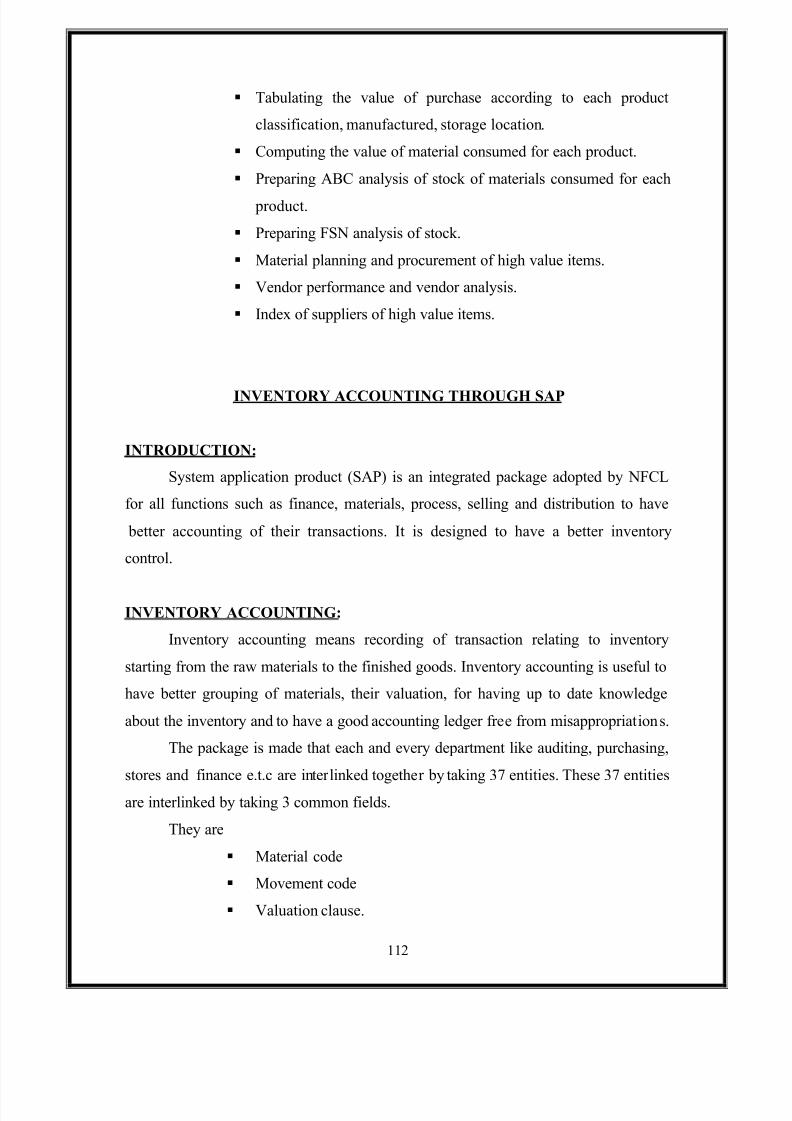
5/7/2018 Inventary Mgnt - slidepdf.com
http://slidepdf.com/reader/full/inventary-mgnt 112/126
112
Tabulating the value of purchase according to each product
classification, manufactured, storage location.
Computing the value of material consumed for each product.
Preparing ABC analysis of stock of materials consumed for each
product.
Preparing FSN analysis of stock.
Material planning and procurement of high value items.
Vendor performance and vendor analysis.
Index of suppliers of high value items.
INVENTORY ACCOUNTING THROUGH SAP
INTRODUCTION:
System application product (SAP) is an integrated package adopted by NFCL
for all functions such as finance, materials, process, selling and distribution to have
better accounting of their transactions. It is designed to have a better inventory
control.
INVENTORY ACCOUNTING:
Inventory accounting means recording of transaction relating to inventory
starting from the raw materials to the finished goods. Inventory accounting is useful to
have better grouping of materials, their valuation, for having up to date knowledge
about the inventory and to have a good accounting ledger free from misappropriations.
The package is made that each and every department like auditing, purchasing,
stores and finance e.t.c are interlinked together by taking37
entities. These37
entitiesare interlinked by taking 3 common fields.
They are
Material code
Movement code
Valuation clause.
5/7/2018 Inventary Mgnt - slidepdf.com
http://slidepdf.com/reader/full/inventary-mgnt 113/126
113
As there are thousands of items, the total materials are divided into 99 groups.
Each group consists of different items and they are identified by a definite code of 8
digits. The first two digits of code signify the group to which it belo ngs. For each and
every item in the group a master file is defined and it consists.
Item code.
Description.
Movement type.
Valuation clause e.t.c.
The groups are classified in to 5 categories:
y Chemicals
y Consumables.
y Catalysts.
y Indigenous stores & spares.
y Important spares.
Sap is the system which allows goods movement like goods recipient, goods issue,
stock transfer and transfer posting.
The document principle:
A document principle must be generated and stored in the system for each and
every transaction or an event which causes a change in the stock.
When ever a goods movement is posted material document and accounting
document are created in the SAP.
A material document is one which is generated when goods are posted and an
accounting document is one which deals with the financial aspects i.e., if the
movement is relevant to financial accounting (if leads to an updated of general ledger
accounts). The general ledger accounts involved in the goods movement are updated
through an automatic account assigned.
In NFCL the material module is linked with the financial module through SAP.
As a result there is no need for reconciliation of the stores ledger and the finance
ledger at the end of each and every month as other organizations do.
5/7/2018 Inventary Mgnt - slidepdf.com
http://slidepdf.com/reader/full/inventary-mgnt 114/126
114
When ever consumption of any stores items in there account code is
automatically picked up by the system. When material is issued, not only ledger
control but cost control is also there at there at the possible cost center.
A material document is identified by document number and material document
year and accounting document is identified by the company code, the document
number and fiscal year.
For each transaction event type and document type and a number range will be
assigned in the material document as well as in accounting document.
In master, the classification of materials, purchasing of the materials, foreign
trade imports, purchase order, mpr1, mpr 2, mpr 3« Storage, accounting, costing etc.
will be there.
In mpr1, mpr 2, mpr 3, the ABC indicator will be there to indicate the material
to which group it belongs to. In the storage material the field material storage will be
there which is divided in to 3 units i.e., kkd 1, kkd 2, kkd3 in NFCL
In the accounting file the valuation clause will be there which is divided in to
indigenous stores or spares credit or consumer debit. This valuation is divided into
indigenous stores or spares, imported stores / spares, consumerables,welfare items,
uniforms and soon. So in the stores ledger the first 40 are called as consumables and
from 40 to 90 are called as imported and indigenous stores or spares.
Or icing cost storage location is also there in accounting file.
The cost center module is one which tells about the transaction as materials i.e.,
from issues, from purchases etc, i.e., financial transactions.
The cost center accounting is a one which tells about the cost of elements,
actual costs, planned costs and variance (%).
A transaction that occurs in the stores is listed under the stores ledger and a
value generating transactions are listed under the financial ledger relating to materials.General ledger is the integrating form of stores and financial ledger and it is
activated based on the valuation clause, movement type and cost center.
The store document consists of item, quantity, material description, material
code etc and finance document consists of debit and credit entries.
Purchase recipient of material: stores debit, party credit
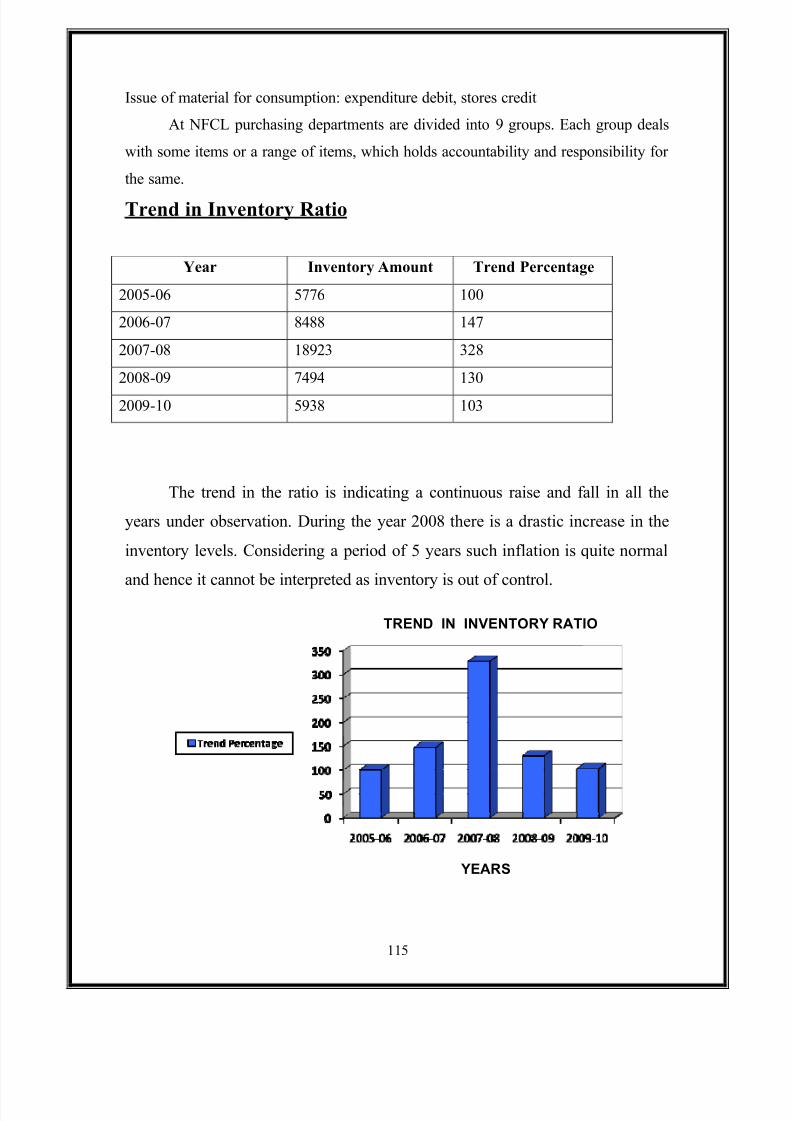
5/7/2018 Inventary Mgnt - slidepdf.com
http://slidepdf.com/reader/full/inventary-mgnt 115/126
115
Issue of material for consumption: expenditure debit, stores credit
At NFCL purchasing departments are divided into 9 groups. Each group deals
with some items or a range of items, which holds accountability and responsibility for
the same.
Trend in Inventory Ratio
Year Inventory Amount Trend Percentage
2005-06 5776 100
2006-07 8488 147
2007-08 18923 328
2008-09 7494 130
2009-10 5938 103
The trend in the ratio is indicating a continuous raise and fall in all the
years under observation. During the year 2008 there is a drastic increase in the
inventory levels. Considering a period of 5 years such inflation is quite normal
and hence it cannot be interpreted as inventory is out of control.
TREND IN INVENTORY RATIO
YEARS
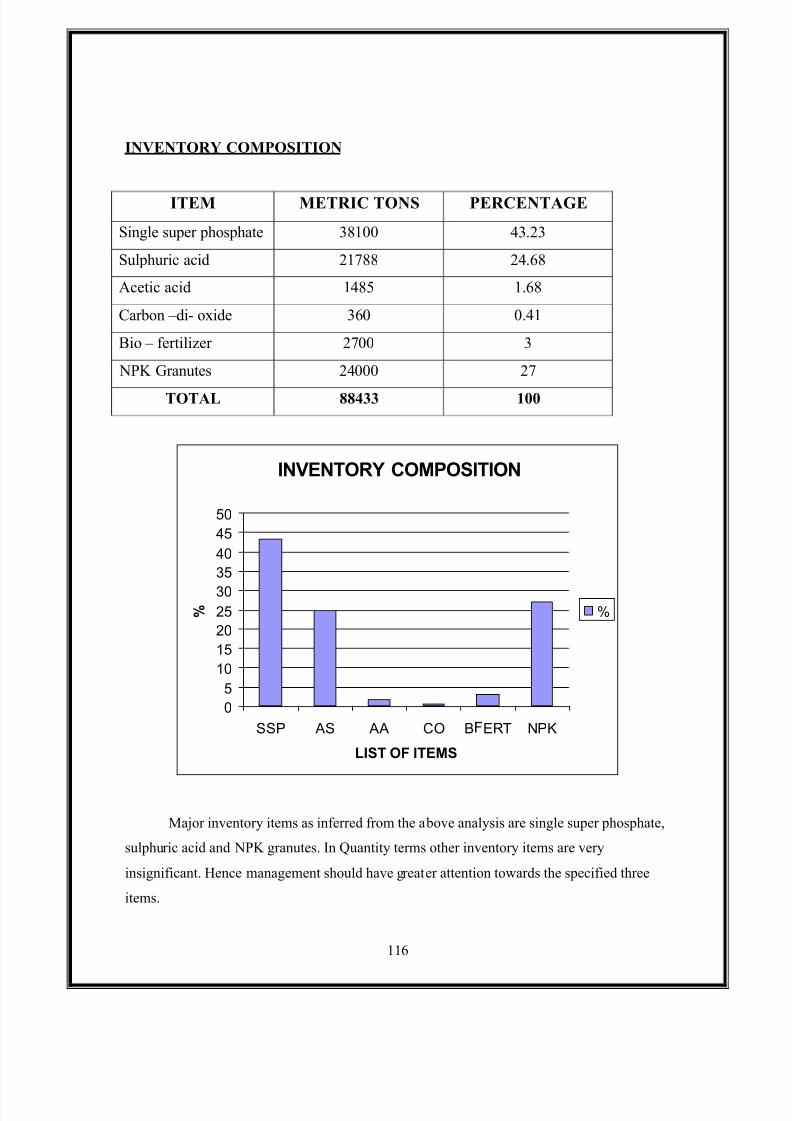
5/7/2018 Inventary Mgnt - slidepdf.com
http://slidepdf.com/reader/full/inventary-mgnt 116/126
116
INVENTORY COMPOSITION
ITEM METRIC TONS PERCENTAGE
Single super phosphate 38100 43.23
Sulphuric acid 21788 24.68
Acetic acid 1485 1.68
Carbon ±di- oxide 360 0.41
Bio ± fertilizer 2700 3
NPK Granutes 24000 27
TOTAL 88433 100
INVENTORY COMPOSITION
0
5
10
15
20
25
30
35
40
45
50
SSP AS AA CO B ERT NPK
LIST OF ITEMS
% %
Major inventory items as inferred from the above analysis are single super phosphate,
sulphuric acid and NPK granutes. In Quantity terms other inventory items are very
insignificant. Hence management should have greater attention towards the specified three
items.
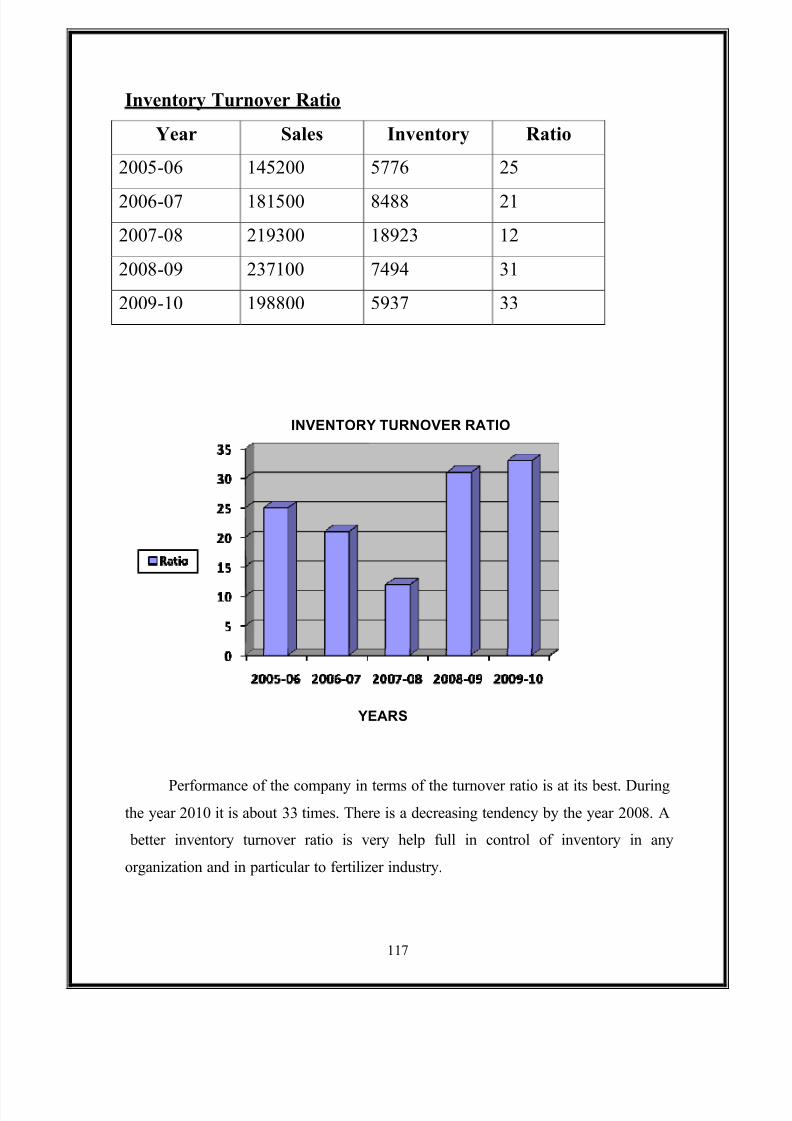
5/7/2018 Inventary Mgnt - slidepdf.com
http://slidepdf.com/reader/full/inventary-mgnt 117/126
117
Inventory Turnover Ratio
Year Sales Inventory Ratio
2005-06 145200 5776 25
2006-07 181500 8488 21
2007-08 219300 18923 12
2008-09 237100 7494 31
2009-10 198800 5937 33
Performance of the company in terms of the turnover ratio is at its best. During
the year 2010 it is about 33 times. There is a decreasing tendency by the year 2008. A
better inventory turnover ratio is very help full in control of inventory in any
organization and in particular to fertilizer industry.
YEARS
INVENTORY TURNOVER RATIO
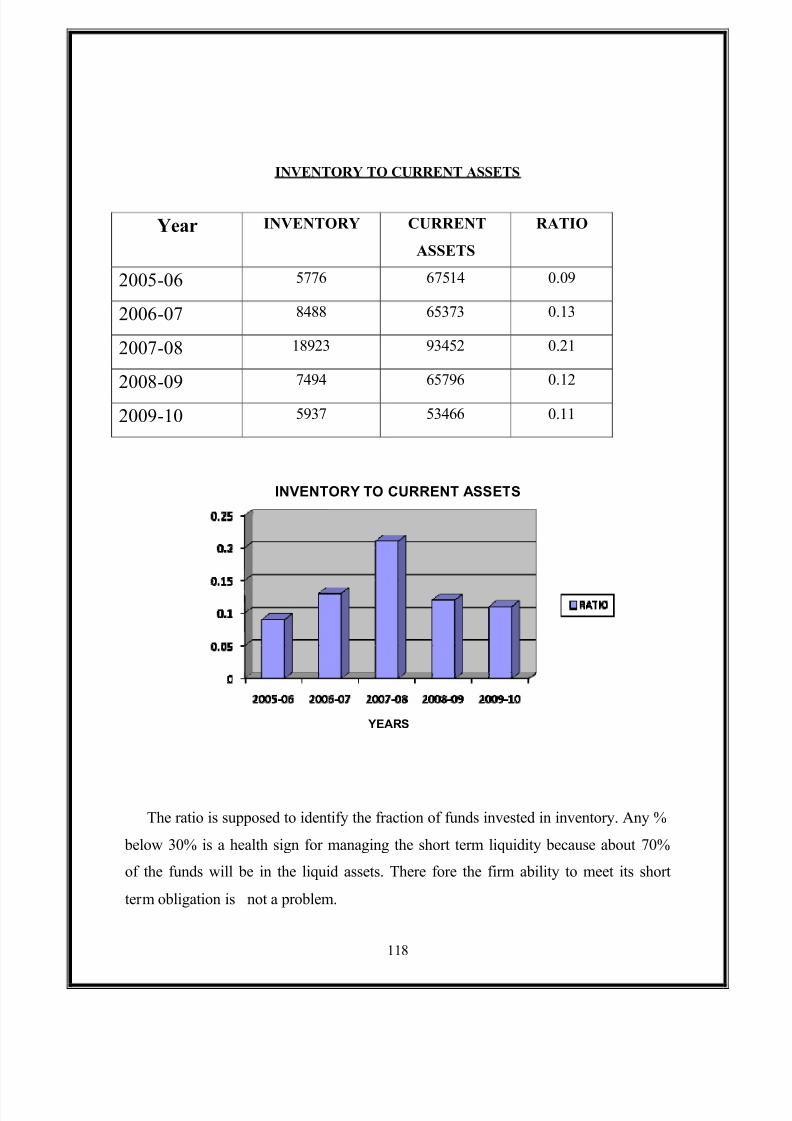
5/7/2018 Inventary Mgnt - slidepdf.com
http://slidepdf.com/reader/full/inventary-mgnt 118/126
118
INVENTORY TO CURRENT ASSETS
Year INVENTORY CURRENT
ASSETS
RATIO
2005-06 5776 67514 0.09
2006-07 8488 65373 0.13
2007-08 18923 93452 0.21
2
008
-09
7494 65796 0.12
2009-10 5937 53466 0.11
The ratio is supposed to identify the fraction of funds invested in inventory. Any %
below 30% is a health sign for managing the short term liquidity because about 70%
of the funds will be in the liquid assets. There fore the firm ability to meet its short
term obligation is not a problem.
YEARS
INVENTORY TO CURRENT ASSETS
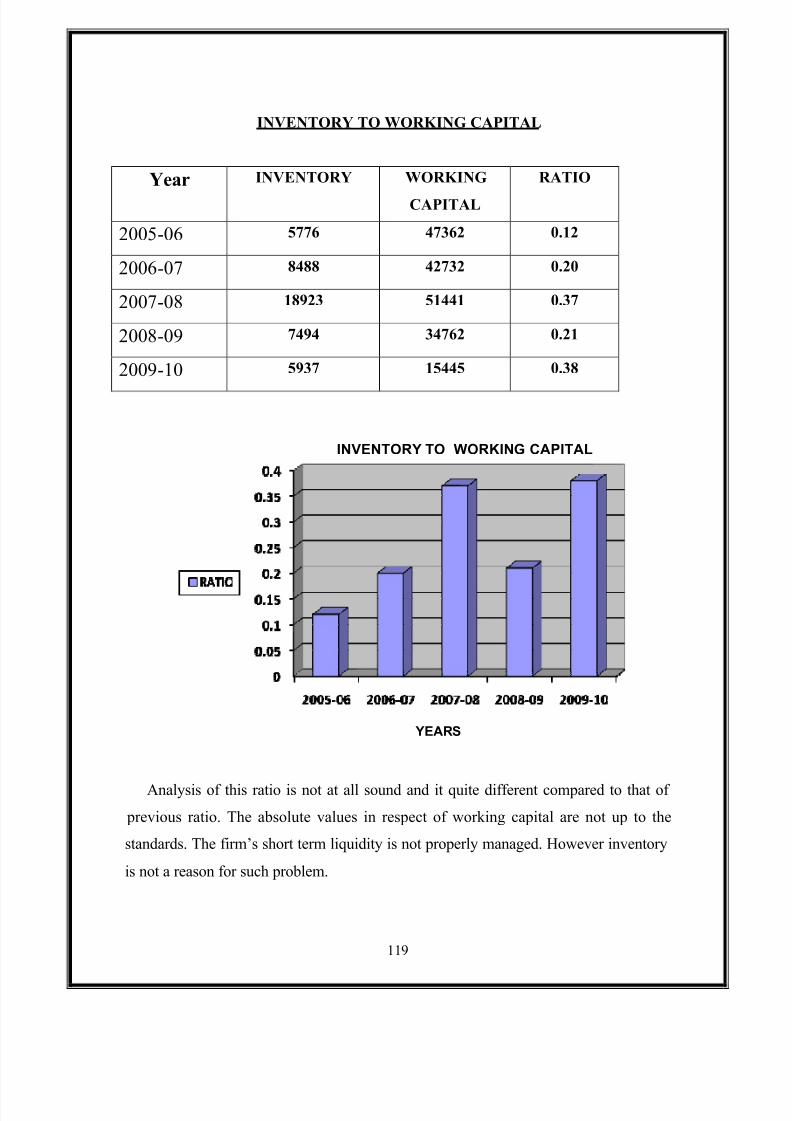
5/7/2018 Inventary Mgnt - slidepdf.com
http://slidepdf.com/reader/full/inventary-mgnt 119/126
119
INVENTORY TO WORKING CAPITAL
Year INVENTORY WORKING
CAPITAL
RATIO
2005-06 5776 47362 0.12
2006-07 8488 42732 0.20
2007-08 18923 51441 0.37
2008-09 7494 34762 0.21
2009-10 5937 15445 0.38
Analysis of this ratio is not at all sound and it quite different compared to that of
previous ratio. The absolute values in respect of working capital are not up to the
standards. The firm¶s short term liquidity is not properly managed. However inventory
is not a reason for such problem.
YEARS
INVENTORY TO WORKING CAPITAL
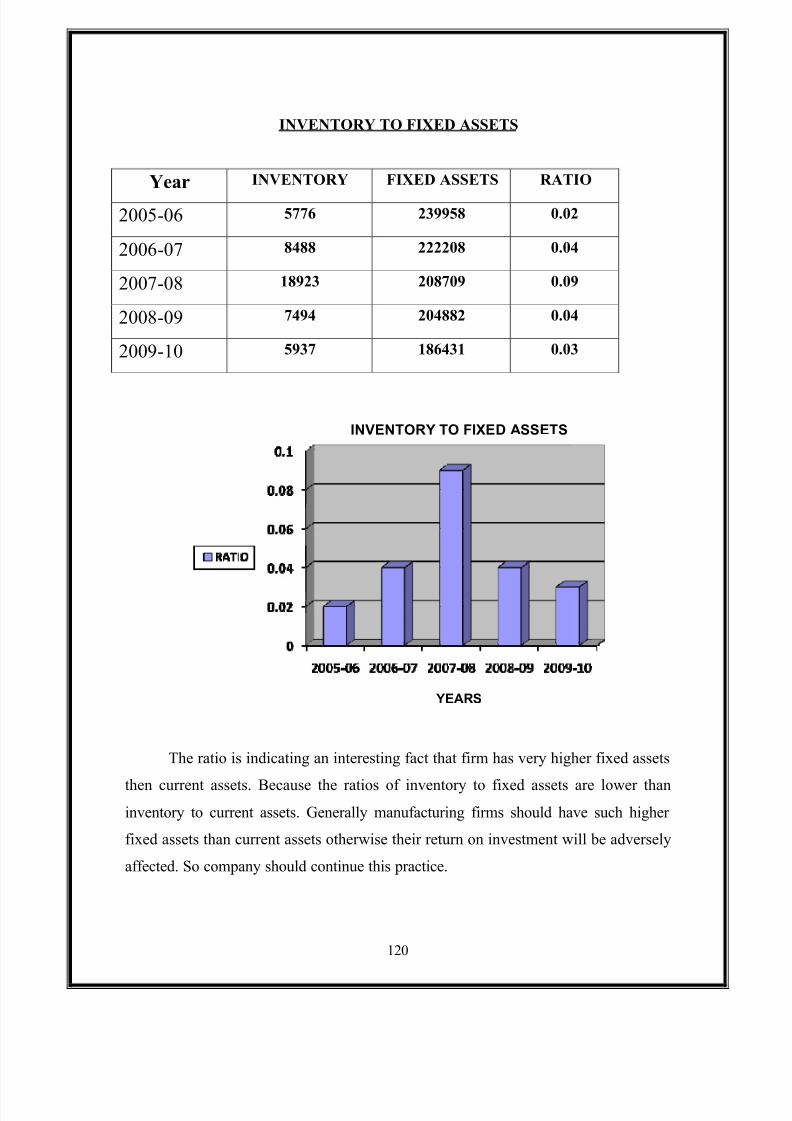
5/7/2018 Inventary Mgnt - slidepdf.com
http://slidepdf.com/reader/full/inventary-mgnt 120/126
120
INVENTORY TO FIXED ASSETS
Year INVENTORY FIXED ASSETS RATIO
2005-06 5776 239958 0.02
2006-07 8488 222208 0.04
2007-08 18923 208709 0.09
2008-09 7494 204882 0.04
2009-10 5937 186431 0.03
The ratio is indicating an interesting fact that firm has very higher fixed assets
then current assets. Because the ratios of inventory to fixed assets are lower than
inventory to current assets. Generally manufacturing firms should have such higher
fixed assets than current assets otherwise their return on investment will be adversely
affected. So company should continue this practice.
INVENTORY TO FIXED ASSETS
YEARS
5/7/2018 Inventary Mgnt - slidepdf.com
http://slidepdf.com/reader/full/inventary-mgnt 121/126
121
5/7/2018 Inventary Mgnt - slidepdf.com
http://slidepdf.com/reader/full/inventary-mgnt 122/126
122
FINDINGS, SUGGESTIONS AND CONCLUSION
FINDINGS:
1. The company is maintaining the inventory levels in SAP.
2. inventory level includes ABC, VED, FSN, RE-ORDER LEVEL,
WEIGHTED AVERAGE METHOD, etc
3. During the all years, the current ratio of the company is above the standard
norms of 2:1 the highest current ratio is raised in 3.69 in 1999-2000 to 9.21
in 2006-2008.
4. The inventory turn over, average age of raw material, average age of finished
goods inventory, index spare parts inventory, work ± in ± process etc., are in
decreasing and increasing order. These inventory levels should be in the
standard position for achieving the objectives, goals
5. The NFCL has so far under the marketing seed programming successfully
distributed more than 1.5 million tons of urea.
6. Fertilizer product comes under Essential Commodities Act .hence the
government of India fixes the market price.
7. NFCL obtained cheaper financial resources than previous years.
8. NFCL contains 1000 acres of ³green belt´.
5/7/2018 Inventary Mgnt - slidepdf.com
http://slidepdf.com/reader/full/inventary-mgnt 123/126
123
SUGGESTIONS
1. The process of receiving materials from vendors includes many steps which
is length the process this cause ever delays in receipts and payment
processing. This should be reduced which improve effective utilization of
the time which will leads to better time management.
2. The Inventory in this company is huge and very careful evaluation has to
be done in monitoring the inventory built up at store. As inventory account
from a major share in the total inventory from a major shares in total
inventory from a major shares in the total cost of project.
3. The dead stock items and items which are not consumed over a period of
time are held as unmoved stock in stores. These stocks may be disposed by
the prior permission of management.
The procedure followed by the stores department in disposing the dead
stock items is as follows:
1) Submission of statement regarding dead stock held in the stores to
management.
2) Ask for the recommendation of the concern department.
3) If management permits dispose it off otherwise keeps it is dead stock.
5/7/2018 Inventary Mgnt - slidepdf.com
http://slidepdf.com/reader/full/inventary-mgnt 124/126
124
CONCLUSION:
Out of the two basic raw materials only naphtha is stored in a storage tank of
NFCL. Natural gas is not stored. They are maintaining on average five days stock.
The holding costs for Naphtha is minimum in satisfactory.
Urea is transferred in to bagging plants where it is bagged and then sold or
stored in good owns outside Kakinada. In case it is stored in the silo, it is often a very
less quantity. Hence, product deterioration at plant is negligible.
Spare parts comprises of nearly 20% of total inventory value of NFCL. There
are certain insurance or critical spares. Critical spares. Critically which are required
for uninterrupted production even though the lead time is very less. Insurance spares
are those which are having more in value and takes 3-4 months to reach the site after
orders are placed from them. In order to avoid plant shut down these spares are stored
in need basis. There fore they are always kept in stores even though they are non-
moving. Their usage should be studied and disposed of to avoid unnecessary
investment in them for a long time.
The purchases department looks after an indigenous purchases and imports.
The vendors are selected after considering the quality of material, least cost, the
requirement and the urgency of the material. Therefore we find vendor selection
producer is in proper and correct.
The receiving section in the stores is responsible for accepting the material as
per the purchase order specification without any deviation. If any discrepancies are
found they will be sent back depending on the purchase order specifications.
The coding system of material facilities that easy identifications
monitoring, storing and issuing correct material in minimum time.
The Inventory control cell is responsible to ensure that the orders for the
materials are placed and also are issued on the basis of rate of consumption and the
lead time. We find that the recorder levels for some of items may be received based on
their usage.

5/7/2018 Inventary Mgnt - slidepdf.com
http://slidepdf.com/reader/full/inventary-mgnt 125/126
125
The SAP provides easy transactions of either the financial ledger or the
stores ledger jointly. It makes the inventory according in an easy way.
The just in the Time Inventory which is applied for spares (bearing bank
system) makes the NFCL to fulfill its needs when it is needed within 48hrs.
5/7/2018 Inventary Mgnt - slidepdf.com
http://slidepdf.com/reader/full/inventary-mgnt 126/126
126
BIBLIOGRAPHY
FINANCIAL MANAGEMENT : I.M.PANDEY
FINANCIAL MANAGEMENT : VAN HORN
FINANCIAL MANAGEMENT : KHAN & JAIN
PRINCIPLES AND PRACTICE
OF COST ACCOUNTING : N.K.PRASAD
PRODUCTION MANAGEMENT : E.F.BUFFA
ANNUAL REPORTS
MANUALS OF N.F.C.L