Embed Size (px)
Citation preview
Influence of the Circadian TimingSystem on TacrolimusPharmacokinetics andPharmacodynamics After KidneyTransplantationPere Fontova1,2,3, Helena Colom4*, Raül Rigo-Bonnin5,2, Lisanne N. van Merendonk1,2,3,Anna Vidal-Alabró1,2,3, Nuria Montero1,2,3, Edoardo Melilli 1,2,3, Maria Meneghini 1,2,3,Anna Manonelles1,2,3, Josep M. Cruzado1,2,3, Juan Torras1,2,3, Josep Maria Grinyó1,2,3,Oriol Bestard1,2,3 and Nuria Lloberas1,2,3*
1Nephrology Department, Bellvitge University Hospital, Barcelona, Spain, 2Nephrology and Transplantation, Institutd’Investigació Biomédica de Bellvitge, Barcelona, Spain, 3Department of Clinical Sciences, University of Barcelona, Barcelona,Spain, 4Biopharmaceutics and Pharmacokinetics Unit, Department of Pharmacy and Pharmaceutical Technology, School ofPharmacy, University of Barcelona, Barcelona, Spain, 5Biochemistry Department, Bellvitge University Hospital, Universitari deBellvitge, Institut d’Investigació Biomédica de Bellvitge, Barcelona, Spain
Introduction: Tacrolimus is the backbone immunosuppressant after solid organtransplantation. Tacrolimus has a narrow therapeutic window with large intra- andinter-patient pharmacokinetic variability leading to frequent over- and under-immunosuppression. While routine therapeutic drug monitoring (TDM) remains thestandard of care, tacrolimus pharmacokinetic variability may be influenced by circadianrhythms. Our aim was to analyze tacrolimus pharmacokinetic/pharmacodynamic profileson circadian rhythms comparing morning and night doses of a twice-daily tacrolimusformulation.
Methods: This is a post-hoc analysis from a clinical trial to study the area under curve(AUC) and the area under effect (AUE) profiles of calcineurin inhibition after tacrolimusadministration in twenty-five renal transplant patients. Over a period of 24 h, an intensivesampling (0, 0.5, 1, 1.5, 2, 3, 4, 6, 8, 12, 12.5, 13, 13.5, 14, 15, 20, and 24 h) was carriedout. Whole blood and intracellular tacrolimus concentrations and calcineurin activity weremeasured by UHPLC-MS/MS.
Results: Whole blood and intracellular AUC12–24 h and Cmax achieved after tacrolimusnight dose was significantly lower than after morning dose administration (AUC0–12 h) (p <0.001 for both compartments). AUE0–12 h and AUE12–24 h were not statistically differentafter morning and night doses. Total tacrolimus daily exposure (AUC0–24 h), in whole bloodand intracellular compartments, was over-estimated when assessed by doubling themorning AUC0–12 h data.
Edited by:Bente Jespersen,
Aarhus University Hospital, Denmark
Reviewed by:Muhammad Usman,
University of Veterinary and AnimalSciences, Pakistan
Troels K. Bergmann,University of Southern Denmark,
Denmark
*Correspondence:Nuria Lloberas
[email protected] Colom
Specialty section:This article was submitted toPharmaceutical Medicine and
Outcomes Research,a section of the journal
Frontiers in Pharmacology
Received: 30 November 2020Accepted: 05 February 2021Published: 17 March 2021
Citation:Fontova P, Colom H, Rigo-Bonnin R,van Merendonk LN, Vidal-Alabró A,Montero N, Melilli E, Meneghini M,
Manonelles A, Cruzado JM, Torras J,Grinyó JM, Bestard O and Lloberas N
(2021) Influence of the CircadianTiming System on Tacrolimus
Pharmacokinetics andPharmacodynamics AfterKidney Transplantation.
Front. Pharmacol. 12:636048.doi: 10.3389/fphar.2021.636048 Abbreviation: RRI, resource rdentification initiative.
Frontiers in Pharmacology | www.frontiersin.org March 2021 | Volume 12 | Article 6360481
ORIGINAL RESEARCHpublished: 17 March 2021
doi: 10.3389/fphar.2021.636048
Conclusion: The lower whole blood and intracellular tacrolimus concentrations after nightdose might be influenced by a distinct circadian clock. This significantly lower tacrolimusexposure after night dose was not translated into a significant reduction of thepharmacodynamic effect. Our study may provide conceptual bases for betterunderstanding the TDM of twice-daily tacrolimus formulation.
Keywords: tacrolimus, pharmacodynamic, pharmacokinetics, circadian rhythm, kidney transplantation,immunosuppression
INTRODUCTION
Tacrolimus (Tac) is the most commonly used immunosuppressorafter solid organ transplantation. After oral Tac administration,there is a large variability in the rate of absorption andbioavailability (Staatz and Tett, 2004; Hesselink et al., 2005).Therapeutic Tac doses are adjusted by monitoring the morningwhole blood trough concentrations (Ctrough), even though somecontroversies remain regarding the relationship between Ctrough
and clinical outcomes. The area under concentration-time curve(AUC) is the most accurate assessment of overall Tac exposurealthough it is difficult to implement in clinical daily practice(Wallemacq et al., 2009). Therefore, routine therapeutic drugmonitoring (TDM) of morning trough concentrations remains asthe standard of care. Data of correlations between Ctrough andAUC still remains a matter of discussion (Brunet et al., 2019).Marquet et al. (2018) reported that for twice-daily Tacformulation, the AUC0–12 h correlated better with C12 than C0.A poor correlation between Tac dosage and trough levels exists,thus further research of factors influencing Tac exposure isstrongly recommended (Hesselink et al., 2005; Wallemacqet al., 2009).
Immunosuppressive drugs have pharmacokinetic (PK)characteristics that may be influenced by circadian rhythms.These biological rhythms have been singled out as one of thecauses of intra- and inter-patient variability (Baraldo andFurlanut, 2006). Several studies have shown the influence ofcircadian rhythms in gastric pH, gastric emptying time,gastrointestinal transit time, cytochrome P450 (CYP) activityin the liver and renal function, among others (Labrecque andBélanger, 1991; Baraldo and Furlanut, 2006). Therefore, circadianrhythms affect processes of absorption, distribution, metabolism,and elimination of drugs and ultimately drug exposure andefficacy (Ohdo, 2007). In this context, differences in theP-glycoprotein (Pgp, encoded by ABCB1 gene) efflux pump orin the CYP3A activity, could also affect morning and night Tacexposures (Hoffmeyer et al., 2000; Baraldo and Furlanut, 2006;Andreu et al., 2017).
In recent years, several studies have investigated the impact ofcircadian rhythms in twice-daily Tac formulation but whetherthere is a constant effect of Tac throughout a 24 h period remainsto be concluded. Prado-Velasco et al. (2020) developed the firstPKmodel-based study that supports the relationship between Tacconcentration patterns and the circadian modulation of clearanceand absorption suggesting that Tac intra-patient variability maybe partially explained by circadian rhythms in Tac absorption andmetabolism. However, most studies on twice-daily Tac
formulation analyzed a low number of transplant patients,employed different Tac determination methodologies andfasting conditions (Min et al., 1996; Tada et al., 2003; Iwahoriet al., 2005; Park et al., 2007; Satoh et al., 2008; Gustavsen et al.,2020). Notably, these studies have only evaluated Tac exposureafter the morning dose during the 12 h intervals between the twodaily doses (AUC0–12 h), but differences between the two AUCs(AUC0–12 h and AUC12–24 h) still need to be studied morecomprehensively (Min et al., 1996; Tada et al., 2003; Iwahoriet al., 2005; Park et al., 2007; Gustavsen et al., 2020). Despitevarious reports analyzing the PK differences between day- andnight-time of twice-daily Tac administration, results continue tobe controversial. Furthermore, the effect of circadian rhythms onintracellular Tac concentrations and, ultimately, on differentcalcineurin (CN) activity, has not been fully investigated yet.The intracellular Tac concentrations on its target site of actioncould better reflect Tac exposure and it has been correlated withclinical outcomes (Capron et al., 2012; Han et al., 2016; Franckeet al., 2020).
Our aim was to investigate whether the influence of circadiantiming system on whole blood following Tac administration oftwice-daily Tac formulations have an impact on intracellularlymphocyte Tac concentrations and on its pharmacodynamics(PD) (measured as CN activity inhibition). For this purpose, PK/PD analysis comparing morning and night Tac AUCs in renaltransplant patients was performed.
METHODS
Study DesignA post-hoc analysis of a prospective, non-randomized clinical trialwas carried out at the Kidney Transplant Unit of BellvitgeUniversity Hospital (clinicalTrials.gov NCT02961608)(Fontova et al., 2021). This clinical trial was conducted inaccordance with the Declaration of Helsinki and with the localethics committee. The study involved 25 adult recipients whoreceived a kidney transplant at least 6 months before theinclusion. Main exclusion criteria for the PK/PD analysisincluded patients with severe gastrointestinal disorders orcurrent infections and patients receiving concomitant drugsinteracting with CYP3A enzymes. Recipients using twice-dailyTac formulation (Prograf® or Adoport®), with Ctrough between 5and 10 ng/ml and who signed informed consent were recruited inthis study. No changes of Tac doses at least for 2 weeks before thePK/PD analysis was mandatory. During the period of 24 h, PKand PD analysis was conducted by an intensive sampling on the
Frontiers in Pharmacology | www.frontiersin.org March 2021 | Volume 12 | Article 6360482
Fontova et al. Circadian Rhythms Influencing Tacrolimus Pharmacokinetic/Pharmacodynamic
following time-points: Pre-dose and at 0.5, 1, 1.5, 2, 3, 4, 6, 8, and12 following morning Tac dose and 12, 12.5, 13, 13.5, 14, 15, 20,and 24 h following night Tac dose. The night sampling wasreduced according to the nursery blood draw logistics. Tacdoses were carried out at least 1 h before and 2 h after meals,every 12 h (at 8:00 am and 08:00 pm) and all patients received thesame Mediterranean diet (breakfast: 9:30 am, lunch: 2:00 pm,snack: 5:00 pm, dinner: 09:00 pm).
Tacrolimus Measurement andPharmacokinetic Data AnalysisThe measurement of Tac concentrations in whole blood andintracellular in peripheral blood mononuclear cells (PBMCs) wasperformed using ultra-high-performance liquid chromatographycoupled with tandem mass-spectrometry (UHPLC-MS/MS;Acquity®-TQD® mass spectrometer) using previously validatedmethods by our group (Rigo-Bonnin et al., 2015; van Merendonket al., 2020). For intracellular Tac measurement, PBMCs isolationfrom whole blood was carried out using Ficoll density gradient.Thereafter, these PBMCs were lysed with a hypotonic lysis buffer.All Tac determinations showed concentrations higher than thelimit of quantification either in whole blood or in intracellularcompartments (0.65 and 0.126 ng/ml, respectively).
A non-compartmental PK analysis was carried out to estimatethe most relevant exposure parameters from the individualconcentration-time profiles obtained at steady-state conditions.Both the whole blood and intracellular concentration-timeprofiles were analyzed by using Phoenix-WinNonlin 64 v8.2.The parameters calculated were: trough concentration values(Ctrough), denoted as C0, trough concentration before morningdose; C12, trough concentration before night dose, C24, troughconcentration 12 h after night dose; Cmax, peak concentrationafter each Tac dose; Tmax, time to reach Cmax; AUCs, areas underthe concentration-time curves from 0 to 12 h time intervals aftereach morning (AUC0–12 h) and night (AUC12–24 h) dosescalculated by the trapezoidal rule; Peak-trough fluctuationindex (PTF) calculated as % PTF � 100 × [(Cmax − Ctrough)/Caverage] where Caverage, was estimated from the ratios AUC0–12/τor AUC12–24/τ where τ � 12 h; Swing fluctuation index (SFI)estimated as % SFI � 100 × [(Cmax − Ctrough)/Ctrough]. Oralclearance values (CL/F) were also estimated from the ratiosDose/AUC.
Calcineurin Activity Measurement andPharmacodynamic AnalysisThe PD effect of Tac was based on measurements of CN activityin PBMCs using a method previously validated by our group(Fontova et al., 2019). Briefly, once PBMCs were isolated andlysed with the hypotonic buffer used for intracellular Tacdetermination, the lysate was incubated for 15 min at 30°Cwith an exogenous phosphorylated peptide (RIIp). Thecalcium-dependent CN activity dephosphorylates RIIp, andafter solid-phase extraction, dephosphorylated peptide (RII)and its corresponding internal-standard (RII-IS, isotope-labelled RII) were determined by UHPLC-MS/MS. All the
extractions showed RII levels higher than the limit ofquantification (0.04 µM).
Distinct PD parameters were calculated from the CN activity-time profiles at steady-state conditions in PBMCs by usingPhoenix-WinNonlin 64 v8.2. The parameters calculated were:trough CN activity (Itrough) denoted as, I0, trough CN activitybefore morning dose; I12, trough CN activity before night dose;I24, trough CN activity 12 h after night dose; Imin, minimuminhibition of CN activity, Inadir, maximum CN inhibition; Tnadir,time to achieve Inadir; AUEs, areas under the effect-time profilesfrom 0 to 12 h time intervals after morning (AUE0–12 h) and night(AUE12–24 h) doses estimated using the trapezoidal rule. TheAUEs were evaluated from the percentage of inhibition curvesconsidering either the Imin and Inadir from the 24 h time intervalperiod as baseline following the Eqs. 1, 2 respectively:
% InhibitionImin � [(Imin − Ix)Imin
] p 100 (1)
% InhibitionInadir � [(Ix − Inadir)Inadir
] p 100 (2)
where Ix was the CN activity at each experimental time.
GenotypingGenomic DNA was extracted from a peripheral whole-bloodsample using Maxwell RSC® (Promega Corporation, Sydney,Australia) and was stored at −80°C. Genotyping of theCYP3A5*3 G > A (rs776746), CYP3A4*22 C > T (rs35599367)and ABCB1 3435C > T (rs1045642) polymorphisms (SNPs) wascarried out using TaqMan SNP Genotyping Assay (AppliedBiosystems, Foster City, CA, United States) in 384-well platesthat included positive and negative controls. Real-time PCRs werecarried out on the 7900HT Fast Real-time PCR System, AppliedBiosystems (Thermo Fisher Scientific, Waltham, MA,United States), following standard recommendations. Briefly,0.5 µl of each probe was mixed with 5 µl iTaq UniversalProbes Supermix, 1 µl genomic DNA (10–20 ng/μl) and 3.5 µlof DNAse free water. The Real-time conditions were heat to 50°Cfor 2°min and 95°C for 10 min in the thermal cycler. This was thenfollowed by 40 cycles of denaturization at 95°C for 15°s andannealing/extending at 60°C for 1 min. Samples were genotypedin CCiT-UB (Centres Científics i Tecnològics) at University ofBarcelona, Campus Bellvitge.
Statistical AnalysisContinuous variables derived from intracellular and whole bloodTac concentration-time and CN activity-time profiles wereexpressed as geometric mean [95% geometric mean intervalconfidence]. Tac exposure PK parameters and CN activity PDparameters estimated after the morning and night doses werecompared by means of a two-sided paired t-test of natural log-transformed values. In contrast, Wilcoxon tests were performedfor non-parametric variables such as Tmax and Tnadir.Correlations between the PD and PD parameters wereevaluated by the parametric Pearson’s correlation test. Finally,demographic and non-continuous variables were described asmedian [interquartile range]. Statistical significance was set at
Frontiers in Pharmacology | www.frontiersin.org March 2021 | Volume 12 | Article 6360483
Fontova et al. Circadian Rhythms Influencing Tacrolimus Pharmacokinetic/Pharmacodynamic
α � 0.05. The statistical packages IBM SPSS v23 and GraphpadPrism 6.0 were used for the statistical analyses.
RESULTS
Demographic CharacteristicsTwenty-five renal transplant recipients from Bellvitge UniversityHospital were included in the clinical trial between 2016 and2018. Patients received an immunosuppressive maintenancetherapy consisting of twice-daily Tac with mycophenolate andcorticosteroids. Three patients with asymmetric morning andnight Tac doses were excluded from this PK/PD analysis. Thedemographic, CYP3A and ABCB1 pharmacogenetics and clinicalcharacteristics of the twenty-two patients are shown in Table 1.
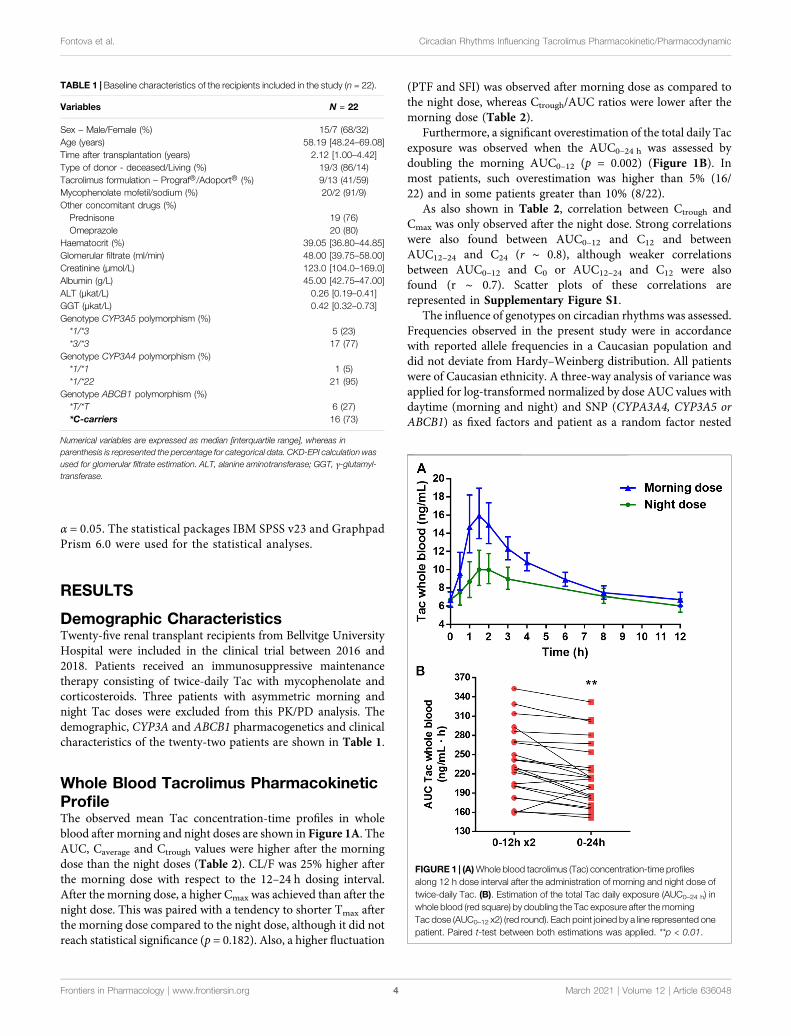
Whole Blood Tacrolimus PharmacokineticProfileThe observed mean Tac concentration-time profiles in wholeblood after morning and night doses are shown in Figure 1A. TheAUC, Caverage and Ctrough values were higher after the morningdose than the night doses (Table 2). CL/F was 25% higher afterthe morning dose with respect to the 12–24 h dosing interval.After the morning dose, a higher Cmax was achieved than after thenight dose. This was paired with a tendency to shorter Tmax afterthe morning dose compared to the night dose, although it did notreach statistical significance (p � 0.182). Also, a higher fluctuation
(PTF and SFI) was observed after morning dose as compared tothe night dose, whereas Ctrough/AUC ratios were lower after themorning dose (Table 2).
Furthermore, a significant overestimation of the total daily Tacexposure was observed when the AUC0–24 h was assessed bydoubling the morning AUC0–12 (p � 0.002) (Figure 1B). Inmost patients, such overestimation was higher than 5% (16/22) and in some patients greater than 10% (8/22).
As also shown in Table 2, correlation between Ctrough andCmax was only observed after the night dose. Strong correlationswere also found between AUC0–12 and C12 and betweenAUC12–24 and C24 (r ∼ 0.8), although weaker correlationsbetween AUC0–12 and C0 or AUC12–24 and C12 were alsofound (r ∼ 0.7). Scatter plots of these correlations arerepresented in Supplementary Figure S1.
The influence of genotypes on circadian rhythms was assessed.Frequencies observed in the present study were in accordancewith reported allele frequencies in a Caucasian population anddid not deviate from Hardy–Weinberg distribution. All patientswere of Caucasian ethnicity. A three-way analysis of variance wasapplied for log-transformed normalized by dose AUC values withdaytime (morning and night) and SNP (CYPA3A4, CYP3A5 orABCB1) as fixed factors and patient as a random factor nested
TABLE 1 | Baseline characteristics of the recipients included in the study (n � 22).
Variables N = 22
Sex – Male/Female (%) 15/7 (68/32)Age (years) 58.19 [48.24–69.08]Time after transplantation (years) 2.12 [1.00–4.42]Type of donor - deceased/Living (%) 19/3 (86/14)Tacrolimus formulation – Prograf®/Adoport® (%) 9/13 (41/59)Mycophenolate mofetil/sodium (%) 20/2 (91/9)Other concomitant drugs (%)Prednisone 19 (76)Omeprazole 20 (80)
Haematocrit (%) 39.05 [36.80–44.85]Glomerular filtrate (ml/min) 48.00 [39.75–58.00]Creatinine (µmol/L) 123.0 [104.0–169.0]Albumin (g/L) 45.00 [42.75–47.00]ALT (µkat/L) 0.26 [0.19–0.41]GGT (µkat/L) 0.42 [0.32–0.73]Genotype CYP3A5 polymorphism (%)*1/*3 5 (23)*3/*3 17 (77)
Genotype CYP3A4 polymorphism (%)*1/*1 1 (5)*1/*22 21 (95)
Genotype ABCB1 polymorphism (%)*T/*T 6 (27)*C-carriers 16 (73)
Numerical variables are expressed as median [interquartile range], whereas inparenthesis is represented the percentage for categorical data. CKD-EPI calculation wasused for glomerular filtrate estimation. ALT, alanine aminotransferase; GGT, γ-glutamyl-transferase.
FIGURE 1 | (A)Whole blood tacrolimus (Tac) concentration-time profilesalong 12 h dose interval after the administration of morning and night dose oftwice-daily Tac. (B). Estimation of the total Tac daily exposure (AUC0–24 h) inwhole blood (red square) by doubling the Tac exposure after themorningTac dose (AUC0–12 x2) (red round). Each point joined by a line represented onepatient. Paired t-test between both estimations was applied. **p < 0.01.
Frontiers in Pharmacology | www.frontiersin.org March 2021 | Volume 12 | Article 6360484
Fontova et al. Circadian Rhythms Influencing Tacrolimus Pharmacokinetic/Pharmacodynamic
within SNP. Statistically significant differences were always foundbetween daytimes (p < 0.001), CYP3A5 SNP (p < 0.001), but notbetween ABCB1 (p � 0.533) and CYP3A4 SNPs (p � 0.324).
Therefore, in this line, CYP3A5 1*/3* patients showed lowerAUC/Dose than CYP3A5 3*/3* (p < 0.001) in both morningand night dose.
TABLE 2 |Comparison of tacrolimus (Tac) pharmacokinetic variables in whole blood and their corresponding correlations after morning Tac dose (0–12 h) and after night Tacdose (12–24 h) of twice-daily Tac formulation.
Variables Morning dose (0–12 h) Night dose (12–24 h) p
Ctrough (ng/ml) 6.72 [6.00–7.52] 6.03 [5.34–6.82] 0.047a
Cmax (ng/ml) 18.20 [15.58–21.25] 11.12 [9.37–13.20] <0.001aTmax (h) 1.52 [1.14–1.98] 1.87 [1.03–2.81] 0.182b
AUC (ng·h/ml) 115.4 [104.2–127.9] 92.4 [81.5–104.8] <0.001aCtrough/AUC 0.058 [0.054–0.062] 0.065 [0.061–0.070] 0.014a
PTF (%) 112.3 [92.3–136.6] 40.6 [22.4–73.4] 0.006a
SFI (%) 161.6 [123.8–211.1] 46.5 [24.4–88.7] 0.003a
Caverage (ng/ml) 9.62 [8.68–10.66] 7.70 [6.79–8.73] <0.001aCL/F (mg·L/ng·h) 15.74 [12.44–19.91] 19.66 [15.13–25.54] <0.001aCorrelationsc Morning dose (0–12 h) Night dose (12–24 h)
R P R pC0 vs AUC0–12 h 0.696 <0.001 — —
C12 vs AUC0–12 h 0.810 <0.001 — —
C12 vs AUC12–24 h — — 0.748 <0.001C24 vs AUC12–24 h — — 0.856 <0.001C0 vs Cmax 0–12 h 0.341 0.120 — —
C12 vs Cmax 12–24 h — — 0.711 <0.001aPaired t-test.bWilcoxon-test.cPearson’s correlation test.Data is represented as geometric mean [95% CI] unless Tmax, that is expressed as median [interquartile range]. Ctrough, trough concentration corresponding at time 12 h for morning doseand at time 24 h for night dose; Cmax, maximum peak Tac concentration; Tmax, time to reach Cmax; AUC, area under the concentration-time curve from each 12 h dose interval; PTF, peak-trough fluctuation index defined as [(Cmax − Ctrough)/Caverage]; SFI, swing fluctuation index defined as [(Cmax − Ctrough)/Ctrough]; Caverage, average Tac concentration from each 12 h doseinterval; CL/F, clearance/bioavailability ratio; C0, morning pre-dose concentration at time 0 h; C12, night pre-dose concentration at time 12 h; C24, Tac concentration at time 24 h;AUC0–12 h, area under the concentration-time curve after the morning dose from 0 to 12 h; AUC12–24 h, area under the concentration-time curve after the night dose from 12 to 24 h.
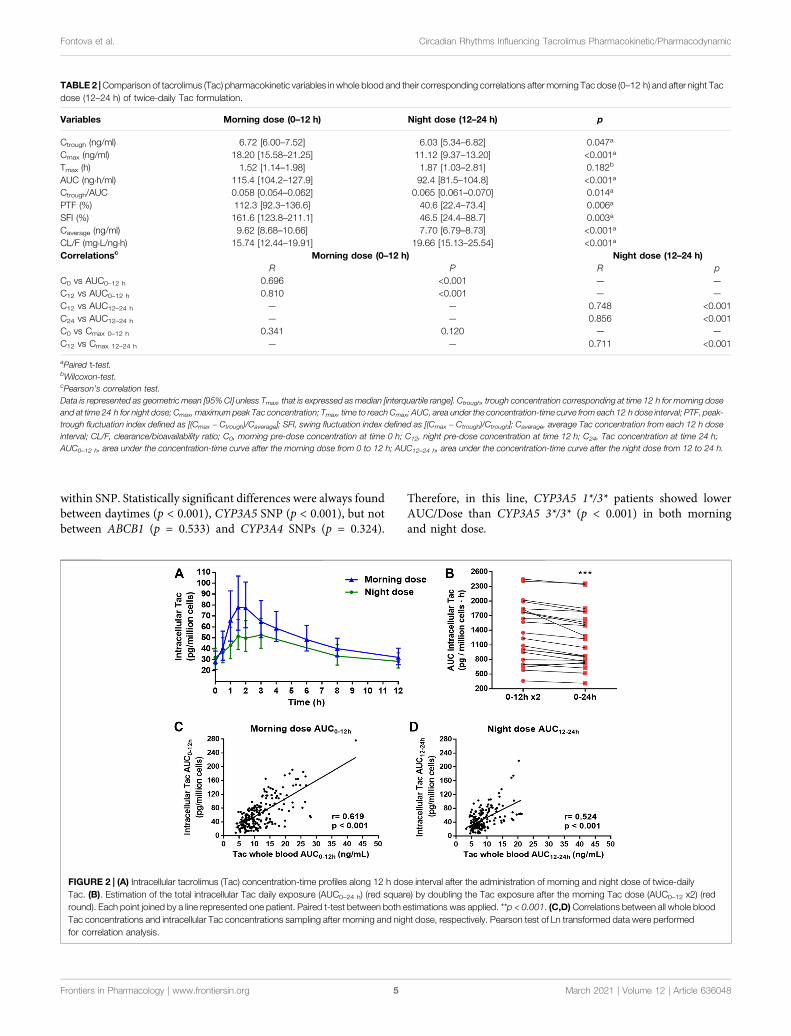
FIGURE 2 | (A) Intracellular tacrolimus (Tac) concentration-time profiles along 12 h dose interval after the administration of morning and night dose of twice-dailyTac. (B). Estimation of the total intracellular Tac daily exposure (AUC0–24 h) (red square) by doubling the Tac exposure after the morning Tac dose (AUC0–12 x2) (redround). Each point joined by a line represented one patient. Paired t-test between both estimations was applied. **p < 0.001. (C,D) Correlations between all whole bloodTac concentrations and intracellular Tac concentrations sampling after morning and night dose, respectively. Pearson test of Ln transformed data were performedfor correlation analysis.
Frontiers in Pharmacology | www.frontiersin.org March 2021 | Volume 12 | Article 6360485
Fontova et al. Circadian Rhythms Influencing Tacrolimus Pharmacokinetic/Pharmacodynamic
Intracellular Tacrolimus ProfilePK profiles of intracellular Tac measured in PBMCs werecomparable to whole blood PK profiles (Figure 2A). Onceagain, Tac exposures given by AUCs, Caverage and Ctrough werehigher in the morning when compared to the night dosinginterval (Table 3). Similarly, to whole blood, after the morningTac dose, a higher intracellular Cmax was observed compared tothe night dose. Meanwhile, no statistically significant differenceswere found between Tmax values, nevertheless there was atendency towards greater values at night with respect to theday-time dose (Table 3). This was in accordance with a morefluctuating profile (PTF and SFI values) after the morning dose incontrast to the night dose. No differences regarding, Ctrough/AUCratios were found between both time settings (morning andnight) although numerically higher values were observed afternight dose (p � 0.085).
As in whole blood, the estimation of AUC0–24 h by doublingthe morning AUC0–12 h, was also overestimated in theintracellular compartment, although more patients displayeddifferences higher than 10% (13/22) (Figure 2B).
In contrast to whole blood, a significant correlation betweenCtrough and Cmax after morning and night doses was observed inthe intracellular compartment (Table 3). Stronger correlationsbetween all possible combinations between troughconcentrations and AUC values were observed compared towhole blood (r ∼ 0.9–0.95). The scatter plots representingthese correlations are showed in Supplementary Figure S2. Inaddition, significant positive correlations were obtained betweenwhole blood Tac concentrations and intracellular Tacconcentrations either following morning dose or night dose(Figures 2C,D).
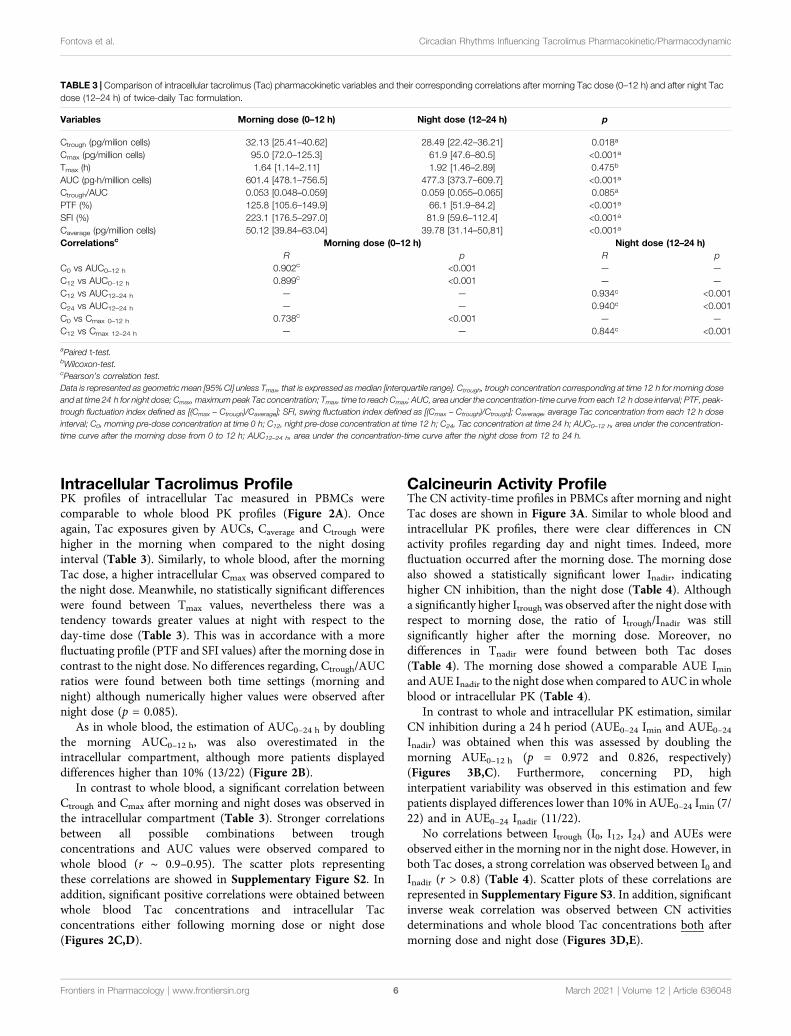
Calcineurin Activity ProfileThe CN activity-time profiles in PBMCs after morning and nightTac doses are shown in Figure 3A. Similar to whole blood andintracellular PK profiles, there were clear differences in CNactivity profiles regarding day and night times. Indeed, morefluctuation occurred after the morning dose. The morning dosealso showed a statistically significant lower Inadir, indicatinghigher CN inhibition, than the night dose (Table 4). Althougha significantly higher Itrough was observed after the night dose withrespect to morning dose, the ratio of Itrough/Inadir was stillsignificantly higher after the morning dose. Moreover, nodifferences in Tnadir were found between both Tac doses(Table 4). The morning dose showed a comparable AUE Imin
and AUE Inadir to the night dose when compared to AUC in wholeblood or intracellular PK (Table 4).
In contrast to whole and intracellular PK estimation, similarCN inhibition during a 24 h period (AUE0–24 Imin and AUE0–24Inadir) was obtained when this was assessed by doubling themorning AUE0–12 h (p � 0.972 and 0.826, respectively)(Figures 3B,C). Furthermore, concerning PD, highinterpatient variability was observed in this estimation and fewpatients displayed differences lower than 10% in AUE0–24 Imin (7/22) and in AUE0–24 Inadir (11/22).
No correlations between Itrough (I0, I12, I24) and AUEs wereobserved either in the morning nor in the night dose. However, inboth Tac doses, a strong correlation was observed between I0 andInadir (r > 0.8) (Table 4). Scatter plots of these correlations arerepresented in Supplementary Figure S3. In addition, significantinverse weak correlation was observed between CN activitiesdeterminations and whole blood Tac concentrations both aftermorning dose and night dose (Figures 3D,E).
TABLE 3 | Comparison of intracellular tacrolimus (Tac) pharmacokinetic variables and their corresponding correlations after morning Tac dose (0–12 h) and after night Tacdose (12–24 h) of twice-daily Tac formulation.
Variables Morning dose (0–12 h) Night dose (12–24 h) p
Ctrough (pg/milion cells) 32.13 [25.41–40.62] 28.49 [22.42–36.21] 0.018a
Cmax (pg/million cells) 95.0 [72.0–125.3] 61.9 [47.6–80.5] <0.001aTmax (h) 1.64 [1.14–2.11] 1.92 [1.46–2.89] 0.475b
AUC (pg·h/million cells) 601.4 [478.1–756.5] 477.3 [373.7–609.7] <0.001aCtrough/AUC 0.053 [0.048–0.059] 0.059 [0.055–0.065] 0.085a
PTF (%) 125.8 [105.6–149.9] 66.1 [51.9–84.2] <0.001aSFI (%) 223.1 [176.5–297.0] 81.9 [59.6–112.4] <0.001aCaverage (pg/million cells) 50.12 [39.84–63.04] 39.78 [31.14–50,81] <0.001aCorrelationsc Morning dose (0–12 h) Night dose (12–24 h)
R p R pC0 vs AUC0–12 h 0.902c <0.001 — —
C12 vs AUC0–12 h 0.899c <0.001 — —
C12 vs AUC12–24 h — — 0.934c <0.001C24 vs AUC12–24 h — — 0.940c <0.001C0 vs Cmax 0–12 h 0.738c <0.001 — —
C12 vs Cmax 12–24 h — — 0.844c <0.001aPaired t-test.bWilcoxon-test.cPearson’s correlation test.Data is represented as geometric mean [95% CI] unless Tmax, that is expressed as median [interquartile range]. Ctrough, trough concentration corresponding at time 12 h for morning doseand at time 24 h for night dose; Cmax, maximum peak Tac concentration; Tmax, time to reach Cmax; AUC, area under the concentration-time curve from each 12 h dose interval; PTF, peak-trough fluctuation index defined as [(Cmax − Ctrough)/Caverage]; SFI, swing fluctuation index defined as [(Cmax − Ctrough)/Ctrough]; Caverage, average Tac concentration from each 12 h doseinterval; C0, morning pre-dose concentration at time 0 h; C12, night pre-dose concentration at time 12 h; C24, Tac concentration at time 24 h; AUC0–12 h, area under the concentration-time curve after the morning dose from 0 to 12 h; AUC12–24 h, area under the concentration-time curve after the night dose from 12 to 24 h.
Frontiers in Pharmacology | www.frontiersin.org March 2021 | Volume 12 | Article 6360486
Fontova et al. Circadian Rhythms Influencing Tacrolimus Pharmacokinetic/Pharmacodynamic
DISCUSSION
To the best of our knowledge, this is the first study thatsimultaneously evaluates the 24 h time variation in the
pharmacokinetics at steady-state conditions of intracellularand whole blood Tac, after twice-daily administration. Whilethe impact on circadian rhythms on whole blood Tac haspreviously been documented (Min et al., 1996; Tada et al.,
FIGURE 3 | (A) Pharmacodynamic calcineurin (CN) activity-time profiles along 12 h dose interval after the administration of morning and night dose of twice-dailyTac. (B) Estimation of the total daily CN inhibition using Imin as baseline (AUE0–24 h Imin) (red square) by doubling the inhibition after the morning Tac dose (AUE0–12 Imin x2)(red round) and (C), estimating the inhibition using Inadir as baseline, AUE0–24 h Inadir (red square) and AUE0–12 h Inadir x2 (red round). Each point joined by a line representedone patient. Paired t-test between both estimations was applied. (D,E) Correlations between all whole blood Tac concentrations and CN activities sampling aftermorning and night dose, respectively. Pearson test of Ln transformed data were performed for correlation analysis.
TABLE 4 |Comparison of pharmacodynamic variablesmeasured as calcineurin (CN) activity and their corresponding correlations after morning tacrolimus dose (0–12 h) andafter night Tac dose (12–24 h) of twice-daily tacrolimus formulation.
Variables Morning dose (0–12 h) Night dose (12–24 h) p
Itrough (pmol RII/min·mg prot) 296.0 [277.1–316.3] 285.8 [266.1–307.0] 0.040a
Inadir (pmol RII/min·mg prot) 220.1 [204.3–237.2] 238.7 [221.7–257.0] 0.002a
Tnadir (h) 2.16 [1.25–3.49] 2.76 [1.47–4.26] 0.656b
Itrough/Inadir 1.29 [1.25–1.34] 1.20 [1.15–1.24] 0.002a
AUE Imin (pmol RII·h/min·mg prot) 127.7 [112.3–145.2] 120.1 [99.1–145.6] 0.572a
AUE Inadir (pmol RII·h/min·mg prot) 262.4 [216.2–318.4] 245.9 [190.6–317.3] 0.449a
Correlationsc Morning dose (0–12 h) Night dose (12–24 h)R p R P
I0 vs AUE0–12 h Imin −0.034 0.881 — —
I12 vs AUE0–12 h Imin 0.115 0.609 — —
I12 vs AUE12–24 h Imin — — −0.001 0.968I24 vs AUE12–24 h Imin — — −0.255 0.252I0 vs AUE0–12 h Inadir −0.134 0.552 - -I12 vs AUE0–12 h Inadir 0.125 0.579 - -I12 vs AUE12–24 h Inadir — — 0.158 0.491I24 vs AUE12–24 h Inadir — — 0.252 0.257I0 vs Inadir 0–12 h 0.899 <0.001I12 vs Inadir 12–24 h 0.818 <0.001aPaired t-test.bWilcoxon test.cPearson’s correlation test.Data is represented as geometric mean [95% CI] unless Tnadir that is expressed as median [interquartile range]. Itrough, trough CN activity at time 12 h for morning dose and at time 24 h fornight dose; Inadir, maximum inhibition of CN activity; Tnadir, time to reach Inadir; AUE Imin, area under the effect-time curve of CN inhibition from each 12 h dose interval using Imin as baseline;Imin, minimum CN inhibition observed along 24 h interval; AUE Inadir, area under the effect-time curve of CN inhibition from each 12 h dose interval using the Inadir observed along 24 hinterval as baseline; I0, morning pre-dose CN activity at time 0 h; C12, night pre-dose CN activity at time 12 h; C24, CN activity concentration at time 24 h; AUE0–12 h, area under the effect-time curve after the morning dose from 0 to 12 h; AUE12–24 h, area under the effect-time after the night dose from 12 to 24 h.
Frontiers in Pharmacology | www.frontiersin.org March 2021 | Volume 12 | Article 6360487
Fontova et al. Circadian Rhythms Influencing Tacrolimus Pharmacokinetic/Pharmacodynamic
2003; Iwahori et al., 2005; Park et al., 2007; Satoh et al., 2008;Gustavsen et al., 2020), data regarding intracellular Tac has yet tobe reported. Here, we show the influence of circadian rhythms onintracellular PK after twice-daily Tac administration and theircorresponding PD profiles in kidney transplant recipients.Notably, we also describe the differences in PK and PDprofiles between the morning and night administration dosesin a standard immunosuppressive regimen based on a twice-dailyTac formulation.
Our results show different whole blood PK profiles betweenthe morning and the night Tac doses. Achieved exposures (AUC)following the night dose were approximately 25% lower thanthose achieved following the morning dose. Fluctuations of wholeblood concentrations were also much lower during the 12–24 hdose intervals rather than after the morning dose. These resultssuggest 24 h variations in both the extent and rate of absorptiondue to physiological rhythms. Tac is a highly lipophilic drug withpoor aqueous solubility. This is one of the factors contributing toits low and variable oral bioavailability, but also cytochrome P450(CYP3A) mediated metabolism or multidrug-resistanceassociated protein-mediated efflux should be considered.Indeed, a day-dependent variability has been reported forCYP3A gene expression and mediated metabolism of otherseveral drugs (Martin et al., 2003; Tomalik-Scharte et al.,2014). In this context, the lower Tac exposure after night dosecould be due to an enhanced CYP3A enzymatic activity duringnight-time compared to day-time. This could lead to higher pre-systemic loss of Tac with lower fraction reaching the bloodstreamand, in turn, to higher CL/F values at the 12–24 h dose intervalwith respect to the morning drug intake (19.66 and 15.74 mg·l/ng·h, respectively). In our study we found lower doses in patientswho expressed CYP3Ap3/p3 SNP compared with expressors ofCYP3Ap1/p3. However, no differences were observed when AUC/Dose was compared for each individual SNP between morningand night dose. The study should be performed with a largersample size to describe the impact of genotypes on circadianrhythms. Preclinical studies in different murine models(Murakami et al., 2008; Okyar et al., 2019) and in non-humans primates (Iwasaki et al., 2015) have also shown theinfluence of circadian variation on the expression and activityof the Tac extrusion transporter Pgp, in the intestine due to itsregulation by Clock genes. A higher Pgp activity during the nightperiod also may have contributed to the differences betweenmorning and night Tac administrations observed. Tamura et al.(2003) reported a Tac permeability two times greater in the upperpart of the intestine (jejunum) than in the ileum of rats. Bycontrast, Pgp activity was dominant in ileum compared to thejejunum. Considering Tac twice-daily as an immediate releaseformulation, major Tac uptake would be expected in the jejunum.At this point, circadian changes on CYP3A enzymatic activitywould play a more important key role in the different exposuresobserved between morning and night administrations than Pgpextrusion. Our results are in line with those of Prado-Velascoet al. (2020) in the pediatric population describing the effect ofcircadian rhythms on CL.
We also found significantly lower fluctuation values in wholeblood Tac concentrations following the night dose when
compared to the morning dose (PTF, 40.6 and 112.3%; SFI,46.5 and 161.6%, respectively). These results suggest a lowerabsorption rate during the night-time as it was described in themodel of Prado-Velasco et al. (2020). This was also confirmed bya trend to larger Tmax values at night with respect to the morningdose (1.87 and 1.52 h, respectively). Differences between Ctrough/AUC ratios were also observed. Lower values of this ratio wereobserved in the morning compared to the night dose interval, asshould be expected when a faster absorption process takes place(0.058 and 0.065, morning and night respectively). Differences inthe absorption rate could be explained by distinct fastingconditions before drug administration or reduced gastricemptying rate due to physiologically slower enterokinetics inthe evening with respect to the day time. Indeed, food intake,especially after high-fat meals, diminished Tac levels and alsoslowed the absorption process as previously reported by Bekerskyet al. (2001). Interestingly, Gustavsen et al. (2020), recentlydescribed that the daily circadian PK variations were largelyaffected by the fasting conditions at the time of drug intakeshowing lower Cmax and AUC0–12 in non-fasting conditions aftermorning Tac dose. In this context, the different eating habits inrelation to morning and evening doses should be considered aseating habits could influence Tac exposure. The significantlyhigher Cmax, Cmax/Ctrough, and AUC observed followingmorning Tac dose compared to night dose were in accordancewith some previous reports (Min et al., 1996; Iwahori et al., 2005;Park et al., 2007; Gustavsen et al., 2020), although other studiesdid not find these PK differences (Tada et al., 2003; Satoh et al.,2008; Gustavsen et al., 2020). However, in the vast majority ofthese studies the morning Tac dose intake was undertaken afterbreakfast and not in fasting conditions, which differs to our study(Tada et al., 2003; Satoh et al., 2008).
To our knowledge, our study is the first showing the role ofcircadian rhythms on intracellular Tac PK. In this study, wholeblood and intracellular exposures revealed pharmacokineticprofiles with a similar pattern. Both intracellular and wholeblood concentrations were determined under steady-stateconditions, and kinetic equilibrium between whole blood andPBMC (intracellular) compartment should have been achieved.Certainly, peak concentrations were observed at similar times forwhole blood and intracellular Tac. As in whole blood, themorning dose resulted in a higher exposure than that of thenight dose (601.4 and 477.3 pg·h/million cells, respectively).Intracellular peak concentrations were also higher at the0–12 h interval than the 12–24 h interval (95.0 and 61.9 pg/million cells, respectively) resulting in higher fluctuation (PTF,125.8 and 66.1%; SFI, 223.1 and 81.9%, respectively). Resultsobtained after the morning Tac dose from the first AUC0–12 h
were in accordance with previous studies (Lemaitre et al., 2015;Klaasen et al., 2018). The lower Cmax/Ctrough ratio, especially afterthe morning dose, achieved intracellularly compared to wholeblood suggests a restricted entrance of Tac molecules inside thecells. It is known that ABCB1 polymorphisms affect theintracellular Tac exposure in PBMCs (Capron et al., 2010;Tron et al., 2020). However, no literature has been publishedto describe the role of circadian rhythms and Pgp on intracellularTac exposure.
Frontiers in Pharmacology | www.frontiersin.org March 2021 | Volume 12 | Article 6360488
Fontova et al. Circadian Rhythms Influencing Tacrolimus Pharmacokinetic/Pharmacodynamic
A specular PD/PK profile (whole blood or intracellular) wasshown in our study after either the morning or night Tac dose.Thus far, the PD analysis measuring CN activity has only beenstudied following the morning dose of twice-daily Tacformulation, but no data has reported the PD effect after thenight dose. Our data showed that despite a lower Inadir followingthe morning Tac dose, this was not translated into higher CNactivity inhibition during the first 12 h, thus showingcomparable AUE0–12 h and AUE12–24 h. This may beexplained by the transient PD profile observed after morningTac dose characterized by a rapid return to pre-dose levels oncethe Inadir was reached, which differs to the more sustainedinhibition after the Inadir, which was noticed following nightdose. Previous studies also showed this rapid recovery of CNactivity to pre-dose levels after the morning Tac dose (Koefoed-nielsen and Gesualdo, 2002; Koefoed-Nielsen et al., 2006;Iwasaki et al., 2018; Fontova et al., 2021). Other studiesinvestigating lymphocyte activation have shown circadianrhythms displaying higher proinflammatory cytokinesecretion during night time (Benedict et al., 2007; Fortieret al., 2011).
Until now, most studies analyzing the PK and the PDproperties of twice-daily Tac formulation described themorning AUC0–12 h as 50% of the total daily dose. Theintroduction of new once-daily Tac formulations wasbrought in to assess AUC0–24 h even when it was comparedwith twice-daily Tac (Tsuchiya et al., 2013; Tremblay et al.,2017; Marquet et al., 2018). Despite the differences observedafter night Tac dose in fasting conditions, some reportsdoubled the analysis of the first AUC0–12 h to illustrate totaldaily dose exposure to compare once-and twice-daily Tacformulations (Iwasaki et al., 2018). Our results showed thatby doubling the AUC0–12 h after morning Tac dose, theAUC0–24 h was overestimated either in whole blood orintracellular. High interpatient variability was observed inPD, which suggests that this estimation should be avoided.Therefore, the best approach to evaluate real AUC0–24 h fortwice-daily Tac is to measure both AUCs and not usingextrapolations.
The TDM of Tac is based on measuring the whole bloodmorning Ctrough levels (Wallemacq et al., 2009; Brunet et al.,2019). Even though measuring the morning C0 also showed goodcorrelation with AUC0–12 h, it does not reflect the differencesobserved between morning and night AUC and Cmax.Intracellular results also reinforced these observations (Tronet al., 2020). Furthermore, our results showed that the I0, I12,and I24 did not correlate with their previous or posterior AUEs,suggesting that only measuring pre-dose CN activity is notsufficient to predict the total CN inhibition after twice-dailyTac dose.
In conclusion, our data proves that despite a clear impact ofcircadian rhythms on whole blood and intracellular Tac PK,ultimately this effect has a modest impact on Tac PD evaluatedas the degree of CN inhibition. Our study may provide aconceptual basis for a better understanding of PD/PK Tacproperties of twice-daily Tac formulation in recipients of renaltransplantation.
DATA AVAILABILITY STATEMENT
The raw data supporting the conclusions of this article will bemade available by the authors, without undue reservation.
ETHICS STATEMENT
The studies involving human participants were reviewed andapproved by the Bellvitge University Hospital. The patients/participants provided their written informed consent toparticipate in this study.
AUTHOR CONTRIBUTIONS
Conceptualization: PF, HC, JG, OB, and NL. Analysis: PF, HC,RR, LM, AV, JG, OB, and NL.Methodology: PF, RR, LM, AV, andNL. Patient inclusion: NM, EM, MM, AM, JC, JT, and OB.Supervision: HC, JG, OB, and NL. Writing: PF, HC, RR, LM,AV, JT, JG, OB, and NL. All authors contributed to the article andapproved the submitted version.
FUNDING
The present study was supported by an unrestricted grant fromChiesi España SA and grants from Instituto de Salud Carlos IIIand Ministerio de Sanidad y Consumo (PI18/01740), REDinRENRD16/0009/0003, Sociedad Española de Nefrologia (17PSJ026)and Fondo Europeo de Desarrollo Regional (FEDER) cofoundedby FEDER funds/European Regional Development Fund (ERDF)a way to Build Europa.
ACKNOWLEDGMENTS
The authors are especially grateful to Gema Cerezo of Nephologylaboratory team and to Scientific and Technologic centers(CCiTUB) team from the University of Barcelona (EstherCastaño and Bea Barroso) for the technical support. Wethankfully acknowledge the Biochemistry departmenttechnicians from Bellvitge University Hospital, speciallyMercedes Sanjuás-Iglesias and Gloria Pérez-Fernández for thecrucial technical assistance in this study. We are thankful to thetransplant nurses’ team of Bellvitge University Hospital (Ma JesúsGonzalez and Yurema Martínez). We also acknowledge theTransplant assistant, Carmen Fernández-Gámiz, for hersupport in clinical data base variables. We thank CERCAProgramme/Generalitat de Catalunya for institutional support.
SUPPLEMENTARY MATERIAL
The SupplementaryMaterial for this article can be found online at:https://www.frontiersin.org/articles/10.3389/fphar.2021.636048/full#supplementary-material.
Frontiers in Pharmacology | www.frontiersin.org March 2021 | Volume 12 | Article 6360489
Fontova et al. Circadian Rhythms Influencing Tacrolimus Pharmacokinetic/Pharmacodynamic
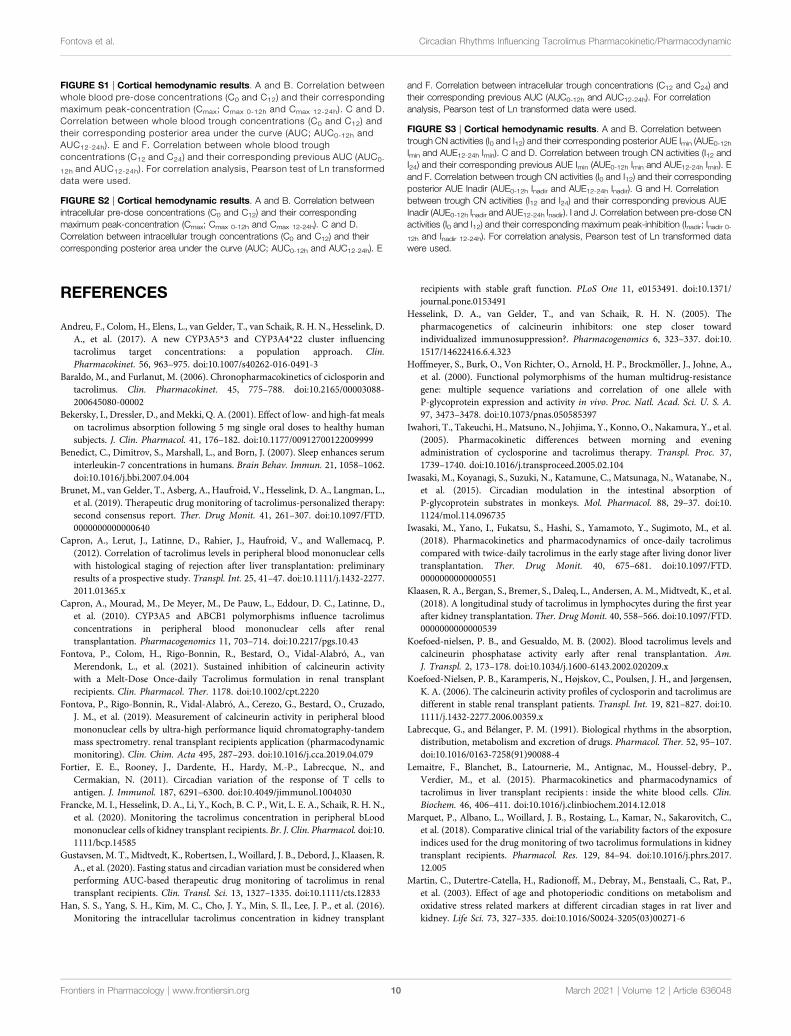
FIGURE S1 | Cortical hemodynamic results. A and B. Correlation betweenwhole blood pre-dose concentrations (C0 and C12) and their correspondingmaximum peak-concentration (Cmax; Cmax 0-12h and Cmax 12-24h). C and D.Correlation between whole blood trough concentrations (C0 and C12) andtheir corresponding posterior area under the curve (AUC; AUC0-12h andAUC12-24h). E and F. Correlation between whole blood troughconcentrations (C12 and C24) and their corresponding previous AUC (AUC0-
12h and AUC12-24h). For correlation analysis, Pearson test of Ln transformeddata were used.
FIGURE S2 | Cortical hemodynamic results. A and B. Correlation betweenintracellular pre-dose concentrations (C0 and C12) and their correspondingmaximum peak-concentration (Cmax; Cmax 0-12h and Cmax 12-24h). C and D.Correlation between intracellular trough concentrations (C0 and C12) and theircorresponding posterior area under the curve (AUC; AUC0-12h and AUC12-24h). E
and F. Correlation between intracellular trough concentrations (C12 and C24) andtheir corresponding previous AUC (AUC0-12h and AUC12-24h). For correlationanalysis, Pearson test of Ln transformed data were used.
FIGURE S3 | Cortical hemodynamic results. A and B. Correlation betweentrough CN activities (I0 and I12) and their corresponding posterior AUE Imin (AUE0-12hImin and AUE12-24h Imin). C and D. Correlation between trough CN activities (I12 andI24) and their corresponding previous AUE Imin (AUE0-12h Imin and AUE12-24h Imin). Eand F. Correlation between trough CN activities (I0 and I12) and their correspondingposterior AUE Inadir (AUE0-12h Inadir and AUE12-24h Inadir). G and H. Correlationbetween trough CN activities (I12 and I24) and their corresponding previous AUEInadir (AUE0-12h Inadir and AUE12-24h Inadir). I and J. Correlation between pre-dose CNactivities (I0 and I12) and their corresponding maximum peak-inhibition (Inadir; Inadir 0-12h and Inadir 12-24h). For correlation analysis, Pearson test of Ln transformed datawere used.
REFERENCES
Andreu, F., Colom, H., Elens, L., van Gelder, T., van Schaik, R. H. N., Hesselink, D.A., et al. (2017). A new CYP3A5*3 and CYP3A4*22 cluster influencingtacrolimus target concentrations: a population approach. Clin.Pharmacokinet. 56, 963–975. doi:10.1007/s40262-016-0491-3
Baraldo, M., and Furlanut, M. (2006). Chronopharmacokinetics of ciclosporin andtacrolimus. Clin. Pharmacokinet. 45, 775–788. doi:10.2165/00003088-200645080-00002
Bekersky, I., Dressler, D., andMekki, Q. A. (2001). Effect of low- and high-fat mealson tacrolimus absorption following 5 mg single oral doses to healthy humansubjects. J. Clin. Pharmacol. 41, 176–182. doi:10.1177/00912700122009999
Benedict, C., Dimitrov, S., Marshall, L., and Born, J. (2007). Sleep enhances seruminterleukin-7 concentrations in humans. Brain Behav. Immun. 21, 1058–1062.doi:10.1016/j.bbi.2007.04.004
Brunet, M., van Gelder, T., Asberg, A., Haufroid, V., Hesselink, D. A., Langman, L.,et al. (2019). Therapeutic drug monitoring of tacrolimus-personalized therapy:second consensus report. Ther. Drug Monit. 41, 261–307. doi:10.1097/FTD.0000000000000640
Capron, A., Lerut, J., Latinne, D., Rahier, J., Haufroid, V., and Wallemacq, P.(2012). Correlation of tacrolimus levels in peripheral blood mononuclear cellswith histological staging of rejection after liver transplantation: preliminaryresults of a prospective study. Transpl. Int. 25, 41–47. doi:10.1111/j.1432-2277.2011.01365.x
Capron, A., Mourad, M., De Meyer, M., De Pauw, L., Eddour, D. C., Latinne, D.,et al. (2010). CYP3A5 and ABCB1 polymorphisms influence tacrolimusconcentrations in peripheral blood mononuclear cells after renaltransplantation. Pharmacogenomics 11, 703–714. doi:10.2217/pgs.10.43
Fontova, P., Colom, H., Rigo-Bonnin, R., Bestard, O., Vidal-Alabró, A., vanMerendonk, L., et al. (2021). Sustained inhibition of calcineurin activitywith a Melt-Dose Once-daily Tacrolimus formulation in renal transplantrecipients. Clin. Pharmacol. Ther. 1178. doi:10.1002/cpt.2220
Fontova, P., Rigo-Bonnin, R., Vidal-Alabró, A., Cerezo, G., Bestard, O., Cruzado,J. M., et al. (2019). Measurement of calcineurin activity in peripheral bloodmononuclear cells by ultra-high performance liquid chromatography-tandemmass spectrometry. renal transplant recipients application (pharmacodynamicmonitoring). Clin. Chim. Acta 495, 287–293. doi:10.1016/j.cca.2019.04.079
Fortier, E. E., Rooney, J., Dardente, H., Hardy, M.-P., Labrecque, N., andCermakian, N. (2011). Circadian variation of the response of T cells toantigen. J. Immunol. 187, 6291–6300. doi:10.4049/jimmunol.1004030
Francke, M. I., Hesselink, D. A., Li, Y., Koch, B. C. P., Wit, L. E. A., Schaik, R. H. N.,et al. (2020). Monitoring the tacrolimus concentration in peripheral bLoodmononuclear cells of kidney transplant recipients. Br. J. Clin. Pharmacol. doi:10.1111/bcp.14585
Gustavsen, M. T., Midtvedt, K., Robertsen, I., Woillard, J. B., Debord, J., Klaasen, R.A., et al. (2020). Fasting status and circadian variation must be considered whenperforming AUC-based therapeutic drug monitoring of tacrolimus in renaltransplant recipients. Clin. Transl. Sci. 13, 1327–1335. doi:10.1111/cts.12833
Han, S. S., Yang, S. H., Kim, M. C., Cho, J. Y., Min, S. Il., Lee, J. P., et al. (2016).Monitoring the intracellular tacrolimus concentration in kidney transplant
recipients with stable graft function. PLoS One 11, e0153491. doi:10.1371/journal.pone.0153491
Hesselink, D. A., van Gelder, T., and van Schaik, R. H. N. (2005). Thepharmacogenetics of calcineurin inhibitors: one step closer towardindividualized immunosuppression?. Pharmacogenomics 6, 323–337. doi:10.1517/14622416.6.4.323
Hoffmeyer, S., Burk, O., Von Richter, O., Arnold, H. P., Brockmöller, J., Johne, A.,et al. (2000). Functional polymorphisms of the human multidrug-resistancegene: multiple sequence variations and correlation of one allele withP-glycoprotein expression and activity in vivo. Proc. Natl. Acad. Sci. U. S. A.97, 3473–3478. doi:10.1073/pnas.050585397
Iwahori, T., Takeuchi, H., Matsuno, N., Johjima, Y., Konno, O., Nakamura, Y., et al.(2005). Pharmacokinetic differences between morning and eveningadministration of cyclosporine and tacrolimus therapy. Transpl. Proc. 37,1739–1740. doi:10.1016/j.transproceed.2005.02.104
Iwasaki, M., Koyanagi, S., Suzuki, N., Katamune, C., Matsunaga, N., Watanabe, N.,et al. (2015). Circadian modulation in the intestinal absorption ofP-glycoprotein substrates in monkeys. Mol. Pharmacol. 88, 29–37. doi:10.1124/mol.114.096735
Iwasaki, M., Yano, I., Fukatsu, S., Hashi, S., Yamamoto, Y., Sugimoto, M., et al.(2018). Pharmacokinetics and pharmacodynamics of once-daily tacrolimuscompared with twice-daily tacrolimus in the early stage after living donor livertransplantation. Ther. Drug Monit. 40, 675–681. doi:10.1097/FTD.0000000000000551
Klaasen, R. A., Bergan, S., Bremer, S., Daleq, L., Andersen, A. M., Midtvedt, K., et al.(2018). A longitudinal study of tacrolimus in lymphocytes during the first yearafter kidney transplantation. Ther. Drug Monit. 40, 558–566. doi:10.1097/FTD.0000000000000539
Koefoed-nielsen, P. B., and Gesualdo, M. B. (2002). Blood tacrolimus levels andcalcineurin phosphatase activity early after renal transplantation. Am.J. Transpl. 2, 173–178. doi:10.1034/j.1600-6143.2002.020209.x
Koefoed-Nielsen, P. B., Karamperis, N., Højskov, C., Poulsen, J. H., and Jørgensen,K. A. (2006). The calcineurin activity profiles of cyclosporin and tacrolimus aredifferent in stable renal transplant patients. Transpl. Int. 19, 821–827. doi:10.1111/j.1432-2277.2006.00359.x
Labrecque, G., and Bélanger, P. M. (1991). Biological rhythms in the absorption,distribution, metabolism and excretion of drugs. Pharmacol. Ther. 52, 95–107.doi:10.1016/0163-7258(91)90088-4
Lemaitre, F., Blanchet, B., Latournerie, M., Antignac, M., Houssel-debry, P.,Verdier, M., et al. (2015). Pharmacokinetics and pharmacodynamics oftacrolimus in liver transplant recipients : inside the white blood cells. Clin.Biochem. 46, 406–411. doi:10.1016/j.clinbiochem.2014.12.018
Marquet, P., Albano, L., Woillard, J. B., Rostaing, L., Kamar, N., Sakarovitch, C.,et al. (2018). Comparative clinical trial of the variability factors of the exposureindices used for the drug monitoring of two tacrolimus formulations in kidneytransplant recipients. Pharmacol. Res. 129, 84–94. doi:10.1016/j.phrs.2017.12.005
Martin, C., Dutertre-Catella, H., Radionoff, M., Debray, M., Benstaali, C., Rat, P.,et al. (2003). Effect of age and photoperiodic conditions on metabolism andoxidative stress related markers at different circadian stages in rat liver andkidney. Life Sci. 73, 327–335. doi:10.1016/S0024-3205(03)00271-6
Frontiers in Pharmacology | www.frontiersin.org March 2021 | Volume 12 | Article 63604810
Fontova et al. Circadian Rhythms Influencing Tacrolimus Pharmacokinetic/Pharmacodynamic
Min, D. I., Chen, H.-Y., Fabrega, A., Ukah, F., Wu, Y.-M., Corwin, C., et al. (1996).Circadian variation of tacrolimus disposition in liver allograft recipients.Transplantation 62, 1190–1192. doi:10.1097/00007890-199610270-00031
Murakami, Y., Higashi, Y., Matsunaga, N., Koyanagi, S., and Ohdo, S. (2008).Circadian clock-controlled intestinal expression of the multidrug-resistancegene mdr1a in mice. Gastroenterology 135, 1636–1644. doi:10.1053/j.gastro.2008.07.073
Ohdo, S. (2007). Chronopharmacology focused on biological clock. Drug Metab.Pharmacokinet. 22, 3–14. doi:10.2133/dmpk.22.3
Okyar, A., Kumar, S. A., Filipski, E., Piccolo, E., Ozturk, N., Xandri-Monje, H., et al.(2019). Sex-, feeding-, and circadian time-dependency of P-glycoproteinexpression and activity - implications for mechanistic pharmacokineticsmodeling. Sci. Rep. 9, 1–15. doi:10.1038/s41598-019-46977-0
Park, S. I., Felipe, C. R., Pinheiro-Machado, P. G., Garcia, R., Tedesco-Silva, H., andMedina-Pestana, J. O. (2007). Circadian and time-dependent variability intacrolimus pharmacokinetics. Fundam. Clin. Pharmacol. 21, 191–197. doi:10.1111/j.1472-8206.2007.00468.x
Prado-Velasco, M., Borobia, A., and Carcas-Sansuan, A. (2020). Predictive engines basedon pharmacokineticsmodelling for tacrolimus personalized dosage in paediatric renaltransplant patients. Sci. Rep. 10, 1–18. doi:10.1038/s41598-020-64189-9
Rigo-Bonnin, R., Arbiol-Roca, A., de Aledo-Castillo, J. M. G., and Alía, P. (2015).Simultaneous measurement of cyclosporine A, everolimus, sirolimus andtacrolimus concentrations in human blood by UPLC–MS/MS.Chromatographia 78, 1459–1474. doi:10.1007/s10337-015-2981-0
Satoh, S., Kagaya, H., Saito, M., Inoue, T., Miura, M., Inoue, K., et al. (2008). Lack oftacrolimus circadian pharmacokinetics and CYP3A5 pharmacogenetics in theearly and maintenance stages in Japanese renal transplant recipients. Br. J. Clin.Pharmacol. 66, 207–214. doi:10.1111/j.1365-2125.2008.03188.x
Staatz, C. E., and Tett, S. E. (2004). Clinical pharmacokinetics andpharmacodynamics of tacrolimus in solid organ transplantation. Clin.Pharmacokinet. 43, 623–653. doi:10.2165/00003088-200443100-00001
Tada, H., Satoh, S., Iinuma, M., Shimoda, N., Murakami, M., Hayase, Y., et al.(2003). Chronopharmacokinetics of tacrolimus in kidney transplant recipients:occurrence of acute rejection. J. Clin. Pharmacol. 43, 859–865. doi:10.1177/0091270003254797
Tamura, S., Tokunaga, Y., Ibuki, R., Amidon, G. L., Sezaki, H., and Yamashita, S.(2003). The site-specific transport and metabolism of tacrolimus in rat smallintestine. J. Pharmacol. Exp. Ther. 306, 310–316. doi:10.1124/jpet.103.050716
Tomalik-Scharte, D., Suleiman, A. A., Frechen, S., Kraus, D., Kerkweg, U., Rokitta,D., et al. (2014). Population pharmacokinetic analysis of circadian rhythms in
hepatic CYP3A activity using midazolam. J. Clin. Pharmacol. 54, 1162–1169.doi:10.1002/jcph.318
Tremblay, S., Nigro, V., Weinberg, J., Woodle, E. S., and Alloway, R. R. (2017). Asteady-state head-to-head pharmacokinetic comparison of all FK-506(tacrolimus) formulations (ASTCOFF): an open-label, prospective,randomized, two-arm, three-period crossover study. Am. J. Transpl. 17,432–442. doi:10.1111/ajt.13935
Tron, C., Woillard, J. B., Houssel-Debry, P., David, V., Jezequel, C., Rayar, M., et al.(2020). Pharmacogenetic—whole blood and intracellularpharmacokinetic—pharmacodynamic (PG-PK2-PD) relationship oftacrolimus in liver transplant recipientsogenetic. PLoS One 15, e0230195.doi:10.1371/journal.pone.0230195
Tsuchiya, T., Ishida, H., Tanabe, T., Shimizu, T., Honda, K., Omoto, K., et al.(2013). Comparison of pharmacokinetics and pathology for low-dosetacrolimus once-daily and twice-daily in living kidney transplantation:prospective trial in once-daily versus twice-daily tacrolimus. Transplantation96, 198–204. doi:10.1097/TP.0b013e318296c9d5
van Merendonk, L. N., Fontova, P., Rigo-Bonnin, R., Colom, H., Vidal-Alabró, A.,Bestard, O., et al. (2020). Validation and evaluation of four sample preparationmethods for the quantification of intracellular tacrolimus in peripheral bloodmononuclear cells by UHPLC-MS/MS. Clin. Chim. Acta 503, 210–217. doi:10.1016/j.cca.2019.11.033
Wallemacq, P., Armstrong, V. W., Brunet, M., Haufroid, V., Holt, D. W.,Johnston, A., et al. (2009). Opportunities to optimize tacrolimus therapyin solid organ transplantation: report of the European consensusconference. Ther. Drug Monit. 31, 139–152. doi:10.1097/ftd.0b013e318198d092
Conflict of Interest: The authors declare that the research was conducted in theabsence of any commercial or financial relationships that could be construed as apotential conflict of interest.
Copyright © 2021 Fontova, Colom, Rigo-Bonnin, van Merendonk, Vidal-Alabró,Montero, Melilli, Meneghini, Manonelles, Cruzado, Torras, Grinyó, Bestard andLloberas. This is an open-access article distributed under the terms of the CreativeCommons Attribution License (CC BY). The use, distribution or reproduction inother forums is permitted, provided the original author(s) and the copyright owner(s)are credited and that the original publication in this journal is cited, in accordancewith accepted academic practice. No use, distribution or reproduction is permittedwhich does not comply with these terms.
Frontiers in Pharmacology | www.frontiersin.org March 2021 | Volume 12 | Article 63604811
Fontova et al. Circadian Rhythms Influencing Tacrolimus Pharmacokinetic/Pharmacodynamic