Embed Size (px)
DESCRIPTION
Introductions. John White, Director of Product Management Joined iModules January, 2014 Background in product management and data products Kansas State Alumni Association 1995-2000 Jason Roberts, SVP Customer Success Joined iModules in 2012 Leads the Client Services organization - PowerPoint PPT Presentation
Citation preview
913.888.0772 | imodules.com
iModules Actionable Insights OverviewPresented by John White and Jason Roberts
913.888.0772 | imodules.com
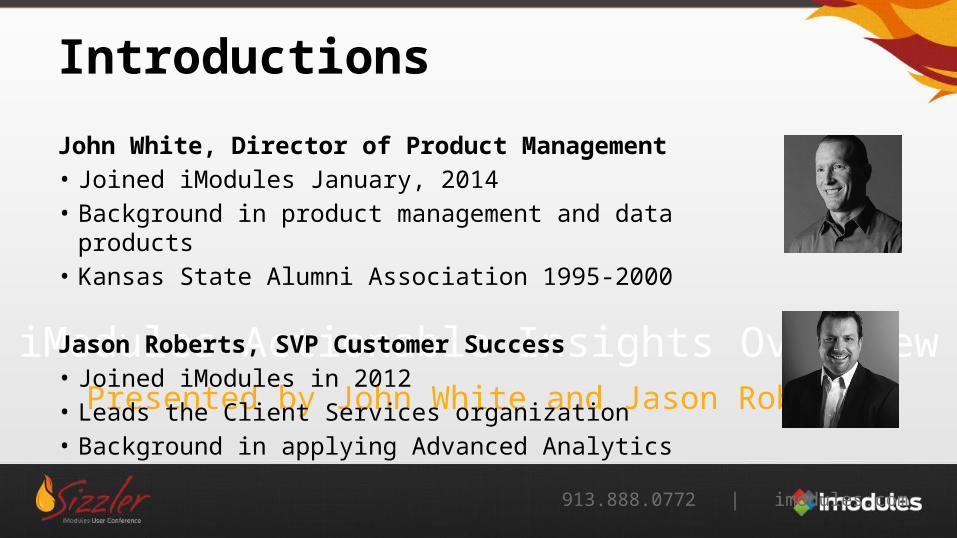
Introductions
John White, Director of Product Management• Joined iModules January, 2014• Background in product management and data products• Kansas State Alumni Association 1995-2000
Jason Roberts, SVP Customer Success• Joined iModules in 2012• Leads the Client Services organization• Background in applying Advanced Analytics

Actionable Insights
What is it?
Why are we doing this?
Why is this important to each of you?
Online Engagement Challenges
• Identify who is engaged online and who is not, and who is likely to become engaged in the future
• Strategies to increase online engagement• Segment and target communications• Measure results• Track engagement over time• Control, reduce or reallocate expenses
Focus
Use Encompass data to help clients target constituents more effectively – thereby increasing online engagement in a more cost effective manner.

Data Analysis Process
Data: email activity, event activity, online giving, membership
Hygiene/Append
Data Mining & Modeling Process
Proprietary, Custom Scoring Models (CEI, PEI)
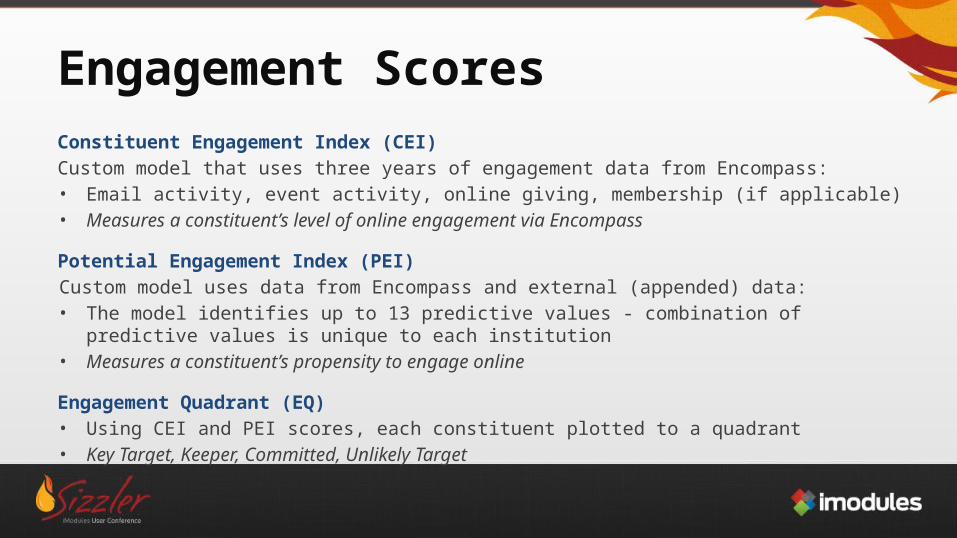
Engagement ScoresConstituent Engagement Index (CEI)Custom model that uses three years of engagement data from Encompass:• Email activity, event activity, online giving, membership (if applicable)• Measures a constituent’s level of online engagement via Encompass
Potential Engagement Index (PEI)Custom model uses data from Encompass and external (appended) data:• The model identifies up to 13 predictive values - combination of predictive values is unique to each institution• Measures a constituent’s propensity to engage online
Engagement Quadrant (EQ)• Using CEI and PEI scores, each constituent plotted to a quadrant • Key Target, Keeper, Committed, Unlikely Target
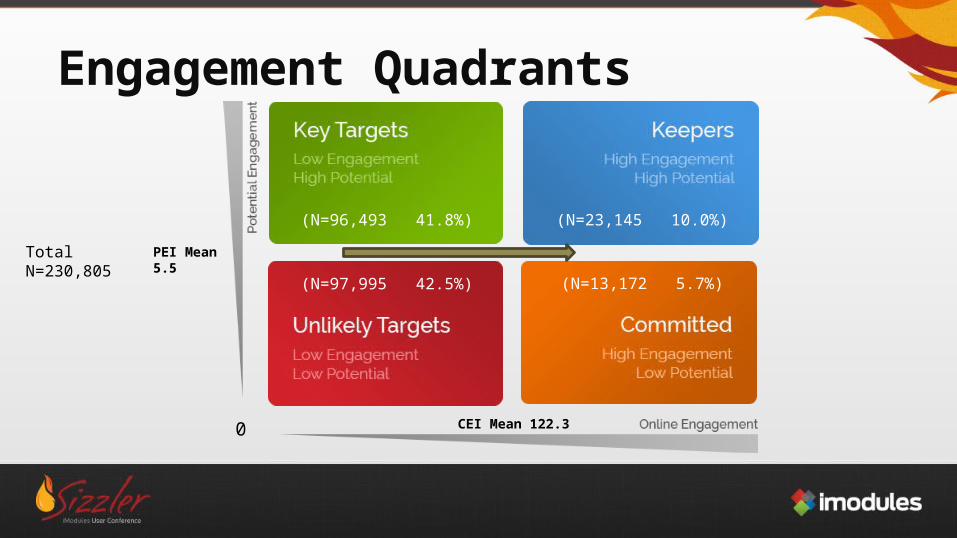
Engagement Quadrants
PEI Mean 5.5Total N=230,805
(N=96,493 41.8%) (N=23,145 10.0%)
(N=97,995 42.5%) (N=13,172 5.7%)
0 CEI Mean 122.3
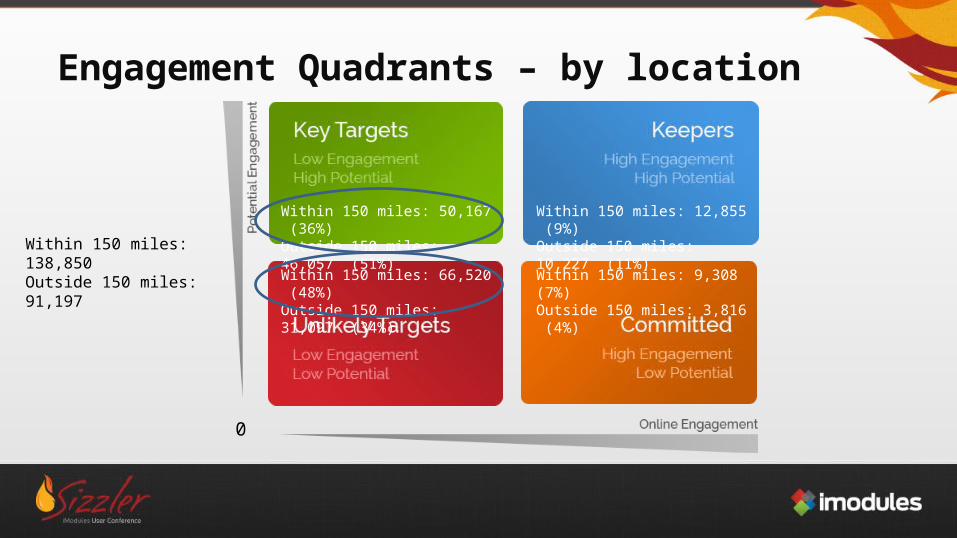
Engagement Quadrants – by location
0
Within 150 miles: 138,850Outside 150 miles: 91,197
Within 150 miles: 50,167 (36%)Outside 150 miles: 46,057 (51%)
Within 150 miles: 12,855 (9%)Outside 150 miles: 10,227 (11%)
Within 150 miles: 66,520 (48%)Outside 150 miles: 31,097 (34%)
Within 150 miles: 9,308 (7%)Outside 150 miles: 3,816 (4%)
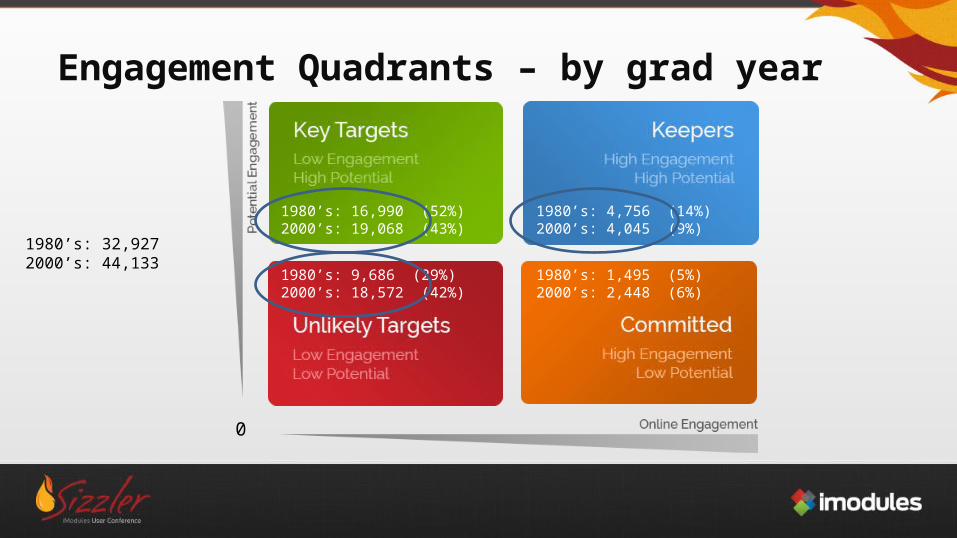
Engagement Quadrants – by grad year
0
1980’s: 32,9272000’s: 44,133
1980’s: 16,990 (52%)2000’s: 19,068 (43%)
1980’s: 4,756 (14%)2000’s: 4,045 (9%)
1980’s: 9,686 (29%)2000’s: 18,572 (42%)
1980’s: 1,495 (5%)2000’s: 2,448 (6%)
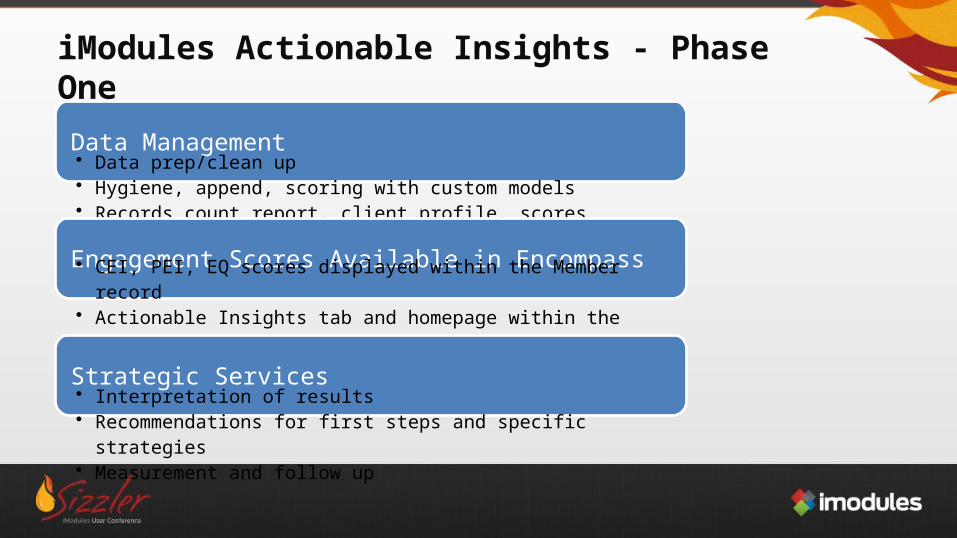
iModules Actionable Insights - Phase One
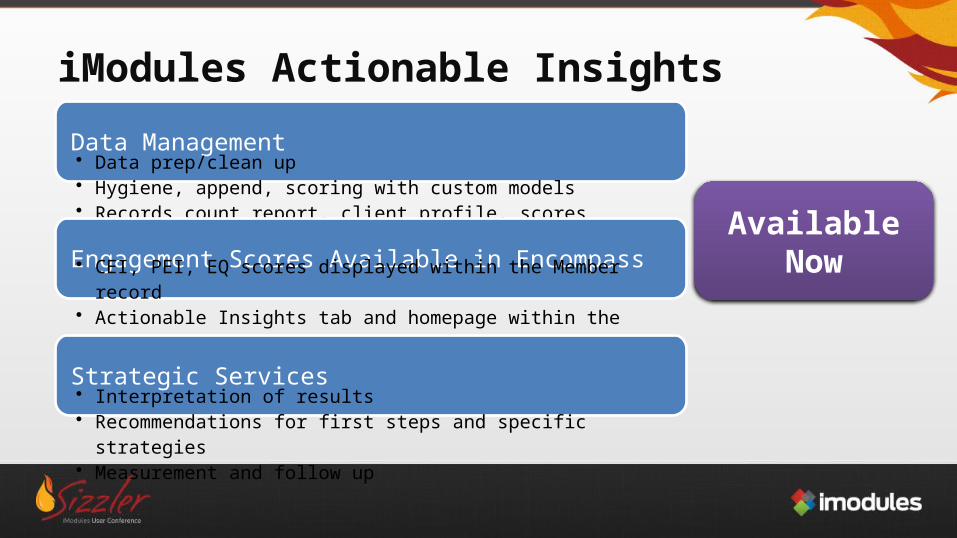
Data Management
• Data prep/clean up• Hygiene, append, scoring with custom models• Records count report, client profile, scores imported and rescored
Engagement Scores Available in Encompass
• CEI, PEI, EQ scores displayed within the Member record• Actionable Insights tab and homepage within the admin• Scores can be used with the Data Viewer query tool
Strategic Services
• Interpretation of results• Recommendations for first steps and specific strategies• Measurement and follow up

Applying Actionable Insights: Alumni Relations and CommunicationsIncrease online engagement• Enhance your current segmentation• Modify communication strategy
• Message • Frequency
• Longitudinal view of constituent engagement
• Identify online ambassadors
Impact offline activity• Adjust communication strategy based on
propensity to engage online• Potential for budget reallocation
(print/postage dollars)• Additional data point to identify
prospective volunteers, mentors, Board members…
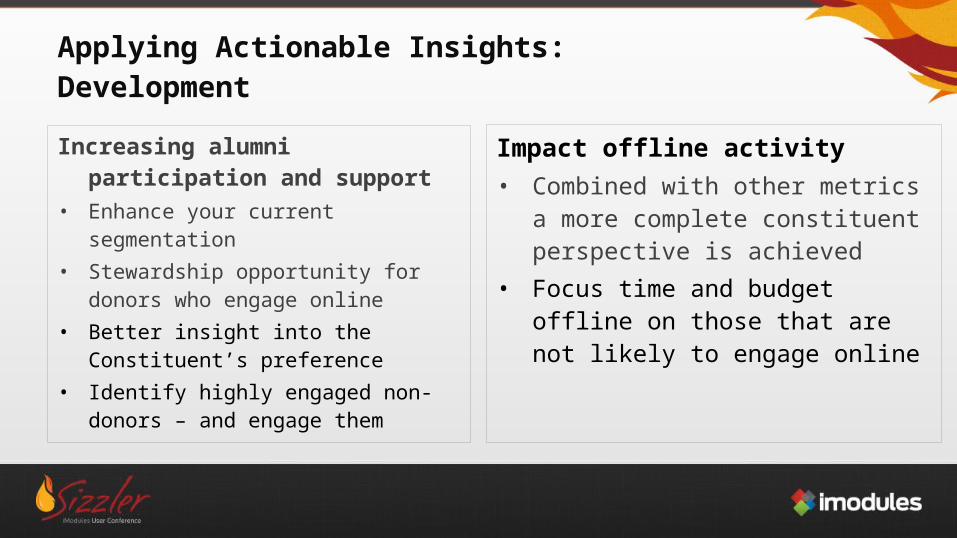
Applying Actionable Insights:DevelopmentIncreasing alumni participation and
support• Enhance your current segmentation• Stewardship opportunity for donors
who engage online• Better insight into the Constituent’s
preference• Identify highly engaged non-donors –
and engage them
Impact offline activity• Combined with other metrics a more
complete constituent perspective is achieved
• Focus time and budget offline on those that are not likely to engage online
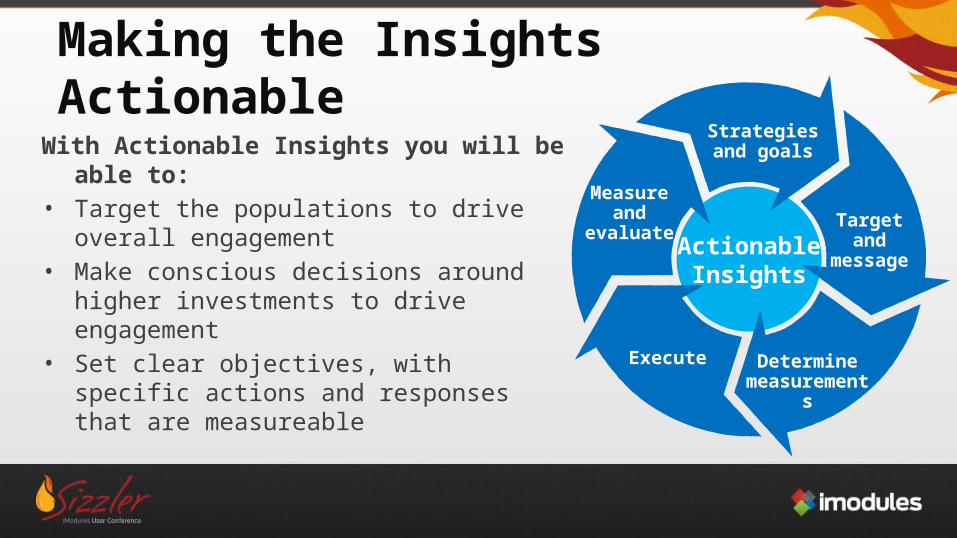
Making the Insights ActionableWith Actionable Insights you will be able to:• Target the populations to drive overall
engagement• Make conscious decisions around higher
investments to drive engagement• Set clear objectives, with specific actions and
responses that are measureable
ActionableInsights
Strategies and goals
Target and message
Determine measurements
Execute
Measure and
evaluate

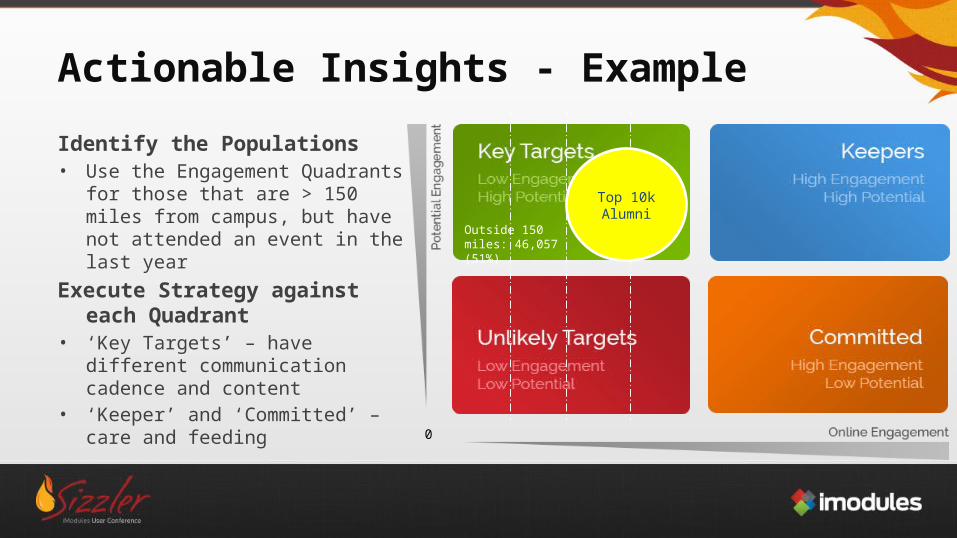
Actionable Insights ExampleObjective:Drive increased engagement among Alumni living more than 150 miles from campus, with a focus on event participation
Measurement:Near term: Increased open rates, click through, and registrations for the events.Long term: Increased engagement (shift in engagement distribution)
0
Within 150 miles: 50,167 (36%)Outside 150 miles: 46,057 (51%)
Within 150 miles: 12,855 (9%)Outside 150 miles: 10,227 (11%)
Within 150 miles: 66,520 (48%)Outside 150 miles: 31,097 (34%)
Within 150 miles: 9,308 (7%)Outside 150 miles: 3,816 (4%)
0
Actionable Insights - ExampleIdentify the Populations• Use the Engagement Quadrants for
those that are > 150 miles from campus, but have not attended an event in the last year
Execute Strategy against each Quadrant
• ‘Key Targets’ – have different communication cadence and content
• ‘Keeper’ and ‘Committed’ – care and feeding
Top 10kAlumni
Outside 150 miles: 46,057 (51%)
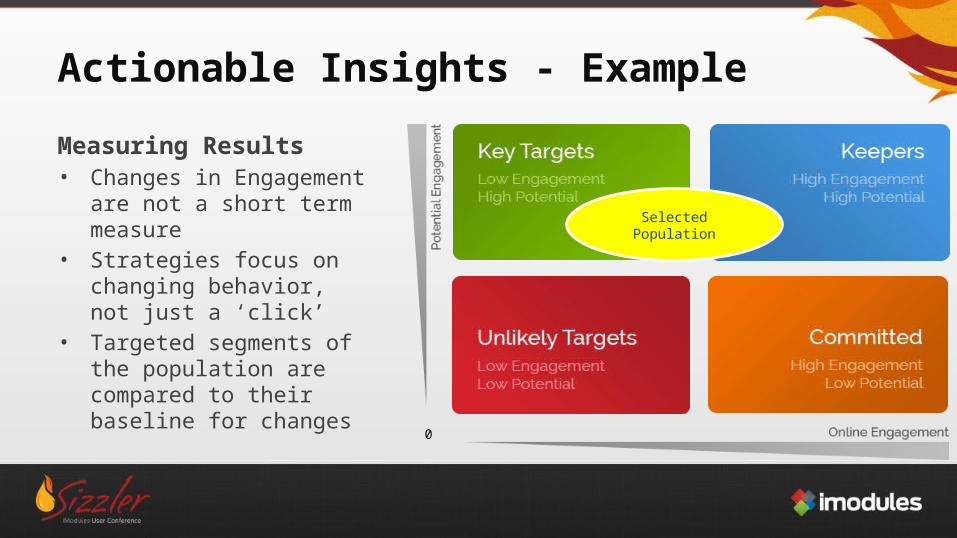
Actionable Insights - ExampleMeasuring Results• Changes in Engagement are
not a short term measure• Strategies focus on changing
behavior, not just a ‘click’• Targeted segments of the
population are compared to their baseline for changes
0
Selected Population
Actionable Insights Features
• Actionable data• Minimal workload• Aligns with current business processes• Statistically based, custom models• Models are not static• Services included to support success• Optimize use of Encompass
Future Development
• Model inputs• Reporting and analytic capabilities• Trend analysis
iModules Actionable InsightsData Management
• Data prep/clean up• Hygiene, append, scoring with custom models• Records count report, client profile, scores imported and rescored
Engagement Scores Available in Encompass
• CEI, PEI, EQ scores displayed within the Member record• Actionable Insights tab and homepage within the admin• Scores can be used with the Data Viewer query tool
Strategic Services
• Interpretation of results• Recommendations for first steps and specific strategies• Measurement and follow up
Available Now
Who to Contact
Moving ForwardYour account manager
SizzlerYour account managerJohn WhiteJason RobertsMirko Widenhorn

913.888.0772 | imodules.com
Questions?
913.888.0772 | imodules.com

Contact Information
John WhiteDirector of Product [email protected]
Jason RobertsSenior Vice President, Customer [email protected]