Embed Size (px)
Citation preview
Outline
What is Quality? History of Quality Methodology Deming’s Principles Taguchi’s Contributions And Philosophy Total Quality Management Quality Improvement Tools Costs related to quality Benefits/Drawbacks
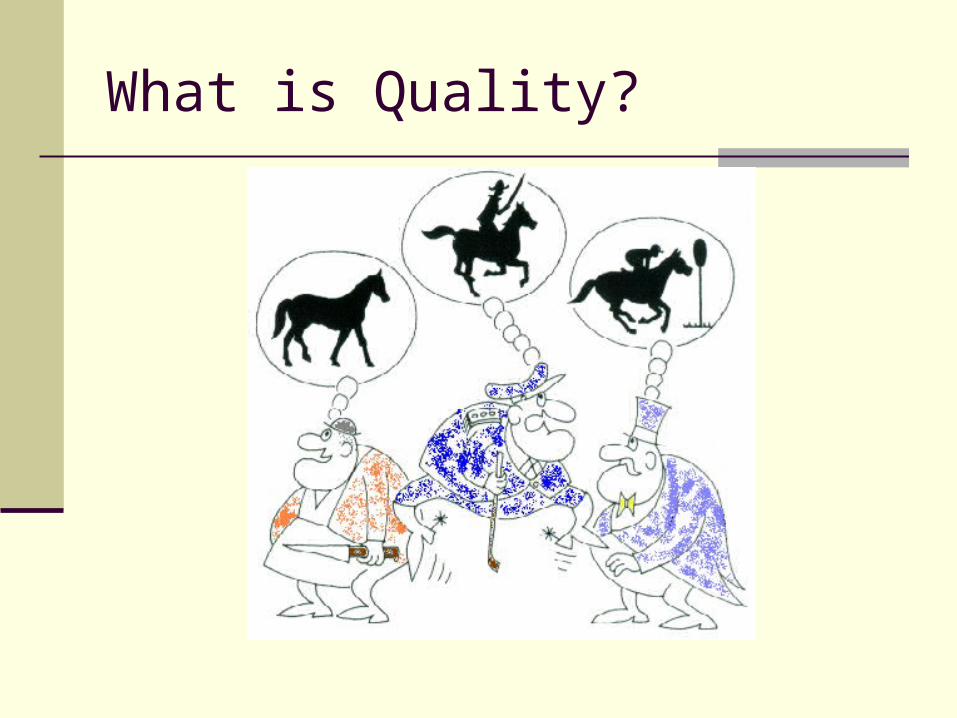
What is Quality?
What does the word “quality” mean to you? Think about your past experiences staying at
various hotels. Did you stay at a “quality” hotel? What about the experience made it a “quality” experience for you?
Think about a product you bought. How can you define its “quality”?
Dimensions of Quality
Garvin (1987)1. Performance:
Will the product/service do the intended job?
2. Reliability: How often does the product/service fail?
3. Durability: How long does the product/service last?
4. Serviceability: How easy to repair the product / to solve the
problems in service?
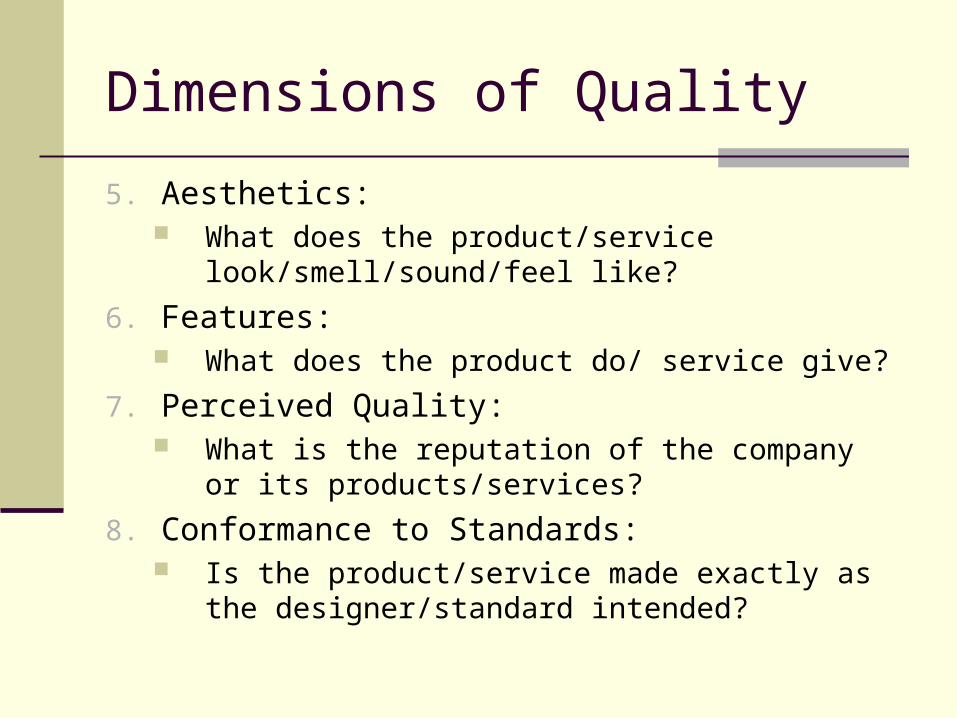
Dimensions of Quality
5. Aesthetics: What does the product/service look/smell/sound/feel
like?
6. Features: What does the product do/ service give?
7. Perceived Quality: What is the reputation of the company or its
products/services?
8. Conformance to Standards: Is the product/service made exactly as the
designer/standard intended?
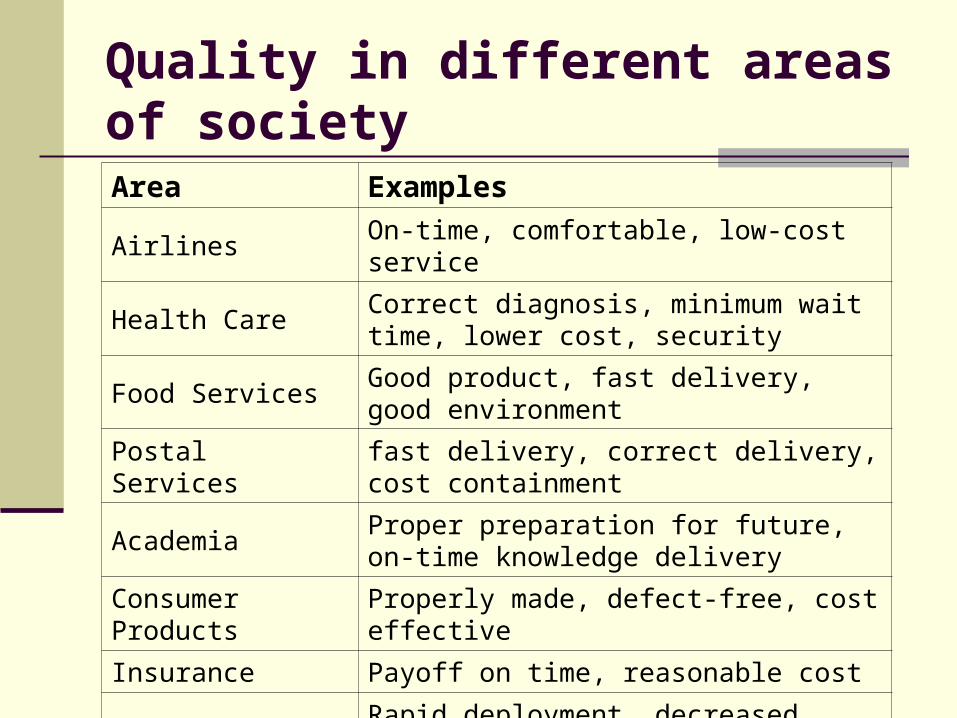
Quality in different areas of society
Area Examples
Airlines On-time, comfortable, low-cost service
Health CareCorrect diagnosis, minimum wait time, lower cost, security
Food Services Good product, fast delivery, good environment
Postal Services fast delivery, correct delivery, cost containment
AcademiaProper preparation for future, on-time knowledge delivery
Consumer Products Properly made, defect-free, cost effective
Insurance Payoff on time, reasonable cost
Military Rapid deployment, decreased wages, no graft
Automotive Defect-free
Communications Clearer, faster, cheaper service
What is Quality?
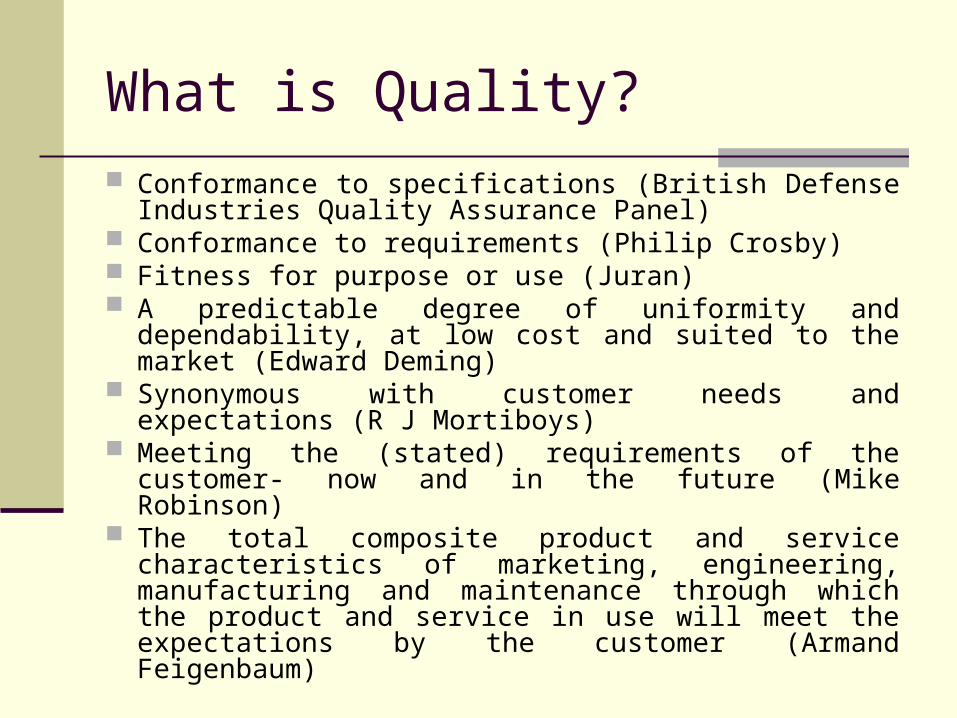
Conformance to specifications (British Defense Industries Quality Assurance Panel)
Conformance to requirements (Philip Crosby) Fitness for purpose or use (Juran) A predictable degree of uniformity and dependability, at
low cost and suited to the market (Edward Deming) Synonymous with customer needs and expectations (R
J Mortiboys) Meeting the (stated) requirements of the customer- now
and in the future (Mike Robinson) The total composite product and service characteristics
of marketing, engineering, manufacturing and maintenance through which the product and service in use will meet the expectations by the customer (Armand Feigenbaum)
What is Quality?
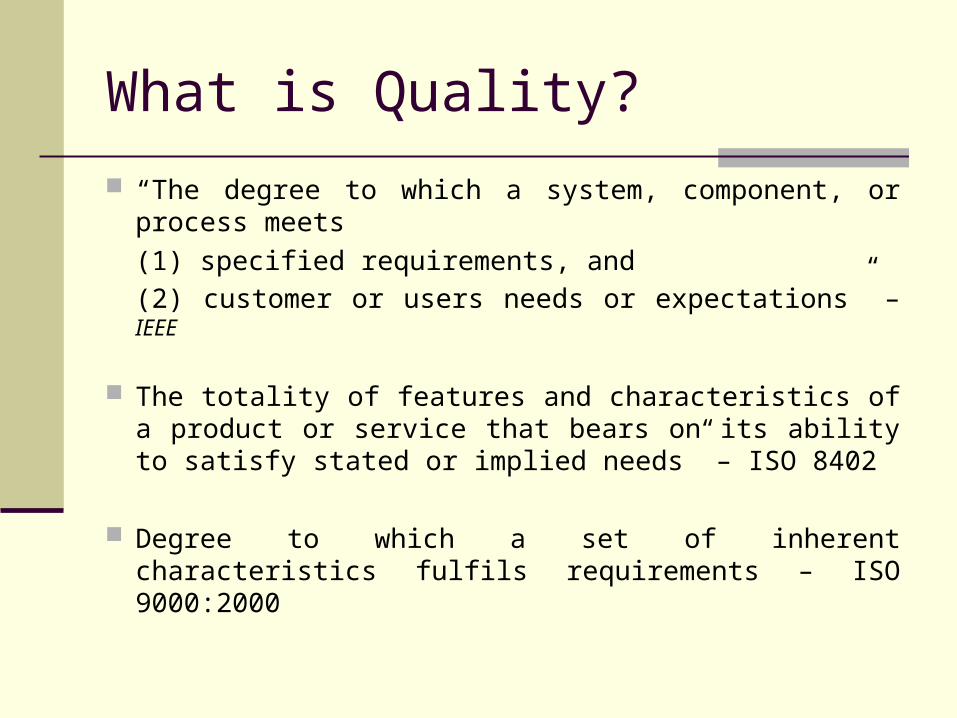
“The degree to which a system, component, or process meets
(1) specified requirements, and
(2) customer or users needs or expectations” – IEEE
The totality of features and characteristics of a product or service that bears on its ability to satisfy stated or implied needs” – ISO 8402
Degree to which a set of inherent characteristics fulfils requirements – ISO 9000:2000
10
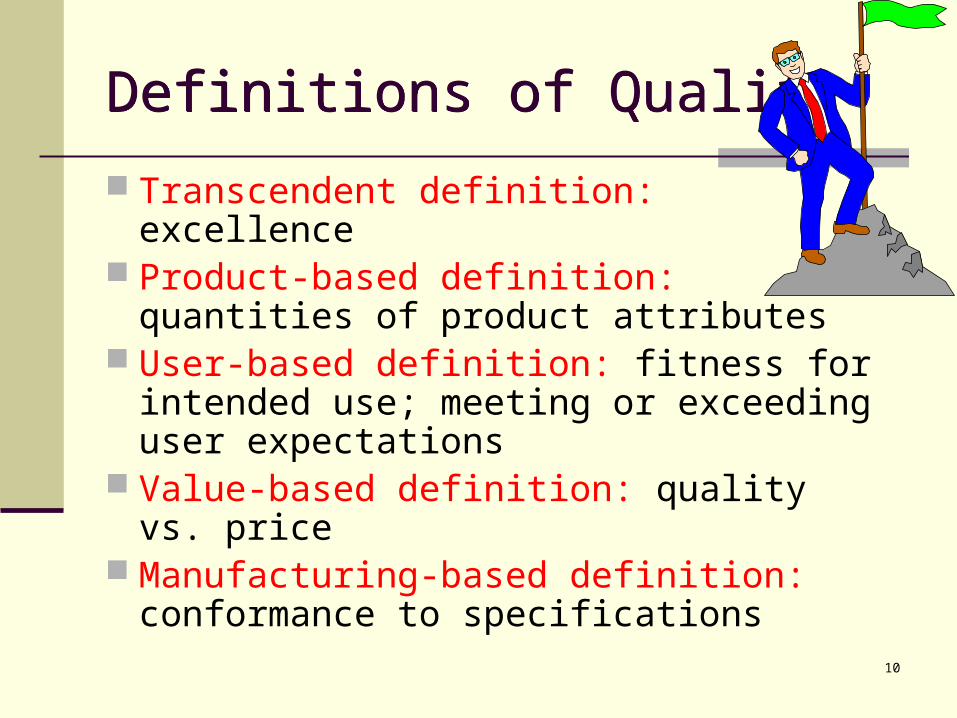
Definitions of QualityDefinitions of Quality
Transcendent definition: excellence Product-based definition: quantities of
product attributes User-based definition: fitness for intended
use; meeting or exceeding user expectations
Value-based definition: quality vs. price Manufacturing-based definition:
conformance to specifications
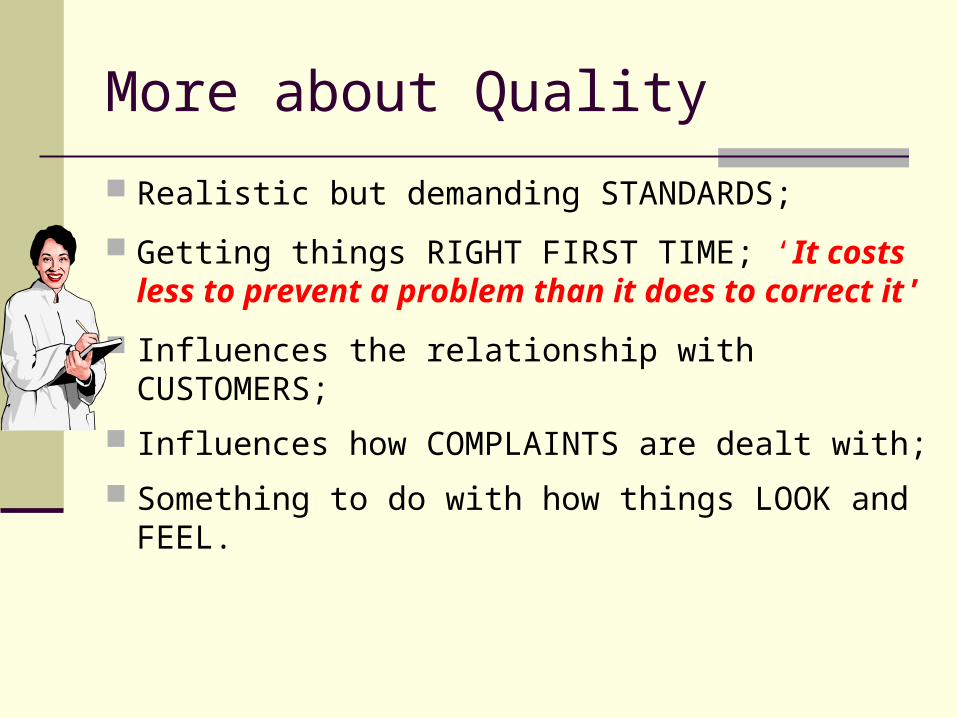
More about Quality
Realistic but demanding STANDARDS;
Getting things RIGHT FIRST TIME; ‘It costs less to prevent a problem than it does to correct it’
Influences the relationship with CUSTOMERS;
Influences how COMPLAINTS are dealt with;
Something to do with how things LOOK and FEEL.
12
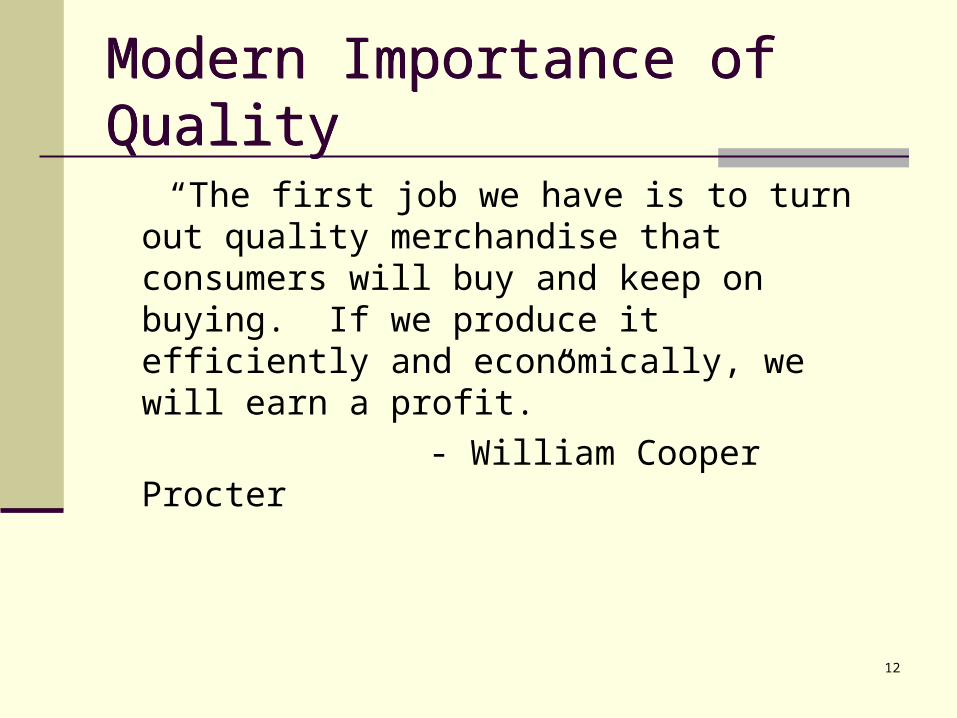
Modern Importance of QualityModern Importance of Quality
“The first job we have is to turn out quality merchandise that consumers will buy and keep on buying. If we produce it efficiently and economically, we will earn a profit.”
- William Cooper Procter
13
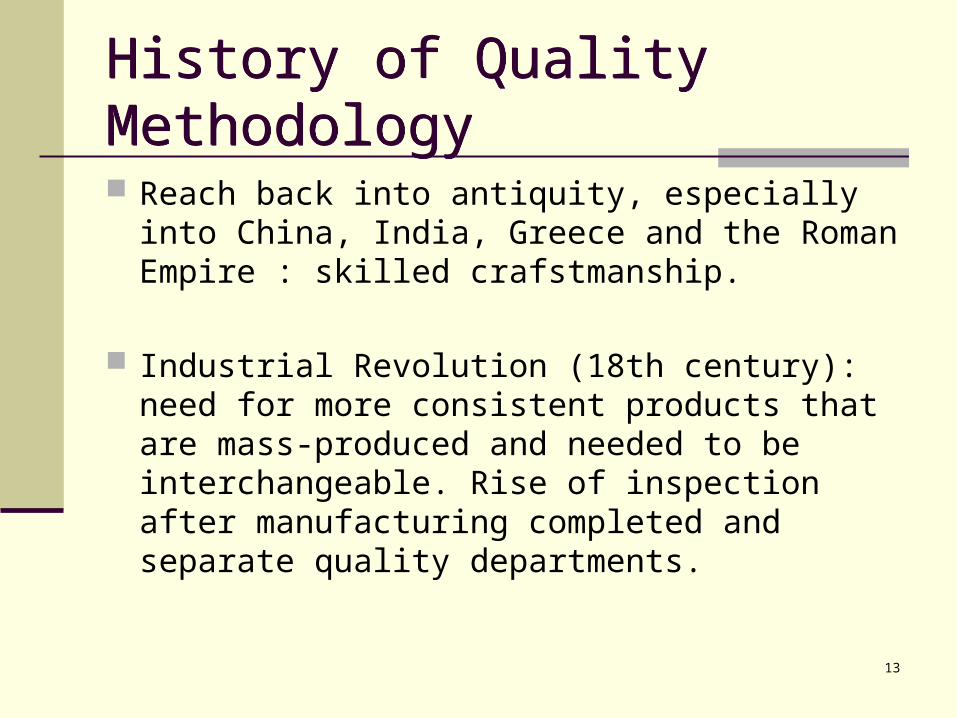
History of Quality MethodologyHistory of Quality Methodology
Reach back into antiquity, especially into China, India, Greece and the Roman Empire : skilled crafstmanship.
Industrial Revolution (18th century): need for more consistent products that are mass-produced and needed to be interchangeable. Rise of inspection after manufacturing completed and separate quality departments.
14
History of Quality MethodologyHistory of Quality Methodology
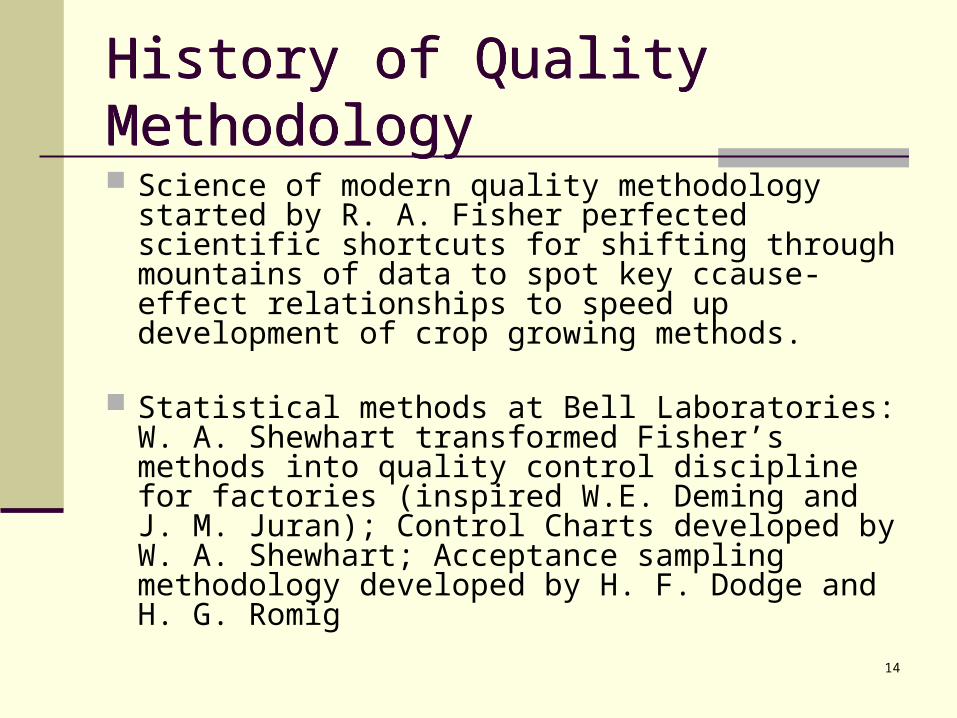
Science of modern quality methodology started by R. A. Fisher perfected scientific shortcuts for shifting through mountains of data to spot key ccause-effect relationships to speed up development of crop growing methods.
Statistical methods at Bell Laboratories: W. A. Shewhart transformed Fisher’s methods into quality control discipline for factories (inspired W.E. Deming and J. M. Juran); Control Charts developed by W. A. Shewhart; Acceptance sampling methodology developed by H. F. Dodge and H. G. Romig
15
History of Quality MethodologyHistory of Quality Methodology
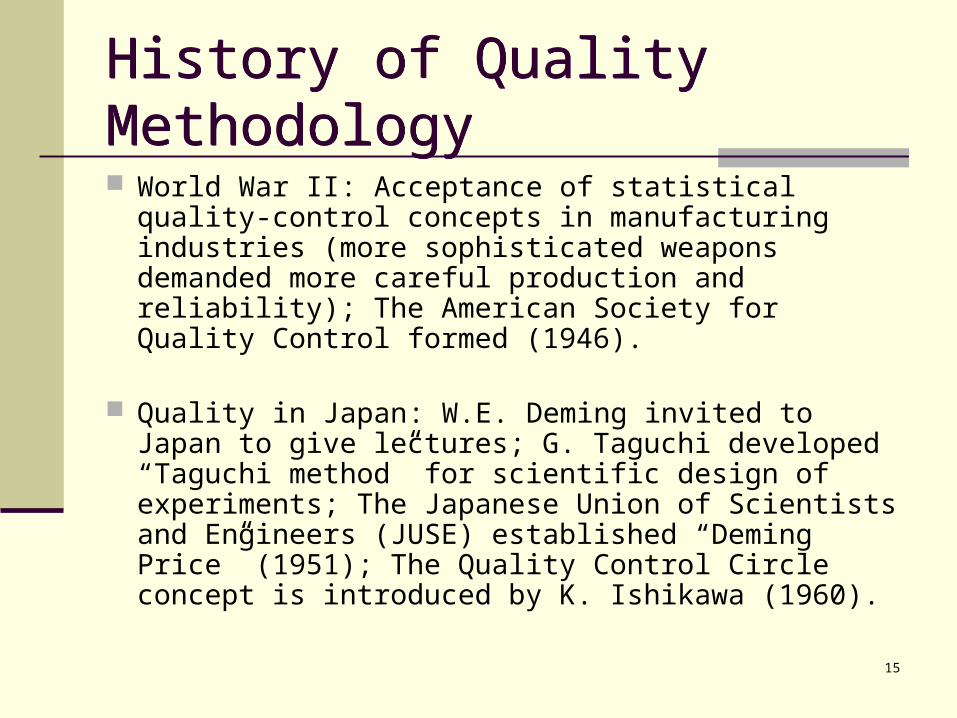
World War II: Acceptance of statistical quality-control concepts in manufacturing industries (more sophisticated weapons demanded more careful production and reliability); The American Society for Quality Control formed (1946).
Quality in Japan: W.E. Deming invited to Japan to give lectures; G. Taguchi developed “Taguchi method” for scientific design of experiments; The Japanese Union of Scientists and Engineers (JUSE) established “Deming Price” (1951); The Quality Control Circle concept is introduced by K. Ishikawa (1960).
16
History of Quality MethodologyHistory of Quality Methodology
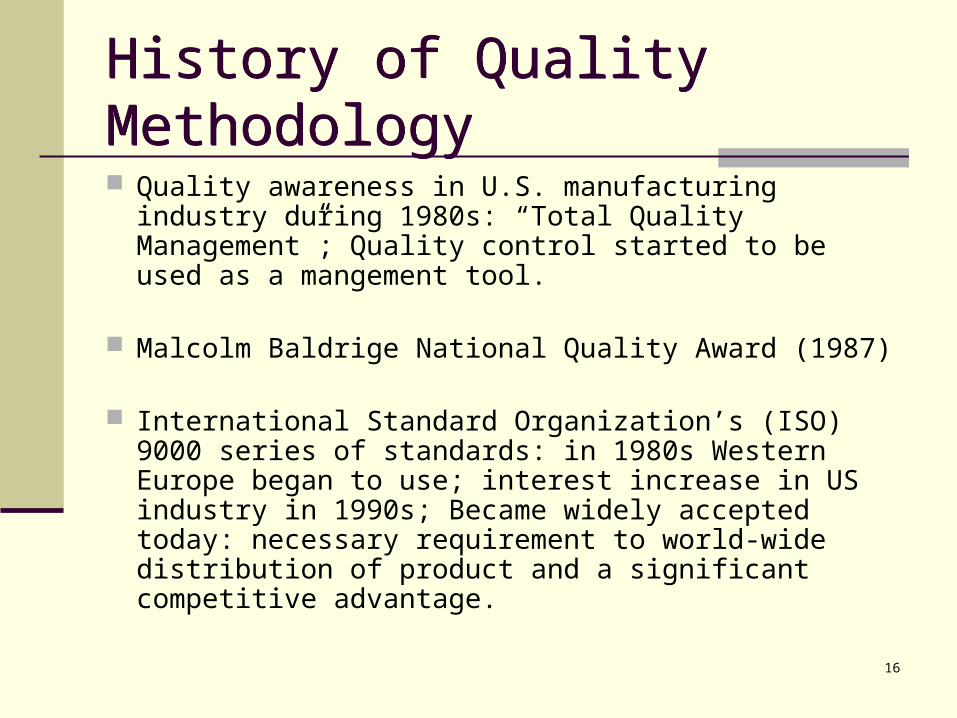
Quality awareness in U.S. manufacturing industry during 1980s: “Total Quality Management”; Quality control started to be used as a mangement tool.
Malcolm Baldrige National Quality Award (1987)
International Standard Organization’s (ISO) 9000 series of standards: in 1980s Western Europe began to use; interest increase in US industry in 1990s; Became widely accepted today: necessary requirement to world-wide distribution of product and a significant competitive advantage.
17
History of Quality MethodologyHistory of Quality Methodology
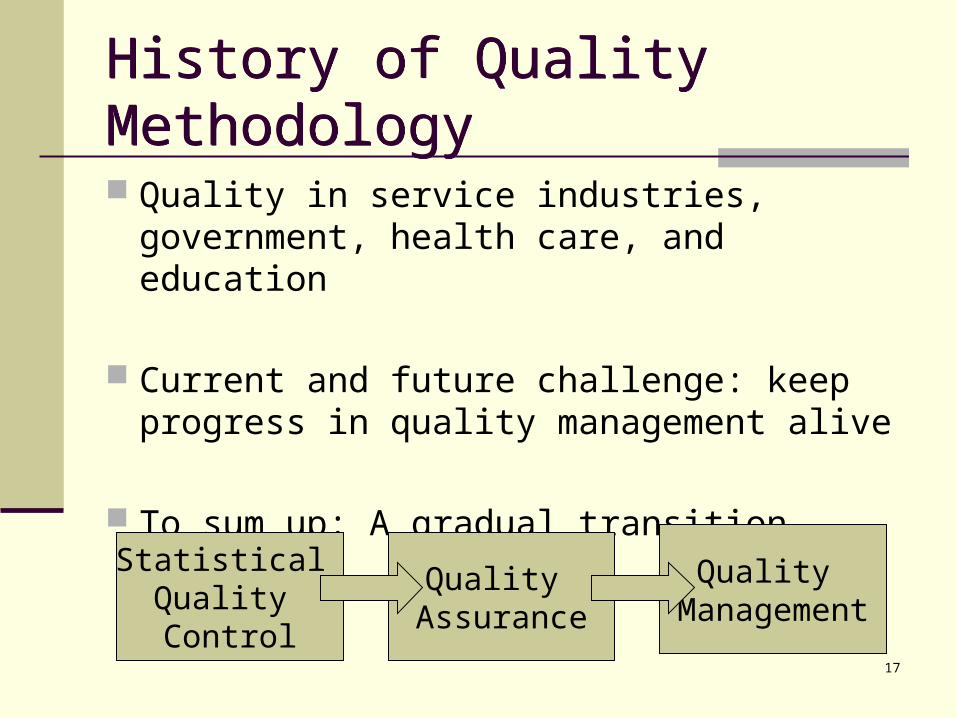
Quality in service industries, government, health care, and education
Current and future challenge: keep progress in quality management alive
To sum up: A gradual transition
Statistical Quality Control
Quality Assurance
Quality Management
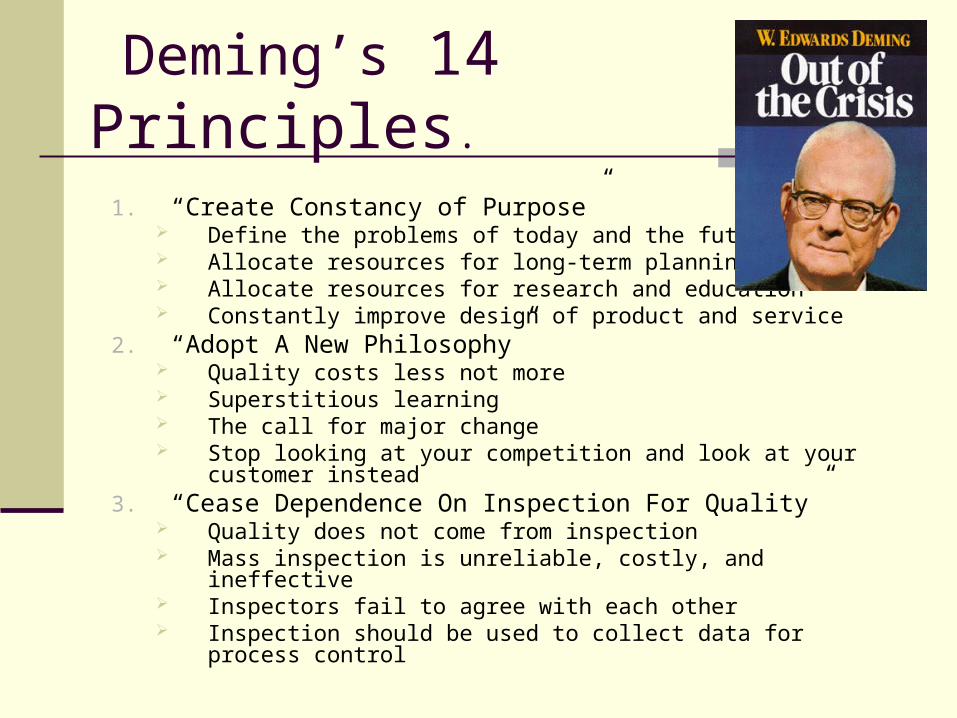
Deming’s 14 Principles.
1. “Create Constancy of Purpose” Define the problems of today and the future Allocate resources for long-term planning Allocate resources for research and education Constantly improve design of product and service
2. “Adopt A New Philosophy” Quality costs less not more Superstitious learning The call for major change Stop looking at your competition and look at your customer
instead3. “Cease Dependence On Inspection For Quality”
Quality does not come from inspection Mass inspection is unreliable, costly, and ineffective Inspectors fail to agree with each other Inspection should be used to collect data for process control
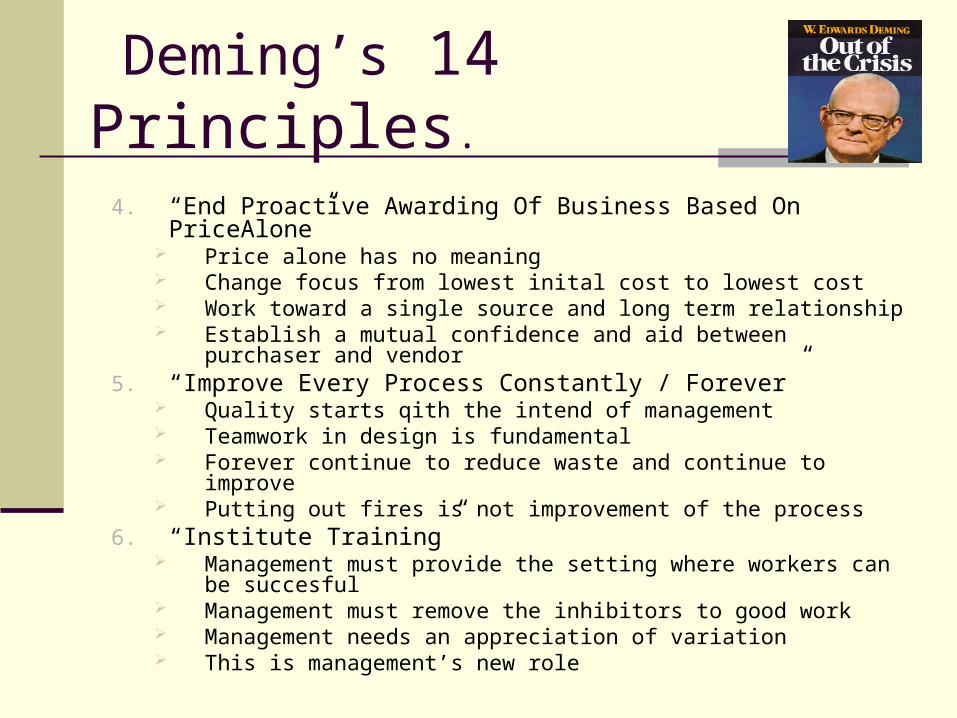
Deming’s 14 Principles.
4. “End Proactive Awarding Of Business Based On PriceAlone” Price alone has no meaning Change focus from lowest inital cost to lowest cost Work toward a single source and long term relationship Establish a mutual confidence and aid between purchaser and
vendor5. “Improve Every Process Constantly / Forever”
Quality starts qith the intend of management Teamwork in design is fundamental Forever continue to reduce waste and continue to improve Putting out fires is not improvement of the process
6. “Institute Training” Management must provide the setting where workers can be
succesful Management must remove the inhibitors to good work Management needs an appreciation of variation This is management’s new role
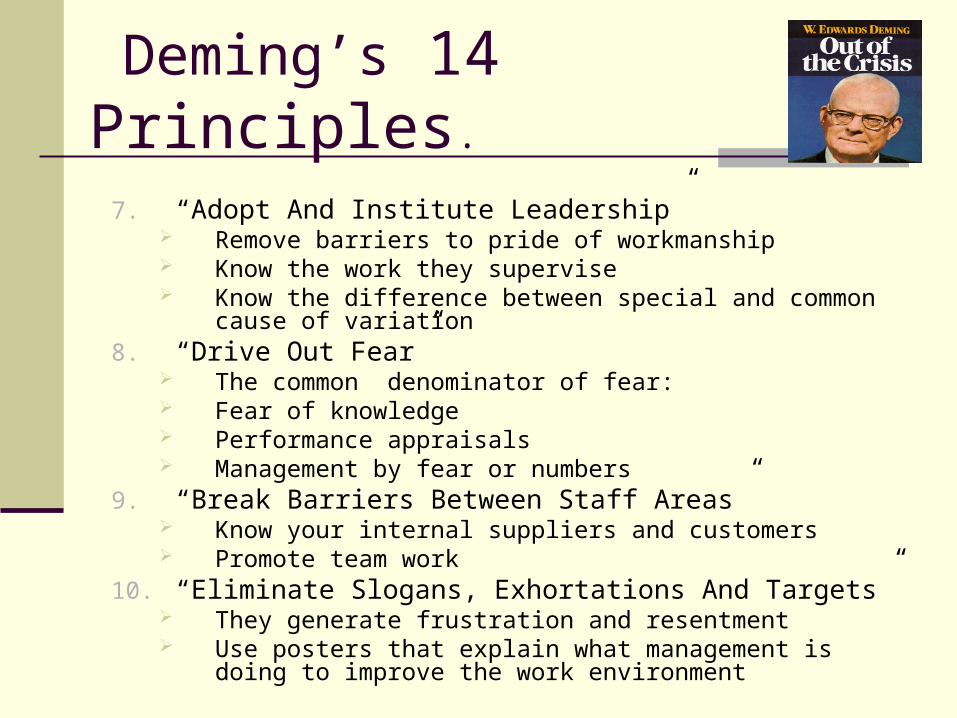
Deming’s 14 Principles.
7. “Adopt And Institute Leadership” Remove barriers to pride of workmanship Know the work they supervise Know the difference between special and common cause of
variation8. “Drive Out Fear”
The common denominator of fear: Fear of knowledge Performance appraisals Management by fear or numbers
9. “Break Barriers Between Staff Areas” Know your internal suppliers and customers Promote team work
10. “Eliminate Slogans, Exhortations And Targets” They generate frustration and resentment Use posters that explain what management is doing to improve
the work environment
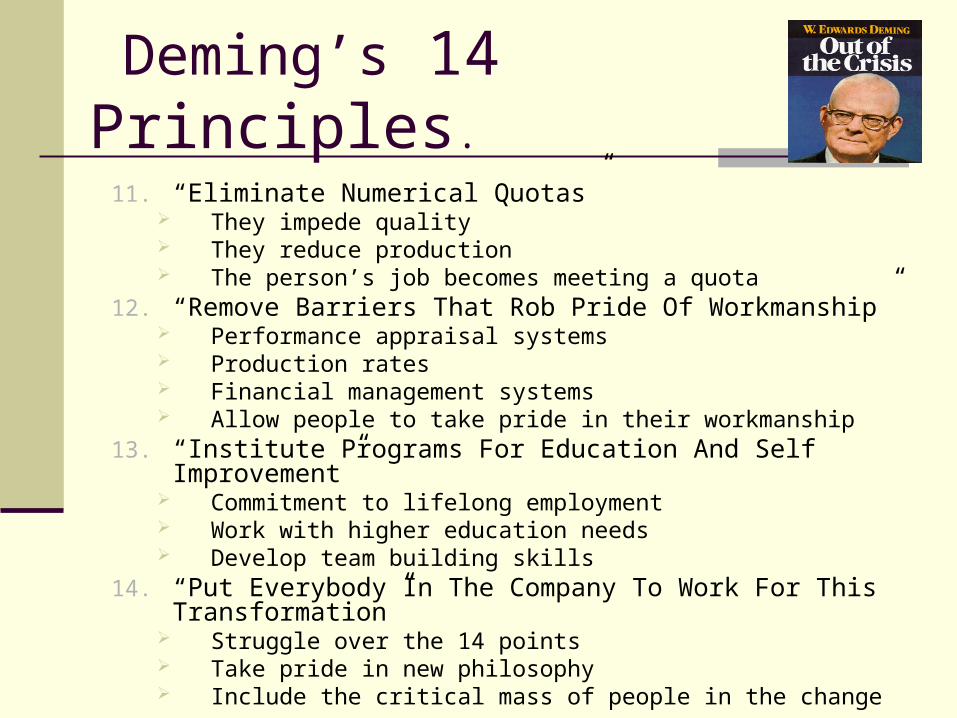
Deming’s 14 Principles.
11. “Eliminate Numerical Quotas” They impede quality They reduce production The person’s job becomes meeting a quota
12. “Remove Barriers That Rob Pride Of Workmanship” Performance appraisal systems Production rates Financial management systems Allow people to take pride in their workmanship
13. “Institute Programs For Education And Self Improvement” Commitment to lifelong employment Work with higher education needs Develop team building skills
14. “Put Everybody In The Company To Work For This Transformation”
Struggle over the 14 points Take pride in new philosophy Include the critical mass of people in the change
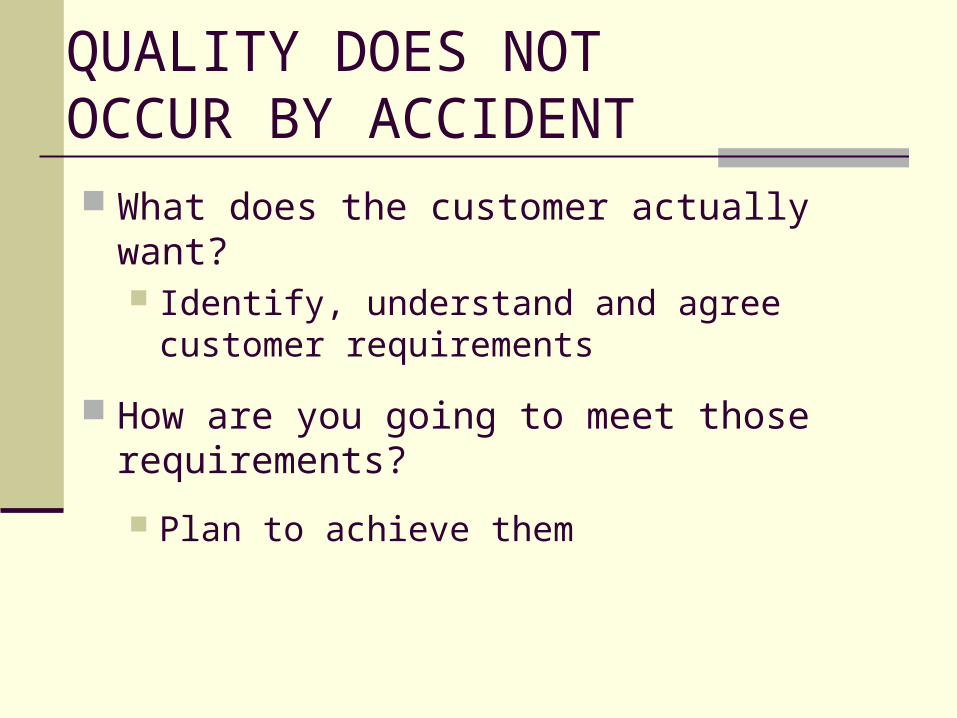
QUALITY DOES NOTOCCUR BY ACCIDENT What does the customer actually want?
Identify, understand and agreecustomer requirements
How are you going to meet those requirements?
Plan to achieve them
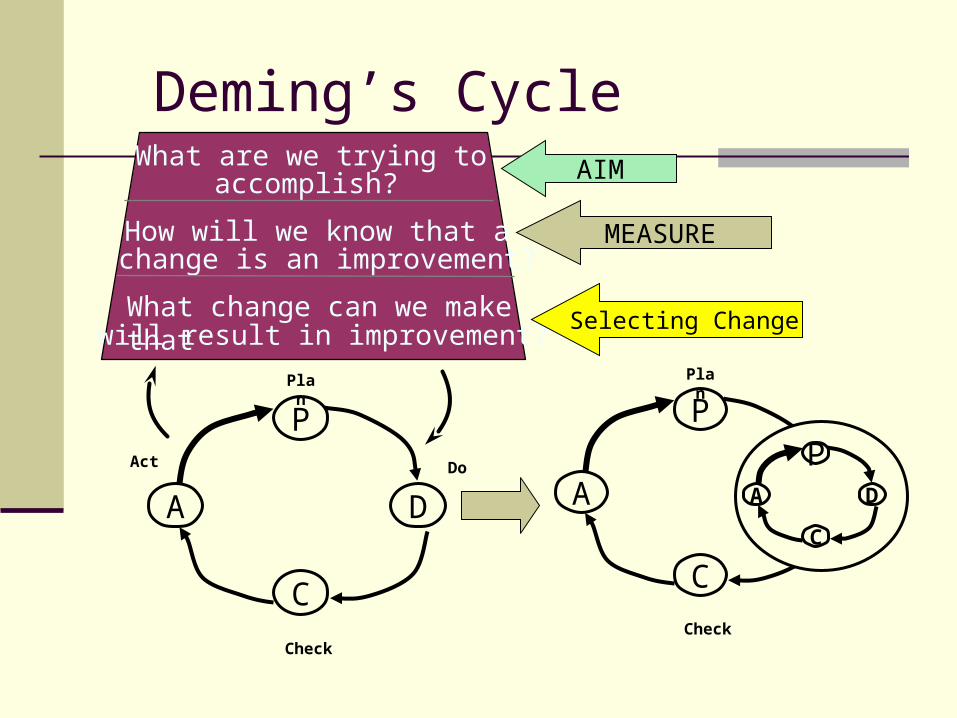
Deming’s Cycle
Act
A
P
D
C
Plan
Do
Check
A
P
D
C
Plan
Do
Check
A
PD
C
What are we trying toaccomplish?
How will we know that achange is an improvement?
AIM
MEASURE
What change can we make thatwill result in improvement?
Selecting Change
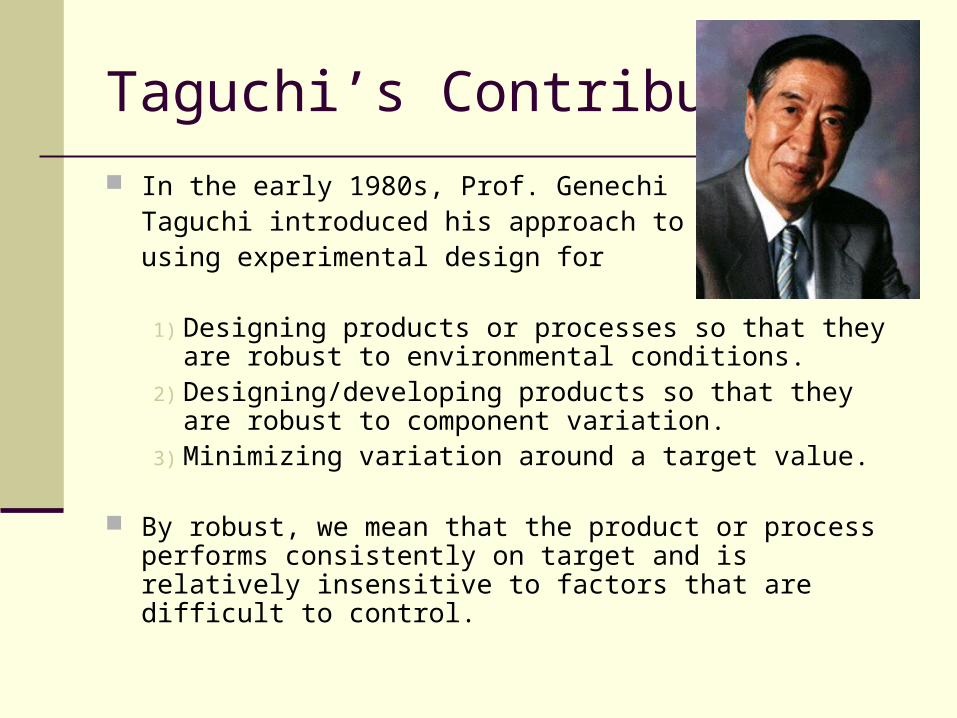
Taguchi’s Contribution
In the early 1980s, Prof. Genechi Taguchi introduced his approach to using experimental design for
1) Designing products or processes so that they are robust to environmental conditions.
2) Designing/developing products so that they are robust to component variation.
3) Minimizing variation around a target value.
By robust, we mean that the product or process performs consistently on target and is relatively insensitive to factors that are difficult to control.
Taguchi Philosophy
3 stages in a product’s (or process’s)
development:1) System design: uses scientific and
engineering principles to determine
the basic configuration.
2) Parameter design: specific values for the system parameters are determined.
3) Tolerance design: determine the best tolerances for the parameters.
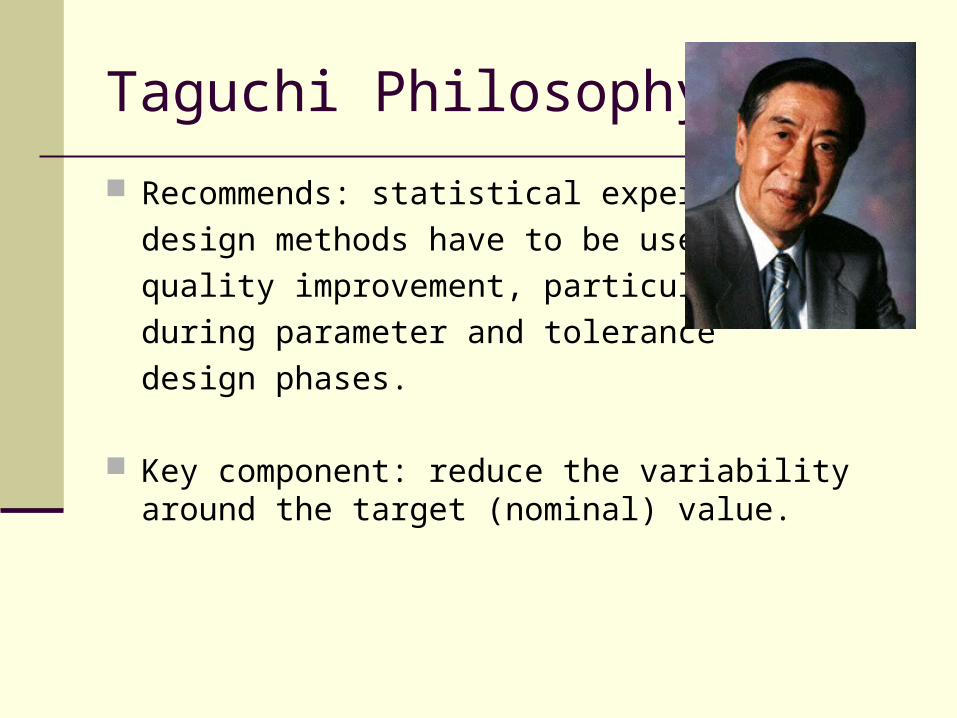
Taguchi Philosophy
Recommends: statistical experimental
design methods have to be used for
quality improvement, particularly
during parameter and tolerance
design phases.
Key component: reduce the variability around the target (nominal) value.
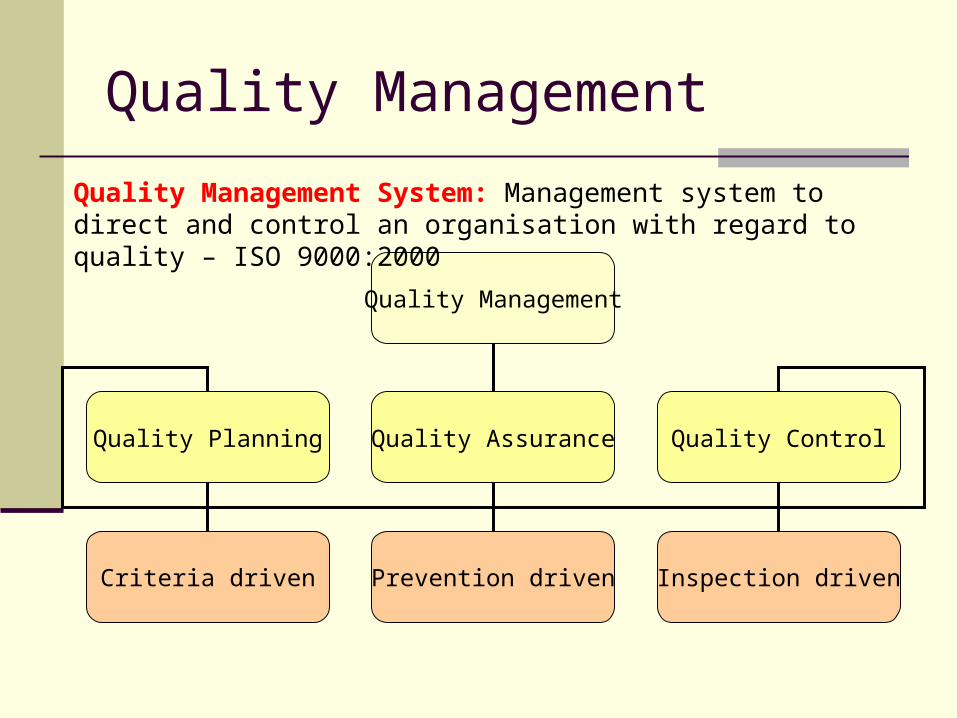
Quality Management
Quality Management
Quality Planning Quality Assurance Quality Control
Criteria driven Prevention driven Inspection driven
Quality Management System: Management system to direct and control an organisation with regard to quality – ISO 9000:2000
Quality Management Components
Quality Planning It identifies the standards and determines how to
satisfy those standards. It lays out the roles and responsibilities, resources,
procedures, and processes to be utilized for quality control and quality assurance.
Quality Assurance It is the review to ensure aligning with the quality
standards. An assessment will be provided here. Planned and systematic quality activities. Provide the confidence that the standards will be met.
Quality Control – Inspection Driven
Quality Control It addresses the assessment conducted during
Quality Assurance for corrective actions. Measure specific results to determine that they
match the standards. Use of Statistical Process Control (SPC) : a
methodology for monitoring a process to identify special causes of variation and signal the need to take corrective action when appropriate.
SPC relies on control charts.
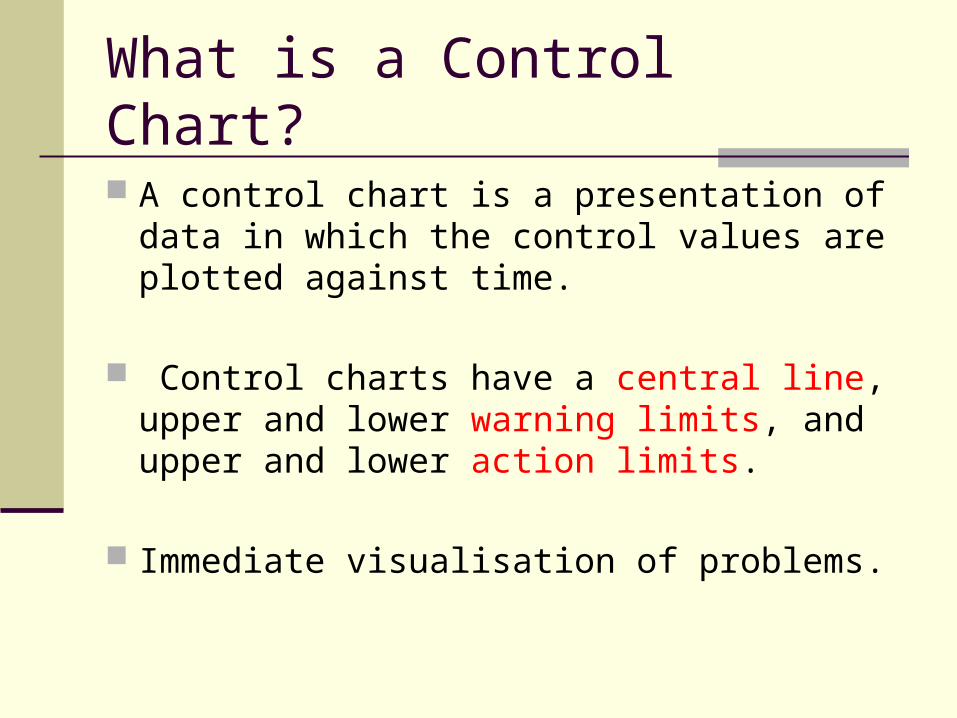
What is a Control Chart?
A control chart is a presentation of data in which the control values are plotted against time.
Control charts have a central line, upper and lower warning limits, and upper and lower action limits.
Immediate visualisation of problems.
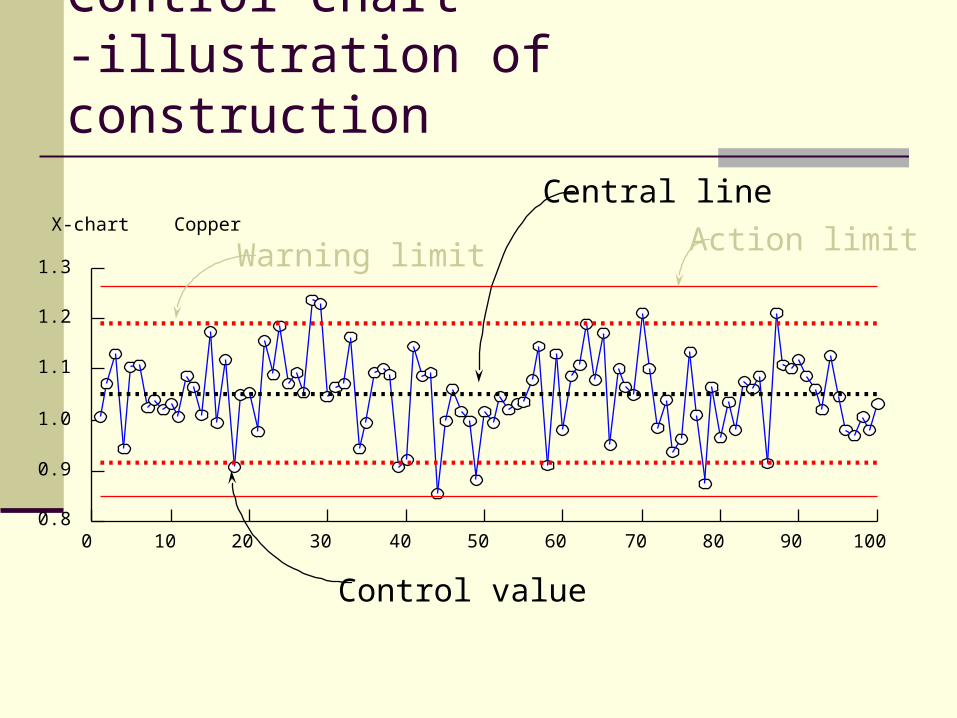
Control chart-illustration of construction
0 10 20 30 40 50 60 70 80 90 1000.8
0.9
1.0
1.1
1.2
1.3
X-chart Copper
Warning limit Action limit
Central line
Control value
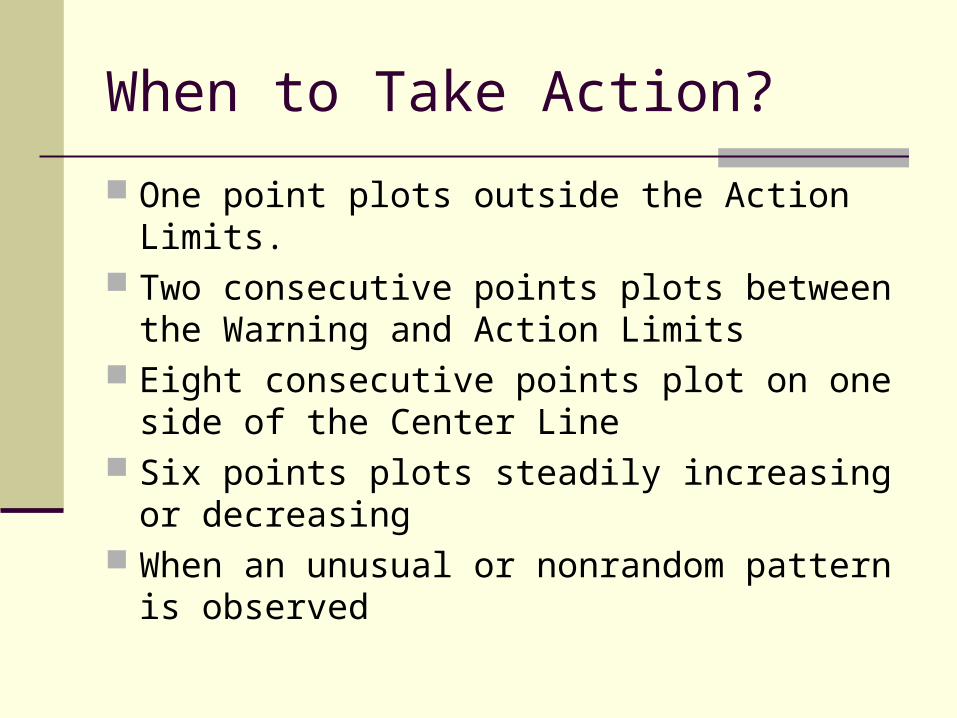
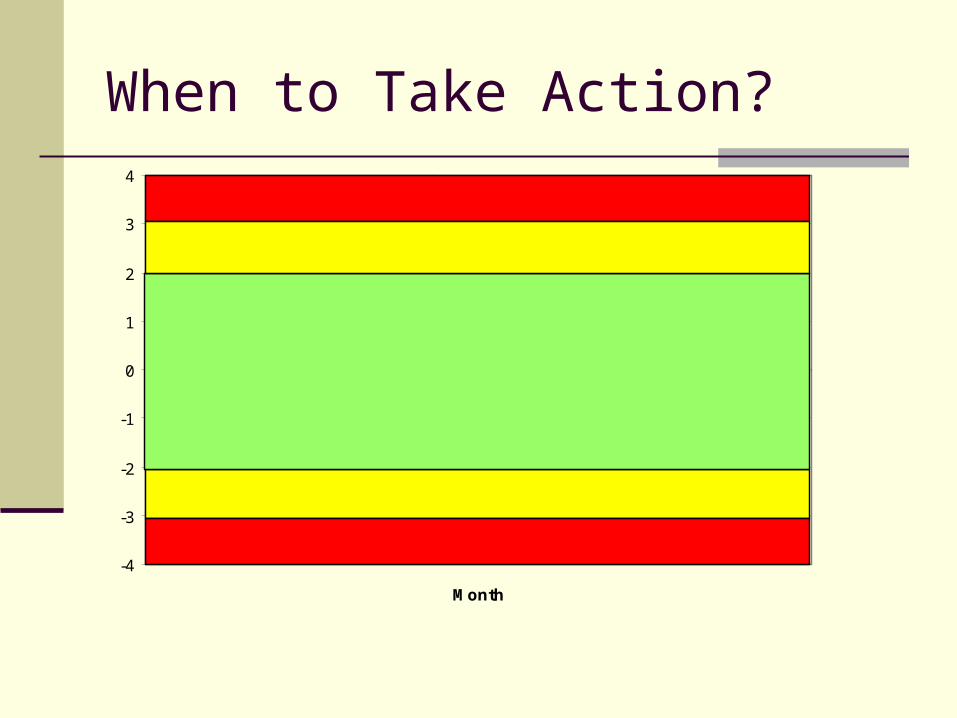
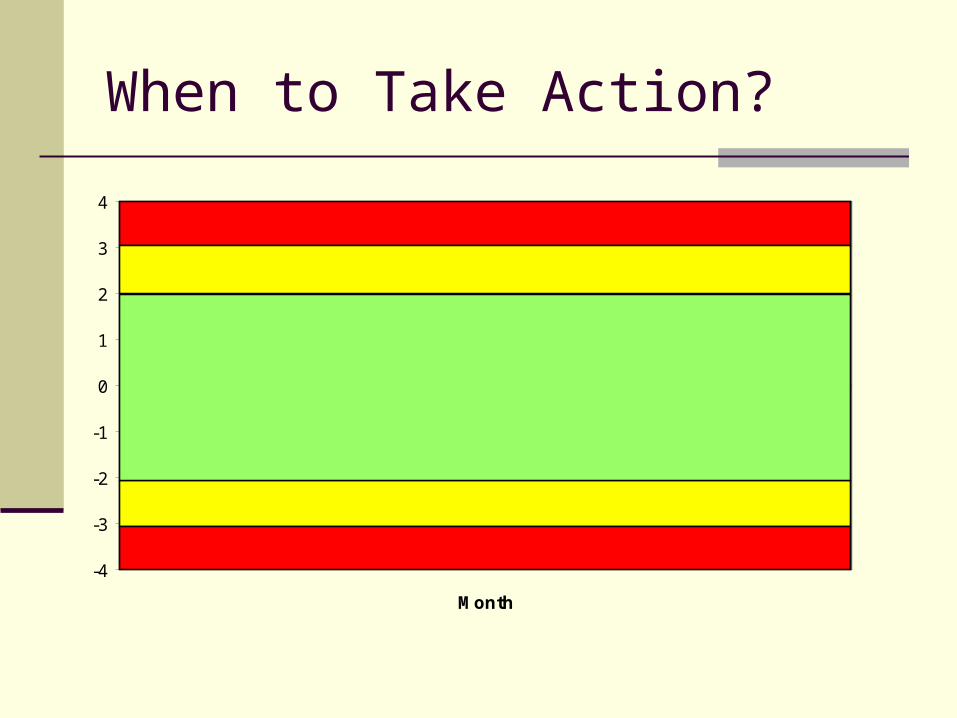
When to Take Action?
One point plots outside the Action Limits. Two consecutive points plots between the
Warning and Action Limits Eight consecutive points plot on one side of
the Center Line Six points plots steadily increasing or
decreasing When an unusual or nonrandom pattern is
observed
When to Take Action?
-4
-3
-2
-1
0
1
2
3
4
1 2 3 4 5 6 7 8 9 10 11 12 13 14 15
Month
When to Take Action?
-4
-3
-2
-1
0
1
2
3
4
1 2 3 4 5 6 7 8 9 10 11 12 13 14 15
Month
When to Take Action?
-4
-3
-2
-1
0
1
2
3
4
1 2 3 4 5 6 7 8 9 10 11 12 13 14 15
Month
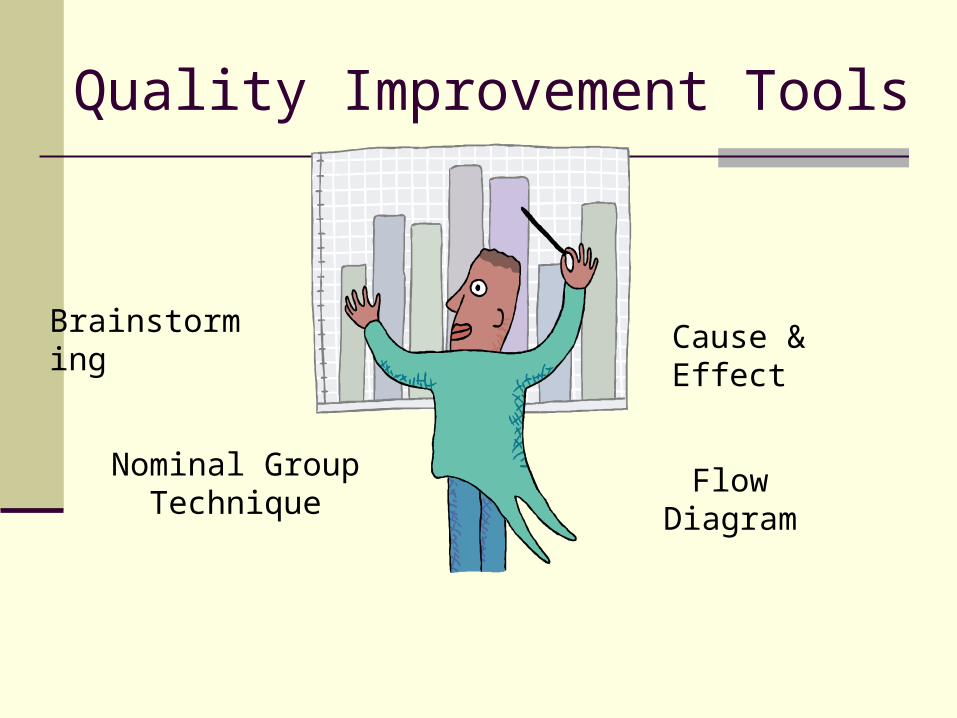
Quality Improvement Tools
Brainstorming
Flow DiagramNominal Group Technique
Cause & Effect
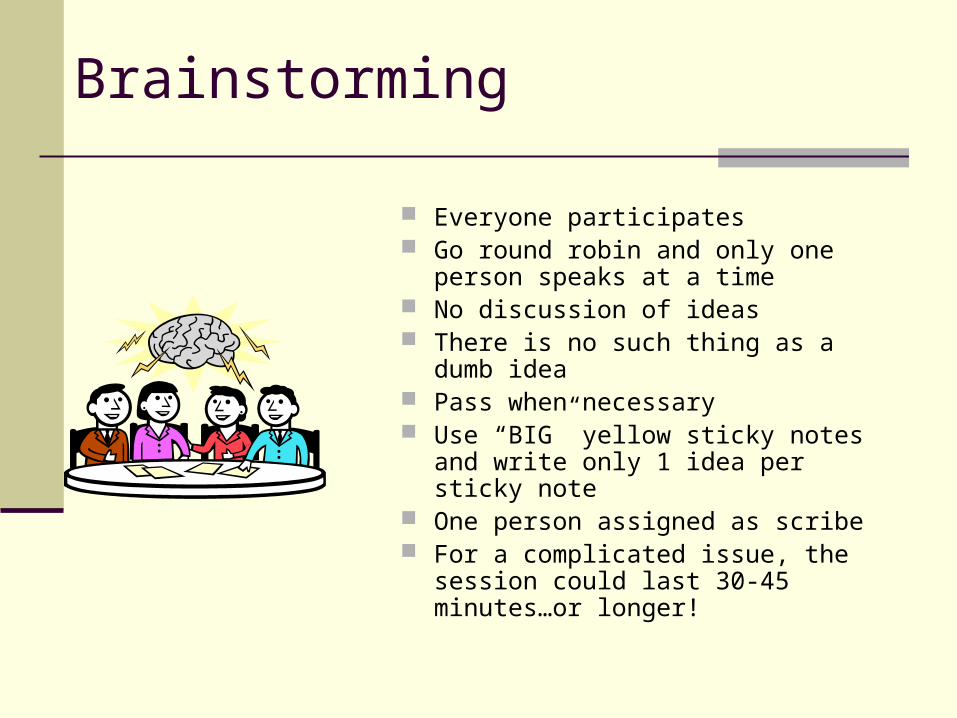
Brainstorming
Everyone participates Go round robin and only one person
speaks at a time No discussion of ideas There is no such thing as a dumb idea Pass when necessary Use “BIG” yellow sticky notes and
write only 1 idea per sticky note One person assigned as scribe For a complicated issue, the session
could last 30-45 minutes…or longer!
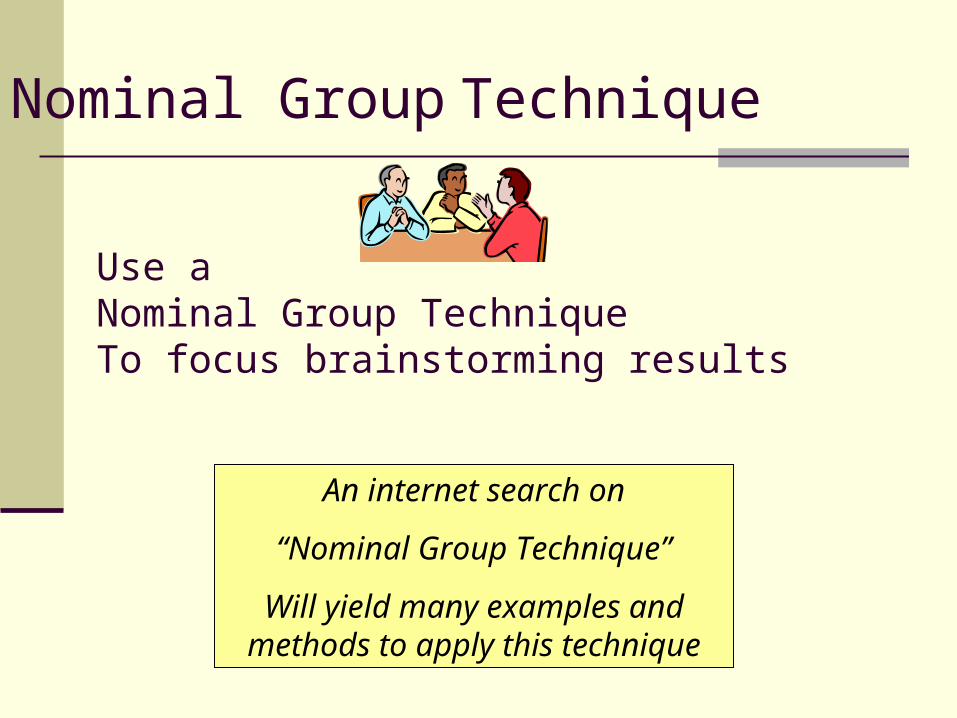
Use a Nominal Group TechniqueTo focus brainstorming results
An internet search on
“Nominal Group Technique”
Will yield many examples and methods to apply this technique
Nominal Group Technique
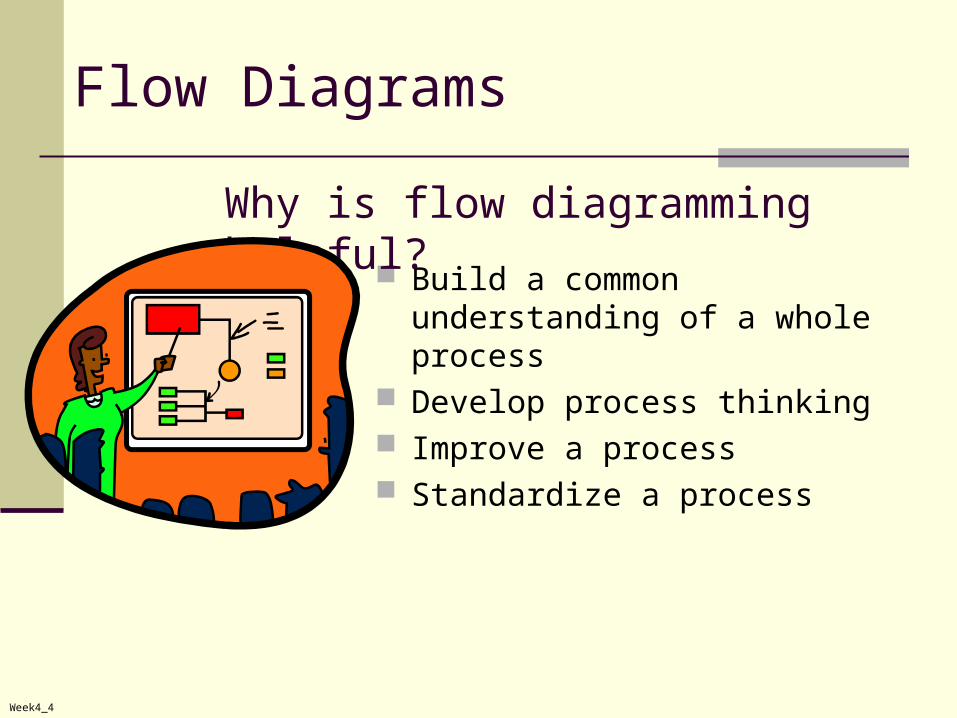
Flow Diagrams
Build a common understanding of a whole process
Develop process thinking Improve a process Standardize a process
Why is flow diagramming helpful?
Week4_4
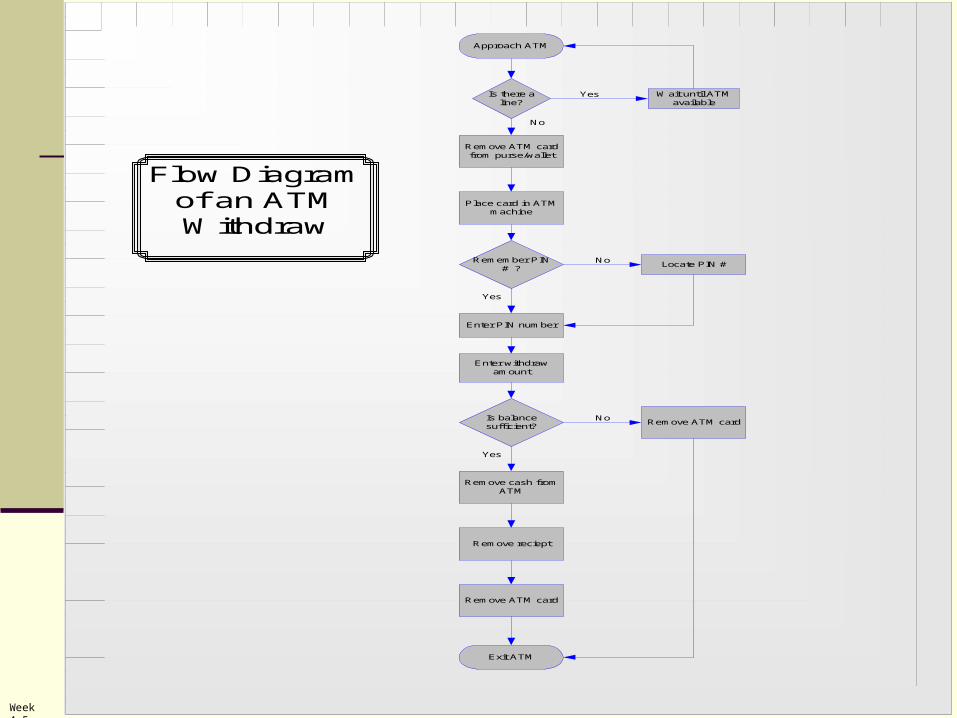
Approach ATM
Remove ATM cardfrom purse/wallet
Place card in ATMmachine
Enter PIN number
Enter withdrawamount
Is balancesufficient?
Remove cash fromATM
Remove reciept
Remove ATM card
Exit ATM
Is there aline?
Wait until ATMavailable
Remember PIN# ?
Remove ATM card
Locate PIN #
Flow Diagramof an ATMWithdraw
Yes
No
No
Yes
No
Yes
Week 4_5
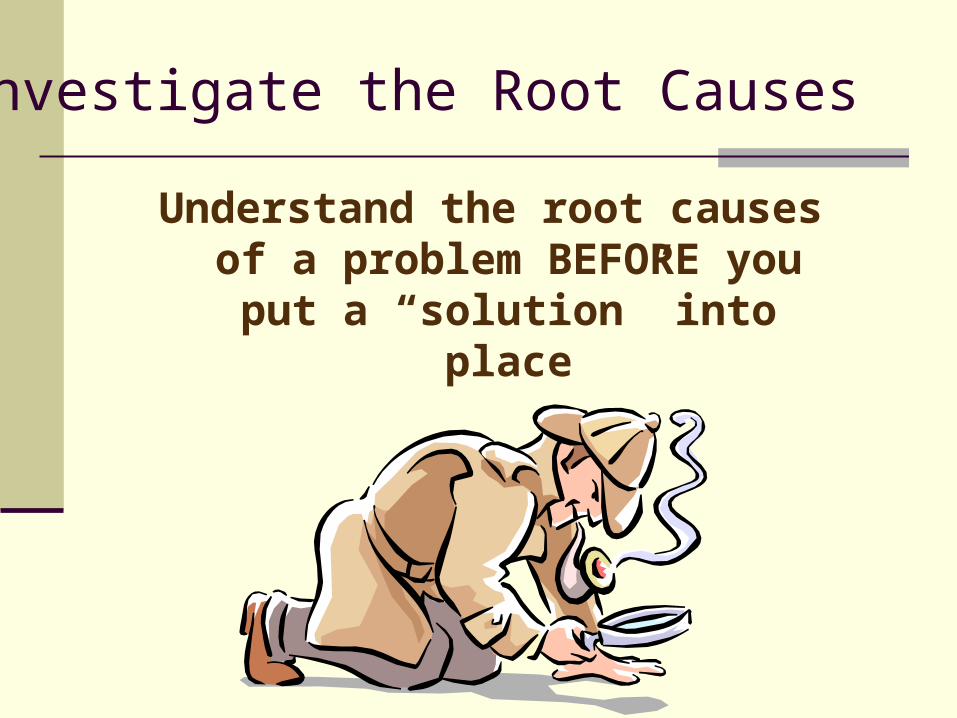
Understand the root causes of a problem BEFORE you put a
“solution” into place
Investigate the Root Causes
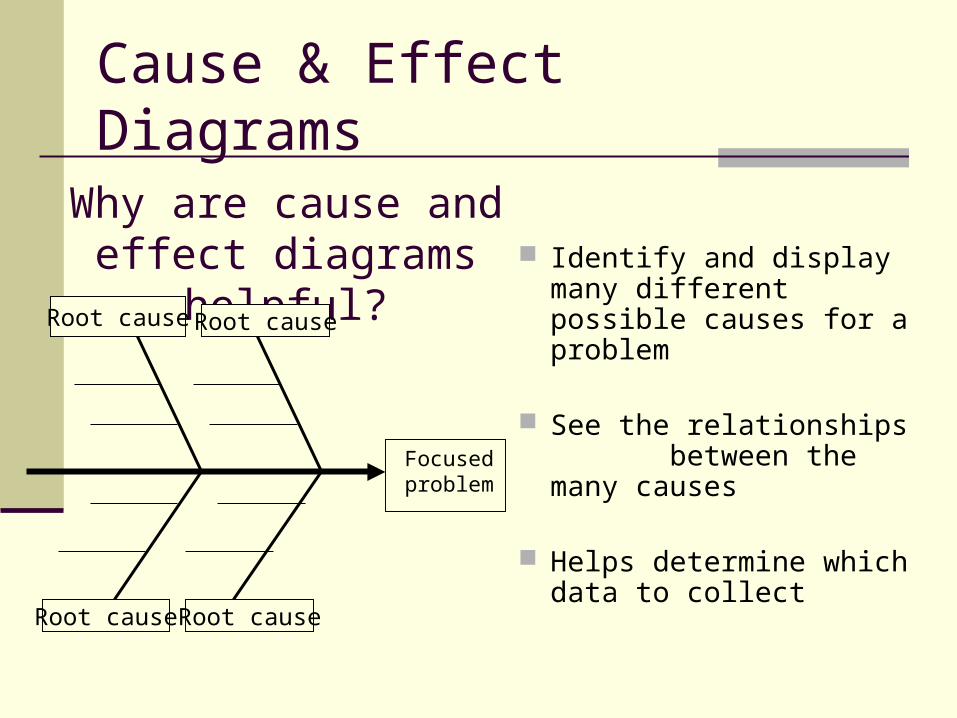
Cause & Effect Diagrams
Identify and display many different possible causes for a problem
See the relationships between the many causes
Helps determine which data to collect
Why are cause and effect diagrams
helpful?
Focused problem
Root cause Root cause
Root cause Root cause
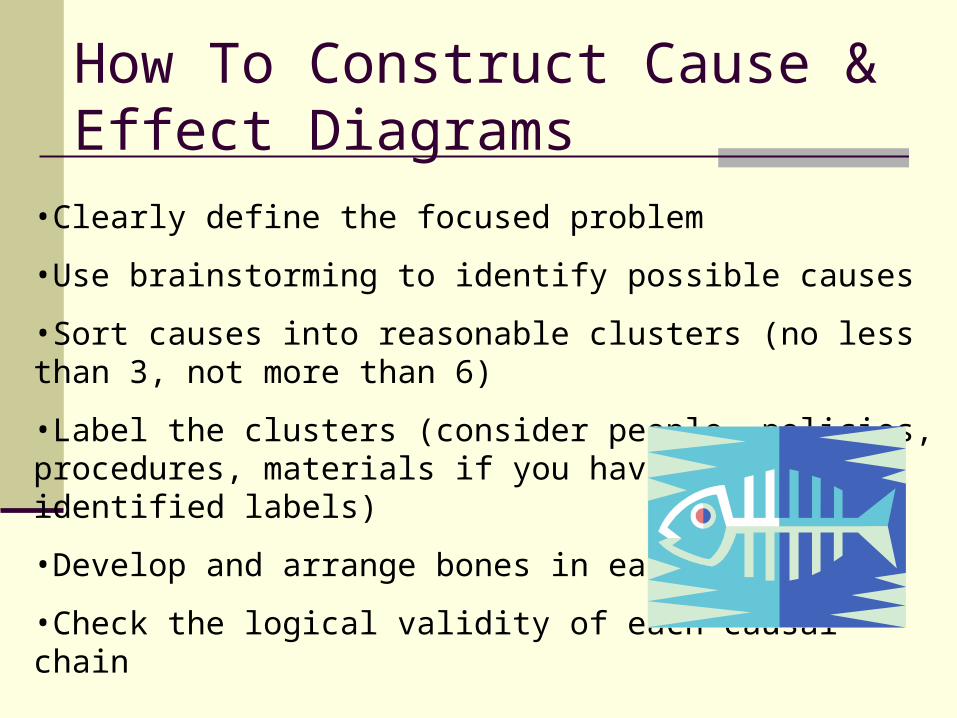
•Clearly define the focused problem
•Use brainstorming to identify possible causes
•Sort causes into reasonable clusters (no less than 3, not more than 6)
•Label the clusters (consider people, policies, procedures, materials if you have not already identified labels)
•Develop and arrange bones in each cluster
•Check the logical validity of each causal chain
How To Construct Cause & Effect Diagrams
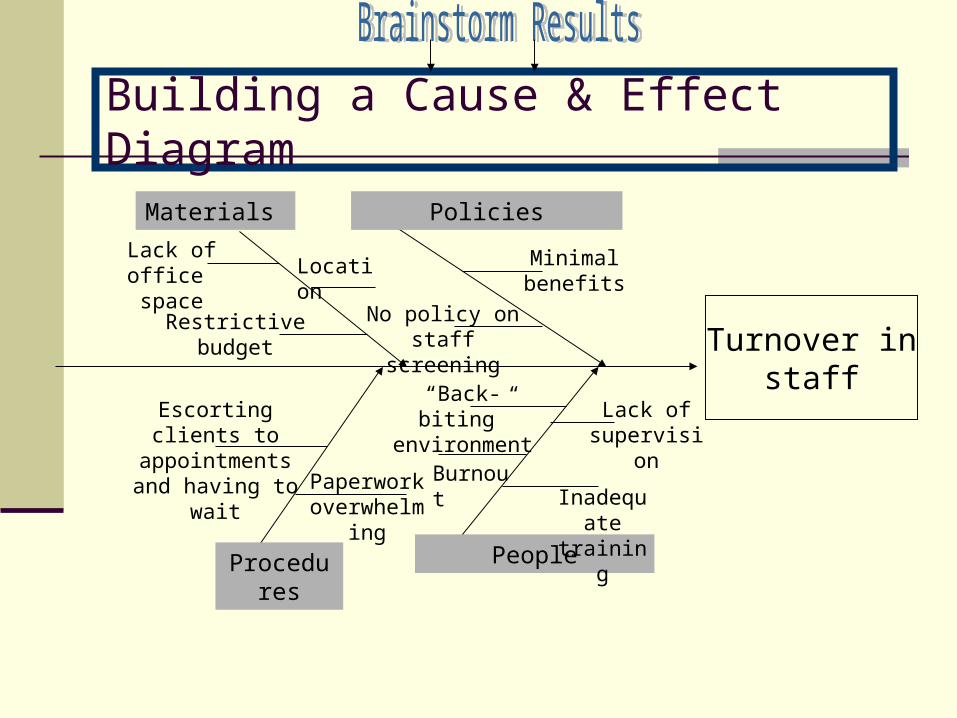
Building a Cause & Effect Diagram
Turnover instaff
Policies
PeopleProcedures
Materials
Inadequate training
Burnout
Lack of supervision
Minimal benefits
No policy on staff screening
Paperwork overwhelming
Lack of office space
“Back-biting” environment
Restrictive budget
Location
Escorting clients to appointments and
having to wait
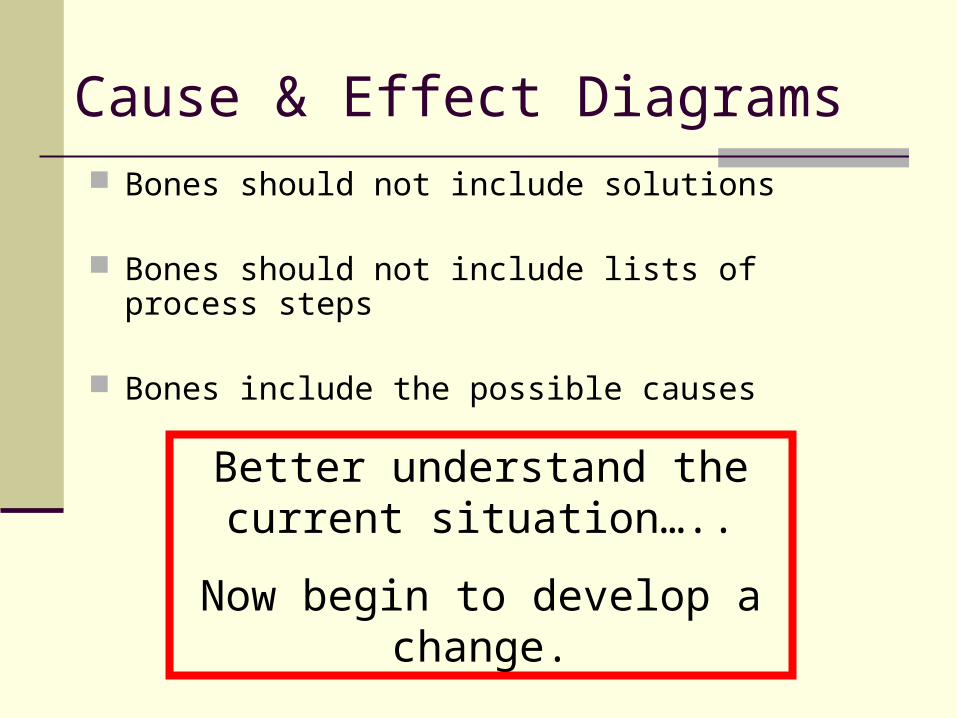
Cause & Effect Diagrams Bones should not include solutions
Bones should not include lists of process steps
Bones include the possible causes
Better understand the current situation…..
Now begin to develop a change.
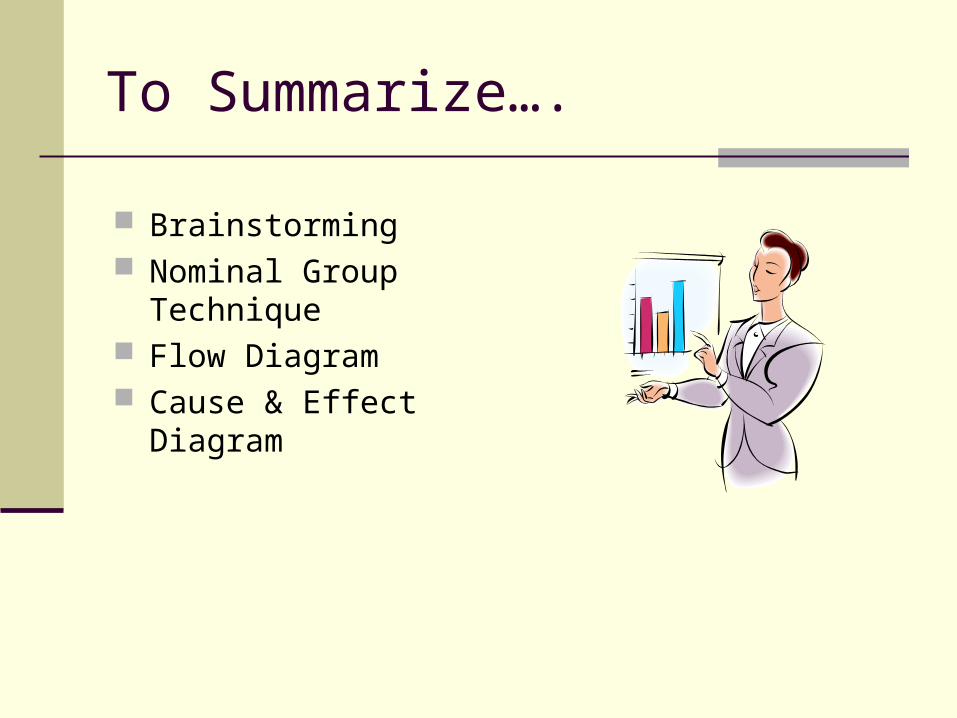
To Summarize….
Brainstorming Nominal Group Technique Flow Diagram Cause & Effect Diagram
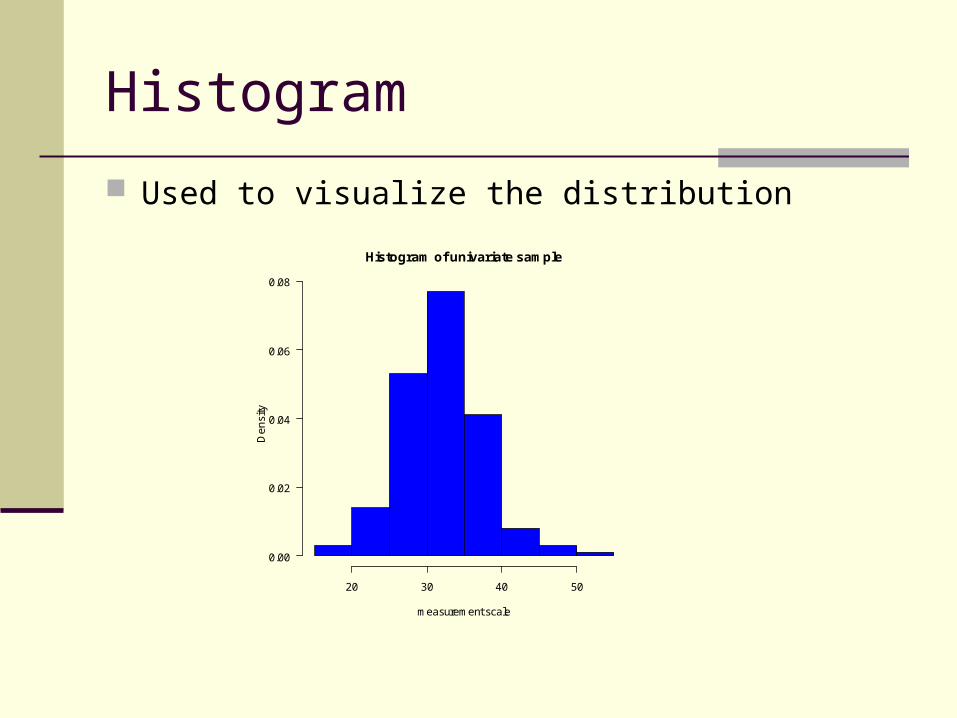
Histogram
Used to visualize the distribution
Histogram of univariate sample
measurement scale
De
nsi
ty
20 30 40 50
0.00
0.02
0.04
0.06
0.08
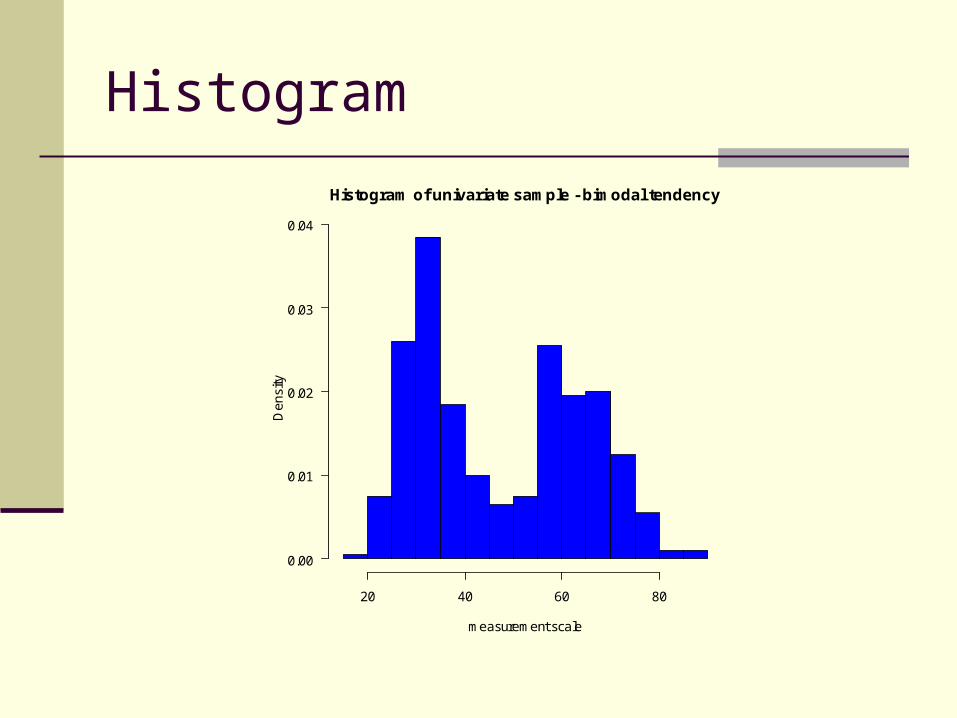
Histogram
Histogram of univariate sample - bimodal tendency
measurement scale
De
nsi
ty
20 40 60 80
0.00
0.01
0.02
0.03
0.04
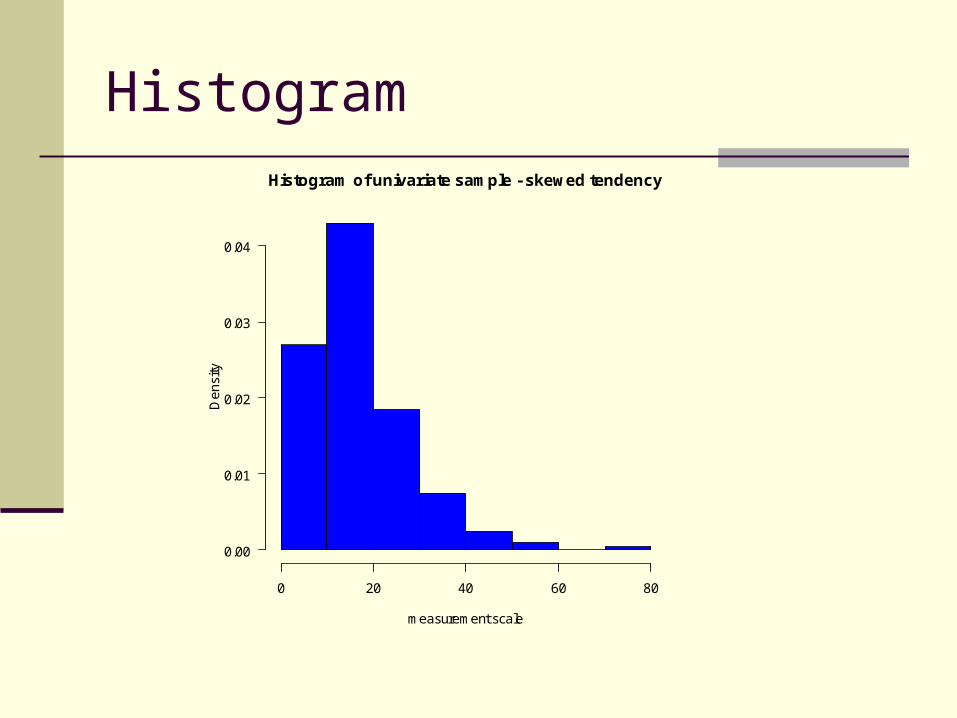
HistogramHistogram of univariate sample - skewed tendency
measurement scale
De
nsi
ty
0 20 40 60 80
0.00
0.01
0.02
0.03
0.04
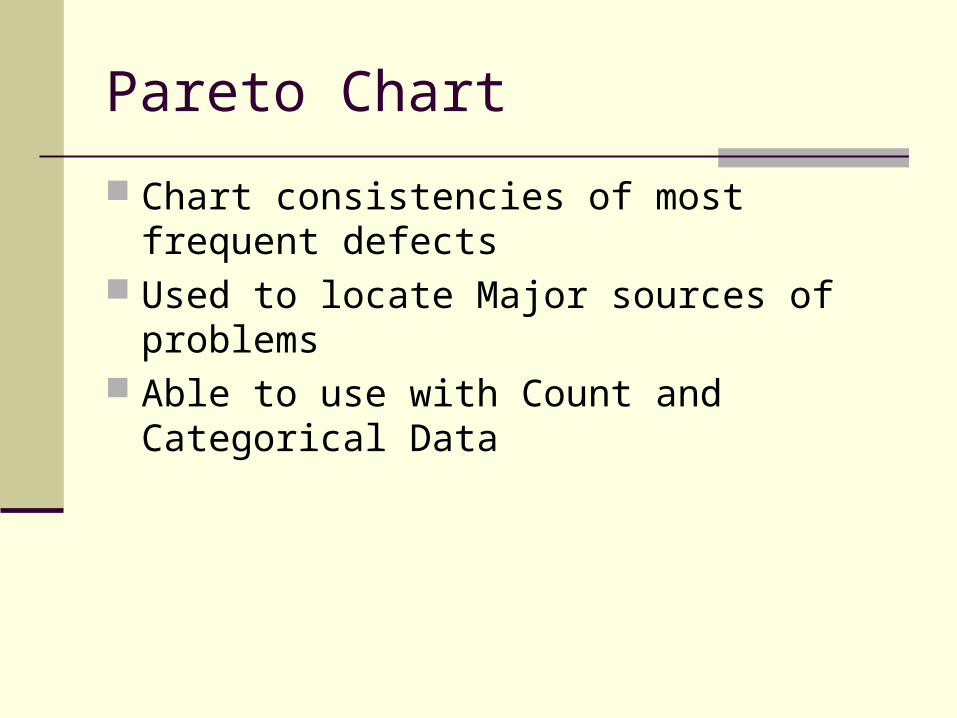
Pareto Chart
Chart consistencies of most frequent defects Used to locate Major sources of problems Able to use with Count and Categorical Data
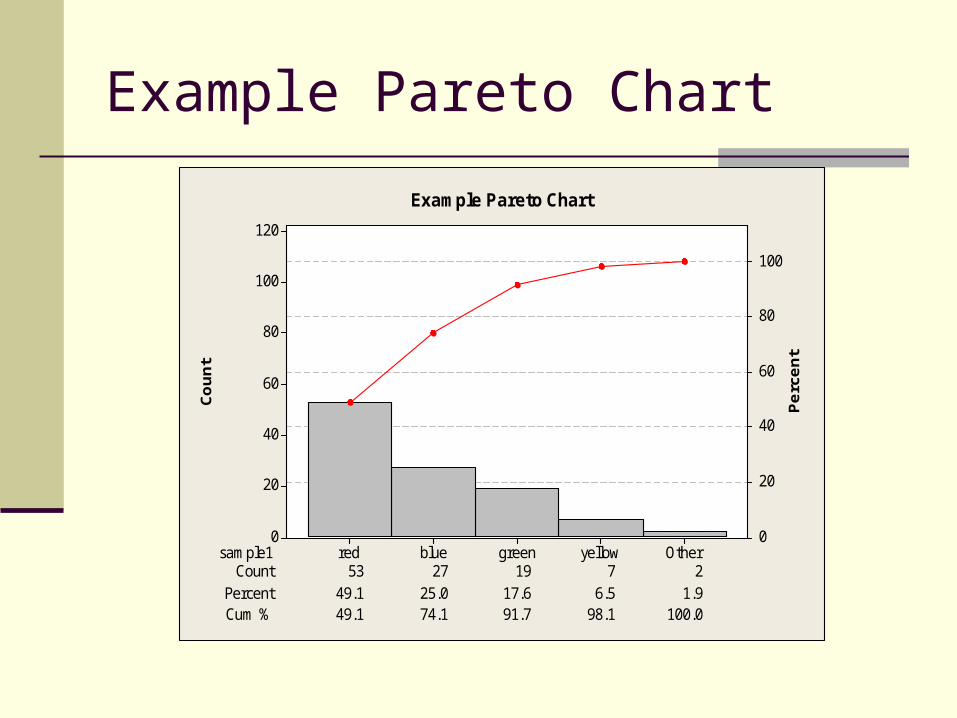
Count
Perc
ent
sample1Count
17.6 6.5 1.9Cum % 49.1 74.1 91.7 98.1 100.0
53 27 19 7 2Percent 49.1 25.0
Otheryellowgreenbluered
120
100
80
60
40
20
0
100
80
60
40
20
0
Example Pareto Chart
Example Pareto Chart
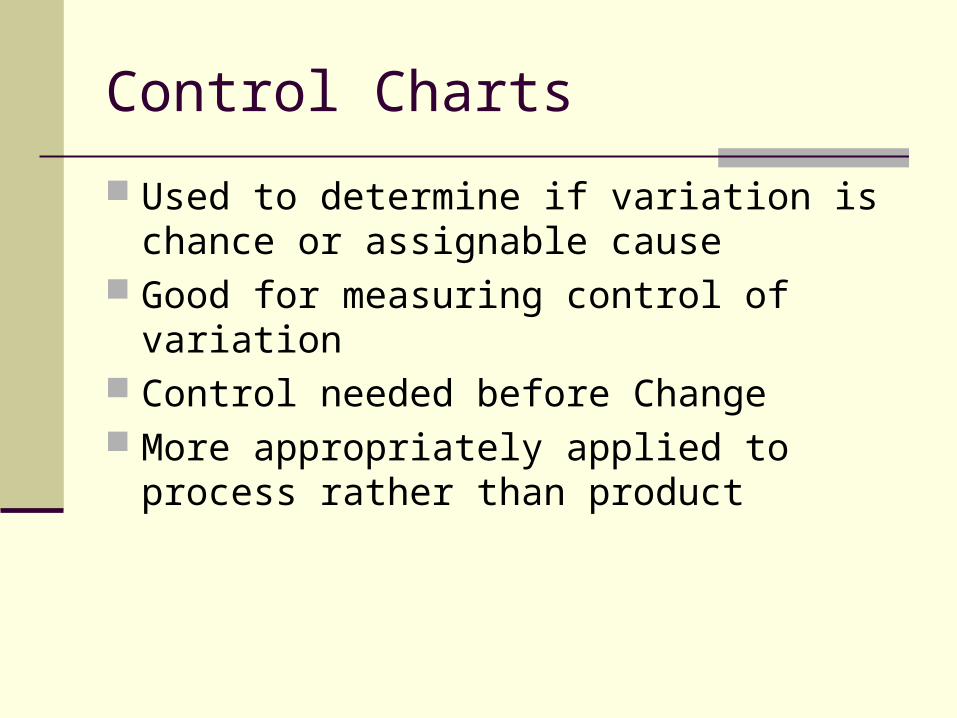
Used to determine if variation is chance or assignable cause
Good for measuring control of variation Control needed before Change More appropriately applied to process rather
than product
Control Charts
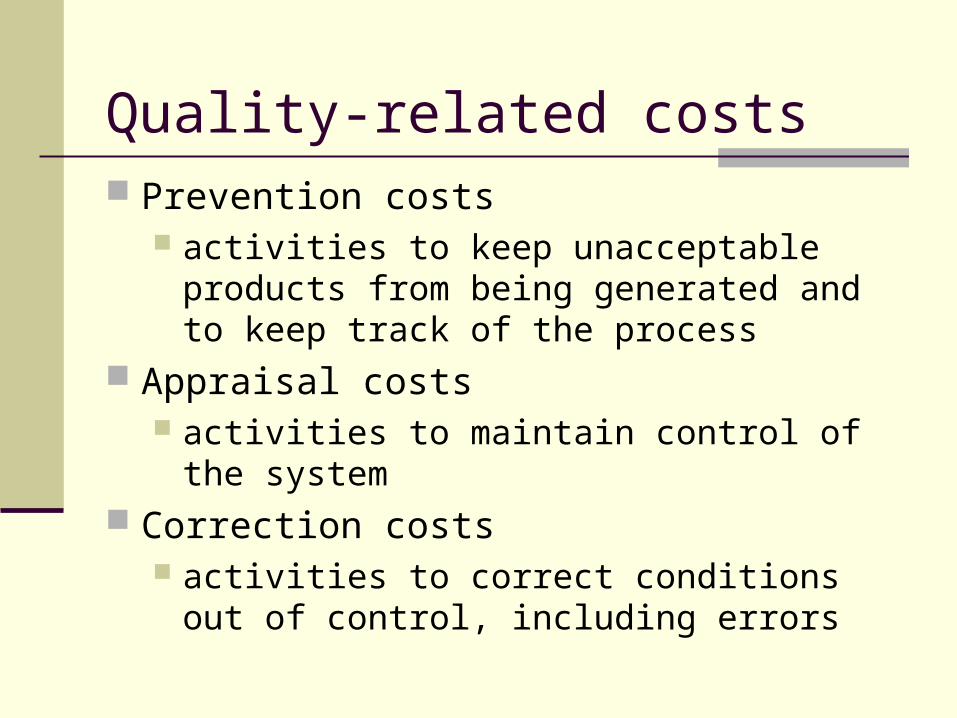
Quality-related costs Prevention costs
activities to keep unacceptable products from being generated and to keep track of the process
Appraisal costs activities to maintain control of the system
Correction costs activities to correct conditions out of control,
including errors
Prevention costs
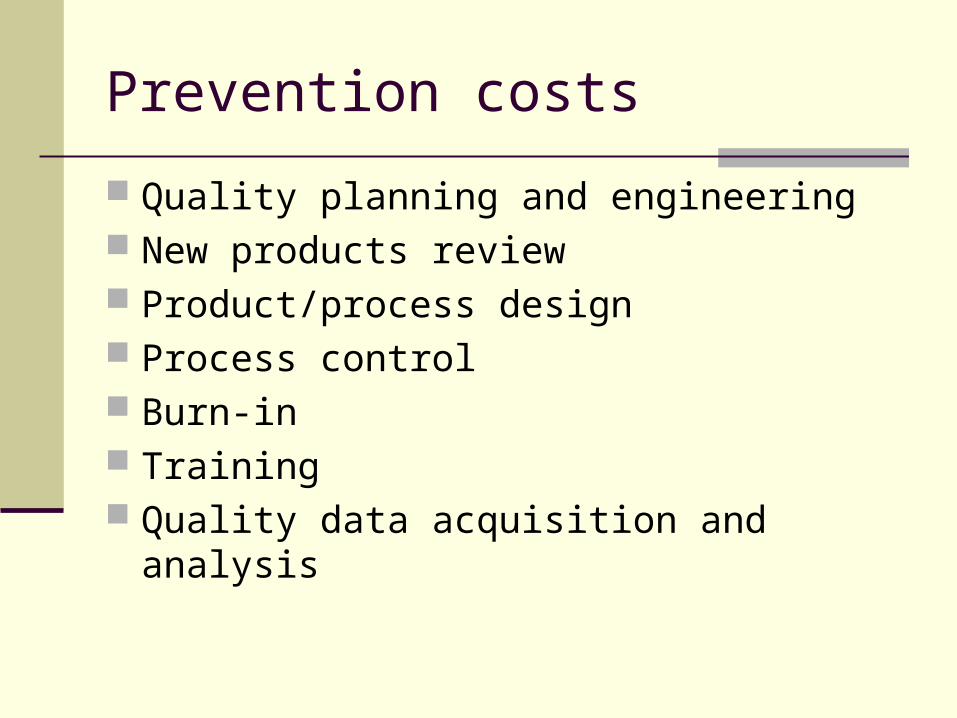
Quality planning and engineering New products review Product/process design Process control Burn-in Training Quality data acquisition and analysis
Appraisal costs
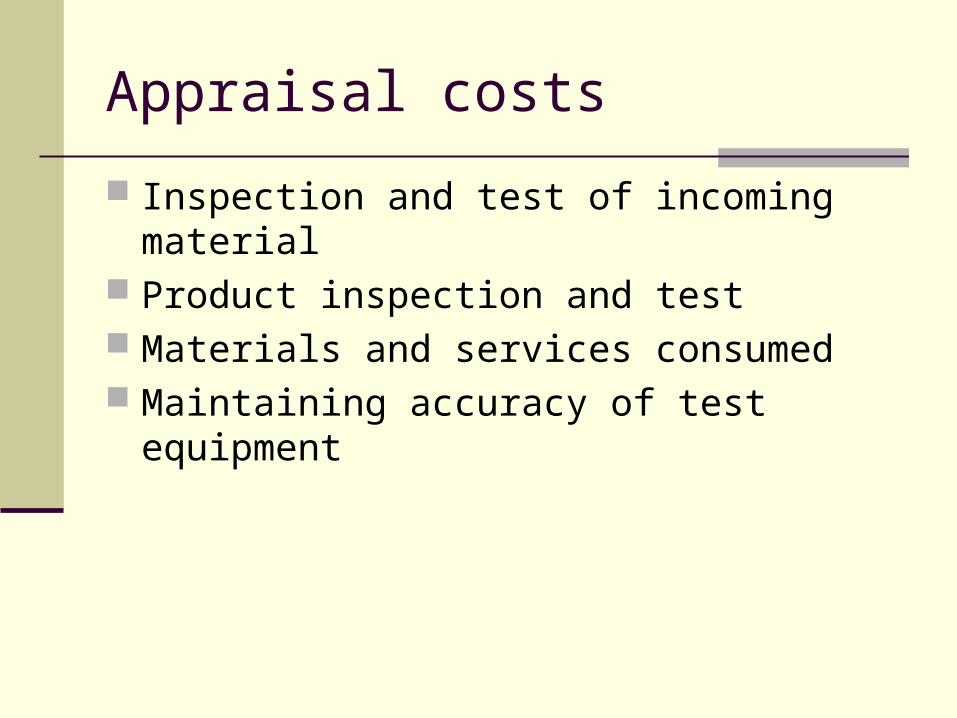
Inspection and test of incoming material Product inspection and test Materials and services consumed Maintaining accuracy of test equipment
Correction costs
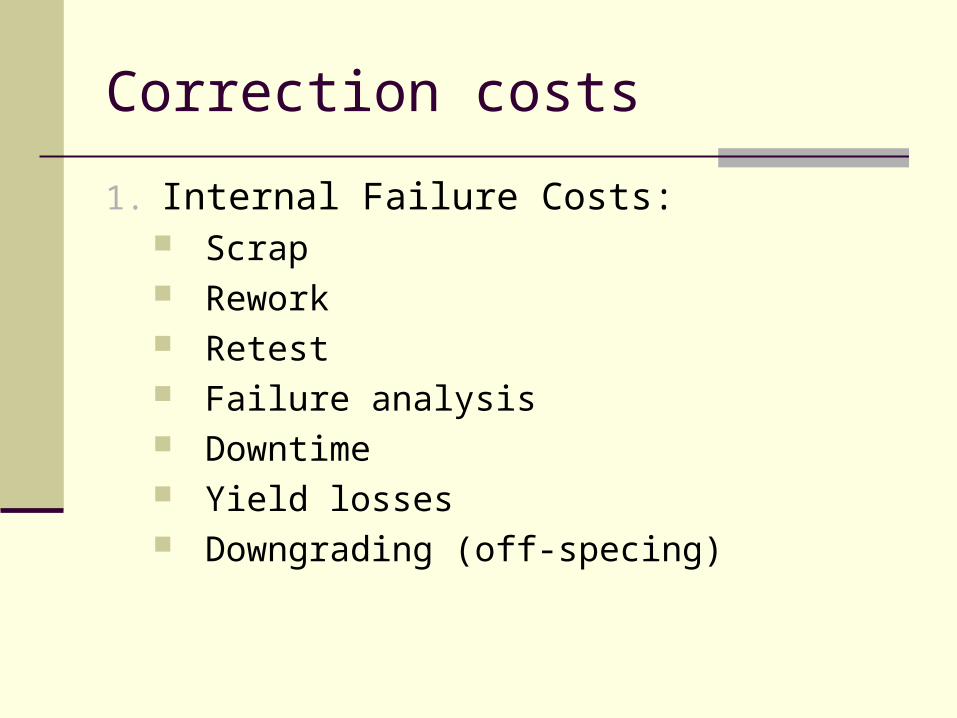
1. Internal Failure Costs: Scrap Rework Retest Failure analysis Downtime Yield losses Downgrading (off-specing)
Correction costs
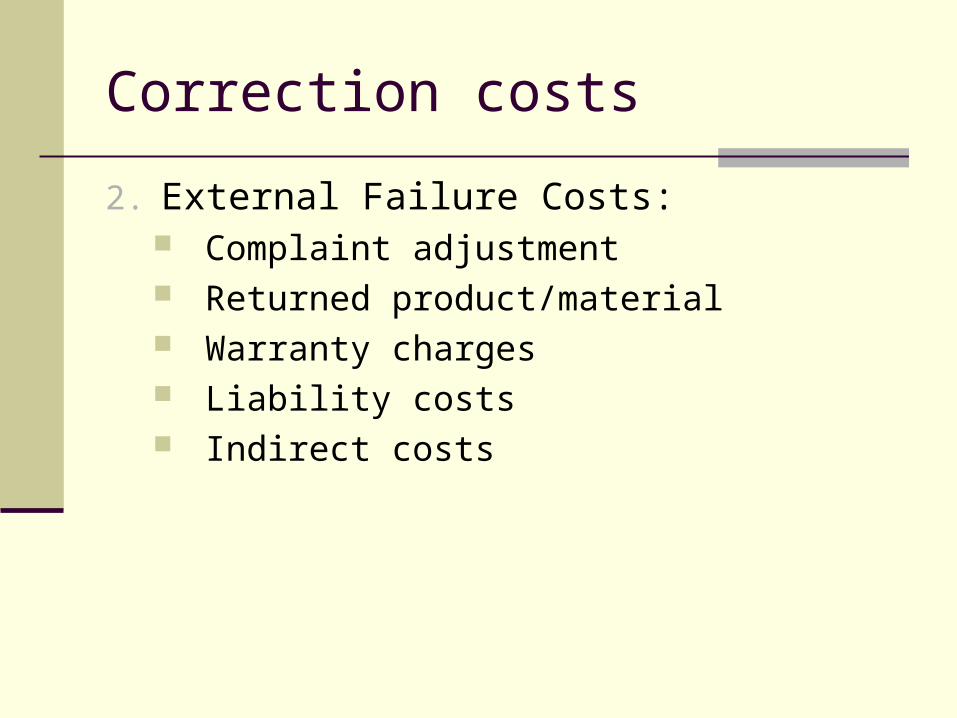
2. External Failure Costs: Complaint adjustment Returned product/material Warranty charges Liability costs Indirect costs
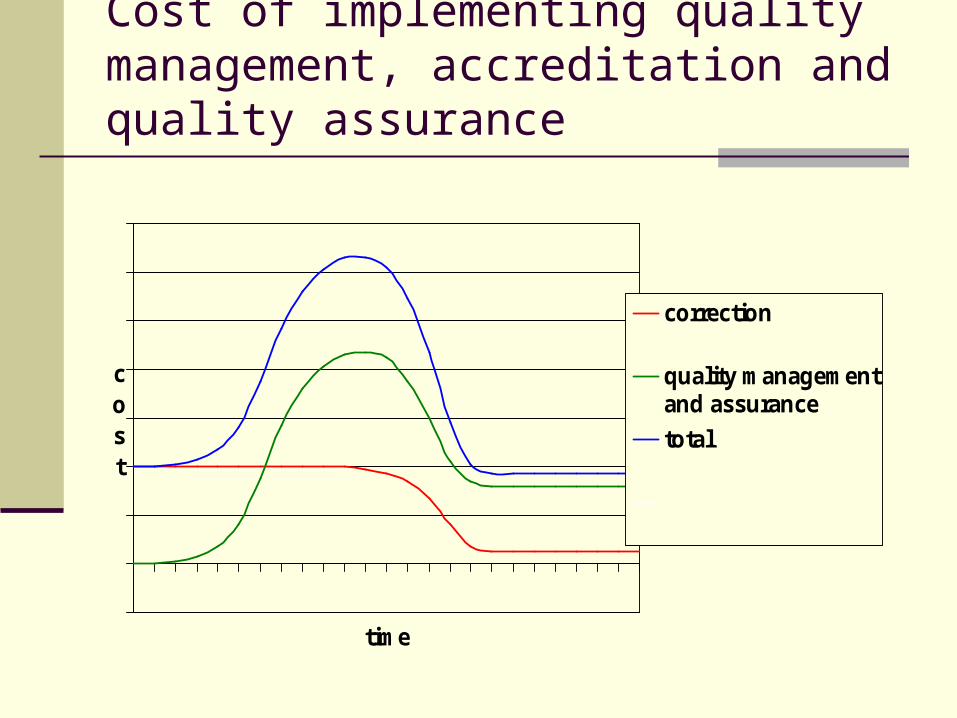
Cost of implementing quality management, accreditation and quality assurance
time
cost
correction
quality managementand assurance
total
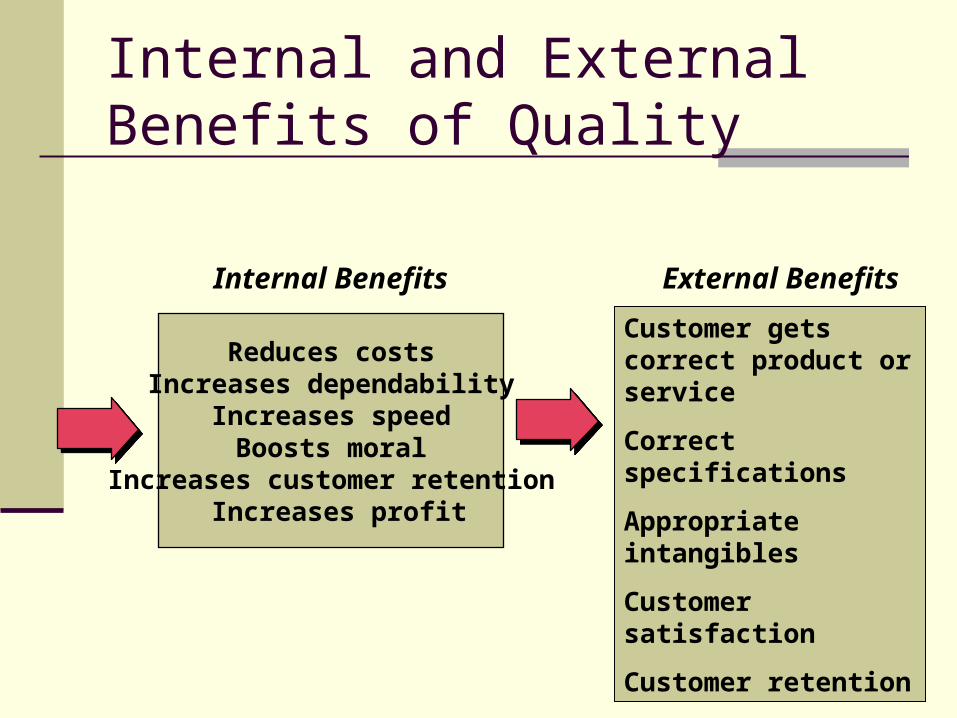
Internal and External Benefits of Quality
Reduces costsIncreases dependability
Increases speedBoosts moral
Increases customer retention Increases profit
Internal Benefits External Benefits
Customer gets correct product or service
Correct specifications
Appropriate intangibles
Customer satisfaction
Customer retention
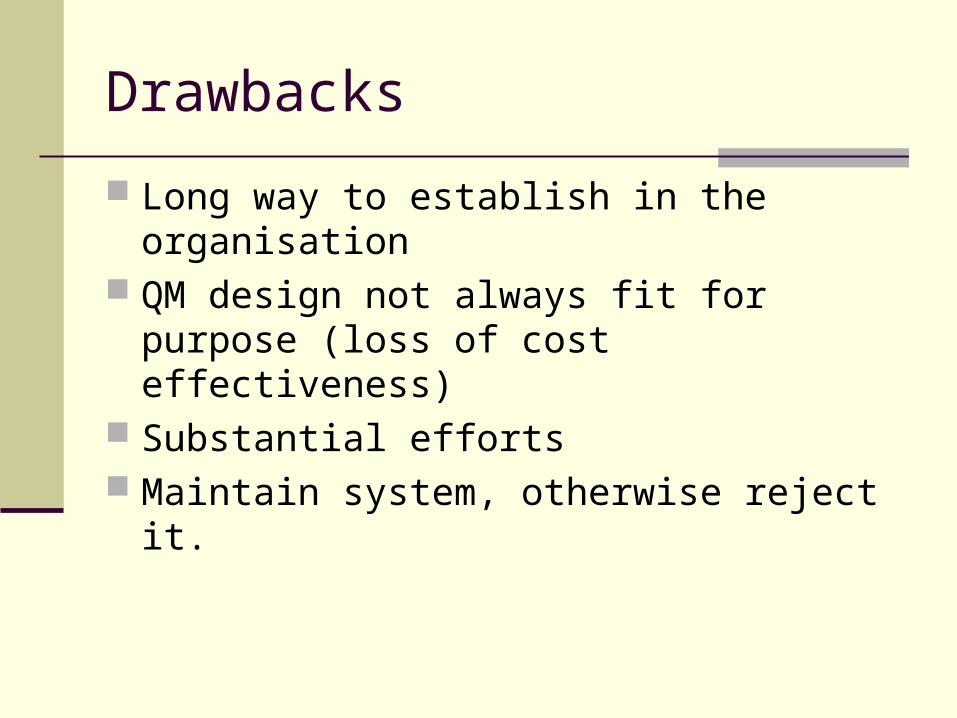
Drawbacks
Long way to establish in the organisation QM design not always fit for purpose (loss of
cost effectiveness) Substantial efforts Maintain system, otherwise reject it.