Embed Size (px)
Citation preview
1
Lecture 13: Seawater 3Introduction to Oceanography
F. Bickerton looking out over seas near Commonwealth Bay, Antarctica 1911-1914. State Library of New South Wales. Public Domain. https://commons.wikimedia.org/wiki/File:F._Bickerton_looking_out_over_seas_near_Commonwealth_Bay.jpg
Physical and chemical properties of Seawater
Playa del Rey & LAX, CA, E. Schauble, UCLA
Periodic Table figure, NASA Science Education Resource Center, Public Domain

2
Chemical Residence TimesResidence Time: the average length of time an element spends in the ocean
€
Res. Time = Amount of element in oceanElement's rate of removal (or addition)
from the ocean
Constituent Res. Time (yrs)
Chlorine (Cl–) 108
Sodium (Na+) 6.8 x 10⁷
Silicon (Si) 2 x 10⁴
Water (H2O) 4.1 x 10³
Iron (Fe) 2 x 10²
Chemical Residence TimesElements with shorter times aren’t well
mixed, vary place-to-placeFe, Si, CFC-11 input are examples
Non-ConservativeShorter bio/geo/seasonal residence times
• Poorly soluble: Al, Ti, Fe• Biological nutrients/products:
Oxygen (respiration), Fe and P (nutrients), carbon dioxide (photosynthesis), Si (shells)
• Chemicals created by recent human activity
CFC-11 (CCl3F)
CFC-11 vs. time, Plumbago, Wikimedia Commons, CC A S-A 3.0, http://upload.wikimedia.org/wikipedia/commons/2/25/AYool_CFC-11_history.png.CFC-11 vertical inventory, Plumbago, Wikimedia Commons, CC A S-A 3.0, http://upload.wikimedia.org/wikipedia/commons/2/20/GLODAP_invt_CFC11_AYool.png
CFC-11 vibration, E. Schauble, UCLA, http://www2.ess.ucla.edu/~schauble/MoleculeHTML/CCl3F_html/CCl3F_page.html

3
Trace Elements• Some are conservative, often these are chemically similar to
abundant conservative elements (Li+ is like Na+, Br– like Cl–)• Many trace elements behave like nutrients
– Some are necessary for life (i.e., Fe)
• Some are toxic in highconcentrations
Hg is fat soluble, accumulatesup the food chain
From <1x10⁻⁹ g/g (seawater)to 1x10⁻⁶ g/g (shark)– Top predators are most
likely to have high Hg:• Shark• Swordfish• King Mackerel• Tilefish~ White (Albacore) Tuna(list from EPA, 2004)
NASA image, Science Education Resource Center, Public Domain
Biological Nutrients
• N, P, Fe, Si
• More needed for organic processes or skeletal growth than is easily available
• Consumed in photic zone (lots of biological growth)– Si used by diatoms for skeletal material
• Enriched in deep waters due to breakdown of organic matter
• Upwelling flows transport nutrients back up to shallower waters
Image from N. Carolina Dept. of Agriculture, appears to be Public Domain,
http://www.ncagr.gov/cyber/kidswrld/plant/label.htm

4
Questions
Seasalt evaporation and harvesting, Tavira, Portugal, Nemracc, Wikimedia Commons, Creative Commons A 3.0 Unported, http://commons.wikimedia.org/wiki/File:Salt_evaporation_pond_near_Tavira_Portugal.JPG
What controls the density of Seawater?In the ocean water density changes due to:• Temperature (Largest variability)• Salinity
(Modest variationin ocean)
Density (gm/cm3)
0.90
0.92
0.94
0.96
0.98
1.00
1.02
���� 30 80
Temperature (ºC)
Max density (1.0) at 4ºC
E. Schauble, UCLA
Ice much less dense
(0.92) at 0ºC
5
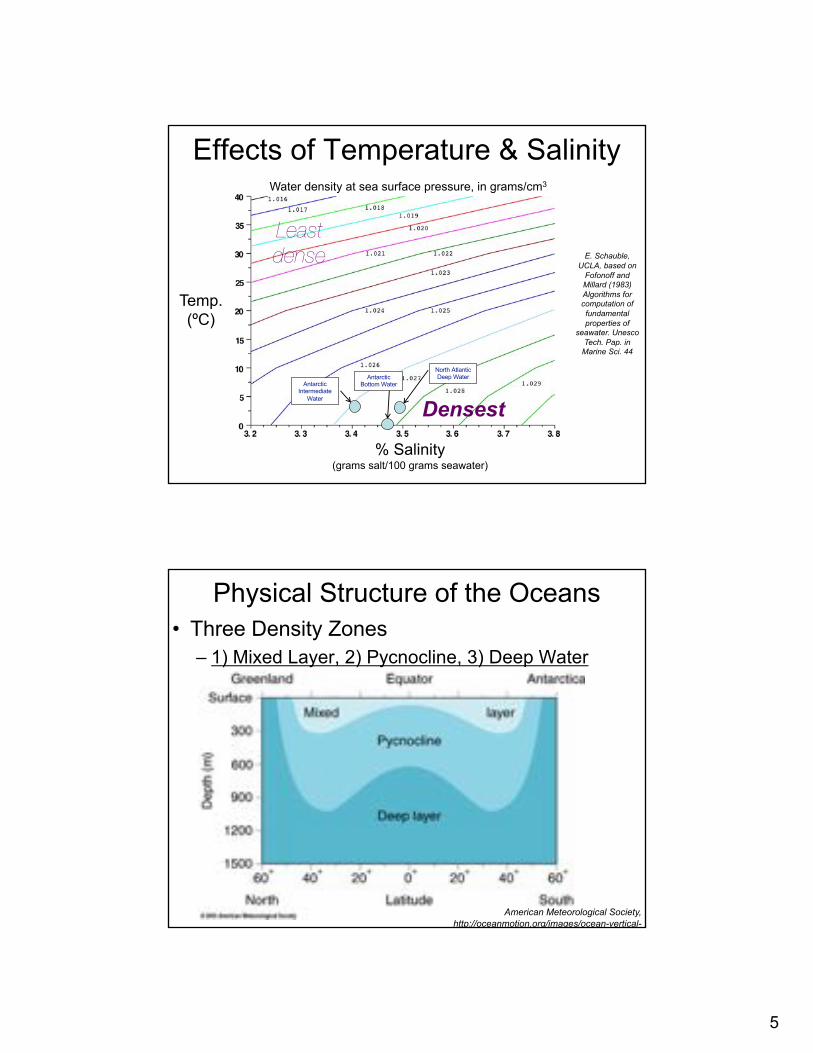
Effects of Temperature & Salinity
% Salinity(grams salt/100 grams seawater)
Temp.(ºC)
Densest
Least dense
Water density at sea surface pressure, in grams/cm3
E. Schauble, UCLA, based on
Fofonoff and Millard (1983) Algorithms for computation of fundamental properties of
seawater. UnescoTech. Pap. in
Marine Sci. 44
North Atlantic Deep WaterAntarctic
Bottom WaterAntarctic Intermediate
Water
Physical Structure of the Oceans• Three Density Zones
– 1) Mixed Layer, 2) Pycnocline, 3) Deep Water
C
C’
American Meteorological Society, http://oceanmotion.org/images/ocean-vertical-
structure_clip_image002.jpg

6
Dep
th (
m)
2ºC 6ºC 10ºC 3.44% 3.46% 3.48%3.5%
1.0258 1.0266 1.0274 1.0282
Adapted from plot of S. Atlantic (45ºS, 50ºW) CTD data at U. Southampton School of Ocean and Earth Science,
http://www.soes.soton.ac.uk/teaching/courses/oa631/ctd_plot.jpg
The ocean is layered by density
T S
Density (g/cm3)
Ocean Water: Layered by density.#1) The Mixed Layer
Top ~100 mVariable thickness
0 m - 1000 m2% of ocean volumeAt surface, so is
strongly affected by wind, gas exchange with air
Sunlit Dep
th (
m)
2ºC 6ºC 10ºC3.44% 3.46% 3.48%3.5%
1.0258 1.0266 1.0274 1.0282
Adapted from plot of S. Atlantic (45ºS, 50ºW) CTD data at U. Southampton School of Ocean and Earth Science,
http://www.soes.soton.ac.uk/teaching/courses/oa631/ctd_plot.jpg

7
Layer #2) The Pycnocline• Density gradient between
Mixed Layer and Deep Water• 18% ocean volume• Mostly due to temperature
change (deeper water is colder)
• At poles, surface water is also cold, so pycnocline caused mostly by change in salinity(I.e. halocline).
Dep
th (
m)
2ºC 6ºC 10ºC3.44% 3.46% 3.48%3.5%
1.0258 1.0266 1.0274 1.0282
Adapted from plot of S. Atlantic (45ºS, 50ºW) CTD data at U. Southampton School of Ocean and Earth Science,
http://www.soes.soton.ac.uk/teaching/courses/oa631/ctd_plot.jpg
Layer #3) The Deep Layer• Water originates at
high latitude (cold)• Cold ~4o C waters• 80% of ocean’s
volume• Completely dark
(aphotic) and relatively unaffected by surface conditions
Dep
th (
m)
2ºC 6ºC 10ºC3.44% 3.46% 3.48%3.5%
1.0258 1.0266 1.0274 1.0282
Adapted from plot of S. Atlantic (45ºS, 50ºW) CTD data at U. Southampton School of Ocean and Earth Science,
http://www.soes.soton.ac.uk/teaching/courses/oa631/ctd_plot.jpg

8
Thermocline• Region where
temperature changes with depth.
• Typically ~100 - 1000 m• Strong near equator
(hot surface water)• Weak at poles (surface
water almost as cold as deep water)
������
�����
�����
����
����
�����
�����
�����
�����
�����
0
0 5 10 15 20
Temperature (ºC)
Depth(m)
Plot E. Schauble, UCLA from NOAA CTD data.
Halocline
• Changing salinity instead of temperature– Sharp gradient in salinity with depth– Strongest near river mouths, regions with high
rainfall. Why?
9
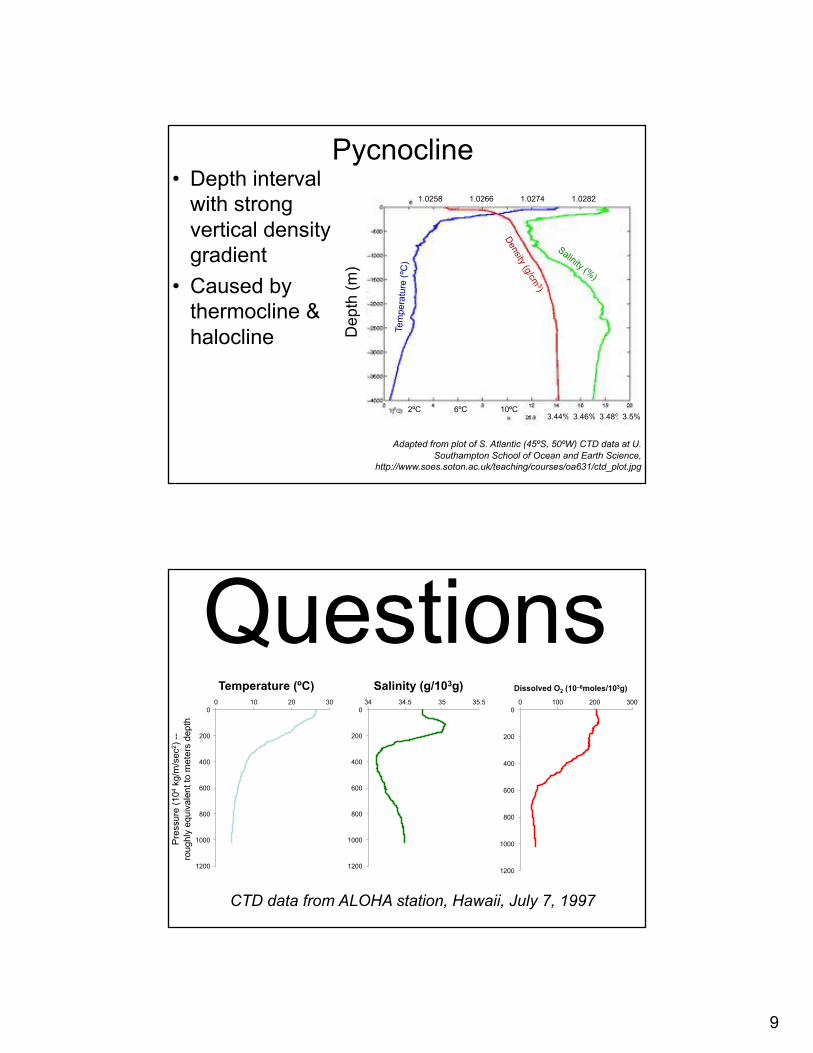
Pycnocline• Depth interval
with strong vertical density gradient
• Caused by thermocline & halocline D
epth
(m
)
2ºC 6ºC 10ºC3.44% 3.46% 3.48%3.5%
1.0258 1.0266 1.0274 1.0282
Adapted from plot of S. Atlantic (45ºS, 50ºW) CTD data at U. Southampton School of Ocean and Earth Science,
http://www.soes.soton.ac.uk/teaching/courses/oa631/ctd_plot.jpg
Questions0
200
400
600
800
1000
1200
0 10 20 30
Temperature (ºC)
0
200
400
600
800
1000
1200
34 34.5 35 35.5
Salinity (g/103g)
0
200
400
600
800
1000
1200
0 100 200 300
Dissolved O2 (10–6moles/103g)
Pre
ssur
e (1
04kg
/m/s
ec2 )
--
roug
hly
equi
vale
nt to
met
ers
dept
h
CTD data from ALOHA station, Hawaii, July 7, 1997

10
Dissolved Gases in the Ocean• Atmospheric gases
dissolved in seawater– Mainly N2, O2
– CO2
• Relative Solubilities:– Gases are most soluble in
COLD water• Polar waters: cold, rough
waters = gas rich• Less soluble in salty
water (“salting out”)• Not quite the same process
as Mentos+Diet Coke
Photo by JD (Kinchan1), Creative Commons Attribution-NonCommercial-
NoDerivs 2.0 Generic http://www.flickr.com/photos/jdbaskin/5
334126513
Photo by Michael Murphy, Wikimedia Commons, GFDL/Creative Commons-BY-SA 3.0,
http://commons.wikimedia.org/wiki/File:Diet_Coke_Mentos.jpg
Dissolved Gases in the Ocean
Gas Atmosphere (Volume %)
Dissolved in Ocean (Volume %)
Nitrogen (N2) 78.08% 48%
Oxygen (O2) 20.95% 36%
Carbon dioxide (CO2)
0.039% 15%
11
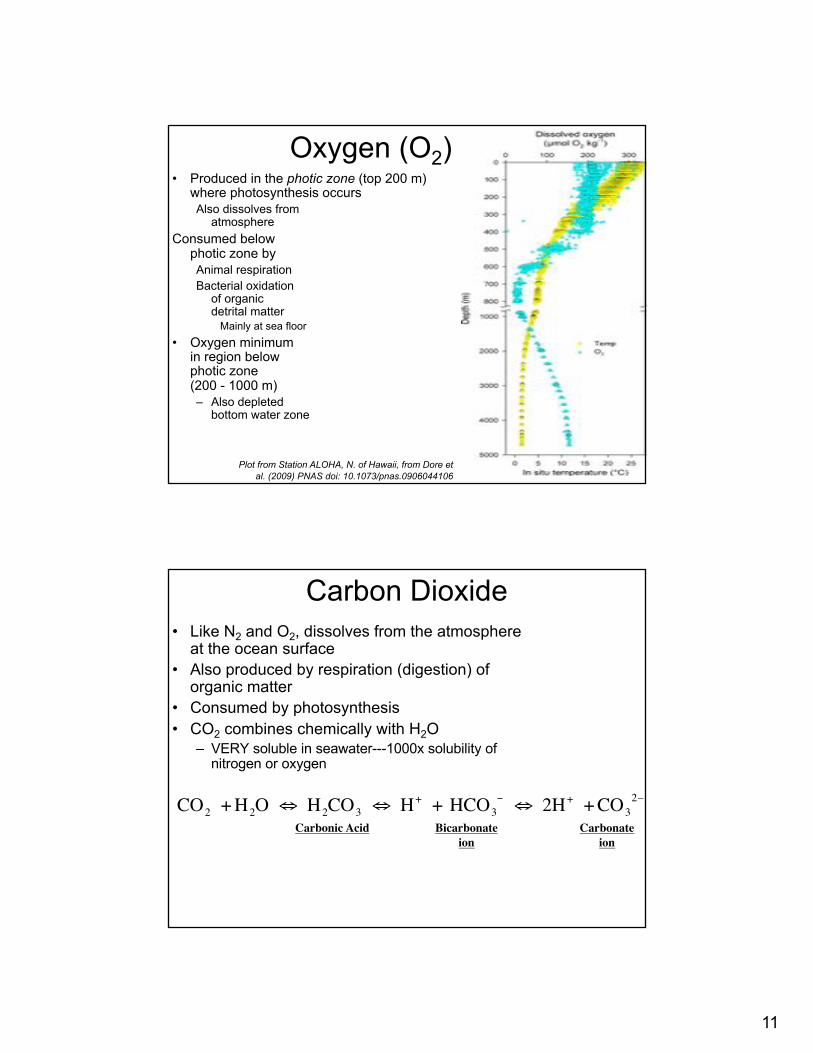
Oxygen (O2)• Produced in the photic zone (top 200 m)
where photosynthesis occursAlso dissolves from
atmosphereConsumed below
photic zone by Animal respiration Bacterial oxidation
of organicdetrital matter
Mainly at sea floor
• Oxygen minimumin region below photic zone (200 - 1000 m)– Also depleted
bottom water zone
Plot from Station ALOHA, N. of Hawaii, from Dore et al. (2009) PNAS doi: 10.1073/pnas.0906044106
Carbon Dioxide• Like N2 and O2, dissolves from the atmosphere
at the ocean surface• Also produced by respiration (digestion) of
organic matter• Consumed by photosynthesis• CO2 combines chemically with H2O
– VERY soluble in seawater---1000x solubility of nitrogen or oxygen
€
CO2 + H2O ⇔ H2CO3 ⇔ H+ + HCO3− ⇔ 2H+ + CO3
2–
Carbonic Acid Bicarbonateion
Carbonateion

12
Carbon Dioxide
• > 90% stored in bicarbonate ions, HCO3-
– At 10o C, Salinity = 3.43% and pH = 8.0:
• Consumed in photic zone (photosynthesis)• Produced by respiration, decomposition of organic matter
CO2 (HCO3)– (CO3)2–
1% 94% 5%
Photosynthesis• Plants and phytoplankton make simple
organic compounds (sugars) from H2O, CO2 and light energy– Energy stored in compounds– O2 formed as byproduct– Occurs in the photic zone
€
6H2O + 6CO2 + sunlight⇔ C6H12O6 + 6O2
PHOTOSYNTHESIS
RESPIRATION
LightCO2
O2
Sugar
Photo by Wikiwatcher1, Wikimedia Commons, Creative Commons A S-A 3.0, http://commons.wikimedia.org/wiki/File:Seaweed_Rocks2_wiki.jpg

13
Respiration
• Plants and animals oxidize sugars to release energy– Water and carbon dioxide are by products– Occurs throughout the water column
€
6H2O + 6CO2 + sunlight⇔ C6H12O6 + 6O2
PHOTOSYNTHESIS
RESPIRATION
O2
and
CO
2vs
. Dep
th
ORGANICDECAY
LOW T, HIGH P:HIGH CO2
SOLUBILITY
Respiration
Photosynthesis
Plot from Station ALOHA, N. of Hawaii, from Dore et al. (2009) PNAS doi: 10.1073/pnas.0906044106

14
Acid-Base Balance• H2O occasionally splits into H+ and OH-
– 1 molecule in 5.5x10⁸ dissociates at 25o C
€
H2O ⇔H+ + OH_
J. W. Pang(?), UCLA Chemistry, www.chem.ucla.edu/~gchemlab/ph-paper.jpg
pH Scale
• pH scale = Logarithmic scale
• Neutral (pure) water: – 1/(5.5x108) water molecules is disassociated– there are about 55 moles of water per liter
Concentration of H+= 55/(5.5x108) = 10–7 moles/liter
– Neutral water pH = 7• lower pH = acid, higher pH = base
€
pH = − log10(H +)

15
pH Scale
Stephen Lower, Wikimedia Commons,
CC A S-A 3.0, http://en.wikipedia.org/wi
ki/File:PH_scale.png
The Carbonate Buffer System• Seawater pH = ~8.0 (slightly basic)• Maintained by carbonate buffer system:
• Increase CO2 in water, acidity increasesWhat happens to pH?
• Add acid and CO2 is produced
€
CO2 + H2O ⇔ H2CO3 ⇔ H+ + HCO3− ⇔ 2H+ + CO3
2–
Carbonic Acid Bicarbonateion
Carbonateion

16
The CO2 system and carbonate
• Deep waters form at the poles: High CO2 and therefore acidic
• Acidity interacts to dissolve calcium carbonate (CaCO3) deposits on the deep sea floor– Acidity and temperature control carbonate
compensation depth (CCD)