Embed Size (px)
Citation preview
1
Introduction to Maps
Chapter 1
Introduction to Maps
You may be familiar with
maps that you have seen in
most of your books of social
sciences representing the
earth or any of its parts.
You may also know that the
shape of the earth is geoid
(three-dimensional) and a
globe can best represent it
(Fig. 1.1). A map, on the
other hand, is a simplified
depiction of whole or part
of the earth on a piece of
paper. In other words, it is
a two-dimensional form of
the three-dimensional
earth. Hence, a map can be
drawn using a system of
map projections (see
Chapter 4). As it is impossible to represent all features of the earth’s
surface in their true size and form, a map is drawn at a reduced
scale. Imagine your school campus. If a plan/map of your school is
to be drawn in its actual size, it will be as large as the campus itself.
Hence, maps are drawn at a scale and projection so that each point
on the paper corresponds to the actual ground position. Besides,
the representation of different features is also simplified using
symbols, colours and shades. A map is, therefore, defined as
selective, symbolised and generalised representation of whole or a
Figure 1.1 India as it is seen on the globe
2
Practical Work in Geography
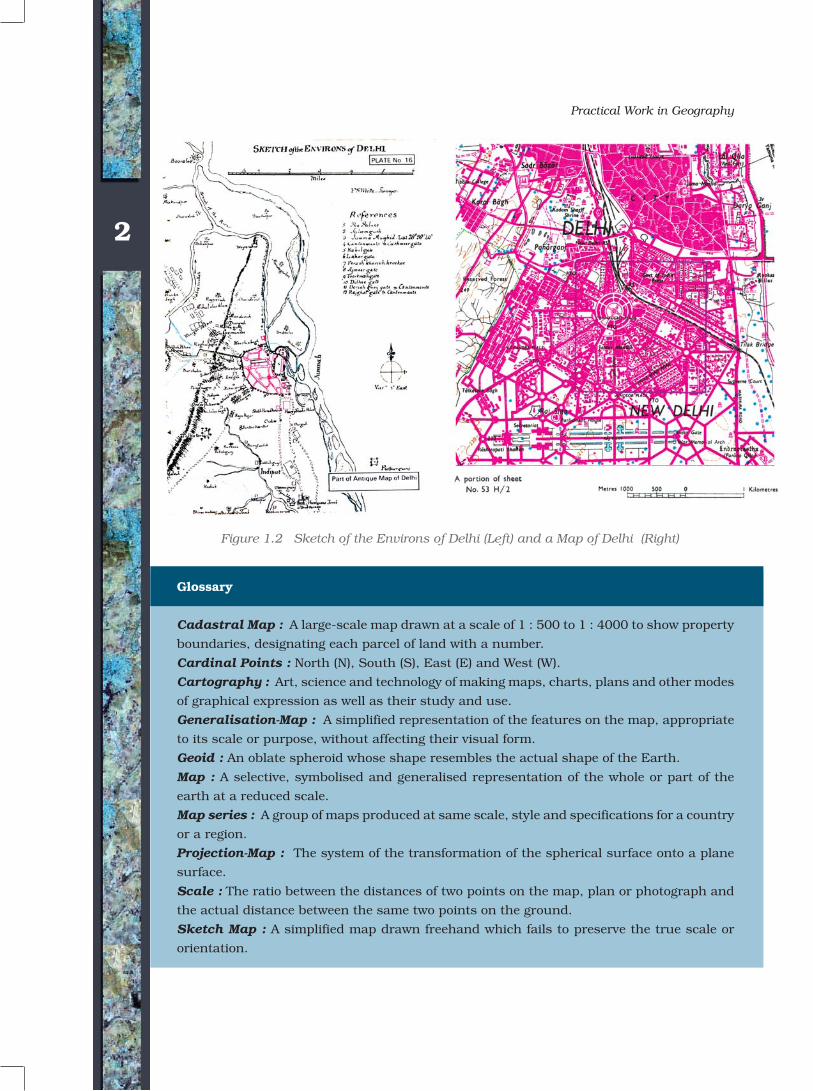
Glossary
Cadastral Map : A large-scale map drawn at a scale of 1 : 500 to 1 : 4000 to show property
boundaries, designating each parcel of land with a number.
Cardinal Points : North (N), South (S), East (E) and West (W).
Cartography : Art, science and technology of making maps, charts, plans and other modes
of graphical expression as well as their study and use.
Generalisation-Map : A simplified representation of the features on the map, appropriate
to its scale or purpose, without affecting their visual form.
Geoid : An oblate spheroid whose shape resembles the actual shape of the Earth.
Map : A selective, symbolised and generalised representation of the whole or part of the
earth at a reduced scale.
Map series : A group of maps produced at same scale, style and specifications for a country
or a region.
Projection-Map : The system of the transformation of the spherical surface onto a plane
surface.
Scale : The ratio between the distances of two points on the map, plan or photograph and
the actual distance between the same two points on the ground.
Sketch Map : A simplified map drawn freehand which fails to preserve the true scale or
orientation.
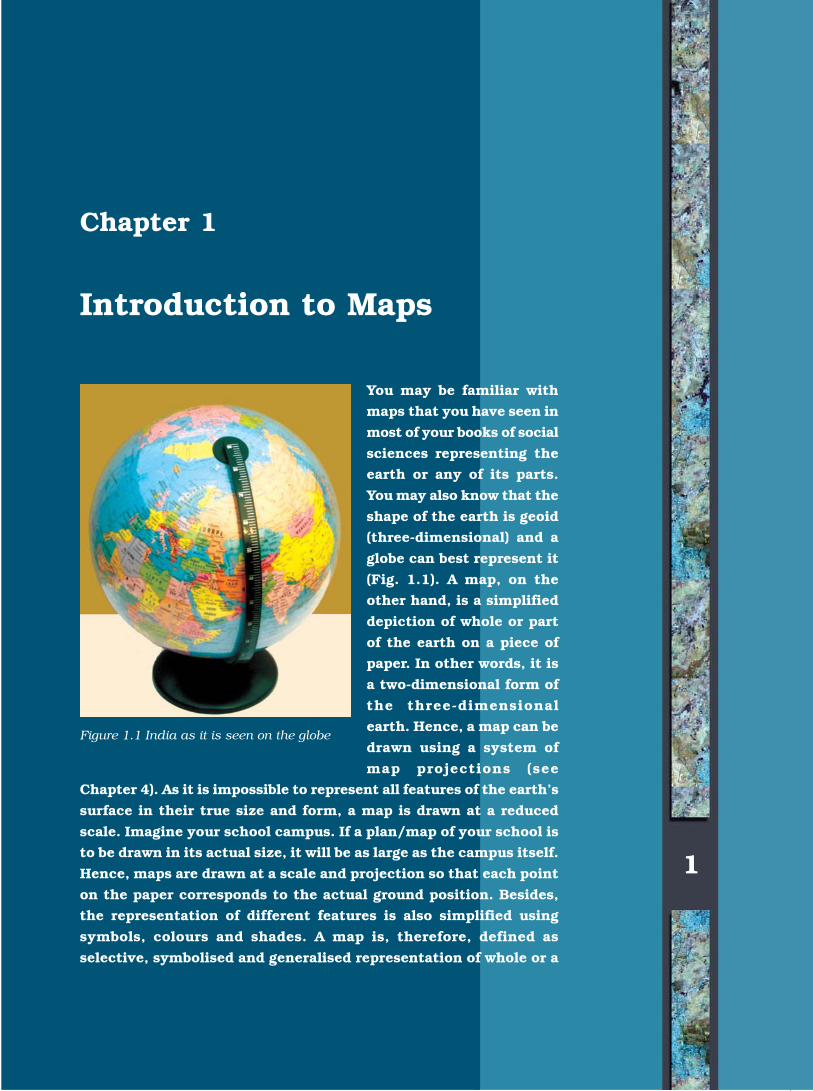
Figure 1.2 Sketch of the Environs of Delhi (Left) and a Map of Delhi (Right)
3
Introduction to Maps
part of the earth's surface on a plane surface at a reduced scale. It may
also be understood that a simple network of lines and polygons without
a scale shall not be called a map. It is only referred to as “the sketch”
(Fig. 1.2). In the present chapter, we will study the essential requirements
of maps, their types and the uses.
ESSENTIALS OF MAP MAKING
In view of the variety of maps, we may find it difficult to summarise
what they all have in common. Cartography, being an art and science of
map-making, does include a series of processes that are common to all
the maps. These processes that may also be referred to as essentials of
maps are :
Scale
Map Projection
Map Generalisation
Map Design
Map Construction and Production
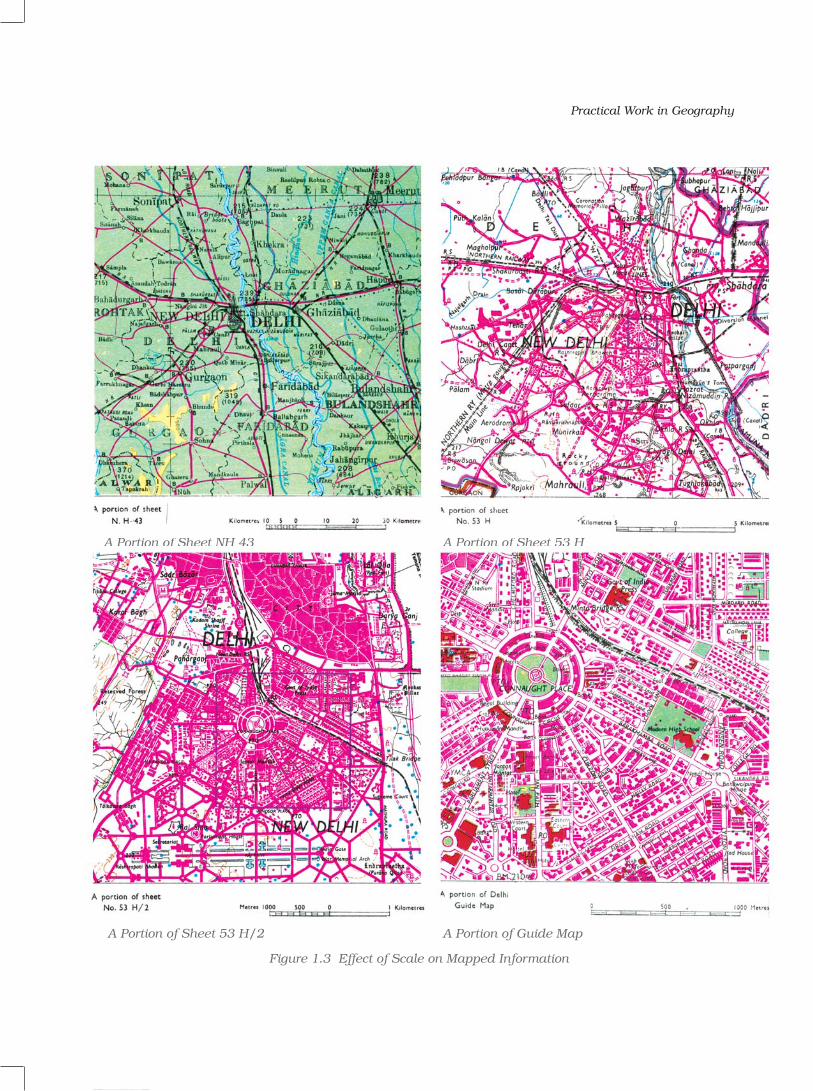
Scale: We know that all maps are reductions. The first decision that a
map-maker has to take is about the scale of the map. The choice of scale
is of utmost importance. The scale of a map sets limits of information
contents and the degree of reality with which it can be delineated on the
map. For example, figure 1.3 provides a comparison between maps having
different scales and the improvements made thereupon with the change
in scale.
Projection: We also know that maps are a simplified representation
of the three-dimensional surface of the earth on a plane sheet of paper.
The transformation of all-side-curved-geoidal surface into a plane surface
is another important aspect of the cartographic process. We should know
that such a radical transformation introduces some unavoidable changes
in directions, distances, areas and shapes from the way they appear on
a geoid. A system of transformation of the spherical surface to the plane
surface is called a map projection. Hence, the choice, utilisation and
construction of projections is of prime importance in map-making.
4
Practical Work in Geography
A Portion of Sheet NH 43 A Portion of Sheet 53 H
A Portion of Sheet 53 H/2 A Portion of Guide Map
Figure 1.3 Effect of Scale on Mapped Information
5
Introduction to Maps
Generalisation: Every map is drawn with a definite objective. For
example, a general purpose map is drawn to show information of a general
nature such as relief, drainage, vegetation, settlements, means of
transportation, etc. Similarly, a special purpose map exhibits information
pertaining to one or more selected themes like population density, soil
types or location of industries. It is, therefore, necessary to carefully
plan the map contents while the purpose of the map must be kept in the
forefront. As maps are drawn at a reduced scale to serve a definite
purpose, the third task of a cartographer is to generalise the map
contents. In doing so, a cartographer must select the information (data)
relevant to the selected theme and simplify it as per the needs.
Map Design: The fourth important task of a cartographer is the map
design. It involves the planning of graphic characteristics of maps
including the selection of appropriate symbols, their size and form, style
of lettering, specifying the width of lines, selection of colours and shades,
arrangement of various elements of map design within a map and design
for map legend. The map design is, therefore, a complex aspect of map-
making and requires thorough understanding of the principles that
govern the effectiveness of graphic communication.
Map Construction and Production: The drawing of maps and
their reproduction is the fifth major task in the cartographic process. In
earlier times, much of the map construction and reproduction work
used to be carried out manually. Maps were drawn with pen and ink
and printed mechanically. However, the map construction and
reproduction has been revolutionalised with the addition of computer
assisted mapping and photo-printing techniques in the recent past.
HISTORY OF MAP MAKING
The history of map making is as old as the history of mankind itself. The
oldest map was found in Mesopotamia drawn on a clay tablet that belongs
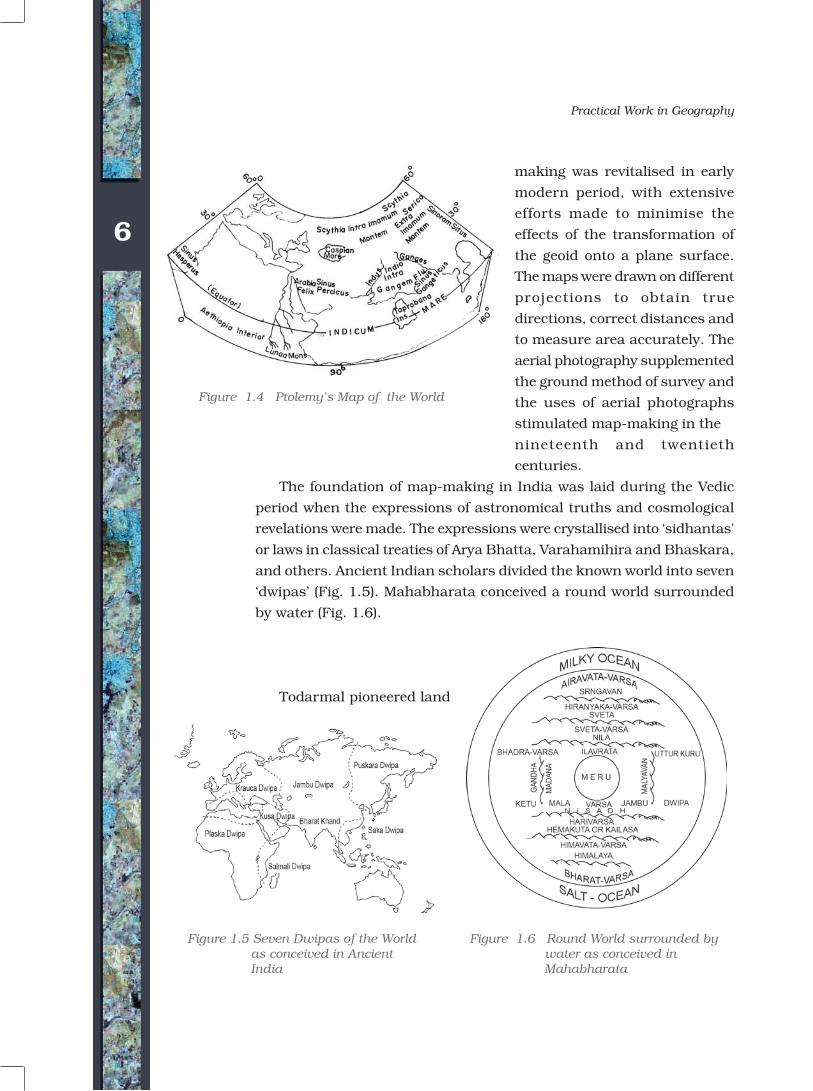
to 2,500 B.C. Figure 1.4 shows Ptolemy’s Map of the World. Greek and
the Arab geographers laid the foundation of modern cartography. The
measurement of the circumference of the Earth and the use of the system
of geographical coordinates in map-making are some of the significant
contributions of the Greeks and the Arabs. The art and science of map
6
Practical Work in Geography
making was revitalised in early
modern period, with extensive
efforts made to minimise the
effects of the transformation of
the geoid onto a plane surface.
The maps were drawn on different
projections to obtain true
directions, correct distances and
to measure area accurately. The
aerial photography supplemented
the ground method of survey and
the uses of aerial photographs
stimulated map-making in the
nineteenth and twentieth
centuries.
The foundation of map-making in India was laid during the Vedic
period when the expressions of astronomical truths and cosmological
revelations were made. The expressions were crystallised into ‘sidhantas'
or laws in classical treaties of Arya Bhatta, Varahamihira and Bhaskara,
and others. Ancient Indian scholars divided the known world into seven
‘dwipas’ (Fig. 1.5). Mahabharata conceived a round world surrounded
by water (Fig. 1.6).
Todarmal pioneered land
Figure 1.5 Seven Dwipas of the World as conceived in Ancient India
Figure 1.6 Round World surrounded by water as conceived in Mahabharata
Figure 1.4 Ptolemy’s Map of the World
7
Introduction to Maps
surveying and map-making as an integral part of the revenue collection
procedure. Besides, Sher Shah Suri’s revenue maps further enriched
the mapping techniques during the medieval period. The intensive
topographical surveys for the preparation of up–to–date maps of the
entire country, were taken up with the setting up of the Survey of India
in 1767, which culminated with the map of Hindustan in 1785. Today,
the Survey of India produces maps at different scales for the entire
country.
Types of Maps Based on Scale: On the basis of scale, maps may
be classified into large-scale and small-scale. Large scale maps are drawn
to show small areas at a relatively large-scale. For example, the
topographical maps drawn at a scale of 1: 250,000, 1:50,000 or 1:25,000
and the village maps, the zonal plans of the cities and house plans
prepared on a scale of 1:4,000, 1:2,000 and 1:500 are large scale maps.
On the other hand, small-scale maps are drawn to show large areas.
For example, atlas maps, wall maps, etc.
(i) Large-scale Maps: Large-scale maps are further divided into the
following types :
(a) Cadastral maps
(b) Topographical maps
(a) Cadastral Maps : The term ‘cadastral’ is derived from the French
word ‘cadastre’ meaning ‘register of territorial property’. These maps are
drawn to show the ownership of landed property by demarcating field
boundaries of agricultural land and the plan of individual houses in
urban areas. The cadastral maps are prepared by the government
agencies to realise revenue and taxes, along with keeping a record of
ownership. These maps are drawn on a very large scale, such as the
cadastral maps of villages at 1 : 4,000 scale and the city plans at a scale
of 1 : 2,000 and larger.
(b) Topographical Maps : These maps are also prepared on a fairly large
scale. The topographical maps are based on precise surveys and are
prepared in the form of series of maps made by the national mapping
agencies of almost all countries of the world (Chapter 5). For example,
the Survey of India undertakes the topographical mapping of the entire
country at 1 : 250,000, 1 : 50,000 and 1 : 25,000 scale (Fig. 1.3). These
maps follow uniform colours and symbols to show topographic details
such as relief, drainage, agricultural land, forest, settlements, means of
8
Practical Work in Geography
communication, location of schools, post offices and other services and
facilities.
(ii) Small-scale Maps: Small-scale maps are further divided into the
following types :
(a) Wall Maps
(b) Atlas Maps
(a) Wall Maps : These maps are generally drawn on large size paper or
on plastic base for use in classrooms or lecture halls. The scale of wall
maps is generally smaller than the scale of topographical maps but
larger than atlas maps.
(b) Atlas Maps : Atlas maps are very small-scale maps. These maps
represent fairly large areas and present highly generalised picture of the
physical or cultural features. Even so, an atlas map serves as a graphic
encyclopaedia of the geographical information about the world,
continents, countries or regions. When consulted properly, these maps
provide a wealth of generalised information regarding location, relief,
drainage, climate, vegetation, distribution of cities and towns, population,
location of industries, transport-network system, tourism and heritage
sites, etc.
Types of Maps Based on Function: The maps may also be
classified on the basis of their functions. For example, a political map
serves the function of providing administrative divisions of a continent
or a country and a soil map shows the distribution of different types of
soils. Broadly, maps based on their functions may be classified into
physical maps and cultural maps.
(i) Physical Maps: Physical maps show natural features such as relief,
geology, soils, drainage, elements of weather, climate and vegetation,
etc.
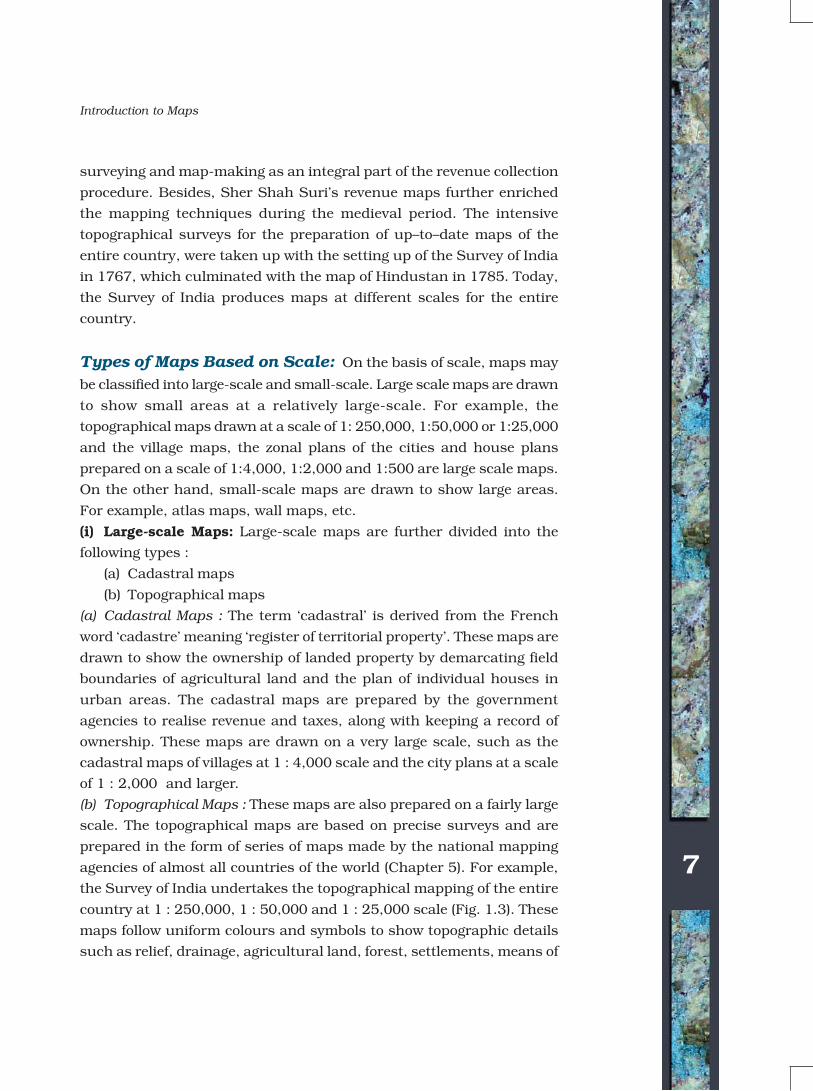
(a) Relief Maps: Relief maps show general topography of an area like
mountains and valleys, plains, plateaus and drainage. Figure 1.7 shows
the relief and slope map of Nagpur district.
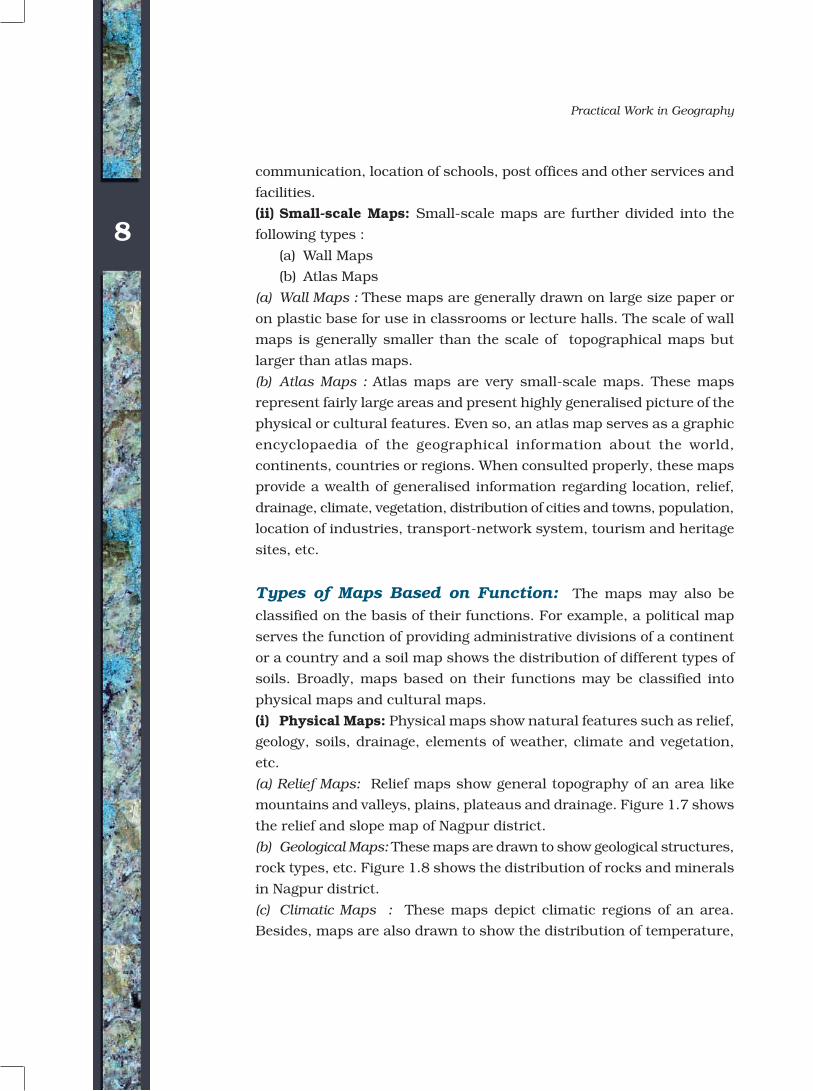
(b) Geological Maps: These maps are drawn to show geological structures,
rock types, etc. Figure 1.8 shows the distribution of rocks and minerals
in Nagpur district.
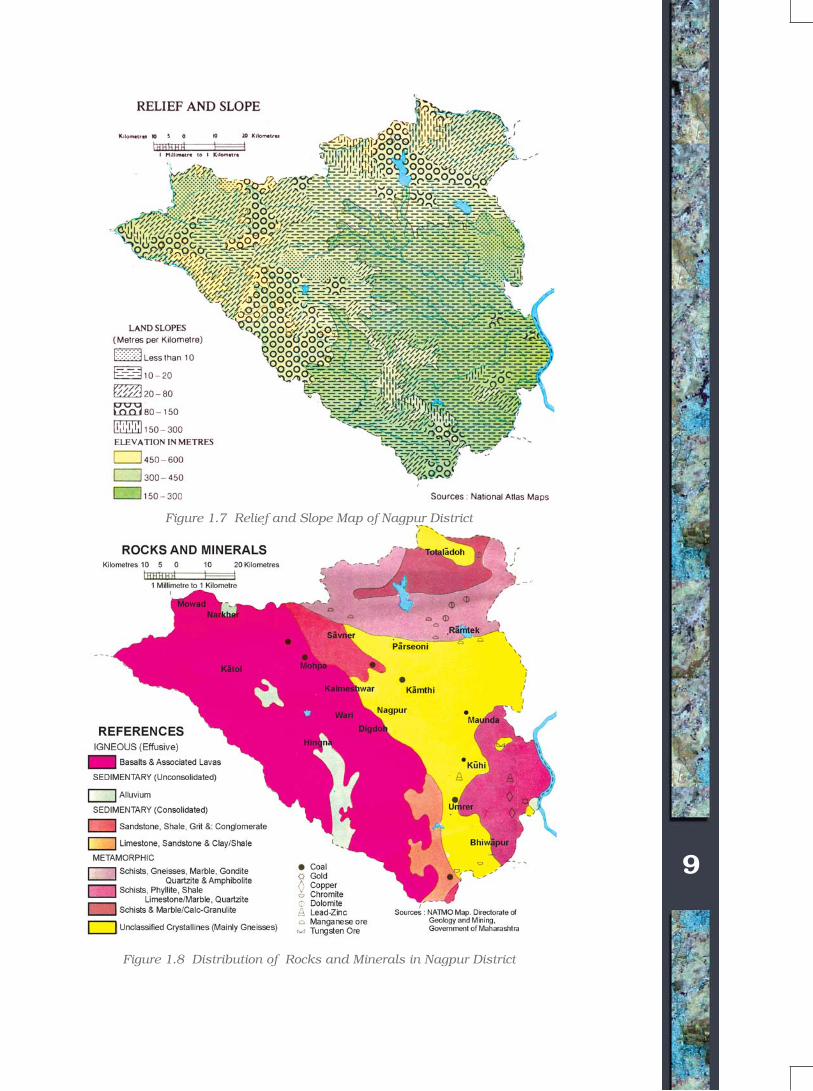
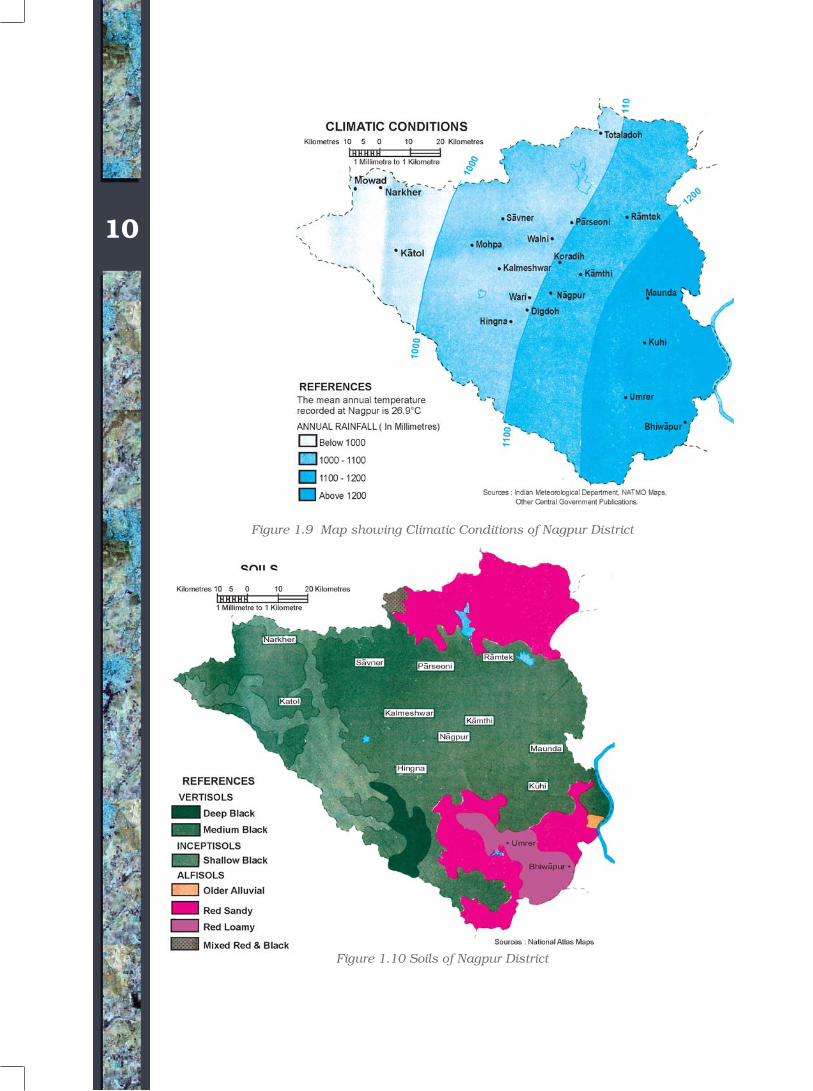
(c) Climatic Maps : These maps depict climatic regions of an area.
Besides, maps are also drawn to show the distribution of temperature,
9
Introduction to Maps
Figure 1.7 Relief and Slope Map of Nagpur District
Figure 1.8 Distribution of Rocks and Minerals in Nagpur District
10
Practical Work in Geography
Figure 1.9 Map showing Climatic Conditions of Nagpur District
Figure 1.10 Soils of Nagpur District
10
11
Introduction to Maps
rainfall, cloudiness, relative humidity, direction and velocity of winds
and other elements of weather (Fig 1.9).
(d) Soil Maps : Maps are also drawn to show the distribution of different
types of soil(s) and their properties (Fig. 1.10).
(ii) Cultural Maps: Cultural maps show man-made features. These
include a variety of maps showing population distribution and growth,
sex and age, social and religious composition, literacy, levels of
educational attainment, occupational structure, location of settlements,
facilities and services, transportation lines and production, distribution
and flow of different commodities.
(a) Political Maps : These maps show the administrative divisions of an
area such as country, state or district. These maps facilitate the
administrative machinery in planning and management of the concerned
administrative unit.
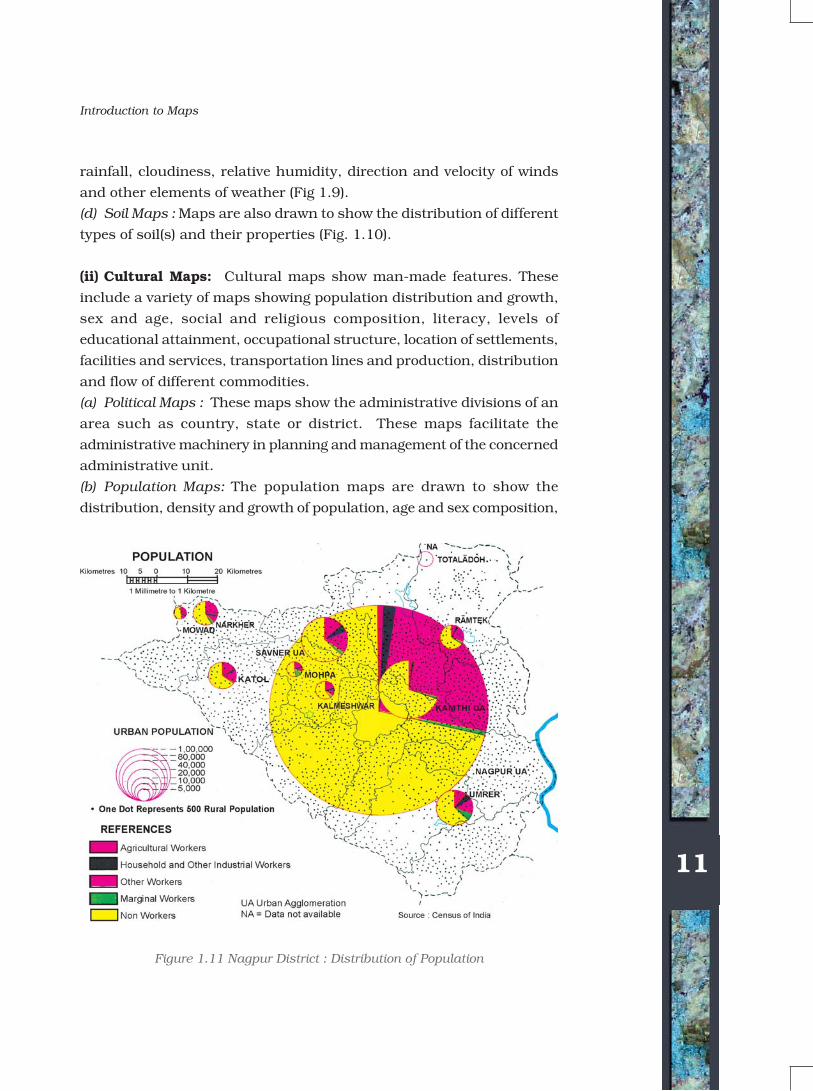
(b) Population Maps: The population maps are drawn to show the
distribution, density and growth of population, age and sex composition,
Figure 1.11 Nagpur District : Distribution of Population
11
12
Practical Work in Geography
distribution of religious, linguistic and social groups, occupational
structure of the population, etc. (Fig 1.11 on previous page). Population
maps serve the most significant role in the planning and development of
an area.
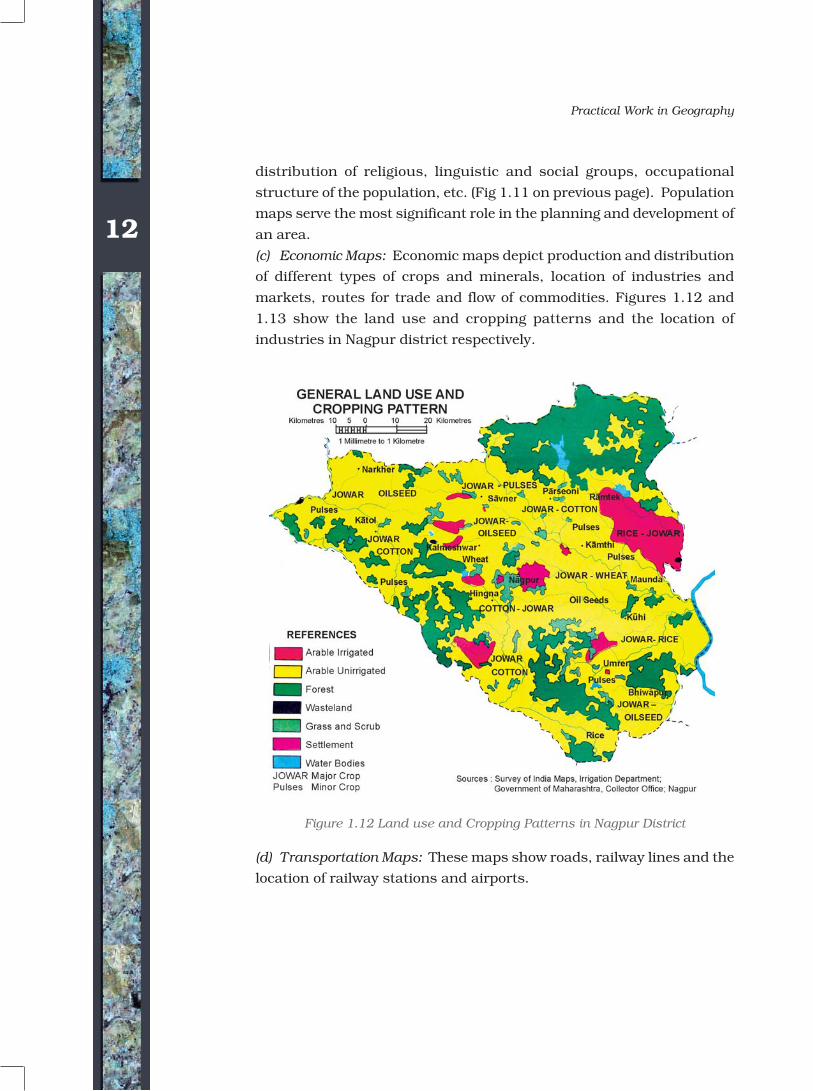
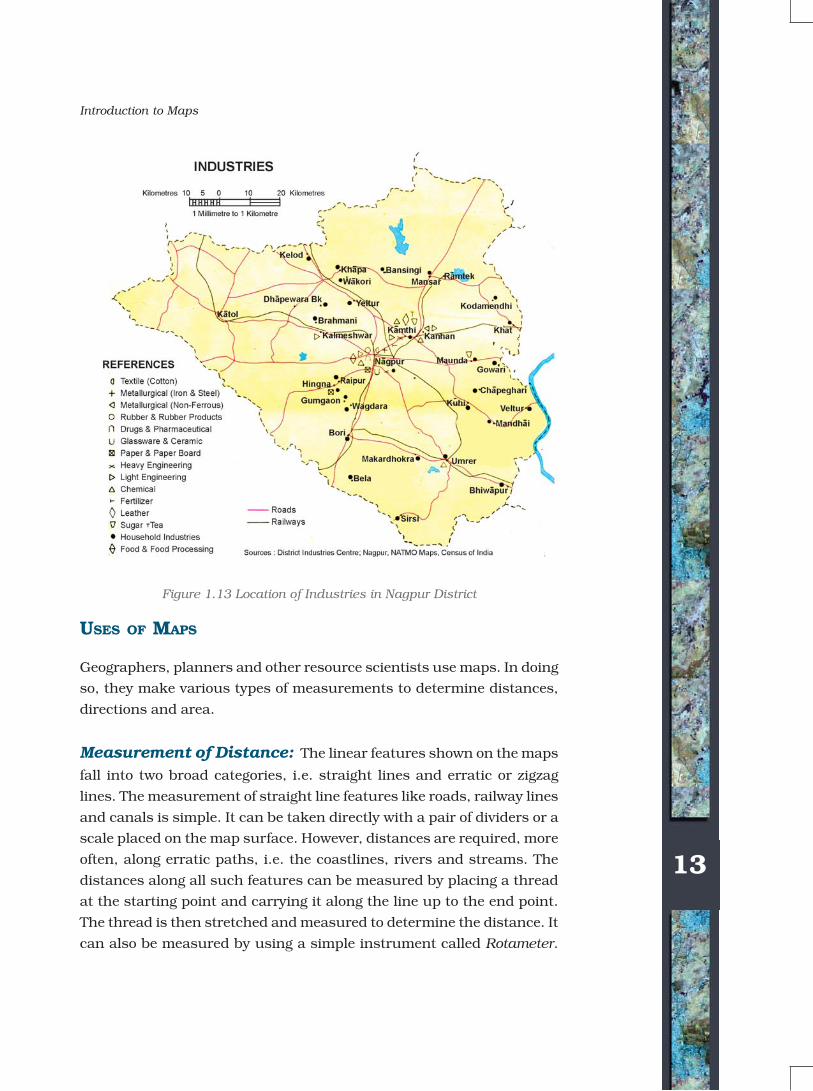
(c) Economic Maps: Economic maps depict production and distribution
of different types of crops and minerals, location of industries and
markets, routes for trade and flow of commodities. Figures 1.12 and
1.13 show the land use and cropping patterns and the location of
industries in Nagpur district respectively.
12
Figure 1.12 Land use and Cropping Patterns in Nagpur District
(d) Transportation Maps: These maps show roads, railway lines and the
location of railway stations and airports.
13
Introduction to Maps
USES OF MAPS
Geographers, planners and other resource scientists use maps. In doing
so, they make various types of measurements to determine distances,
directions and area.
Measurement of Distance: The linear features shown on the maps
fall into two broad categories, i.e. straight lines and erratic or zigzag
lines. The measurement of straight line features like roads, railway lines
and canals is simple. It can be taken directly with a pair of dividers or a
scale placed on the map surface. However, distances are required, more
often, along erratic paths, i.e. the coastlines, rivers and streams. The
distances along all such features can be measured by placing a thread
at the starting point and carrying it along the line up to the end point.
The thread is then stretched and measured to determine the distance. It
can also be measured by using a simple instrument called Rotameter.
Figure 1.13 Location of Industries in Nagpur District
13
14
Practical Work in Geography
14
The wheel of the 'rotameter' is
moved along the route to measure
the distance.
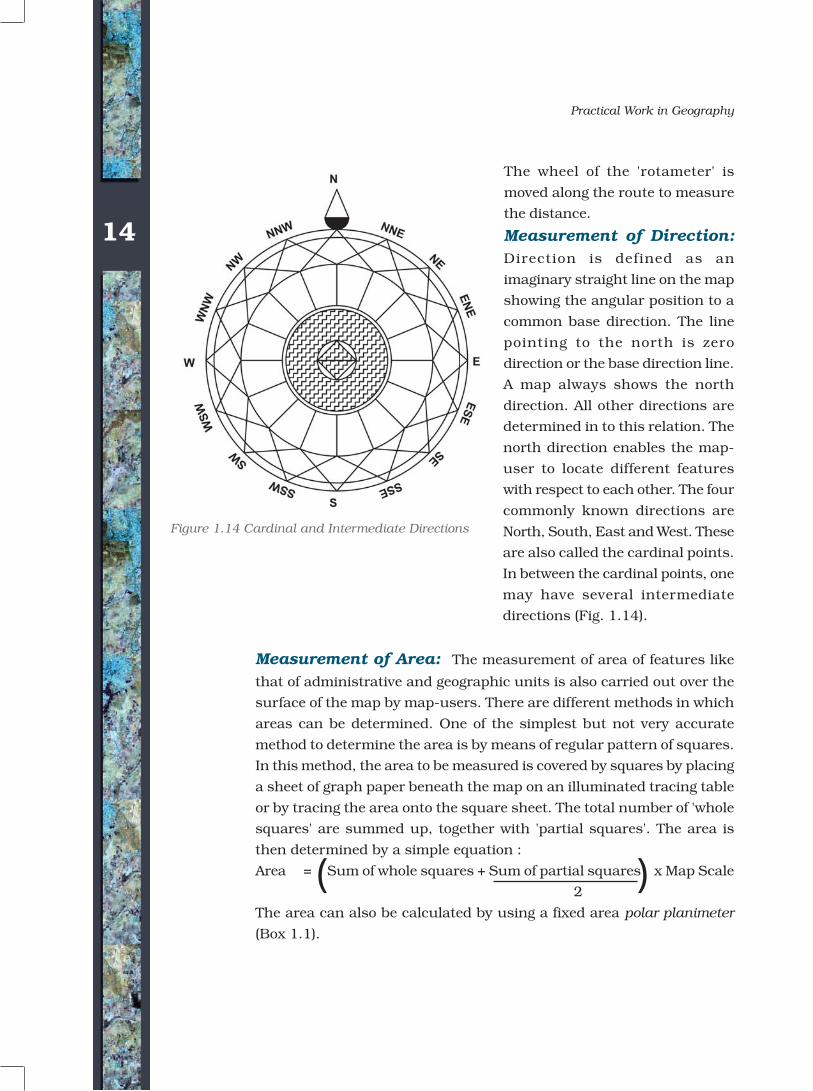
Measurement of Direction:Direction is defined as an
imaginary straight line on the map
showing the angular position to a
common base direction. The line
pointing to the north is zero
direction or the base direction line.
A map always shows the north
direction. All other directions are
determined in to this relation. The
north direction enables the map-
user to locate different features
with respect to each other. The four
commonly known directions are
North, South, East and West. These
are also called the cardinal points.
In between the cardinal points, one
may have several intermediate
directions (Fig. 1.14).
Measurement of Area: The measurement of area of features like
that of administrative and geographic units is also carried out over the
surface of the map by map-users. There are different methods in which
areas can be determined. One of the simplest but not very accurate
method to determine the area is by means of regular pattern of squares.
In this method, the area to be measured is covered by squares by placing
a sheet of graph paper beneath the map on an illuminated tracing table
or by tracing the area onto the square sheet. The total number of 'whole
squares' are summed up, together with 'partial squares'. The area is
then determined by a simple equation :
Area = Sum of whole squares + Sum of partial squares x Map Scale
2
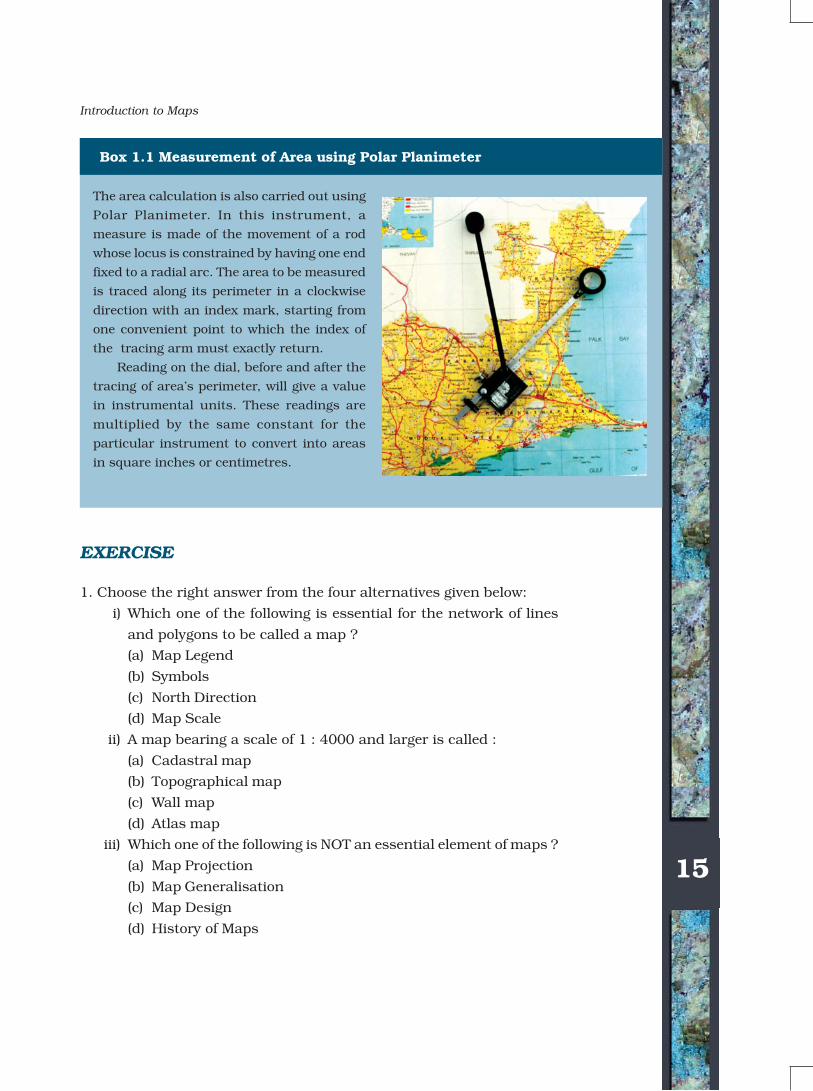
The area can also be calculated by using a fixed area polar planimeter
(Box 1.1).
Figure 1.14 Cardinal and Intermediate Directions
( )
15
Introduction to Maps
EXERCISE
1. Choose the right answer from the four alternatives given below:
i) Which one of the following is essential for the network of lines
and polygons to be called a map ?
(a) Map Legend
(b) Symbols
(c) North Direction
(d) Map Scale
ii) A map bearing a scale of 1 : 4000 and larger is called :
(a) Cadastral map
(b) Topographical map
(c) Wall map
(d) Atlas map
iii) Which one of the following is NOT an essential element of maps ?
(a) Map Projection
(b) Map Generalisation
(c) Map Design
(d) History of Maps
The area calculation is also carried out using
Polar Planimeter. In this instrument, a
measure is made of the movement of a rod
whose locus is constrained by having one end
fixed to a radial arc. The area to be measured
is traced along its perimeter in a clockwise
direction with an index mark, starting from
one convenient point to which the index of
the tracing arm must exactly return.
Reading on the dial, before and after the
tracing of area’s perimeter, will give a value
in instrumental units. These readings are
multiplied by the same constant for the
particular instrument to convert into areas
in square inches or centimetres.
Box 1.1 Measurement of Area using Polar Planimeter
15
16
Practical Work in Geography
16
2. Answer the following questions in about 30 words:
What is map generalisation ?
Why is map design important ?
What are different types of small-scale maps ?
List out two major types of large-scale maps ?
How is a map different from a sketch ?
3. Write an explanatory account of types of maps.
(i)
(ii)
(iii)
(iv)
(v)