Embed Size (px)
Citation preview
Page 1 of 10
Introduction to Broadband Platform Data Set
This short document is archived for a data set which contains selected recorded and synthetic
seismograms per ASCE 7 Standard, with credits to the SCEC research project “Demonstration of
the Efficacy of the BBP Validation Gauntlets for Building Response Analysis Application”.
Site and Seismic Hazard
Three benchmark sites were selected with a wide coverage of different faulting mechanisms, fault
distances, and site conditions (Table 1). Table 2, 3, and 4 list the seismic hazard deaggregation
information for each site at three hazard levels (10%, 2%, and 0.25% in 50 years).
Table 1. Benchmark sites.
Site name Location Vs30 (m/s) Site class
San Francisco Downtown (8029-RIN) 37.389 N, 122.391 W 873 B
Los Angeles Downtown (LADT) 34.052 N, 188.257 W 390 C
San Bernardino (S688) 34.104 N, 117.288 W 280 D
Table 2. Seismic hazard deaggregation for 8029-RIN.
Hazard Level
T = 3.0 sec T = 5.0 sec
R (km) M ε0 Sa (g) R (km) M ε0 Sa (g)
10%/50yr 19.6 7.64 0.74 0.102 15.5 7.63 0.71 0.059
2%/50yr 15.4 7.80 1.38 0.199 14.4 7.79 1.38 0.122
2%/200yr 14.1 7.87 1.83 0.303 14.2 7.86 1.84 0.191
Table 3. Seismic hazard deaggregation for LADT.
Hazard Level
T = 3.0 sec T = 5.0 sec
R (km) M ε0 Sa (g) R (km) M ε0 Sa (g)
10%/50yr 26.9 7.12 0.99 0.146 32.0 7.21 1.07 0.081
2%/50yr 17.5 7.06 1.51 0.265 23.3 7.20 1.57 0.150
2%/200yr 12.6 7.03 1.84 0.393 18.1 7.18 1.89 0.225
Table 4. Seismic hazard deaggregation for S688.
Hazard Level
T = 3.0 sec T = 5.0 sec
R (km) M ε0 Sa (g) R (km) M ε0 Sa (g)
10%/50yr 5.6 7.53 0.81 0.411 6.1 7.55 0.79 0.239
2%/50yr 3.7 7.59 1.58 0.809 4.1 7.61 1.54 0.496
2%/200yr 2.8 7.63 2.06 1.234 3.2 7.66 2.00 0.780
Page 2 of 10
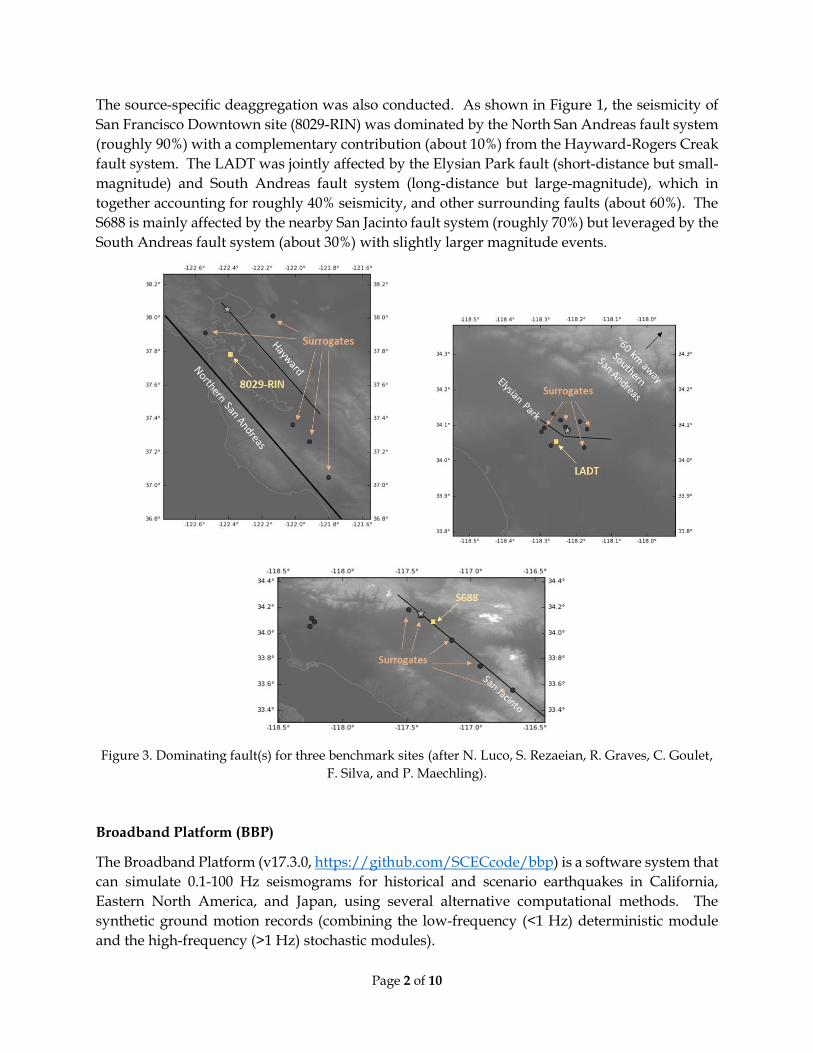
The source-specific deaggregation was also conducted. As shown in Figure 1, the seismicity of
San Francisco Downtown site (8029-RIN) was dominated by the North San Andreas fault system
(roughly 90%) with a complementary contribution (about 10%) from the Hayward-Rogers Creak
fault system. The LADT was jointly affected by the Elysian Park fault (short-distance but small-
magnitude) and South Andreas fault system (long-distance but large-magnitude), which in
together accounting for roughly 40% seismicity, and other surrounding faults (about 60%). The
S688 is mainly affected by the nearby San Jacinto fault system (roughly 70%) but leveraged by the
South Andreas fault system (about 30%) with slightly larger magnitude events.
Figure 3. Dominating fault(s) for three benchmark sites (after N. Luco, S. Rezaeian, R. Graves, C. Goulet,
F. Silva, and P. Maechling).
Broadband Platform (BBP)
The Broadband Platform (v17.3.0, https://github.com/SCECcode/bbp) is a software system that
can simulate 0.1-100 Hz seismograms for historical and scenario earthquakes in California,
Eastern North America, and Japan, using several alternative computational methods. The
synthetic ground motion records (combining the low-frequency (<1 Hz) deterministic module
and the high-frequency (>1 Hz) stochastic modules).
Page 3 of 10
In this demonstration study, overall 4192 seismograms (Table 5) were generated by Graves-
Pitarka method (GP), given the source descriptions of 5 major faults and 1-D soil velocity fields
which in together dominate the seismic hazard of three benchmark sites (San Francisco
Downtown, Los Angeles Downtown, and San Bernardino).
Table 5. Seismic sources, records, and benchmark sites.
Seismic source Record number Benchmark site
North San Andreas (M 8.0) 1152 8029-RIN
Hayward (M 7.0) 576
Elysian Park (M 6.6) 704 LADT
San Jacinto (M 7.8) 1408 S688
South San Andreas (M 7.9) 352 LADT and S688
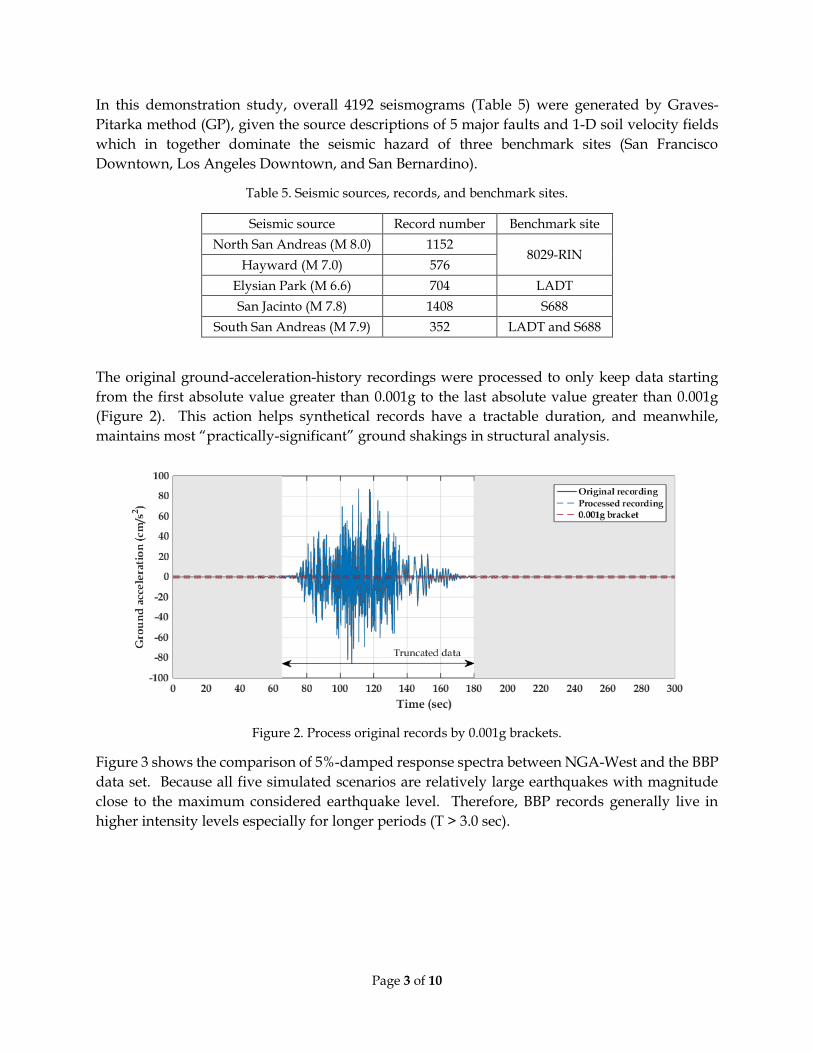
The original ground-acceleration-history recordings were processed to only keep data starting
from the first absolute value greater than 0.001g to the last absolute value greater than 0.001g
(Figure 2). This action helps synthetical records have a tractable duration, and meanwhile,
maintains most “practically-significant” ground shakings in structural analysis.
Figure 2. Process original records by 0.001g brackets.
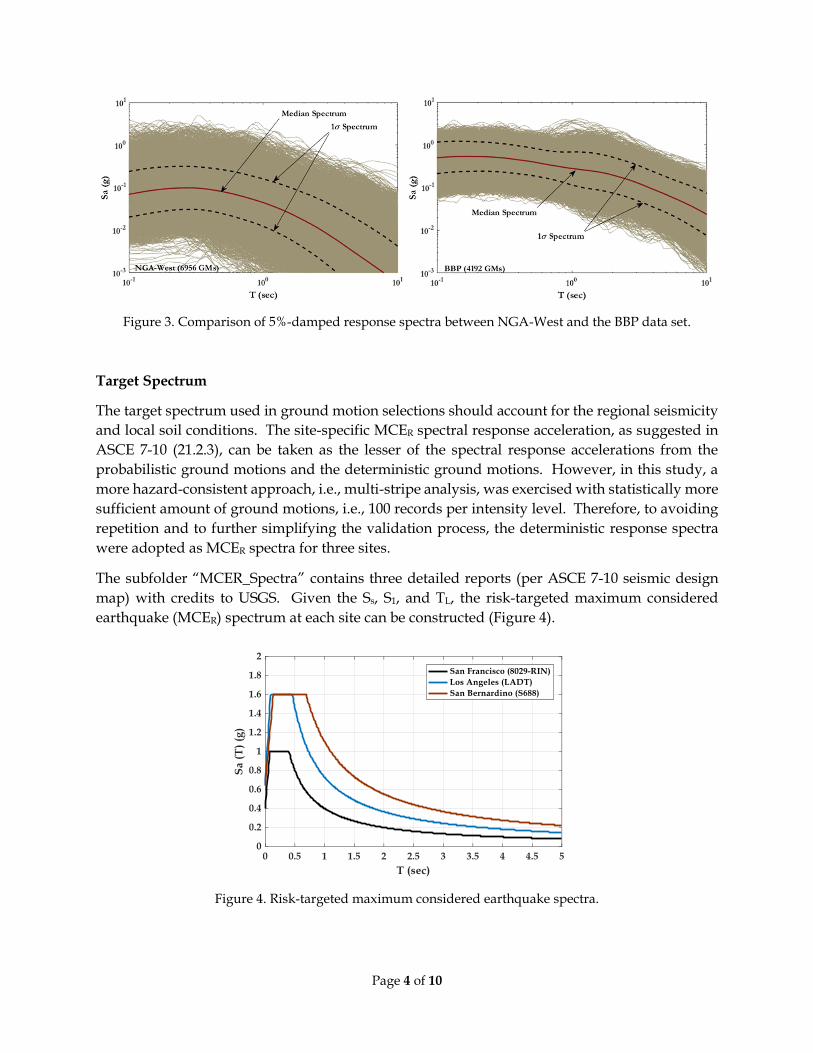
Figure 3 shows the comparison of 5%-damped response spectra between NGA-West and the BBP
data set. Because all five simulated scenarios are relatively large earthquakes with magnitude
close to the maximum considered earthquake level. Therefore, BBP records generally live in
higher intensity levels especially for longer periods (T > 3.0 sec).
Page 4 of 10
Figure 3. Comparison of 5%-damped response spectra between NGA-West and the BBP data set.
Target Spectrum
The target spectrum used in ground motion selections should account for the regional seismicity
and local soil conditions. The site-specific MCER spectral response acceleration, as suggested in
ASCE 7-10 (21.2.3), can be taken as the lesser of the spectral response accelerations from the
probabilistic ground motions and the deterministic ground motions. However, in this study, a
more hazard-consistent approach, i.e., multi-stripe analysis, was exercised with statistically more
sufficient amount of ground motions, i.e., 100 records per intensity level. Therefore, to avoiding
repetition and to further simplifying the validation process, the deterministic response spectra
were adopted as MCER spectra for three sites.
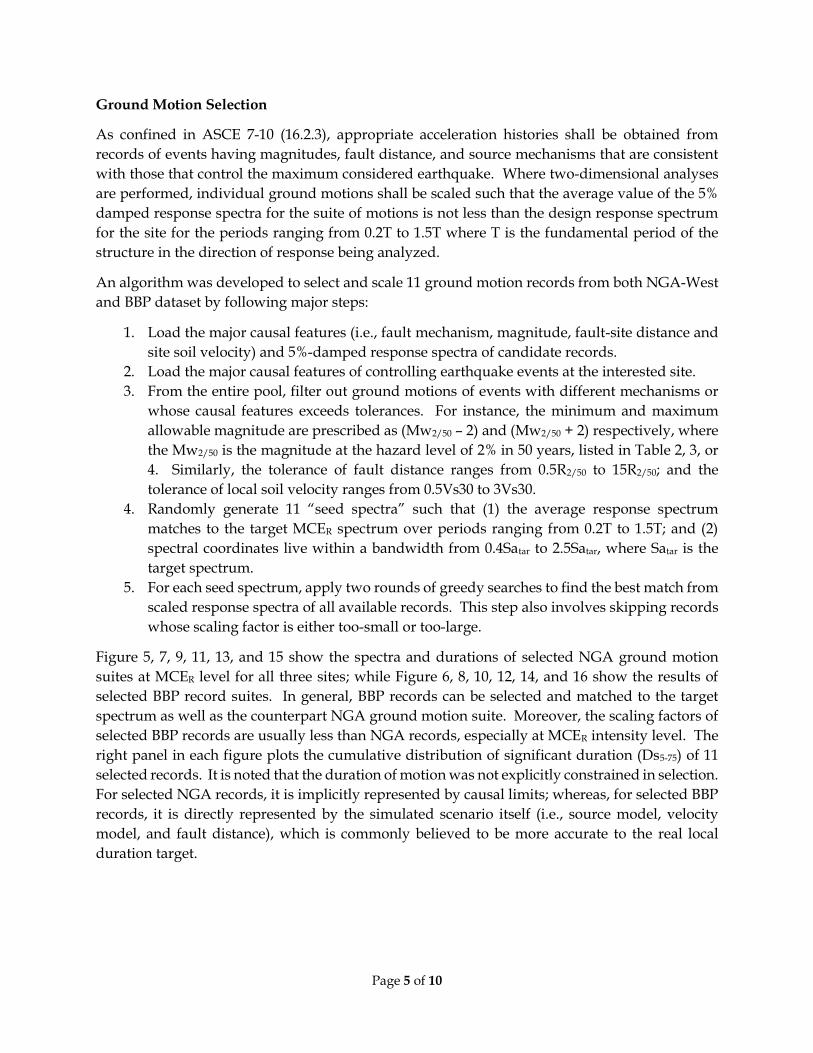
The subfolder “MCER_Spectra” contains three detailed reports (per ASCE 7-10 seismic design
map) with credits to USGS. Given the Ss, S1, and TL, the risk-targeted maximum considered
earthquake (MCER) spectrum at each site can be constructed (Figure 4).
Figure 4. Risk-targeted maximum considered earthquake spectra.
Page 5 of 10
Ground Motion Selection
As confined in ASCE 7-10 (16.2.3), appropriate acceleration histories shall be obtained from
records of events having magnitudes, fault distance, and source mechanisms that are consistent
with those that control the maximum considered earthquake. Where two-dimensional analyses
are performed, individual ground motions shall be scaled such that the average value of the 5%
damped response spectra for the suite of motions is not less than the design response spectrum
for the site for the periods ranging from 0.2T to 1.5T where T is the fundamental period of the
structure in the direction of response being analyzed.
An algorithm was developed to select and scale 11 ground motion records from both NGA-West
and BBP dataset by following major steps:
1. Load the major causal features (i.e., fault mechanism, magnitude, fault-site distance and
site soil velocity) and 5%-damped response spectra of candidate records.
2. Load the major causal features of controlling earthquake events at the interested site.
3. From the entire pool, filter out ground motions of events with different mechanisms or
whose causal features exceeds tolerances. For instance, the minimum and maximum
allowable magnitude are prescribed as (Mw2/50 – 2) and (Mw2/50 + 2) respectively, where
the Mw2/50 is the magnitude at the hazard level of 2% in 50 years, listed in Table 2, 3, or
4. Similarly, the tolerance of fault distance ranges from 0.5R2/50 to 15R2/50; and the
tolerance of local soil velocity ranges from 0.5Vs30 to 3Vs30.
4. Randomly generate 11 “seed spectra” such that (1) the average response spectrum
matches to the target MCER spectrum over periods ranging from 0.2T to 1.5T; and (2)
spectral coordinates live within a bandwidth from 0.4Satar to 2.5Satar, where Satar is the
target spectrum.
5. For each seed spectrum, apply two rounds of greedy searches to find the best match from
scaled response spectra of all available records. This step also involves skipping records
whose scaling factor is either too-small or too-large.
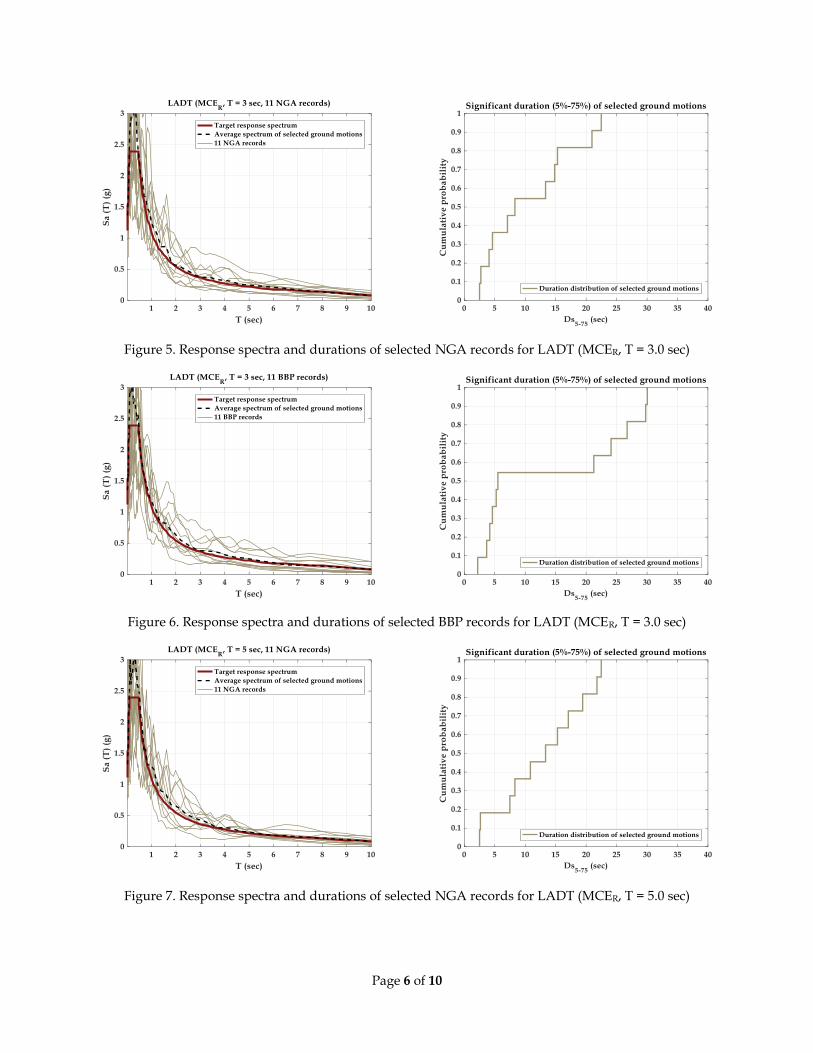
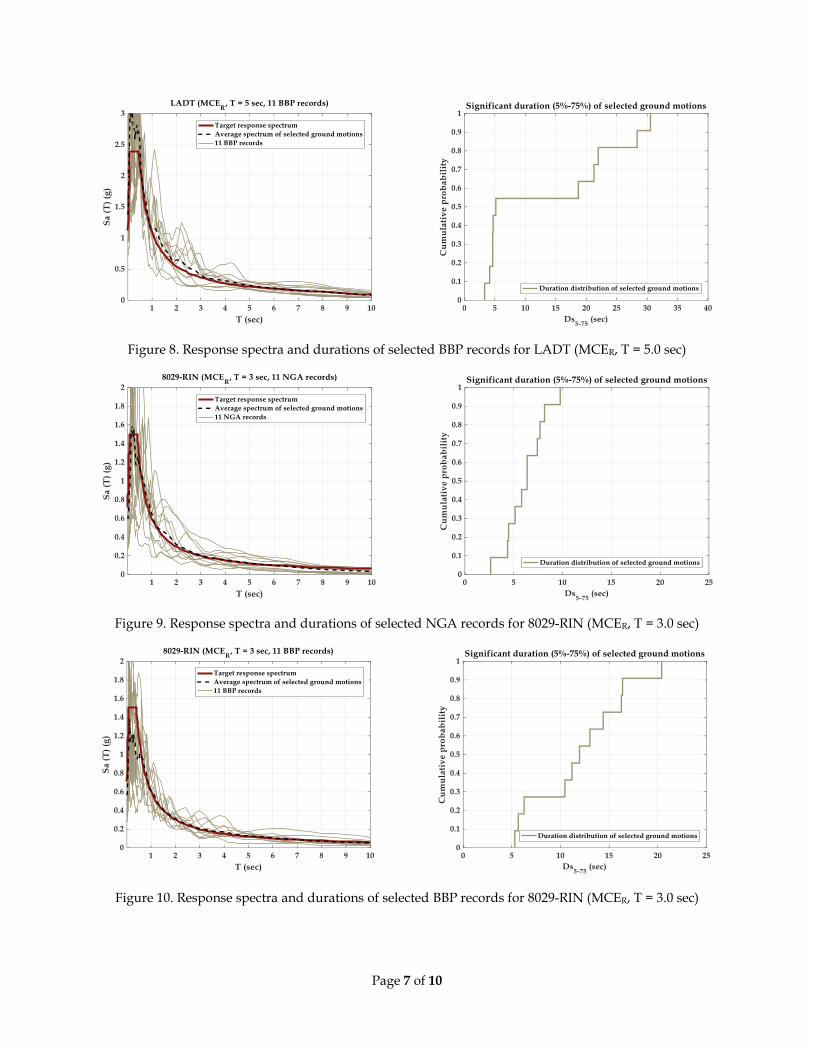
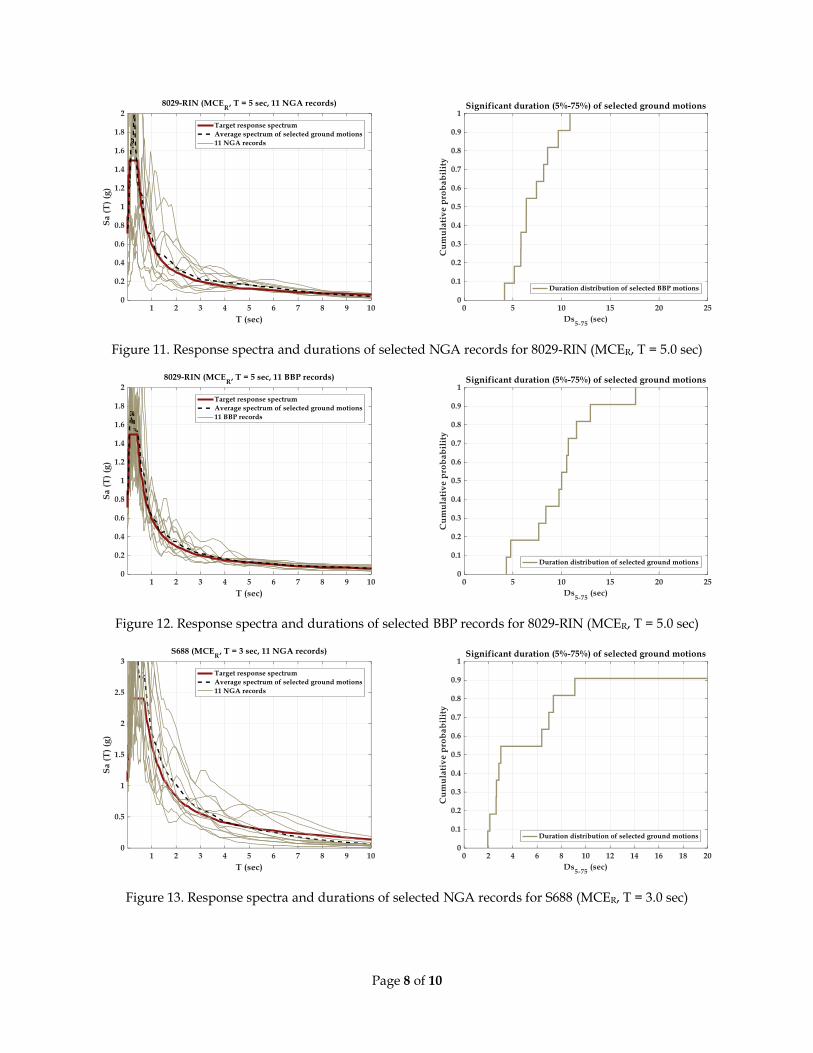
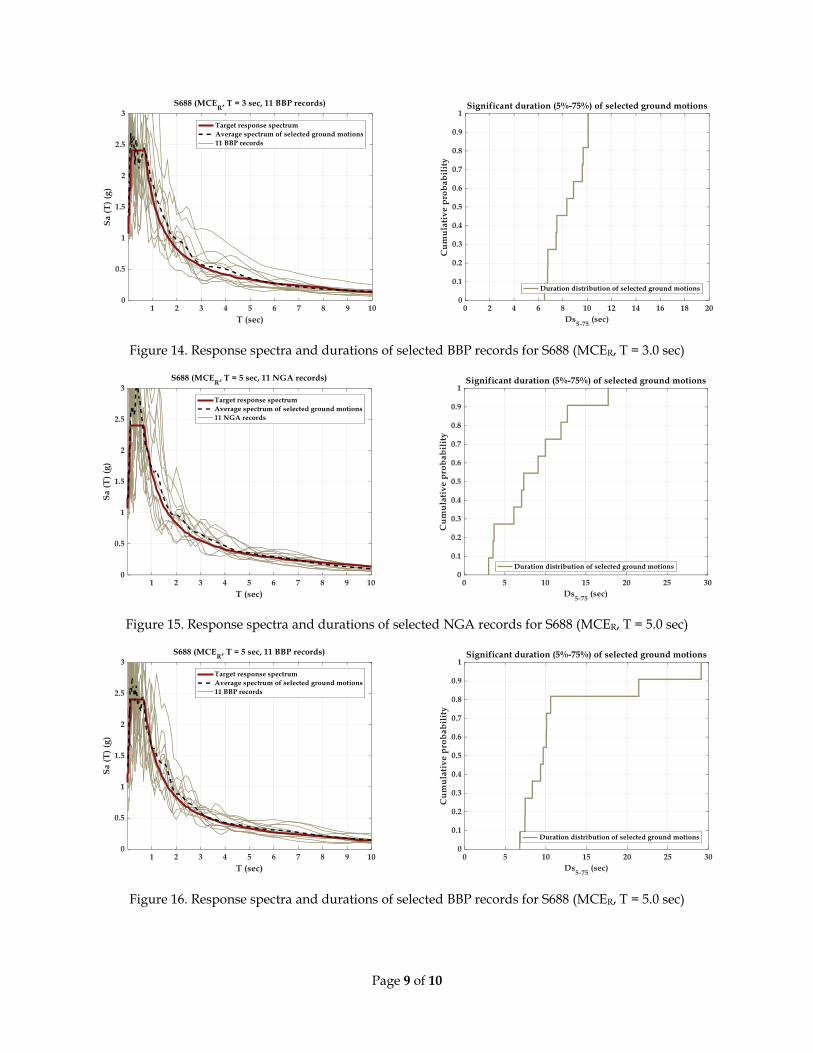
Figure 5, 7, 9, 11, 13, and 15 show the spectra and durations of selected NGA ground motion
suites at MCER level for all three sites; while Figure 6, 8, 10, 12, 14, and 16 show the results of
selected BBP record suites. In general, BBP records can be selected and matched to the target
spectrum as well as the counterpart NGA ground motion suite. Moreover, the scaling factors of
selected BBP records are usually less than NGA records, especially at MCER intensity level. The
right panel in each figure plots the cumulative distribution of significant duration (Ds5-75) of 11
selected records. It is noted that the duration of motion was not explicitly constrained in selection.
For selected NGA records, it is implicitly represented by causal limits; whereas, for selected BBP
records, it is directly represented by the simulated scenario itself (i.e., source model, velocity
model, and fault distance), which is commonly believed to be more accurate to the real local
duration target.
Page 6 of 10
Figure 5. Response spectra and durations of selected NGA records for LADT (MCER, T = 3.0 sec)
Figure 6. Response spectra and durations of selected BBP records for LADT (MCER, T = 3.0 sec)
Figure 7. Response spectra and durations of selected NGA records for LADT (MCER, T = 5.0 sec)
Page 7 of 10
Figure 8. Response spectra and durations of selected BBP records for LADT (MCER, T = 5.0 sec)
Figure 9. Response spectra and durations of selected NGA records for 8029-RIN (MCER, T = 3.0 sec)
Figure 10. Response spectra and durations of selected BBP records for 8029-RIN (MCER, T = 3.0 sec)
Page 8 of 10
Figure 11. Response spectra and durations of selected NGA records for 8029-RIN (MCER, T = 5.0 sec)
Figure 12. Response spectra and durations of selected BBP records for 8029-RIN (MCER, T = 5.0 sec)
Figure 13. Response spectra and durations of selected NGA records for S688 (MCER, T = 3.0 sec)
Page 9 of 10
Figure 14. Response spectra and durations of selected BBP records for S688 (MCER, T = 3.0 sec)
Figure 15. Response spectra and durations of selected NGA records for S688 (MCER, T = 5.0 sec)
Figure 16. Response spectra and durations of selected BBP records for S688 (MCER, T = 5.0 sec)
Page 10 of 10
Directory of Data Set
1. Introduction_BBP_ASCE7.pdf: the document briefly introducing the basic information
about the data set.
2. Flatfile.xlsx: the spreadsheet summarizing unscaled 5%-damped response spectra (PSA),
significant duration (Ds5-75), and scaling factors of selected NGA and BBP ground motion
suites at MCER intensity level. The overall number of documented records is 132.
3. Figure_Spectra_Duration: the subfolder containing JPGE-format figures of response
spectra and durations of selected NGA and BBP records.
4. MCER_Spectra: the subfolder containing seismic design map reports (after the USGS
seismic design online tool) per ASCE 7-10 Standard.
5. RecordSet_BBP: the subfolder containing selected ground motion suites (i.e., ground
motion lists and ground acceleration histories) for three sites, two fundamental periods,
and two intensity levels.
6. RecordSet_NGA: the subfolder containing selected ground motion suites (i.e., ground
motion lists) for three sites, two fundamental periods, and two intensity levels.
Reference:
1. Maechling, P. J., F. Silva, S. Callaghan, and T. H. Jordan (2015). SCEC Broadband Platform:
System Architecture and Software Implementation, Seismol. Res. Lett., 86, no. 1, doi:
10.1785/0220140125.
2. Goulet, C.A., Abrahamson, N.A., Somerville, P.G. and K, E. Wooddell (2015) The SCEC
Broadband Platform Validation Exercise: Methodology for Code Validation in the Context
of Seismic-Hazard Analyses, Seismol. Res. Lett., 86, no. 1, doi: 10.1785/0220140104.
3. Graves, R., and Pitarka, A. (2015) Refinements to the Graves and Pitarka (2010) Broadband
Ground‐Motion Simulation Method Seismological Research Letters, January/February
2015, v. 86, p. 75-80, First published on December 17, 2014, doi:10.1785/0220140101.
4. N. Jayaram, T. Lin, & J. W. Baker. A Computationally Efficient Ground-Motion Selection
Algorithm for Matching a Target Response Spectrum Mean and Variance. 2011.
5. ASCE. 2010. Minimum Design Loads for Buildings and Other Structures. ASCE/SEI
Standard 7-10.