Embed Size (px)
Citation preview
Intraseasonal Variability of the West African Monsoon and Atlantic ITCZ
ERIC D. MALONEY AND JEFFREY SHAMAN
College of Oceanic and Atmospheric Sciences, Oregon State University, Corvallis, Oregon
(Manuscript received 18 April 2007, in final form 1 October 2007)
ABSTRACT
Intraseasonal variability of boreal summer rainfall and winds in tropical West Africa and the east Atlanticis examined using daily Tropical Rainfall Measuring Mission (TRMM) precipitation and the NCEP–NCARreanalysis during 1998–2006. Intraseasonal precipitation variability is dominated by two significant spectralpeaks at time scales near 15 and 50 days, accompanied by corresponding peaks in eddy kinetic energy(EKE) and eddy enstrophy. Regional precipitation variability on 30–90-day time scales is significantlycorrelated (�0.6) with a global Madden–Julian oscillation time series based on equatorial zonal winds,supporting the results of A. J. Matthews. The overall amplitude of the 30–90-day West African monsoonprecipitation variability during a given summer, however, does not appear to be strongly regulated byinterannual variability in MJO amplitude.
Composite analysis and complex empirical orthogonal function analysis shows that 30–90-day precipita-tion anomalies are generally zonally elongated, grow and decay in place, and have maximum amplitude nearthe Gulf of Guinea and in the Atlantic ITCZ. Composite 30–90-day enhanced precipitation events areaccompanied by a significant suppression of eastern North Atlantic trade winds. Suppressed 30–90-dayprecipitation events are associated with an enhancement of the Atlantic trade winds. Enhanced (sup-pressed) EKE occurs just to the north of the east Atlantic ITCZ during positive (negative) 30–90-dayprecipitation events, with the maximum EKE magnitude lagging precipitation events by about 5 days.
East Atlantic tropical cyclone activity is significantly modulated on intraseasonal time scales. The numberof tropical cyclones that occur in the Atlantic’s main development region to the east of 60°W is suppressedabout 5–10 days before maxima in a regional intraseasonal precipitation time series, and enhanced about5–10 days after time series maxima. An analysis of east Atlantic tropical cyclone activity based on anequatorial MJO index produces similar results. Consistent with the results of K. C. Mo, variations in verticalshear may help explain this modulation of tropical cyclone activity.
1. Introduction
Tropical West Africa and the eastern Atlantic arecharacterized by complex interactions across manytime and space scales during boreal summer (e.g.,Redelsperger et al. 2002; Nicholson and Grist 2003;Redelsperger et al. 2006). Intraseasonal variability ofthe West African monsoon has received increased at-tention of late and was a significant motivation for therecent African Monsoon Multidisciplinary Analysis(AMMA; Redelsperger et al. 2006). Boreal summervariations in rainfall and winds over tropical and sub-tropical West Africa and adjacent regions of the Atlan-
tic appear to be dominated by two distinct time scalesof 10–25 days and 25–60 days (e.g., Janicot and Sultan2001; Sultan et al. 2003; Mounier et al. 2008). Intra-seasonal variability on 10–25-day time scales has beenmore thoroughly documented than that at longer timescales. Rainy periods associated with 10–25-day vari-ability are accompanied by an enhancement of moistlow-level southwesterly flow into sub-Saharan Africaand an enhancement of African easterly wave activity(Sultan and Janicot 2003). The meridional isentropicpotential vorticity (IPV) gradient in West Africa ap-pears to exhibit fluctuations on 10–25-day times thatmay be related to variations in African easterly waveactivity (e.g., Lavaysse et al. 2006).
Examination of boreal summer West African mon-soon variability at time scales of greater than 25 dayshas been more limited. Although time scales of 10–25days are thought to dominate West African monsoon
Corresponding author address: Eric D. Maloney, Departmentof Atmospheric Science, Colorado State University, 1371 CampusDelivery, Fort Collins, CO 80523-1371.E-mail: [email protected]
2898 J O U R N A L O F C L I M A T E VOLUME 21
DOI: 10.1175/2007JCLI1999.1
© 2008 American Meteorological Society
JCLI1999
variations (e.g., Sultan et al. 2003), previous studiesnote that substantial intraseasonal monsoon variabilityoccurs at time scales of greater than 25 days (Janicotand Sultan 2001; Sultan et al. 2003). Gu and Adler(2004) recently used Tropical Rainfall Measuring Mis-sion (TRMM) precipitation to show that a distinct25–50-day peak in eastward-propagating variabilityat zonal wavenumbers 1–5 can be found in the WestAfrican monsoon region during boreal summer.
The impact of global modes of intraseasonal variabil-ity on boreal summer West African monsoon rainfalland winds is less understood. An example of such amode of variability is the Madden–Julian oscillation(MJO; e.g., Madden and Julian 2005), characterized by30–90-day time scales. Foltz and McPhaden (2004)found a significant modulation of Atlantic trade windsby the MJO through comparison to an outgoing long-wave radiation (OLR)-based MJO index. However, theMJO influence was not stratified by season, and overallintraseasonal variability in surface winds peaked duringboreal winter in association with the North AtlanticOscillation. Matthews (2004) documented 20–200-dayvariability in winds and convection over the easternAtlantic and sub-Saharan Africa during boreal sum-mer, and he suggested a connection to the global MJO.Matthews showed that OLR anomalies associated withthe leading 20–200-day mode of variability over tropicalWest Africa and the east Atlantic are zonally elongatedand modulate the strength of convection at the meanposition of the intertropical convergence zone (ITCZ).Equatorial Kelvin waves induced by the MJO in thePacific may initiate West African convection, whichthen locally amplifies through interactions with thelarge-scale circulation (similar to the east Pacific am-plification mechanism described by Maloney and Es-bensen 2003). Matthews (2004) also suggested that theMJO may alter the IPV gradient over sub-Saharan Af-rica, making African easterly wave (AEW) formationmore favorable there during periods of enhanced mon-soonal low-level westerly flow and precipitation. Re-versal of the IPV gradient over West Africa producesconditions favorable for the growth of AEWs throughcombined barotropic and baroclinic instability (Thorn-croft and Hoskins 1994a,b). A modeling study byThorncroft and Rowell (1998) suggests that under-standing AEW activity in a given season is tantamountto understanding intraseasonal variability of the IPVgradient over sub-Saharan Africa.
It should be stressed that the influence of the MJOon wind, precipitation, and AEWs over the Africanmonsoon region remains unclear. The influence of theMJO on sub-Saharan Africa has been found to be weakin many studies (e.g., Knutson and Weickmann 1987;
Annamalai and Slingo 2001; Wheeler and Weickmann2001) and almost nonexistent in others (e.g., Knutsonet al. 1986; Murakami et al. 1986; Maloney and Hart-mann 2000a). However, Matthews’s (2004) work sug-gests that strong MJO events can have a remote influ-ence on the African monsoon region and modulateprecipitation, winds, and AEW activity there. If theWest African monsoon is influenced by coherent globalmodes of intraseasonal variability such as the MJO,skillful subseasonal forecasts for this region may be re-alized, which may have important consequences be-cause the Sahel is a source of easterly waves that canspawn tropical cyclones (TCs; e.g., Landsea et al. 1998;Vintzileos and Thiaw 2006).
Modulation of Atlantic tropical cyclones by the MJOhas been previously examined by Maloney and Hart-mann (2000b) and Mo (2000). Maloney and Hartmann(2000b) showed a significant MJO-related modulationof tropical cyclones in the western part of the Atlantic,including the Gulf of Mexico and the Caribbean Sea.Hurricanes were 4 times more likely to occur duringcertain phases of the MJO than others. Mo (2000) ana-lyzed a larger portion of the Atlantic basin and found asignificant modulation of TC activity by the MJO. Pri-mary emphasis was placed on the area to the west of60°W, where TC activity varied with the first principalcomponent of Eastern Hemisphere OLR used to definethe MJO. Mo (2000) cited vertical shear variations asone possible explanation for this modulation of tropicalcyclone activity. Vertical shear has been found by manyprevious studies to be a factor in tropical cyclogenesispotential (e.g., Shapiro 1987; Gray 1998; Camargo et al.2007).
In this paper, we examine intraseasonal variability ofthe West African monsoon, with emphasis on 30–90-day time-scale variability, time scales typically associ-ated with the MJO. We use satellite-based daily meanTropical Rainfall Measuring Mission precipitation datato examine the spatial structure of 30–90-day variationsof precipitation during boreal summer. This work ismotivated in part by the analysis of Gu and Adler(2004), who examined the spectral characteristics ofWest African and the Atlantic ITCZ intraseasonal vari-ability using TRMM precipitation, although these au-thors did not examine the spatial structure of such vari-ability. Our analysis of the spatial structure of precipi-tation variability also includes a complex empiricalorthogonal function analysis, which succinctly capturesthe propagation characteristics of such variability. Guand Adler (2004) also did not explicitly examine therelationship of such variability to global modes of vari-ability. We will test the contention of Matthews (2004)that the MJO significantly impacts boreal summer vari-
15 JUNE 2008 M A L O N E Y A N D S H A M A N 2899
ability in the West African monsoon region, throughexplicitly relating West African precipitation variabilityto a global MJO index derived by Maloney and Hart-mann (1998). Our analysis also examines how tropicalsynoptic eddy and cyclone activity varies with 30–90-day oscillations of the West African monsoon. Thisanalysis will concentrate on the east Atlantic ITCZ re-gion between 60°W and the African coast, an area thatwas noted but received relatively little emphasis in theinvestigations of Mo (2000) and Maloney and Hart-mann (2000b). In general, our work builds on previouswork related to 30–90-day variability of the West Afri-can monsoon by using improved datasets and by em-ploying new and/or expanded analyses that providefurther insight into the intraseasonal variability of thisregion.
Section 2 describes the datasets used in this study.Section 3 briefly describes the general characteristics ofintraseasonal variability in the West African monsoonregion, as well as the spectral characteristics of intra-seasonal precipitation. Section 3 also examines the re-lationship of regional 30–90-day precipitation variabil-ity to the MJO. Section 4 describes the spatial structureof boreal summer 30–90-day wind, precipitation, andeddy kinetic energy anomalies in the Atlantic ITCZand West Africa. Section 5 describes the modulation ofeast Atlantic TC activity on 30–90-day time scales. Sec-tion 6 presents conclusions and discussion.
2. Data
We use daily mean precipitation fields during June–October of 1998–2006 from the TRMM 3B42, version 6,product, incorporating several satellite measurementsincluding the TRMM Microwave Imager (TMI) andTRMM precipitation radar to calibrate infrared pre-cipitation estimates from geostationary satellites (e.g.,Huffman et al. 2001). For calculation of spectra, anexpanded May–October period is used to minimizebandwidth so that spectral peaks at intraseasonal timescales can be better resolved. May–October spectra arequalitatively consistent with those derived from theshorter June–October period, however. The precipita-tion data were downloaded from the Goddard SpaceFlight Center Distributed Access Archive System on a0.25° � 0.25° grid (accessed from http://trmm.gsfc.nasa.gov/). For more efficient analysis, precipitationdata were first averaged to a 1° � 1° grid, althoughsensitivity tests using a subset of the analyses describedbelow show similar results for a 0.25° � 0.25° grid.Nicholson et al. (2003) showed that the TRMM 3B42product produces relatively small rainfall biases in WestAfrica during summertime relative to gauge data, at
least at monthly to seasonal time scales. Maloney andEsbensen (2007) used TRMM precipitation during1998–2005 to examine the intraseasonal variability ofeast Pacific warm pool precipitation during borealsummer.
National Centers for Environmental Prediction(NCEP)–National Center for Atmospheric Research(NCAR) reanalysis I wind fields and related derivedquantities such as eddy kinetic energy and eddy enstro-phy were used from the surface to 100 hPa during 1998–2006 (Kalnay et al. 1996). Oceanic surface winds fromNCEP reanalysis show general agreement to QuickScatterometer (QuikSCAT) ocean vector winds (e.g.,Chelton and Freilich 2005) during June–October of2000–06 in the West African monsoon region whencomparing seasonal mean winds and intraseasonalwind anomalies, although synoptic-scale eddy varianceappears to be higher in QuikSCAT than in NCEPreanalysis. We note specific comparisons betweenQuikSCAT and NCEP winds below. NCEP reanalysis850-hPa zonal winds were used for an extended periodfrom 1979–2006 to develop an equatorial MJO indexfor use in comparison to West African and Atlanticintraseasonal variability.
We use the Atlantic hurricane best-track datasetfrom the National Hurricane Center (NHC)–TropicalPrediction Center (Jarvinen et al. 1984) to examinevariations in Atlantic tropical cyclone activity to theeast of 60°W during 1998–2006. The entire dataset ex-tends back to 1851. Positions and intensities of Atlantictropical cyclones are recorded 4 times daily at 0000,0600, 1200, and 1800 UTC.
3. Variance and time series analysis
a. Mean and variance fields
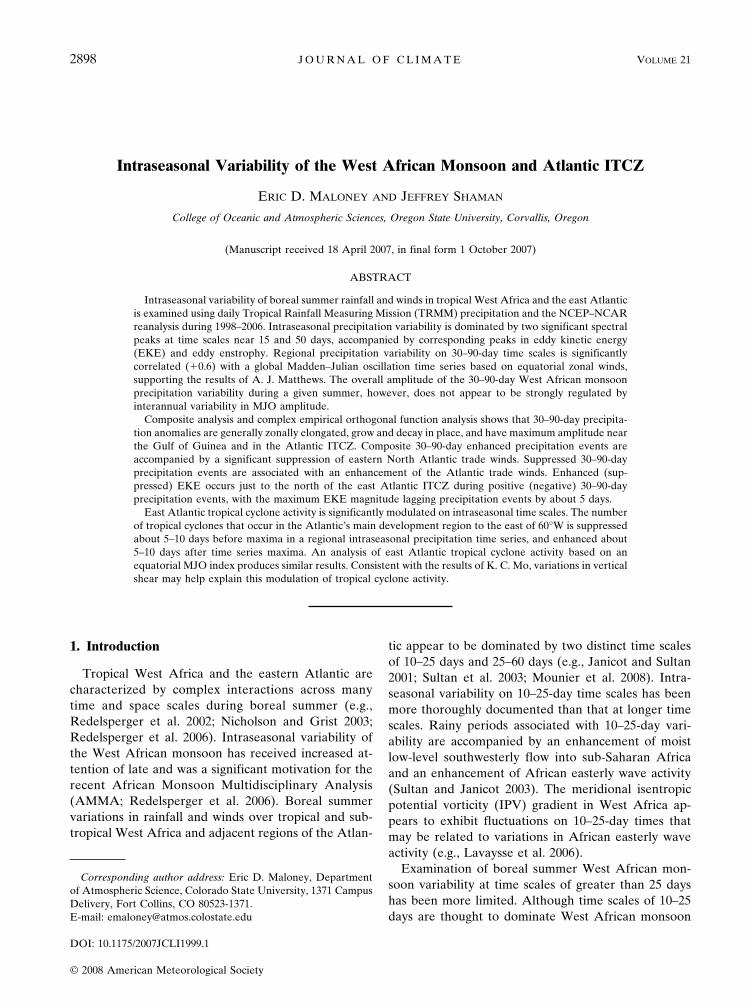
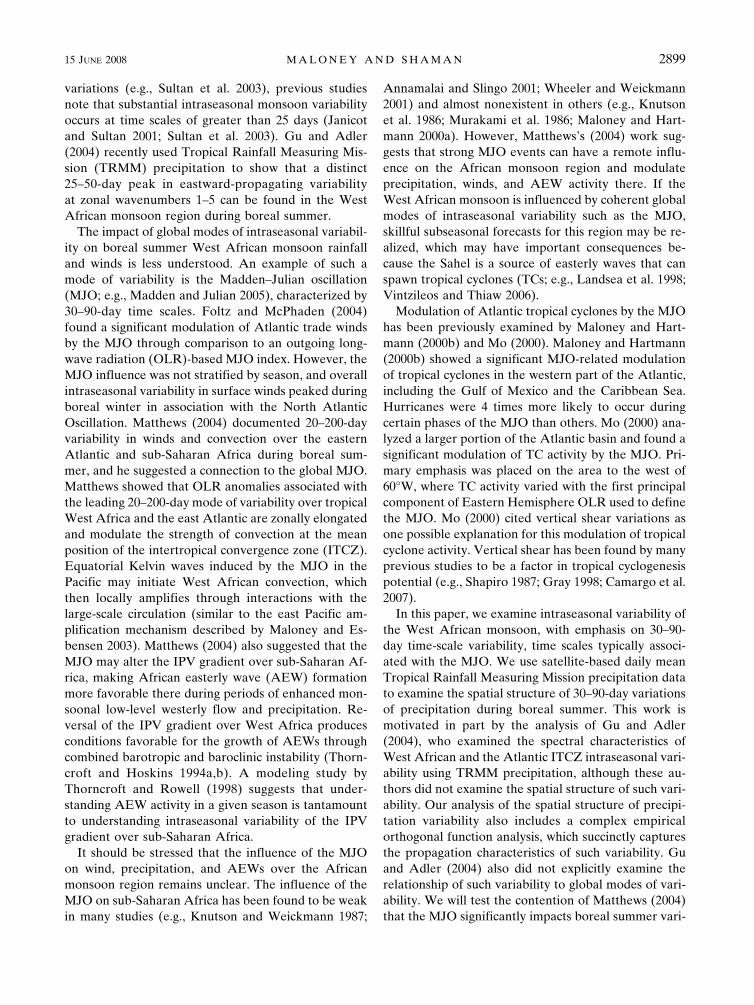
Mean June–October precipitation is shown in Fig. 1a,indicating high mean precipitation in the ITCZ along7°N in the Atlantic and general enhanced mean pre-cipitation across most of western North Africa to thesouth of 16°N. A prominent precipitation maximumcentered about 5°N, 8°E exists near the Gulf of Guinea.
Figure 1b shows June–October intraseasonal precipi-tation variance during 1998–2006. This plot shows totalintraseasonal variance and does not select for certainintraseasonal periods through bandpass filtering. Totalintraseasonal precipitation variance is defined as fol-lows: 1) the seasonal cycle is constructed by averagingdata on each calendar day over all 9 yr, and thensmoothed using six passes of a 1–2–1 running filter (ef-fectively a 9-day low-pass filter). This seasonal cycle isthen removed from the raw precipitation data; 2) a low-
2900 J O U R N A L O F C L I M A T E VOLUME 21
pass filter with half-power point at 10 days is used toremove most synoptic-scale precipitation variability(e.g., African easterly waves); and 3) the mean overeach individual June–October period is subtracted, ef-fectively removing the impacts of interannual variabil-ity. Figure 1b shows that intraseasonal precipitationvariance maximizes where mean precipitation is high,with strongest variance in the Gulf of Guinea and alongthe Atlantic ITCZ. Narrower frequency bands (e.g., 30–90 days) have qualitatively similar spatial distributionsto that shown in Fig. 1b, although smaller magnitudes(not shown).
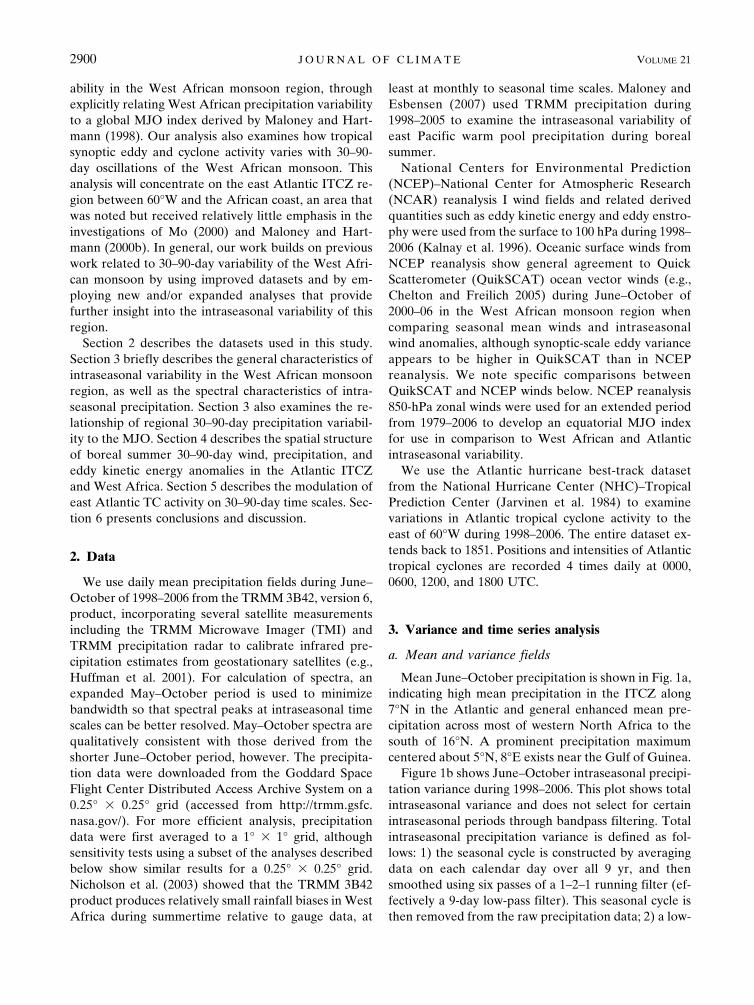
Figure 1c shows mean June–October surface windsfrom NCEP reanalysis during the period 1998–2006. Aswith other monsoonal regimes (e.g., east Pacific, Xieet al. 2005, Maloney and Esbensen 2007), the summer-time low-level flow is characterized by cross-equatorialflow that transitions to mean low-level southwesterlyflow to the north of the equator. The strongest meansouthwesterly flow occurs in the Gulf of Guinea andalong 10°N near the west coast of Africa in associationwith the Atlantic ITCZ. Grodsky et al. (2003) discussthis wind feature along the West African coast in detail,which takes the form of a low-level jet that can achievea daily mean wind speed of 10 m s�1 during peak years.
b. Power spectra
Previous work has shown that the dominant modes ofboreal summer intraseasonal variability at both 30–90-day and 10–25-day time scales are characterized by zon-ally extended structures with OLR anomalies of thesame sign spanning West Africa and the eastern Atlan-tic (e.g., Matthews 2004; Mounier and Janicot 2004).These zonally extended modes are characteristic ofmodulation of the mean areas of precipitation. Takingadvantage of the zonally extended nature of intra-seasonal variability suggested by these previous studies,we analyze the spectral characteristics of TRMM pre-cipitation averaged within a zonally extended box de-fined by 0°–14°N, 35°W–20°E, which spans West Africaand the Atlantic ITCZ and encompasses the region ofheightened intraseasonal variance as shown in Fig. 1b.While such an averaging region likely excludes contri-butions of westward-propagating variability at smallerspatial scales (�6000-km wavelength) that are also ob-served in the West African monsoon (e.g., Mounier andJanicot 2004; Sultan et al. 2003), we will show (follow-ing) in a complex empirical orthogonal function(CEOF) analysis that the leading mode of variability at30–90-day time scales appears to be characterized bythe type of zonally extended structure that we select forhere. We also feel that the larger averaging region em-ployed here will generate more robust statistics than asmaller averaging region, given the short 9-yr precipi-tation record employed and the inherently noisy natureof tropical precipitation.
Before we calculated spectra for each of the nineMay–October segments during 1998–2006, the seasonalcycle was removed. The seasonal cycle was computedby averaging fields on each calendar day of the yearacross all 9 yr of record, and then applying six passes ofa 1–2–1 running filter (as described in association withFig. 1b above). Results are not sensitive to the exactmeans by which the seasonal cycle is removed. Beforecalculation of each spectrum, the first and last 5% of
FIG. 1. June–October (a) mean precipitation, (b) intraseasonalprecipitation variance, and (c) mean surface wind vectors andzonal wind. The contour interval in (a) is 2 mm day�1, with valuesgreater than 4 mm day�1 shaded. The contour interval in (b) is20 mm2 day�2, with values greater than 40 mm2 day�2 shaded.The contour interval in (c) is 2 m s�1, with values greater (less)than 2 m s�1 (�2 m s�1) dark (light) shaded. The reference vector(m s�1) is shown at the bottom right. The rectangle in (b) showsthe averaging region used to define the regional precipitation timeseries.
15 JUNE 2008 M A L O N E Y A N D S H A M A N 2901
each May–October time series were tapered using acosine bell functional form to reduce spurious sidelobesin the frequency response function, which are gener-ated by the finite window length used to calculate thespectrum. Spectra are calculated on each individualMay–October period and then averaged across all 9 yrof the record. Degrees of freedom are maximized byapplying a 3-point Daniell smoother to the spectral es-timates (essentially a 1–2–1 smoother), with the result-ing spectral estimates each containing about 45 degreesof freedom. Smoothing results in more degrees of free-dom per spectral estimate at the expense of effectivebandwidth (e.g., Jenkins and Watts 1968). A red noisebackground spectrum is computed from the formula ofGilman et al. (1963), using the average of the 1-day andthe square root of the 2-day lag autocorrelations; thenthe 95% confidence limits about this red noise spec-trum are determined using the F statistic.
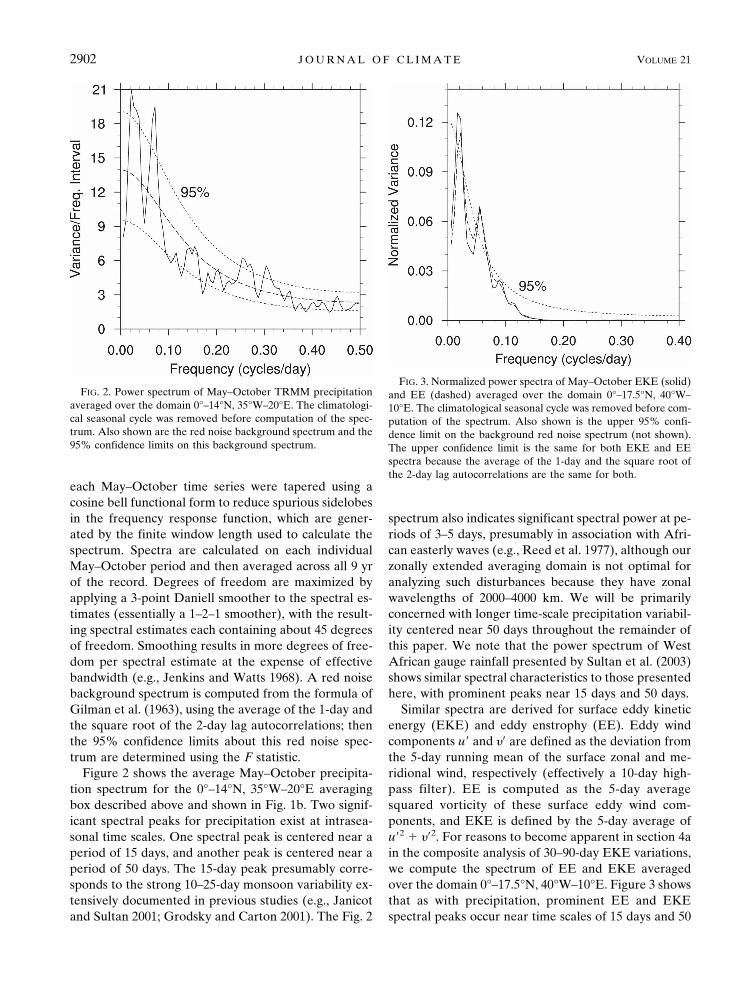
Figure 2 shows the average May–October precipita-tion spectrum for the 0°–14°N, 35°W–20°E averagingbox described above and shown in Fig. 1b. Two signif-icant spectral peaks for precipitation exist at intrasea-sonal time scales. One spectral peak is centered near aperiod of 15 days, and another peak is centered near aperiod of 50 days. The 15-day peak presumably corre-sponds to the strong 10–25-day monsoon variability ex-tensively documented in previous studies (e.g., Janicotand Sultan 2001; Grodsky and Carton 2001). The Fig. 2
spectrum also indicates significant spectral power at pe-riods of 3–5 days, presumably in association with Afri-can easterly waves (e.g., Reed et al. 1977), although ourzonally extended averaging domain is not optimal foranalyzing such disturbances because they have zonalwavelengths of 2000–4000 km. We will be primarilyconcerned with longer time-scale precipitation variabil-ity centered near 50 days throughout the remainder ofthis paper. We note that the power spectrum of WestAfrican gauge rainfall presented by Sultan et al. (2003)shows similar spectral characteristics to those presentedhere, with prominent peaks near 15 days and 50 days.
Similar spectra are derived for surface eddy kineticenergy (EKE) and eddy enstrophy (EE). Eddy windcomponents u� and �� are defined as the deviation fromthe 5-day running mean of the surface zonal and me-ridional wind, respectively (effectively a 10-day high-pass filter). EE is computed as the 5-day averagesquared vorticity of these surface eddy wind com-ponents, and EKE is defined by the 5-day average ofu�2 � ��2. For reasons to become apparent in section 4ain the composite analysis of 30–90-day EKE variations,we compute the spectrum of EE and EKE averagedover the domain 0°–17.5°N, 40°W–10°E. Figure 3 showsthat as with precipitation, prominent EE and EKEspectral peaks occur near time scales of 15 days and 50
FIG. 2. Power spectrum of May–October TRMM precipitationaveraged over the domain 0°–14°N, 35°W–20°E. The climatologi-cal seasonal cycle was removed before computation of the spec-trum. Also shown are the red noise background spectrum and the95% confidence limits on this background spectrum.
FIG. 3. Normalized power spectra of May–October EKE (solid)and EE (dashed) averaged over the domain 0°–17.5°N, 40°W–10°E. The climatological seasonal cycle was removed before com-putation of the spectrum. Also shown is the upper 95% confi-dence limit on the background red noise spectrum (not shown).The upper confidence limit is the same for both EKE and EEspectra because the average of the 1-day and the square root ofthe 2-day lag autocorrelations are the same for both.
2902 J O U R N A L O F C L I M A T E VOLUME 21
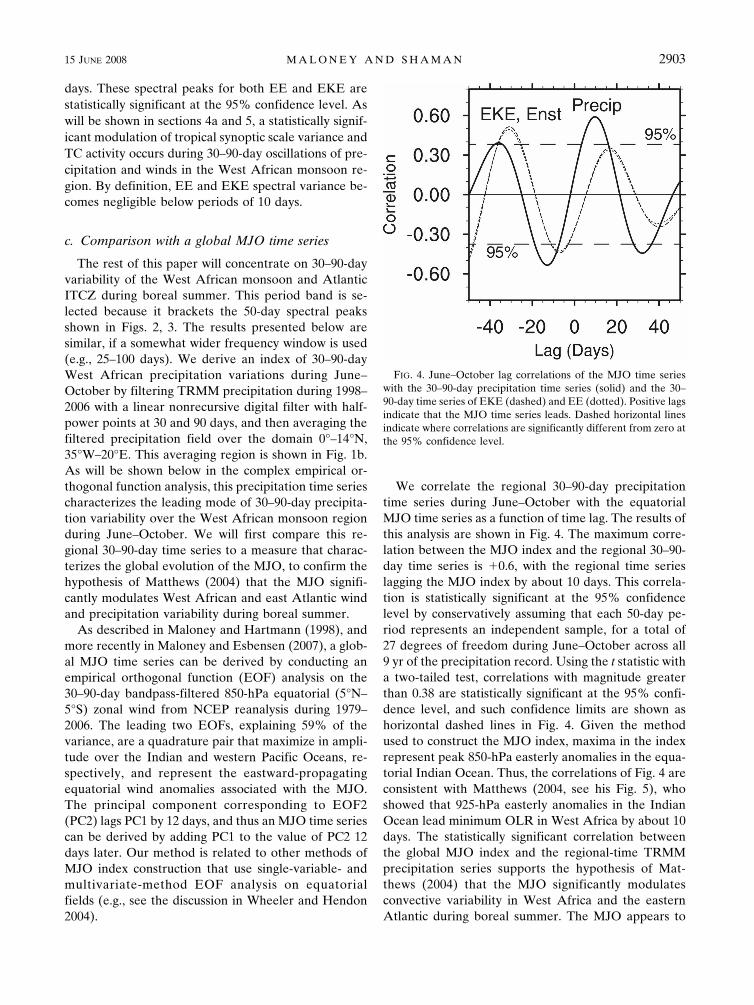
days. These spectral peaks for both EE and EKE arestatistically significant at the 95% confidence level. Aswill be shown in sections 4a and 5, a statistically signif-icant modulation of tropical synoptic scale variance andTC activity occurs during 30–90-day oscillations of pre-cipitation and winds in the West African monsoon re-gion. By definition, EE and EKE spectral variance be-comes negligible below periods of 10 days.
c. Comparison with a global MJO time series
The rest of this paper will concentrate on 30–90-dayvariability of the West African monsoon and AtlanticITCZ during boreal summer. This period band is se-lected because it brackets the 50-day spectral peaksshown in Figs. 2, 3. The results presented below aresimilar, if a somewhat wider frequency window is used(e.g., 25–100 days). We derive an index of 30–90-dayWest African precipitation variations during June–October by filtering TRMM precipitation during 1998–2006 with a linear nonrecursive digital filter with half-power points at 30 and 90 days, and then averaging thefiltered precipitation field over the domain 0°–14°N,35°W–20°E. This averaging region is shown in Fig. 1b.As will be shown below in the complex empirical or-thogonal function analysis, this precipitation time seriescharacterizes the leading mode of 30–90-day precipita-tion variability over the West African monsoon regionduring June–October. We will first compare this re-gional 30–90-day time series to a measure that charac-terizes the global evolution of the MJO, to confirm thehypothesis of Matthews (2004) that the MJO signifi-cantly modulates West African and east Atlantic windand precipitation variability during boreal summer.
As described in Maloney and Hartmann (1998), andmore recently in Maloney and Esbensen (2007), a glob-al MJO time series can be derived by conducting anempirical orthogonal function (EOF) analysis on the30–90-day bandpass-filtered 850-hPa equatorial (5°N–5°S) zonal wind from NCEP reanalysis during 1979–2006. The leading two EOFs, explaining 59% of thevariance, are a quadrature pair that maximize in ampli-tude over the Indian and western Pacific Oceans, re-spectively, and represent the eastward-propagatingequatorial wind anomalies associated with the MJO.The principal component corresponding to EOF2(PC2) lags PC1 by 12 days, and thus an MJO time seriescan be derived by adding PC1 to the value of PC2 12days later. Our method is related to other methods ofMJO index construction that use single-variable- andmultivariate-method EOF analysis on equatorialfields (e.g., see the discussion in Wheeler and Hendon2004).
We correlate the regional 30–90-day precipitationtime series during June–October with the equatorialMJO time series as a function of time lag. The results ofthis analysis are shown in Fig. 4. The maximum corre-lation between the MJO index and the regional 30–90-day time series is �0.6, with the regional time serieslagging the MJO index by about 10 days. This correla-tion is statistically significant at the 95% confidencelevel by conservatively assuming that each 50-day pe-riod represents an independent sample, for a total of27 degrees of freedom during June–October across all9 yr of the precipitation record. Using the t statistic witha two-tailed test, correlations with magnitude greaterthan 0.38 are statistically significant at the 95% confi-dence level, and such confidence limits are shown ashorizontal dashed lines in Fig. 4. Given the methodused to construct the MJO index, maxima in the indexrepresent peak 850-hPa easterly anomalies in the equa-torial Indian Ocean. Thus, the correlations of Fig. 4 areconsistent with Matthews (2004, see his Fig. 5), whoshowed that 925-hPa easterly anomalies in the IndianOcean lead minimum OLR in West Africa by about 10days. The statistically significant correlation betweenthe global MJO index and the regional-time TRMMprecipitation series supports the hypothesis of Mat-thews (2004) that the MJO significantly modulatesconvective variability in West Africa and the easternAtlantic during boreal summer. The MJO appears to
FIG. 4. June–October lag correlations of the MJO time serieswith the 30–90-day precipitation time series (solid) and the 30–90-day time series of EKE (dashed) and EE (dotted). Positive lagsindicate that the MJO time series leads. Dashed horizontal linesindicate where correlations are significantly different from zero atthe 95% confidence level.
15 JUNE 2008 M A L O N E Y A N D S H A M A N 2903
explain about 1/3 of the 30–90-day precipitation vari-ance in the West African monsoon region and AtlanticITCZ during June–October.
June–October correlations between the global MJOindex and regional 30–90-day bandpass-filtered EKEand EE (0°–17.5°N, 40°W–10°E averaged) were alsoexamined (Fig. 4). While correlations are lower thanwith precipitation, the global MJO time series appearsto be significantly correlated with the regional time se-ries of 30–90-day EKE and EE. EKE and EE generallylag the precipitation time series by about 5 days. Thisrelationship will be explored in more detail in the com-posites below.
4. Spatial structure of 30–90-day variability
a. Wind, precipitation, and eddy kinetic energycomposites
To examine the spatial structure of 30–90-day vari-ability in the West African monsoon region, we usestrong deviations of the 30–90-day bandpass-filtered re-
gional precipitation time series to define events. StrongJune–October extrema of the precipitation time serieswith magnitude greater than 1� are selected, for a totalof 15 positive precipitation events and 16 negativeprecipitation events. The � is defined as the standarddeviation of the regional precipitation time series dur-ing 1998–2006. Composites are generated by averagingprecipitation and wind fields across all positive andnegative events. Although we generate compositesseparately for positive and negative events, comparableresults can be obtained by only using positive or nega-tive deviations to define events, and then generatingcomposite fields as a function of time lag.
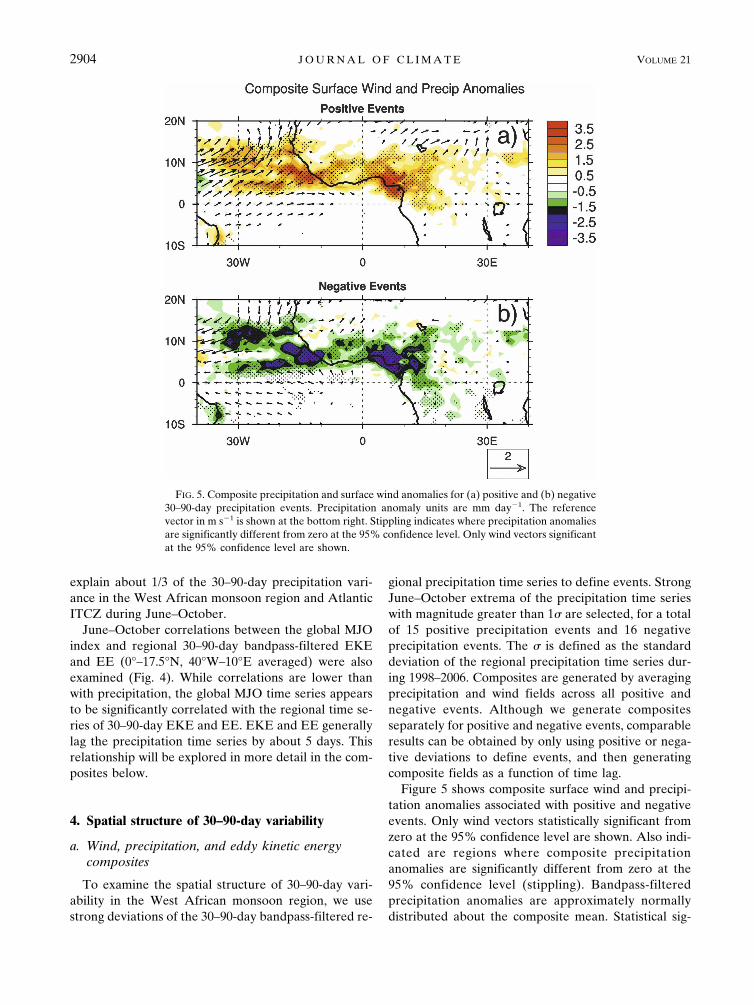
Figure 5 shows composite surface wind and precipi-tation anomalies associated with positive and negativeevents. Only wind vectors statistically significant fromzero at the 95% confidence level are shown. Also indi-cated are regions where composite precipitationanomalies are significantly different from zero at the95% confidence level (stippling). Bandpass-filteredprecipitation anomalies are approximately normallydistributed about the composite mean. Statistical sig-
FIG. 5. Composite precipitation and surface wind anomalies for (a) positive and (b) negative30–90-day precipitation events. Precipitation anomaly units are mm day�1. The referencevector in m s�1 is shown at the bottom right. Stippling indicates where precipitation anomaliesare significantly different from zero at the 95% confidence level. Only wind vectors significantat the 95% confidence level are shown.
2904 J O U R N A L O F C L I M A T E VOLUME 21
Fig 5 live 4/C
nificance was determined from the t statistic using atwo-tailed test that incorporates the number of eventsalong with the standard deviation about the compositemean. Positive (negative) events are characterized by astatistically significant enhancement (suppression) ofprecipitation along 8°N from West Africa into the east-ern Atlantic. The latitude band of significant precipita-tion anomalies is slightly larger in the Atlantic. Stron-gest precipitation anomalies occur near the Gulf ofGuinea and also in the Atlantic to the west of 10°W.Suppressed (enhanced) trade winds accompany en-hanced (suppressed) precipitation over the Atlantic. In-terestingly, the precipitation anomalies in the Gulf ofGuinea are not accompanied by significant surfacewind anomalies. To verify these reanalysis-derived sur-face fields, we recalculated composite fields usingQuikSCAT ocean vector winds during 2000–06. Resultswere similar to those obtained here (not shown). Themodulation of trade wind activity we observe on in-traseasonal time scales resembles that in the OLR-based boreal summer analysis of Matthews (2004) andalso resembles that found by Foltz and McPhaden(2004, 2005), although the Foltz and McPhaden analysiswas dominated by boreal winter variability. Althoughthe pattern of TRMM precipitation anomalies is simi-lar to that of the OLR-based analysis of Matthews(2004), the localization of the strongest anomalies(�|3.5 mm day�1|) to the Gulf of Guinea and to thewest coast of Africa near 15°W is even more strikingthan that found in Matthews (2004).
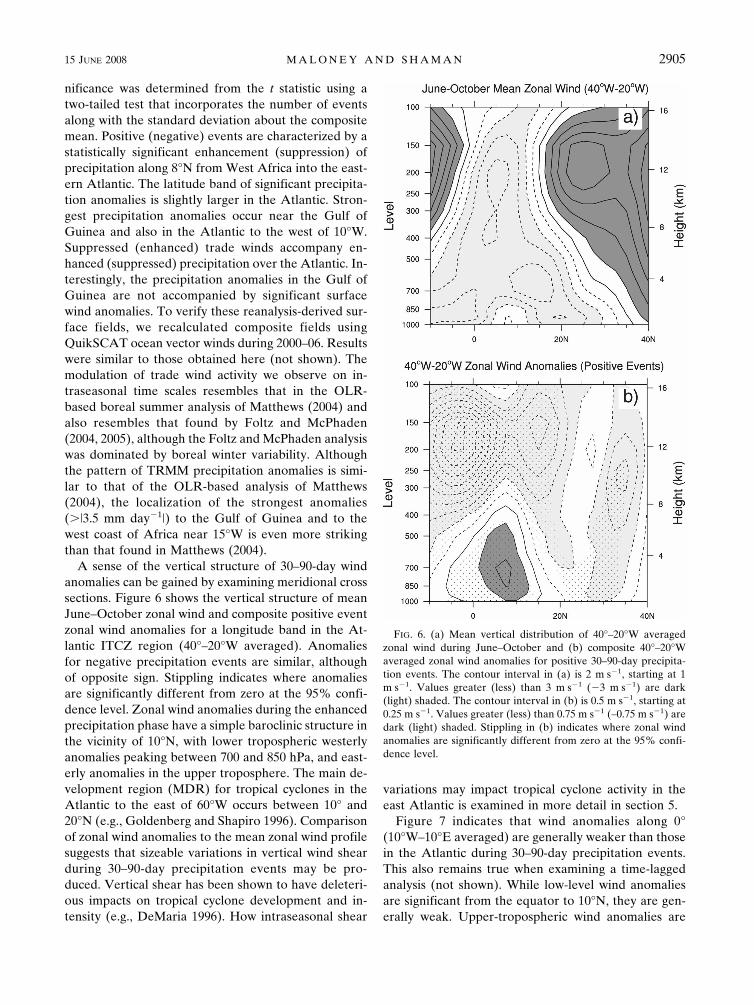
A sense of the vertical structure of 30–90-day windanomalies can be gained by examining meridional crosssections. Figure 6 shows the vertical structure of meanJune–October zonal wind and composite positive eventzonal wind anomalies for a longitude band in the At-lantic ITCZ region (40°–20°W averaged). Anomaliesfor negative precipitation events are similar, althoughof opposite sign. Stippling indicates where anomaliesare significantly different from zero at the 95% confi-dence level. Zonal wind anomalies during the enhancedprecipitation phase have a simple baroclinic structure inthe vicinity of 10°N, with lower tropospheric westerlyanomalies peaking between 700 and 850 hPa, and east-erly anomalies in the upper troposphere. The main de-velopment region (MDR) for tropical cyclones in theAtlantic to the east of 60°W occurs between 10° and20°N (e.g., Goldenberg and Shapiro 1996). Comparisonof zonal wind anomalies to the mean zonal wind profilesuggests that sizeable variations in vertical wind shearduring 30–90-day precipitation events may be pro-duced. Vertical shear has been shown to have deleteri-ous impacts on tropical cyclone development and in-tensity (e.g., DeMaria 1996). How intraseasonal shear
variations may impact tropical cyclone activity in theeast Atlantic is examined in more detail in section 5.
Figure 7 indicates that wind anomalies along 0°(10°W–10°E averaged) are generally weaker than thosein the Atlantic during 30–90-day precipitation events.This also remains true when examining a time-laggedanalysis (not shown). While low-level wind anomaliesare significant from the equator to 10°N, they are gen-erally weak. Upper-tropospheric wind anomalies are
FIG. 6. (a) Mean vertical distribution of 40°–20°W averagedzonal wind during June–October and (b) composite 40°–20°Waveraged zonal wind anomalies for positive 30–90-day precipita-tion events. The contour interval in (a) is 2 m s�1, starting at 1m s�1. Values greater (less) than 3 m s�1 (�3 m s�1) are dark(light) shaded. The contour interval in (b) is 0.5 m s�1, starting at0.25 m s�1. Values greater (less) than 0.75 m s�1 (–0.75 m s�1) aredark (light) shaded. Stippling in (b) indicates where zonal windanomalies are significantly different from zero at the 95% confi-dence level.
15 JUNE 2008 M A L O N E Y A N D S H A M A N 2905
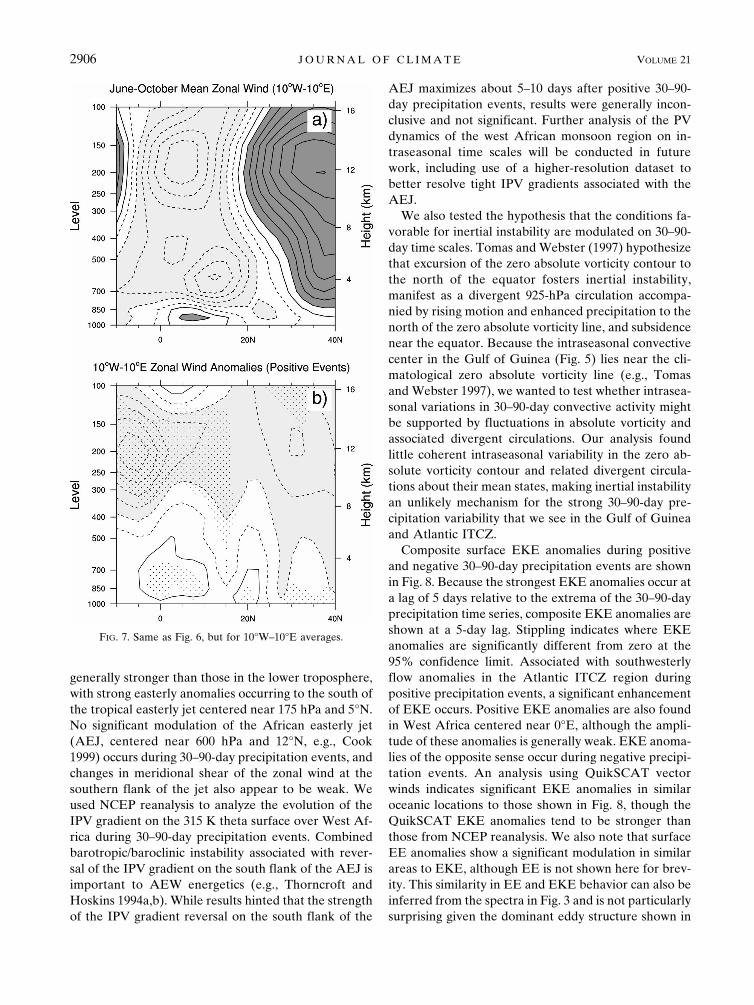
generally stronger than those in the lower troposphere,with strong easterly anomalies occurring to the south ofthe tropical easterly jet centered near 175 hPa and 5°N.No significant modulation of the African easterly jet(AEJ, centered near 600 hPa and 12°N, e.g., Cook1999) occurs during 30–90-day precipitation events, andchanges in meridional shear of the zonal wind at thesouthern flank of the jet also appear to be weak. Weused NCEP reanalysis to analyze the evolution of theIPV gradient on the 315 K theta surface over West Af-rica during 30–90-day precipitation events. Combinedbarotropic/baroclinic instability associated with rever-sal of the IPV gradient on the south flank of the AEJ isimportant to AEW energetics (e.g., Thorncroft andHoskins 1994a,b). While results hinted that the strengthof the IPV gradient reversal on the south flank of the
AEJ maximizes about 5–10 days after positive 30–90-day precipitation events, results were generally incon-clusive and not significant. Further analysis of the PVdynamics of the west African monsoon region on in-traseasonal time scales will be conducted in futurework, including use of a higher-resolution dataset tobetter resolve tight IPV gradients associated with theAEJ.
We also tested the hypothesis that the conditions fa-vorable for inertial instability are modulated on 30–90-day time scales. Tomas and Webster (1997) hypothesizethat excursion of the zero absolute vorticity contour tothe north of the equator fosters inertial instability,manifest as a divergent 925-hPa circulation accompa-nied by rising motion and enhanced precipitation to thenorth of the zero absolute vorticity line, and subsidencenear the equator. Because the intraseasonal convectivecenter in the Gulf of Guinea (Fig. 5) lies near the cli-matological zero absolute vorticity line (e.g., Tomasand Webster 1997), we wanted to test whether intrasea-sonal variations in 30–90-day convective activity mightbe supported by fluctuations in absolute vorticity andassociated divergent circulations. Our analysis foundlittle coherent intraseasonal variability in the zero ab-solute vorticity contour and related divergent circula-tions about their mean states, making inertial instabilityan unlikely mechanism for the strong 30–90-day pre-cipitation variability that we see in the Gulf of Guineaand Atlantic ITCZ.
Composite surface EKE anomalies during positiveand negative 30–90-day precipitation events are shownin Fig. 8. Because the strongest EKE anomalies occur ata lag of 5 days relative to the extrema of the 30–90-dayprecipitation time series, composite EKE anomalies areshown at a 5-day lag. Stippling indicates where EKEanomalies are significantly different from zero at the95% confidence limit. Associated with southwesterlyflow anomalies in the Atlantic ITCZ region duringpositive precipitation events, a significant enhancementof EKE occurs. Positive EKE anomalies are also foundin West Africa centered near 0°E, although the ampli-tude of these anomalies is generally weak. EKE anoma-lies of the opposite sense occur during negative precipi-tation events. An analysis using QuikSCAT vectorwinds indicates significant EKE anomalies in similaroceanic locations to those shown in Fig. 8, though theQuikSCAT EKE anomalies tend to be stronger thanthose from NCEP reanalysis. We also note that surfaceEE anomalies show a significant modulation in similarareas to EKE, although EE is not shown here for brev-ity. This similarity in EE and EKE behavior can also beinferred from the spectra in Fig. 3 and is not particularlysurprising given the dominant eddy structure shown in
FIG. 7. Same as Fig. 6, but for 10°W–10°E averages.
2906 J O U R N A L O F C L I M A T E VOLUME 21
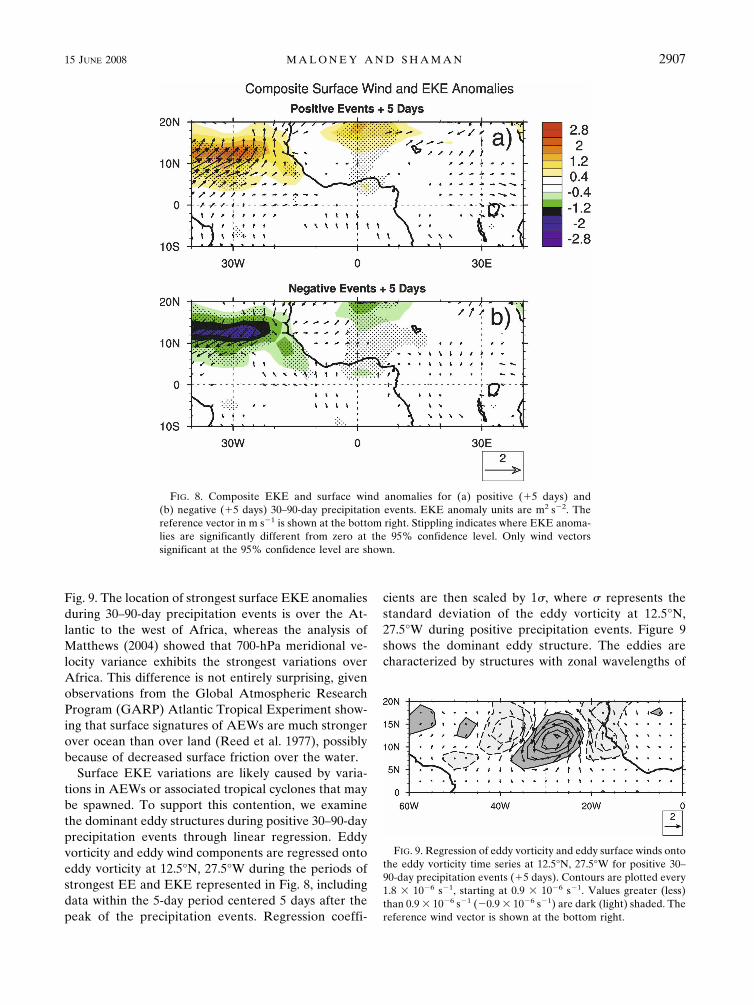
Fig. 9. The location of strongest surface EKE anomaliesduring 30–90-day precipitation events is over the At-lantic to the west of Africa, whereas the analysis ofMatthews (2004) showed that 700-hPa meridional ve-locity variance exhibits the strongest variations overAfrica. This difference is not entirely surprising, givenobservations from the Global Atmospheric ResearchProgram (GARP) Atlantic Tropical Experiment show-ing that surface signatures of AEWs are much strongerover ocean than over land (Reed et al. 1977), possiblybecause of decreased surface friction over the water.
Surface EKE variations are likely caused by varia-tions in AEWs or associated tropical cyclones that maybe spawned. To support this contention, we examinethe dominant eddy structures during positive 30–90-dayprecipitation events through linear regression. Eddyvorticity and eddy wind components are regressed ontoeddy vorticity at 12.5°N, 27.5°W during the periods ofstrongest EE and EKE represented in Fig. 8, includingdata within the 5-day period centered 5 days after thepeak of the precipitation events. Regression coeffi-
cients are then scaled by 1�, where � represents thestandard deviation of the eddy vorticity at 12.5°N,27.5°W during positive precipitation events. Figure 9shows the dominant eddy structure. The eddies arecharacterized by structures with zonal wavelengths of
FIG. 8. Composite EKE and surface wind anomalies for (a) positive (�5 days) and(b) negative (�5 days) 30–90-day precipitation events. EKE anomaly units are m2 s�2. Thereference vector in m s�1 is shown at the bottom right. Stippling indicates where EKE anoma-lies are significantly different from zero at the 95% confidence level. Only wind vectorssignificant at the 95% confidence level are shown.
FIG. 9. Regression of eddy vorticity and eddy surface winds ontothe eddy vorticity time series at 12.5°N, 27.5°W for positive 30–90-day precipitation events (�5 days). Contours are plotted every1.8 � 10�6 s�1, starting at 0.9 � 10�6 s�1. Values greater (less)than 0.9 � 10�6 s�1 (�0.9 � 10�6 s�1) are dark (light) shaded. Thereference wind vector is shown at the bottom right.
15 JUNE 2008 M A L O N E Y A N D S H A M A N 2907
Fig 8 live 4/C

about 2500 km. Individual vorticity centers have asouthwest–northeast tilt with latitude, resembling theAEWs that have been extensively documented in theliterature (e.g., Riehl 1954; Burpee 1972, 1974; Reedet al. 1977; Albignat and Reed 1980). In addition, theeddies shown in Fig. 9 occur in the band 10°–15°N,where the track density of easterly waves in the Atlan-tic is also primarily concentrated (Thorncroft andHodges 2001).
b. Complex EOF analysis
The evolution of precipitation anomalies associatedwith 30–90-day precipitation events can be compactlydescribed using Hilbert transform CEOF analysis (e.g.,Barnett 1983; Horel 1984). While similar to standardEOF analysis, CEOF analysis is conducted using a co-variance matrix constructed from the complex analyticfunction at each grid point in the domain of interest.The complex analytic function consists of the time se-ries at each grid point in the domain of interest plus itsquadrature function times i. A propagating signal canthus be represented by a single CEOF, instead of twoEOFs. Maloney et al. (2008) describe the use of CEOFanalysis in significant detail for the case of covariabilityof east Pacific intraseasonal SST and precipitation dur-ing boreal summer.
We first bandpass-filter the TRMM precipitationfield to 30–90 days and then compute the quadraturefunction (temporal Hilbert transform) over the entiretime series (1998–2006) to construct the analytic signal.The covariance matrix for use in the CEOF analysis isthen constructed using June–October precipitation dataover the domain 10°S–20°N, 40°W–40°E. We choose alarger domain than used for the regional precipitationtime series described above to avoid predeterminingthe results of the CEOF analysis and to independentlyverify the validity of the averaging box used to calculatethe regional time series. The structure and propagationcharacteristics of the leading CEOFs are not sensitiveto reasonable variations in the size of the spatial do-main. The CEOF analysis results in amplitude time se-ries and spatial CEOFs that are complex, allowing spa-tial and temporal phase and amplitude information tobe derived in a straightforward manner.
Figure 10 describes the leading CEOF, which ex-plains 11.8% of the variance. This leading CEOF isdistinguishable from the second CEOF (8.2%) usingthe criterion of North et al. (1982) and assuming thatevery 50 days is an independent sample for about 27degrees of freedom during June–October of 1998–2005.We have further confidence that the leading CEOF ex-plains a physical mode of variability because the spatial
structure and temporal evolution described by thisCEOF resembles that derived by composite analysisusing the regional 30–90-day precipitation time seriesdescribed above (although this evolution is not explic-itly shown). We note that a similar CEOF analysis ofboreal summer 30–90-day precipitation for a simi-lar size domain in the east Pacific warm pool producesa leading CEOF that explains 26% of the variance(Maloney et al. 2008), and so the 30–90-day mode ofvariability we show here is less dominant than that de-rived for other tropical regions.
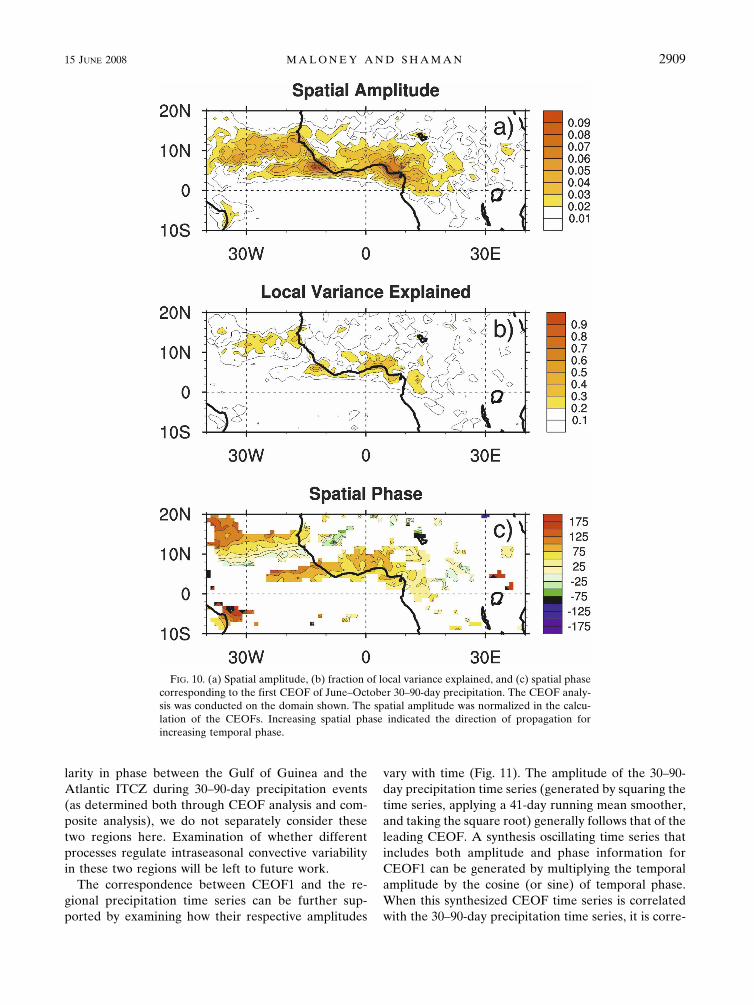
Spatial amplitudes associated with CEOF1 are gen-erally strong in regions of high mean precipitationshown in Fig. 1, with the highest amplitude in the Gulfof Guinea and at the western African coast near 6°N,15°W (Fig. 10a). The variance explained by CEOF1exceeds 30% locally, with the largest explained vari-ance occurring in the Gulf of Guinea, near the WestAfrican coast along 6°N, and to the north of 10°N onthe north side of the Atlantic ITCZ (Fig. 10b).
Temporal phases (not shown here) associated withthe leading CEOF vary between �180° and 180° andgenerally increase monotonically with time, completingone cycle approximately every 40–50 days. Combinedwith the temporal phase, the spatial phases in Fig. 10cdescribe the temporal evolution of 30–90-day precipi-tation anomalies in the West African monsoon regionduring boreal summer and also resemble the compositeevolution of precipitation anomalies associated with theregional 30–90-day precipitation index (not shown).Spatial phase in Fig. 10c is only shown where the localvariance explained exceeds 5%. Precipitation anoma-lies appear to be initiated in a couple of isolated re-gions: in a narrow band extending southwestward from14°N, 10°W and over central Africa near 4°N, 20°E. Bya bit less than 1/4 cycle later (with some modest phasevariations), same-signed precipitation anomalies haveenveloped much of the region bounded by 0°–14°N,35°W–20°E. To first order, the evolution of 30–90-dayprecipitation anomalies primarily resembles a station-ary pulsing of precipitation at the locations of highmean precipitation. This behavior is a motivation forusing the 0°–14°N, 35°W–20°E averaging box to defineour regional 30–90-day regional precipitation time se-ries. Interestingly, however, Fig. 10c does suggest thepossibility that the Gulf of Guinea and the AtlanticITCZ contain distinct 30–90-day convective centers.Further, the strong dynamical signal associated with theAtlantic convective center (e.g., Figure 5) and the lackof a strong dynamical signal associated with the Gulf ofGuinea center suggest the possibility of distinct convec-tive regulation mechanisms. However, given the simi-
2908 J O U R N A L O F C L I M A T E VOLUME 21
larity in phase between the Gulf of Guinea and theAtlantic ITCZ during 30–90-day precipitation events(as determined both through CEOF analysis and com-posite analysis), we do not separately consider thesetwo regions here. Examination of whether differentprocesses regulate intraseasonal convective variabilityin these two regions will be left to future work.
The correspondence between CEOF1 and the re-gional precipitation time series can be further sup-ported by examining how their respective amplitudes
vary with time (Fig. 11). The amplitude of the 30–90-day precipitation time series (generated by squaring thetime series, applying a 41-day running mean smoother,and taking the square root) generally follows that of theleading CEOF. A synthesis oscillating time series thatincludes both amplitude and phase information forCEOF1 can be generated by multiplying the temporalamplitude by the cosine (or sine) of temporal phase.When this synthesized CEOF time series is correlatedwith the 30–90-day precipitation time series, it is corre-
FIG. 10. (a) Spatial amplitude, (b) fraction of local variance explained, and (c) spatial phasecorresponding to the first CEOF of June–October 30–90-day precipitation. The CEOF analy-sis was conducted on the domain shown. The spatial amplitude was normalized in the calcu-lation of the CEOFs. Increasing spatial phase indicated the direction of propagation forincreasing temporal phase.
15 JUNE 2008 M A L O N E Y A N D S H A M A N 2909
Fig 10 live 4/C
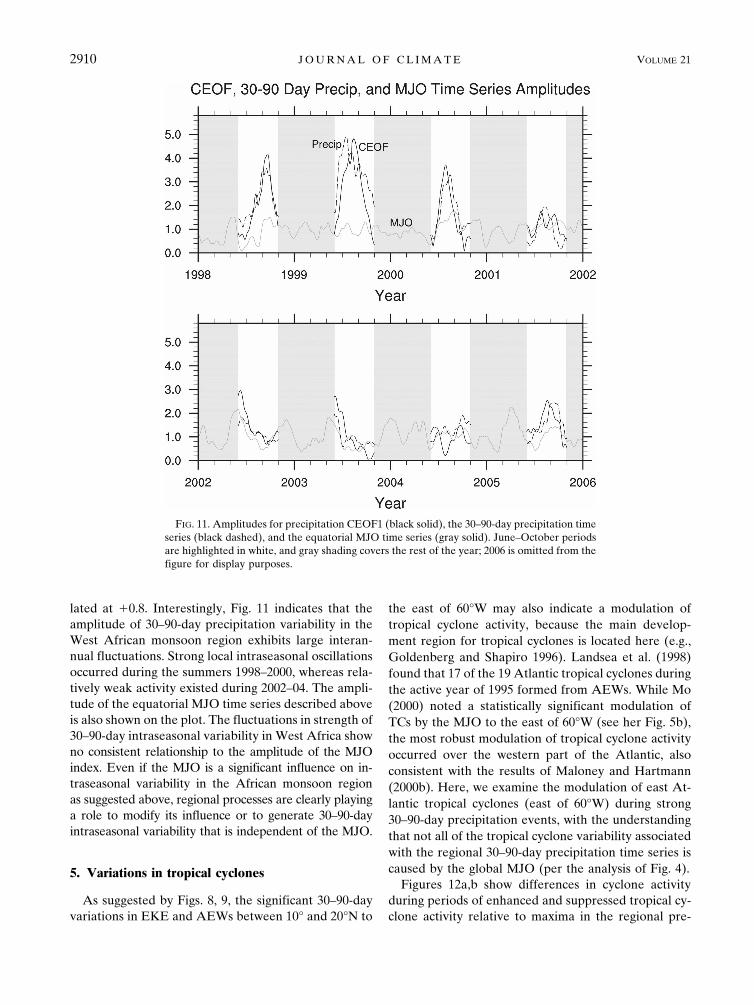
lated at �0.8. Interestingly, Fig. 11 indicates that theamplitude of 30–90-day precipitation variability in theWest African monsoon region exhibits large interan-nual fluctuations. Strong local intraseasonal oscillationsoccurred during the summers 1998–2000, whereas rela-tively weak activity existed during 2002–04. The ampli-tude of the equatorial MJO time series described aboveis also shown on the plot. The fluctuations in strength of30–90-day intraseasonal variability in West Africa showno consistent relationship to the amplitude of the MJOindex. Even if the MJO is a significant influence on in-traseasonal variability in the African monsoon regionas suggested above, regional processes are clearly playinga role to modify its influence or to generate 30–90-dayintraseasonal variability that is independent of the MJO.
5. Variations in tropical cyclones
As suggested by Figs. 8, 9, the significant 30–90-dayvariations in EKE and AEWs between 10° and 20°N to
the east of 60°W may also indicate a modulation oftropical cyclone activity, because the main develop-ment region for tropical cyclones is located here (e.g.,Goldenberg and Shapiro 1996). Landsea et al. (1998)found that 17 of the 19 Atlantic tropical cyclones duringthe active year of 1995 formed from AEWs. While Mo(2000) noted a statistically significant modulation ofTCs by the MJO to the east of 60°W (see her Fig. 5b),the most robust modulation of tropical cyclone activityoccurred over the western part of the Atlantic, alsoconsistent with the results of Maloney and Hartmann(2000b). Here, we examine the modulation of east At-lantic tropical cyclones (east of 60°W) during strong30–90-day precipitation events, with the understandingthat not all of the tropical cyclone variability associatedwith the regional 30–90-day precipitation time series iscaused by the global MJO (per the analysis of Fig. 4).
Figures 12a,b show differences in cyclone activityduring periods of enhanced and suppressed tropical cy-clone activity relative to maxima in the regional pre-
FIG. 11. Amplitudes for precipitation CEOF1 (black solid), the 30–90-day precipitation timeseries (black dashed), and the equatorial MJO time series (gray solid). June–October periodsare highlighted in white, and gray shading covers the rest of the year; 2006 is omitted from thefigure for display purposes.
2910 J O U R N A L O F C L I M A T E VOLUME 21
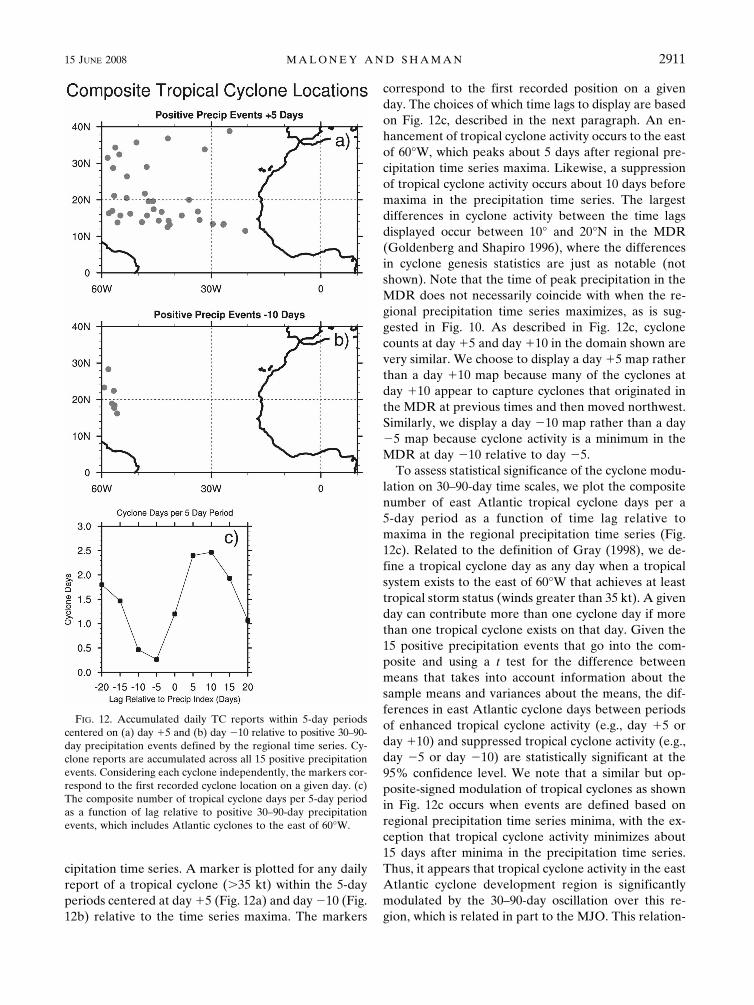
cipitation time series. A marker is plotted for any dailyreport of a tropical cyclone (�35 kt) within the 5-dayperiods centered at day �5 (Fig. 12a) and day �10 (Fig.12b) relative to the time series maxima. The markers
correspond to the first recorded position on a givenday. The choices of which time lags to display are basedon Fig. 12c, described in the next paragraph. An en-hancement of tropical cyclone activity occurs to the eastof 60°W, which peaks about 5 days after regional pre-cipitation time series maxima. Likewise, a suppressionof tropical cyclone activity occurs about 10 days beforemaxima in the precipitation time series. The largestdifferences in cyclone activity between the time lagsdisplayed occur between 10° and 20°N in the MDR(Goldenberg and Shapiro 1996), where the differencesin cyclone genesis statistics are just as notable (notshown). Note that the time of peak precipitation in theMDR does not necessarily coincide with when the re-gional precipitation time series maximizes, as is sug-gested in Fig. 10. As described in Fig. 12c, cyclonecounts at day �5 and day �10 in the domain shown arevery similar. We choose to display a day �5 map ratherthan a day �10 map because many of the cyclones atday �10 appear to capture cyclones that originated inthe MDR at previous times and then moved northwest.Similarly, we display a day �10 map rather than a day�5 map because cyclone activity is a minimum in theMDR at day �10 relative to day �5.
To assess statistical significance of the cyclone modu-lation on 30–90-day time scales, we plot the compositenumber of east Atlantic tropical cyclone days per a5-day period as a function of time lag relative tomaxima in the regional precipitation time series (Fig.12c). Related to the definition of Gray (1998), we de-fine a tropical cyclone day as any day when a tropicalsystem exists to the east of 60°W that achieves at leasttropical storm status (winds greater than 35 kt). A givenday can contribute more than one cyclone day if morethan one tropical cyclone exists on that day. Given the15 positive precipitation events that go into the com-posite and using a t test for the difference betweenmeans that takes into account information about thesample means and variances about the means, the dif-ferences in east Atlantic cyclone days between periodsof enhanced tropical cyclone activity (e.g., day �5 orday �10) and suppressed tropical cyclone activity (e.g.,day �5 or day �10) are statistically significant at the95% confidence level. We note that a similar but op-posite-signed modulation of tropical cyclones as shownin Fig. 12c occurs when events are defined based onregional precipitation time series minima, with the ex-ception that tropical cyclone activity minimizes about15 days after minima in the precipitation time series.Thus, it appears that tropical cyclone activity in the eastAtlantic cyclone development region is significantlymodulated by the 30–90-day oscillation over this re-gion, which is related in part to the MJO. This relation-
FIG. 12. Accumulated daily TC reports within 5-day periodscentered on (a) day �5 and (b) day �10 relative to positive 30–90-day precipitation events defined by the regional time series. Cy-clone reports are accumulated across all 15 positive precipitationevents. Considering each cyclone independently, the markers cor-respond to the first recorded cyclone location on a given day. (c)The composite number of tropical cyclone days per 5-day periodas a function of lag relative to positive 30–90-day precipitationevents, which includes Atlantic cyclones to the east of 60°W.
15 JUNE 2008 M A L O N E Y A N D S H A M A N 2911
ship mirrors findings at interannual and multidecadaltime scales, where previous studies have shown a sig-nificant relationship between West African monsoonrainfall and Atlantic hurricane activity (e.g., Landseaand Gray 1992; Goldenberg and Shapiro 1996; Bell andChelliah 2006).
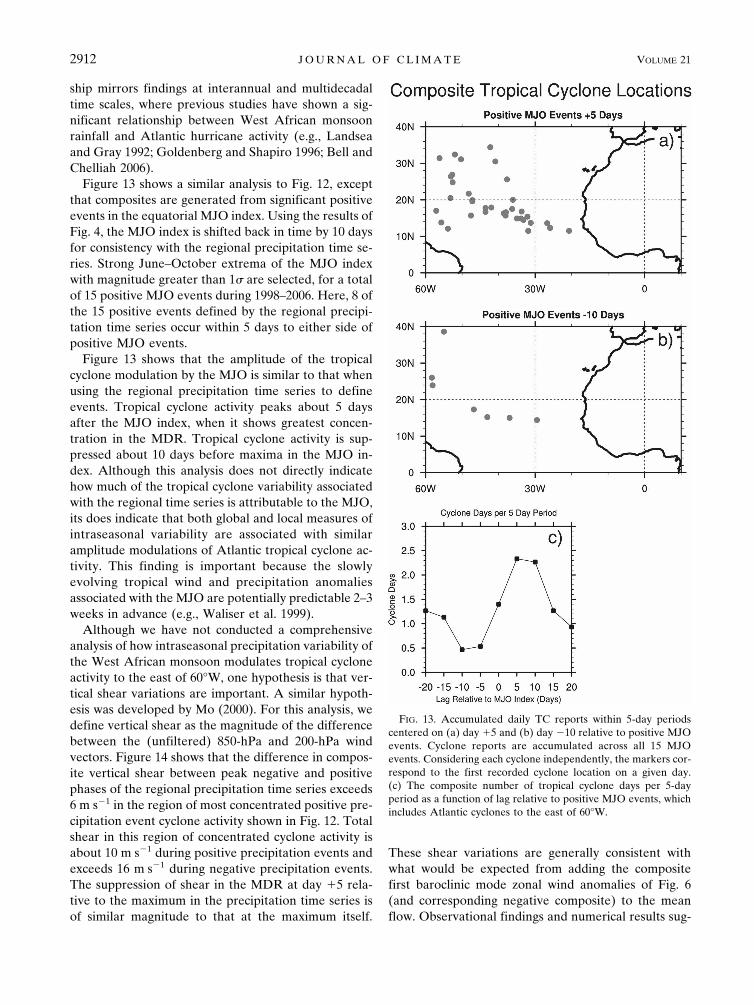
Figure 13 shows a similar analysis to Fig. 12, exceptthat composites are generated from significant positiveevents in the equatorial MJO index. Using the results ofFig. 4, the MJO index is shifted back in time by 10 daysfor consistency with the regional precipitation time se-ries. Strong June–October extrema of the MJO indexwith magnitude greater than 1� are selected, for a totalof 15 positive MJO events during 1998–2006. Here, 8 ofthe 15 positive events defined by the regional precipi-tation time series occur within 5 days to either side ofpositive MJO events.
Figure 13 shows that the amplitude of the tropicalcyclone modulation by the MJO is similar to that whenusing the regional precipitation time series to defineevents. Tropical cyclone activity peaks about 5 daysafter the MJO index, when it shows greatest concen-tration in the MDR. Tropical cyclone activity is sup-pressed about 10 days before maxima in the MJO in-dex. Although this analysis does not directly indicatehow much of the tropical cyclone variability associatedwith the regional time series is attributable to the MJO,its does indicate that both global and local measures ofintraseasonal variability are associated with similaramplitude modulations of Atlantic tropical cyclone ac-tivity. This finding is important because the slowlyevolving tropical wind and precipitation anomaliesassociated with the MJO are potentially predictable 2–3weeks in advance (e.g., Waliser et al. 1999).
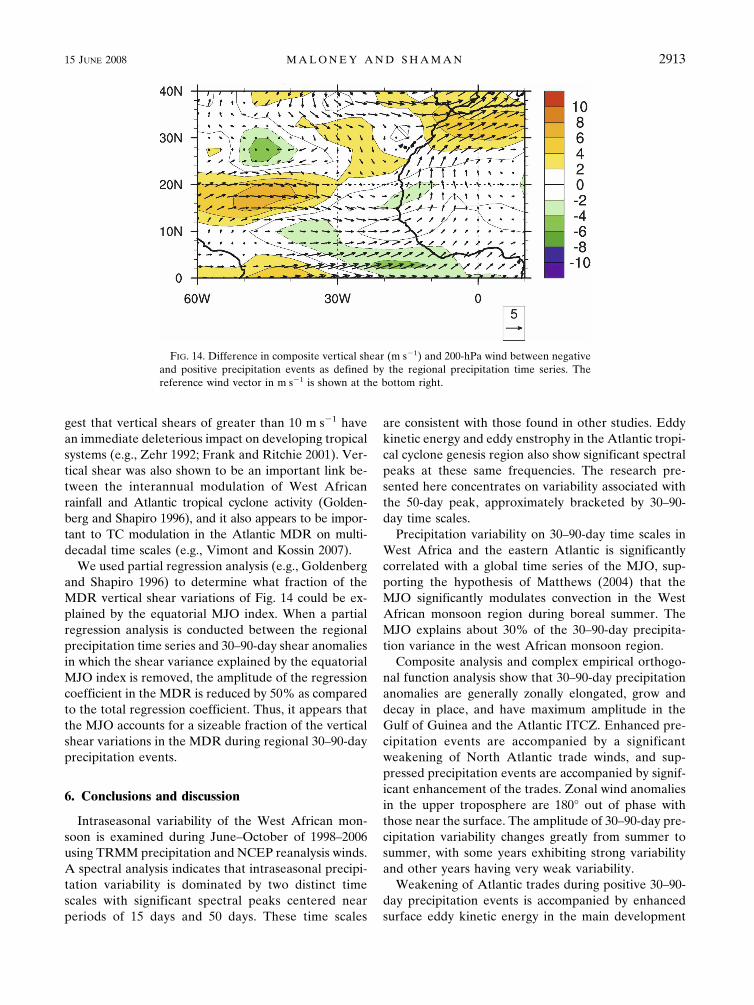
Although we have not conducted a comprehensiveanalysis of how intraseasonal precipitation variability ofthe West African monsoon modulates tropical cycloneactivity to the east of 60°W, one hypothesis is that ver-tical shear variations are important. A similar hypoth-esis was developed by Mo (2000). For this analysis, wedefine vertical shear as the magnitude of the differencebetween the (unfiltered) 850-hPa and 200-hPa windvectors. Figure 14 shows that the difference in compos-ite vertical shear between peak negative and positivephases of the regional precipitation time series exceeds6 m s�1 in the region of most concentrated positive pre-cipitation event cyclone activity shown in Fig. 12. Totalshear in this region of concentrated cyclone activity isabout 10 m s�1 during positive precipitation events andexceeds 16 m s�1 during negative precipitation events.The suppression of shear in the MDR at day �5 rela-tive to the maximum in the precipitation time series isof similar magnitude to that at the maximum itself.
These shear variations are generally consistent withwhat would be expected from adding the compositefirst baroclinic mode zonal wind anomalies of Fig. 6(and corresponding negative composite) to the meanflow. Observational findings and numerical results sug-
FIG. 13. Accumulated daily TC reports within 5-day periodscentered on (a) day �5 and (b) day �10 relative to positive MJOevents. Cyclone reports are accumulated across all 15 MJOevents. Considering each cyclone independently, the markers cor-respond to the first recorded cyclone location on a given day.(c) The composite number of tropical cyclone days per 5-dayperiod as a function of lag relative to positive MJO events, whichincludes Atlantic cyclones to the east of 60°W.
2912 J O U R N A L O F C L I M A T E VOLUME 21
gest that vertical shears of greater than 10 m s�1 havean immediate deleterious impact on developing tropicalsystems (e.g., Zehr 1992; Frank and Ritchie 2001). Ver-tical shear was also shown to be an important link be-tween the interannual modulation of West Africanrainfall and Atlantic tropical cyclone activity (Golden-berg and Shapiro 1996), and it also appears to be impor-tant to TC modulation in the Atlantic MDR on multi-decadal time scales (e.g., Vimont and Kossin 2007).
We used partial regression analysis (e.g., Goldenbergand Shapiro 1996) to determine what fraction of theMDR vertical shear variations of Fig. 14 could be ex-plained by the equatorial MJO index. When a partialregression analysis is conducted between the regionalprecipitation time series and 30–90-day shear anomaliesin which the shear variance explained by the equatorialMJO index is removed, the amplitude of the regressioncoefficient in the MDR is reduced by 50% as comparedto the total regression coefficient. Thus, it appears thatthe MJO accounts for a sizeable fraction of the verticalshear variations in the MDR during regional 30–90-dayprecipitation events.
6. Conclusions and discussion
Intraseasonal variability of the West African mon-soon is examined during June–October of 1998–2006using TRMM precipitation and NCEP reanalysis winds.A spectral analysis indicates that intraseasonal precipi-tation variability is dominated by two distinct timescales with significant spectral peaks centered nearperiods of 15 days and 50 days. These time scales
are consistent with those found in other studies. Eddykinetic energy and eddy enstrophy in the Atlantic tropi-cal cyclone genesis region also show significant spectralpeaks at these same frequencies. The research pre-sented here concentrates on variability associated withthe 50-day peak, approximately bracketed by 30–90-day time scales.
Precipitation variability on 30–90-day time scales inWest Africa and the eastern Atlantic is significantlycorrelated with a global time series of the MJO, sup-porting the hypothesis of Matthews (2004) that theMJO significantly modulates convection in the WestAfrican monsoon region during boreal summer. TheMJO explains about 30% of the 30–90-day precipita-tion variance in the west African monsoon region.
Composite analysis and complex empirical orthogo-nal function analysis show that 30–90-day precipitationanomalies are generally zonally elongated, grow anddecay in place, and have maximum amplitude in theGulf of Guinea and the Atlantic ITCZ. Enhanced pre-cipitation events are accompanied by a significantweakening of North Atlantic trade winds, and sup-pressed precipitation events are accompanied by signif-icant enhancement of the trades. Zonal wind anomaliesin the upper troposphere are 180° out of phase withthose near the surface. The amplitude of 30–90-day pre-cipitation variability changes greatly from summer tosummer, with some years exhibiting strong variabilityand other years having very weak variability.
Weakening of Atlantic trades during positive 30–90-day precipitation events is accompanied by enhancedsurface eddy kinetic energy in the main development
FIG. 14. Difference in composite vertical shear (m s�1) and 200-hPa wind between negativeand positive precipitation events as defined by the regional precipitation time series. Thereference wind vector in m s�1 is shown at the bottom right.
15 JUNE 2008 M A L O N E Y A N D S H A M A N 2913
Fig 14 live 4/C
region for tropical cyclones in the Atlantic between 10°and 20°N, with the strongest eddy enhancement occur-ring 5 days after the peak of the precipitation event.The dominant eddies associated with enhanced precipi-tation events resemble African easterly waves. A com-parable strong suppression of EKE occurs after thepeak of 30–90-day suppressed precipitation events.
A significant modulation of TC activity occurs in as-sociation with the 30–90-day oscillation. The number oftropical cyclones that occur in the Atlantic MDR to theeast of 60°W is suppressed about 5–10 days before themaxima in a regional intraseasonal precipitation timeseries and is enahnced about 5–10 days after the timeseries maxima. A similar but opposite-signed modula-tion occurs when negative precipitation events are usedto composite TC activity. The number of tropical cy-clones reported is about 5 times greater in associationwith enhanced TC phases than suppressed TC phases, aresult statistically significant at the 95% confidencelevel. When compositing TC activity based on an equa-torial MJO index, similar amplitude and phase modu-lation are obtained. These findings are consistent withthose of Mo (2000). Variations in vertical shear in theMDR may help to explain this modulation of tropicalcyclones. The MJO is responsible for about half of theamplitude of vertical shear variations in the AtlanticMDR during 30–90-day precipitation events.
Future work will examine the physical mechanismsresponsible for the significant 30–90-day modulation ofprecipitation that occurs over the African monsoon re-gion during boreal summer. Here, we preliminarily as-sessed several possible mechanisms that may contributeto intraseasonal precipitation variability in the WestAfrican monsoon region, some of which were proposedby Matthews (2004).
First, we analyzed whether organized variations inthe boundary layer monsoon flow and associated mois-ture convergence [�� · (qv)] could generate large-scaleforcing for precipitation anomalies. A comparison ofFigs. 1 and 5 indicates that the boundary layer south-westerly flow is only weakly enhanced in most of theAfrican monsoon region during periods of enhancedprecipitation, and in regions of significant precipitationanomalies boundary layer flow anomalies are often notsignificant. Further, an analysis of boundary layer mois-ture convergence (not shown) indicates that moistureconvergence is indeed enhanced in patchy regions nearthe strongest precipitation anomalies, but these conver-gence anomalies indicate no large-scale coherence thatwould suggest organized dynamical forcing. The mois-ture convergence anomalies may more likely be a by-product of convective heating rather than a cause (e.g.,
Neelin and Held 1987). An analysis at 925 hPa pro-duces similar results.
Second, also relevant to boundary flow variations, wetested the hypothesis that the conditions favorable forinertial instability are modulated on 30–90-day timescales, which in turn could modulate intraseasonal pre-cipitation (e.g., Tomas and Webster 1997). Neither theboundary layer divergence nor the position of the zeroabsolute vorticity line showed variations that suggestedinertial instability is important to intraseasonal variabil-ity in this region (see also section 4a).
The 700-hPa flow does exhibit stronger westerly en-hancement than at the surface during periods of en-hanced precipitation, consistent with Matthews (2004).Stronger easterly, offshore flows occur during periodsof suppressed precipitation. A third hypothesis is theinteresting possibility that such enhanced offshore flowmay advect dry, dusty air associated with the Saharanair layer over the ocean, which may suppress precipita-tion there. Recent studies have documented links be-tween Sahel rainfall, the Saharan air layer, and AtlanticTC activity (e.g., Dunion and Velden 2004; Evan et al.2006; Wu 2007). Although 700-hPa wind and specifichumidity fields from NCEP reanalysis do not indicatewidespread enhanced dry advection during suppressedprecipitation events, we hope to explore this hypothesisfurther in future work.
As noted in section 4a, a fourth hypothesis we exam-ined is whether intraseasonal flow variations near the700-hPa level could generate significant variations inthe IPV gradient. Such variations could impact easterlywave growth and development, and easterly waves areassociated with significant convective variability. Whileresults hinted that the strength of the 315-K IPV gra-dient reversal on the south flank of the AEJ maximizesabout 5–10 days after positive 30–90-day precipitationevents, these results were generally inconclusive andnot significant. However, synoptic-scale wave activity isenhanced in association with positive 30–90-day pre-cipitation events (e.g., Figs. 8, 9). Kiladis et al. (2006)and Hall et al. (2006) showed that easterly waves inWest Africa and the Atlantic generate precipitationanomalies that are in phase with the adiabatic dynami-cal forcing provided by the waves. Presumably, periodsof enhanced easterly wave activity on intraseasonaltime scales could have upscale influences on precipita-tion in the 30–90-day band.
Last, we examined the influence of upper-level dy-namical features for forcing intraseasonal convection.The most coherent fluctuations associated with 30–90-day precipitation events in the West African monsoonregion appear to occur at upper levels. Matthews (2004)hypothesized that MJO convective heating over the
2914 J O U R N A L O F C L I M A T E VOLUME 21
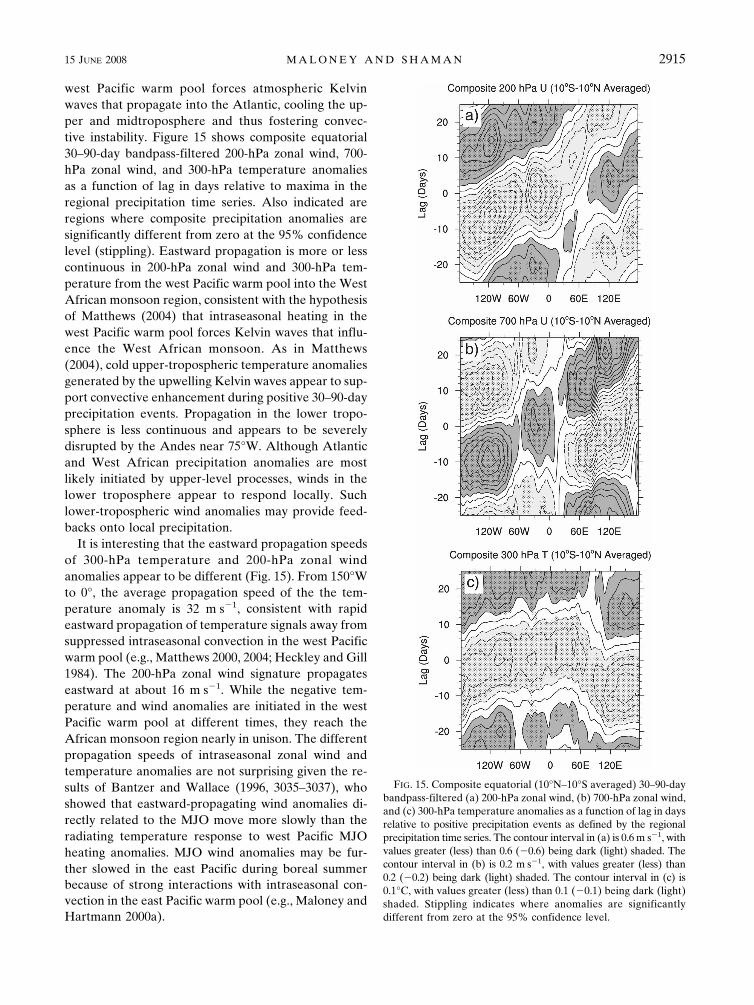
west Pacific warm pool forces atmospheric Kelvinwaves that propagate into the Atlantic, cooling the up-per and midtroposphere and thus fostering convec-tive instability. Figure 15 shows composite equatorial30–90-day bandpass-filtered 200-hPa zonal wind, 700-hPa zonal wind, and 300-hPa temperature anomaliesas a function of lag in days relative to maxima in theregional precipitation time series. Also indicated areregions where composite precipitation anomalies aresignificantly different from zero at the 95% confidencelevel (stippling). Eastward propagation is more or lesscontinuous in 200-hPa zonal wind and 300-hPa tem-perature from the west Pacific warm pool into the WestAfrican monsoon region, consistent with the hypothesisof Matthews (2004) that intraseasonal heating in thewest Pacific warm pool forces Kelvin waves that influ-ence the West African monsoon. As in Matthews(2004), cold upper-tropospheric temperature anomaliesgenerated by the upwelling Kelvin waves appear to sup-port convective enhancement during positive 30–90-dayprecipitation events. Propagation in the lower tropo-sphere is less continuous and appears to be severelydisrupted by the Andes near 75°W. Although Atlanticand West African precipitation anomalies are mostlikely initiated by upper-level processes, winds in thelower troposphere appear to respond locally. Suchlower-tropospheric wind anomalies may provide feed-backs onto local precipitation.
It is interesting that the eastward propagation speedsof 300-hPa temperature and 200-hPa zonal windanomalies appear to be different (Fig. 15). From 150°Wto 0°, the average propagation speed of the the tem-perature anomaly is 32 m s�1, consistent with rapideastward propagation of temperature signals away fromsuppressed intraseasonal convection in the west Pacificwarm pool (e.g., Matthews 2000, 2004; Heckley and Gill1984). The 200-hPa zonal wind signature propagateseastward at about 16 m s�1. While the negative tem-perature and wind anomalies are initiated in the westPacific warm pool at different times, they reach theAfrican monsoon region nearly in unison. The differentpropagation speeds of intraseasonal zonal wind andtemperature anomalies are not surprising given the re-sults of Bantzer and Wallace (1996, 3035–3037), whoshowed that eastward-propagating wind anomalies di-rectly related to the MJO move more slowly than theradiating temperature response to west Pacific MJOheating anomalies. MJO wind anomalies may be fur-ther slowed in the east Pacific during boreal summerbecause of strong interactions with intraseasonal con-vection in the east Pacific warm pool (e.g., Maloney andHartmann 2000a).
FIG. 15. Composite equatorial (10°N–10°S averaged) 30–90-daybandpass-filtered (a) 200-hPa zonal wind, (b) 700-hPa zonal wind,and (c) 300-hPa temperature anomalies as a function of lag in daysrelative to positive precipitation events as defined by the regionalprecipitation time series. The contour interval in (a) is 0.6 m s�1, withvalues greater (less) than 0.6 (�0.6) being dark (light) shaded. Thecontour interval in (b) is 0.2 m s�1, with values greater (less) than0.2 (�0.2) being dark (light) shaded. The contour interval in (c) is0.1°C, with values greater (less) than 0.1 (�0.1) being dark (light)shaded. Stippling indicates where anomalies are significantlydifferent from zero at the 95% confidence level.
15 JUNE 2008 M A L O N E Y A N D S H A M A N 2915
Regardless of the mechanisms, a significant modula-tion of precipitation and tropical cyclones occurs onintraseasonal time scales in the eastern Atlantic. Be-cause a significant portion of this variability is associ-ated with global modes of variability such as the MJOthat may be predictable 2–3 weeks in advance (e.g.,Waliser et al. 1999; Jones et al. 2004), the results of thisstudy and others (e.g., Maloney and Hartmann 2000b;Mo 2000) may have important consequences for pre-diction of tropical cyclone activity in the Atlantic basin.
Acknowledgments. Three anonymous reviewers pro-vided insightful comments on the manuscript. Thiswork was supported by the Climate and Large-ScaleDynamics Program of the National Science Foundation(NSF) under Grants ATM-0540901 and ATM-0632341,and under Award# NA05OAR4310006 from the Na-tional Oceanic and Atmospheric Administration(NOAA), U.S. Department of Commerce. The state-ments, findings, conclusions, and recommendations donot necessarily reflect the views of NSF, NOAA, or theDepartment of Commerce. The authors wish to thankthe TRMM Science Data and Information System andthe Distributed Active Archive Center for providingthe TRMM precipitation fields. NCEP/NCAR reanaly-sis data were provided by NOAA/OAR/ESRL PSD,Boulder, Colorado.
REFERENCES
Albignat, J. P., and R. J. Reed, 1980: The origin of African wavedisturbances during phase III of GATE. Mon. Wea. Rev., 108,1827–1839.
Annamalai, H., and J. M. Slingo, 2001: Active/break cycles: Diag-nosis of the intraseasonal variability of the Asian summermonsoon. Climate Dyn., 18, 85–102.
Bantzer, C. H., and J. M. Wallace, 1996: Intraseasonal variabilityin tropical mean temperature and precipitation and their re-lation to the tropical 40–50-day oscillation. J. Atmos. Sci., 53,3032–3045.
Barnett, T. P., 1983: Interaction of the monsoon and Pacific tradewind system at interannual time scales. Part I: The equatorialzone. Mon. Wea. Rev., 111, 756–773.
Bell, G. D., and M. Chelliah, 2006: Leading tropical modes asso-ciated with interannual and multidecadal fluctuations inNorth Atlantic hurricane activity. J. Climate, 19, 590–612.
Burpee, R. W., 1972: The origin and structure of easterly waves inthe lower troposphere of North Africa. J. Atmos. Sci., 29,77–90.
——, 1974: Characteristics of North African easterly waves duringthe summers of 1968 and 1969. J. Atmos. Sci., 31, 1556–1570.
Camargo, S. J., K. A. Emanuel, and A. H. Sobel, 2007: Use of agenesis potential index to diagnose ENSO effects on tropicalcyclone genesis. J. Climate, 20, 4819–4834.
Chelton, D. B., and M. H. Freilich, 2005: Scatterometer-basedassessment of 10-m wind analyses from the operationalECMWF and NCEP numerical weather prediction models.Mon. Wea. Rev., 133, 409–429.
Cook, K. H., 1999: Generation of the African easterly jet and itsrole in determining West African precipitation. J. Climate, 12,1165–1184.
DeMaria, M., 1996: The effect of vertical shear on tropical cycloneintensity change. J. Atmos. Sci., 53, 2076–2087.
Dunion, J. P., and C. S. Velden, 2004: The impact of the Saharanair layer on Atlantic tropical cyclone activity. Bull. Amer.Meteor. Soc., 85, 353–365.
Evan, A. T., J. Dunion, J. A. Foley, A. K. Heidinger, and C. S.Velden, 2006: New evidence for a relationship between At-lantic tropical cyclone activity and African dust outbreaks.Geophys. Res. Lett., 33, L19813, doi:10.1029/2006GL026408.
Foltz, G. R., and M. J. McPhaden, 2004: The 30–70 day oscilla-tions in the tropical Atlantic. Geophys. Res. Lett., 31, L15205,doi:10.1029/2004GL020023.
——, and ——, 2005: Mixed layer heat balance on intraseasonaltime scales in the northwestern tropical Atlantic Ocean.J. Climate, 18, 4168–4184.
Frank, W. M., and E. A. Ritchie, 2001: Effects of vertical windshear on the intensity and structure of numerically simulatedhurricanes. Mon. Wea. Rev., 129, 2249–2269.
Gilman, D., P. Fuglister, and J. M. Mitchell, 1963: On the powerspectrum of red noise. J. Atmos. Sci., 20, 182–184.
Goldenberg, S. B., and L. J. Shapiro, 1996: Physical mechanismsfor the association of El Niño and West African rainfall withAtlantic major hurricane activity. J. Climate, 9, 1169–1187.
Gray, W. M., 1998: The formation of tropical cyclones. Meteor.Atmos. Phys., 67, 37–69.
Grodsky, S. A., and J. A. Carton, 2001: Coupled land/atmosphereinteractions in the West African monsoon. Geophys. Res.Lett., 28, 1503–1506.
——, ——, and S. Nigam, 2003: Near surface westerly jet in theAtlantic ITCZ. Geophys. Res. Lett., 30, 2009, doi:10.1029/2003GL017867.
Gu, G., and R. F. Adler, 2004: Seasonal evolution and variabilityassociated with the West African monsoon system. J. Cli-mate, 17, 3364–3377.
Hall, N. M. J., G. N. Kiladis, and C. D. Thorncroft, 2006: Three-dimensional structure and dynamics of African easterlywaves. Part II: Dynamical modes. J. Atmos. Sci., 63, 2231–2245.
Heckley, W. A., and A. E. Gill, 1984: Some simple analytical so-lutions to the problems of forced equatorial long waves.Quart. J. Roy. Meteor. Soc., 110, 203–217.
Horel, J. D., 1984: Complex principal component analysis: Theoryand examples. J. Climate Appl. Meteor., 23, 1660–1673.
Huffman, G. H., R. F. Adler, M. M. Morrissey, D. T. Bolvin,S. Curtis, R. Joyce, B. McGavock, and J. Susskind, 2001:Global precipitation at one-degree daily resolution frommultisatellite observations. J. Hydrometeor., 2, 36–50.
Janicot, S., and B. Sultan, 2001: Intraseasonal modulation ofconvection in the West African monsoon. Geophys. Res.Lett., 28, 523–526.
Jarvinen, B. R., C. J. Neumann, and M. A. S. Davis, 1984: A tropi-cal cyclone data tape for the North Atlantic Basin, 1886–1983: Contents, limitations, and uses. NOAA Tech. Memo.NWS NHC 22, 21 pp.
Jenkins, G. M., and D. G. Watts, 1968: Spectral Analysis and ItsApplications. Holden-Day, 525 pp.
Jones, C., M. V. Carvalho, R. W. Higgins, D. E. Waliser, andJ.-K. E. Schemm, 2004: A statistical forecast model of tropi-
2916 J O U R N A L O F C L I M A T E VOLUME 21
cal intraseasonal convective anomalies. J. Climate, 17, 2078–2095.
Kalnay, E., and Coauthors, 1996: The NCEP/NCAR 40-Year Re-analysis Project. Bull. Amer. Meteor. Soc., 77, 437–471.
Kiladis, G. N., C. D. Thorncroft, and N. M. J. Hall, 2006: Three-dimensional structure and dynamics of African easterlywaves. Part I: Observations. J. Atmos. Sci., 63, 2212–2230.
Knutson, T. R., and K. M. Weickmann, 1987: 30–60 day atmo-spheric circulations: Composite lifecycles of convection andcirculation anomalies. Mon. Wea. Rev., 115, 1407–1436.
——, ——, and J. E. Kutzbach, 1986: Global-scale intraseasonaloscillations of outgoing longwave radiation and 250-mb zonalwind during Northern Hemisphere summer. Mon. Wea. Rev.,114, 605–623.
Landsea, C. W., and W. M. Gray, 1992: The strong associationbetween western Sahel monsoon rainfall and intense Atlantichurricanes. J. Climate, 5, 435–453.
——, G. D. Bell, W. M. Gray, and S. B. Goldenberg, 1998: Theextremely active 1995 Atlantic hurricane season: Environ-mental conditions and verification of seasonal forecasts.Mon. Wea. Rev., 126, 1174–1193.
Lavaysse, C., A. Diedhou, H. Laurent, and T. Lebel, 2006: Africaneasterly waves and convective activity in wet and dry se-quences of the West African monsoon. Climate Dyn., 27,319–332.
Madden, R., and P. R. Julian, 2005: Historical perspective. In-traseasonal Variability in the Atmosphere-Ocean Climate Sys-tem, W. K. M. Lau and D. E. Waliser, Eds., Springer-Verlag,436 pp.
Maloney, E. D., and D. L. Hartmann, 1998: Frictional moistureconvergence in a composite lifecycle of the Madden–Julianoscillation. J. Climate, 11, 2387–2403.
——, and ——, 2000a: Modulation of eastern north Pacific hurri-canes by the Madden–Julian oscillation. J. Climate, 13, 1451–1460.
——, and ——, 2000b: Modulation of hurricane activity in theGulf of Mexico by the Madden–Julian oscillation. Science,287, 2002–2004.
——, and S. K. Esbensen, 2003: The amplification of east PacificMadden–Julian oscillation convection and wind anomaliesduring June–November. J. Climate, 16, 3482–3497.
——, and ——, 2007: Satellite and buoy observations of borealsummer intraseasonal variability in the tropical northeast Pa-cific. Mon. Wea. Rev., 135, 3–19.
——, D. B. Chelton, and S. K. Esbensen, 2008: Subseasonal SSTvariability in the tropical eastern North Pacific during borealsummer. J. Climate, in press.
Matthews, A. J., 2000: Propagation mechanisms for the Madden–Julian oscillation. Quart. J. Roy. Meteor. Soc., 126, 2637–2651.
——, 2004: Intraseasonal variability over tropical Africa duringNorthern Summer. J. Climate, 17, 2427–2440.
Mo, K. C., 2000: The association between intraseasonal oscilla-tions and tropical storms in the Atlantic basin. Mon. Wea.Rev., 128, 4097–4107.
Mounier, F., and S. Janicot, 2004: Evidence of two independentmodes of convection at intraseasonal timescale in the WestAfrican summer monsoon. Geophys. Res. Lett., 31, L16116,doi:10.1029/2004GL020665.
——, ——, and G. N. Kiladis, 2008: The West African monsoondynamics. Part III: The quasi-biweekly zonal dipole. J. Cli-mate, 21, 1911–1928.
Murakami, T., L.-X. Chen, A. Xie, and M. L. Shresha, 1986: East-ward propagation of 30–60-day perturbations as revealed
from outgoing longwave radiation data. J. Atmos. Sci., 43,961–971.
Neelin, J. D., and I. M. Held, 1987: Modeling tropical convergencebased on the moist static energy budget. Mon. Wea. Rev., 115,3–12.
Nicholson, S. E., and J. P. Grist, 2003: The seasonal evolution ofthe atmospheric circulation over West Africa and equatorialAfrica. J. Climate, 16, 1013–1030.
——, and Coauthors, 2003: Validation of TRMM and other rain-fall estimates with a high-density gauge dataset for West Af-rica. Part II: Validation of TRMM rainfall products. J. Appl.Meteor., 42, 1355–1368.
North, G. R., T. L. Bell, R. F. Cahalan, and F. J. Moeng, 1982:Sampling errors in the estimation of empirical orthogonalfunctions. Mon. Wea. Rev., 110, 699–706.
Redelsperger, J. L., A. Diongue, A. Diedhiou, J. P. Ceron,M. Diop, J. F. Gueremy, and J. P. Lafore, 2002: Multi-scaledescription of a Sahelian synoptic weather system represen-tative of the West African monsoon. Quart. J. Roy. Meteor.Soc., 128, 1229–1257.
——, C. D. Thorncroft, A. Diedhiou, T. Lebel, D. J. Parker, andJ. Polcher, 2006: African Monsoon Multidisciplinary Analy-sis: An international research project and field campaign.Bull. Amer. Meteor. Soc., 87, 1739–1746.
Reed, R. J., D. C. Norquist, and E. Recker, 1977: The structureand properties of African wave disturbances as observed dur-ing Phase III of GATE. Mon. Wea. Rev., 103, 317–333.
Riehl, H., 1954: Tropical Meteorology. McGraw-Hill, 392 pp.
Shapiro, L. J., 1987: Month-to-month variability of the Atlantictropical circulation and its relationship to tropical storm for-mation. Mon. Wea. Rev., 115, 2598–2614.
Sultan, B., and S. Janicot, 2003: The West African monsoon dy-namics. Part II: The “preonset” and the “onset” of the sum-mer monsoon. J. Climate, 16, 3407–3427.
——, ——, and A. Diedhiou, 2003: The West African monsoondynamics. Part 1: Documentation of intraseasonal variability.J. Climate, 16, 3389–3406.
Thorncroft, C. D., and B. J. Hoskins, 1994a: An idealized study ofAfrican easterly waves. Part I: A linear view. Quart. J. Roy.Meteor. Soc., 120, 953–982.
——, and ——, 1994b: An idealized study of African easterlywaves. Part II: A nonlinear view. Quart. J. Roy. Meteor. Soc.,120, 983–1015.
——, and D. P. Rowell, 1998: Interannual variability of Africanwave activity in a general circulation model. Int. J. Climatol.,18, 1305–1323.
——, and K. Hodges, 2001: African easterly wave variability andits relationship to Atlantic tropical cyclone activity. J. Cli-mate, 14, 1166–1179.
Tomas, R. A., and P. J. Webster, 1997: The role of inertial insta-bility in determining the location and strength of near-equatorial convection. Quart. J. Roy. Meteor. Soc., 123, 1445–1482.
Vimont, D. J., and J. P. Kossin, 2007: The Atlantic MeridionalMode and hurricane activity. Geophys. Res. Lett., 34, L07709,doi:10.1029/2007GL029683.
Vintzileos, A., and W. M. Thiaw, 2006: On the forecast of cumu-lative precipitation at subseasonal time-scales over the Sahel.Geophys. Res. Lett., 33, L14703, doi:10.1029/2006GL026663
Waliser, D. E., C. Jones, J.-K. E. Schemm, and N. E. Graham,
15 JUNE 2008 M A L O N E Y A N D S H A M A N 2917

1999: A statistical extended-range tropical forecast modelbased on the slow evolution of the Madden–Julian oscilla-tion. J. Climate, 12, 1918–1939.
Wheeler, M., and K. M. Weickmann, 2001: Real-time monitoringand prediction of modes of coherent synoptic to intraseasonaltropical variability. Mon. Wea. Rev., 129, 2677–2694.
——, and H. H. Hendon, 2004: An all-season real-time multivari-ate MJO index: Development of an index for monitoring andprediction. Mon. Wea. Rev., 132, 1917–1932.
Wu, L., 2007: Impact of Saharan air layer on hurricane peak
intensity. Geophys. Res. Lett., 34, L09802, doi:10.1029/2007GL029564
Xie, S. P., H. Xu, W. S. Kessler, and M. Nonaka, 2005: Air–seainteraction over the eastern Pacific warm pool: Gap winds,thermocline dome, and atmospheric convection. J. Climate,19, 5–20.
Zehr, R. M., 1992: Tropical cyclogenesis in the western NorthPacific. NOAA Tech. Rep. NESDIS 61, 181 pp. [Availablefrom U.S. Department of Commerce, NOAA/NESDIS, 5200Auth Rd., Washington, DC 20233.]
2918 J O U R N A L O F C L I M A T E VOLUME 21


![Intraseasonal variability in sea surface height over the ...iprc.soest.hawaii.edu/users/xie/scsEddy-jgr10.pdf[1] Intraseasonal sea surface height (SSH) variability and associated eddy](https://img.pdfslide.us/doc/110x75/5f3cc7d5cdc47d04b2172ede/intraseasonal-variability-in-sea-surface-height-over-the-iprcsoest-1-intraseasonal.jpg)