Embed Size (px)
Citation preview
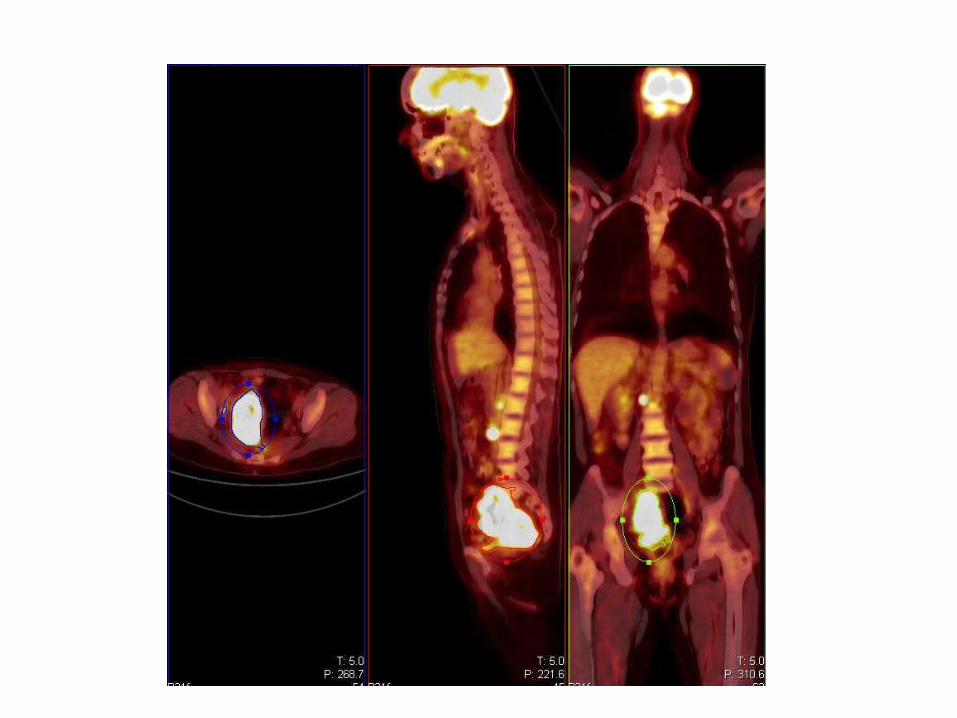
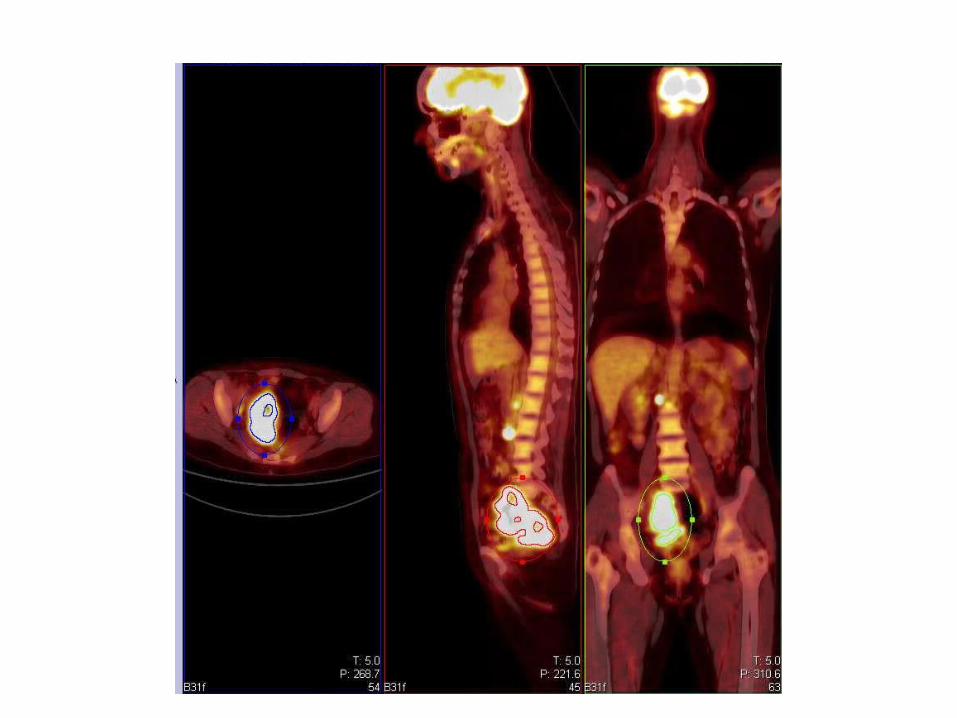
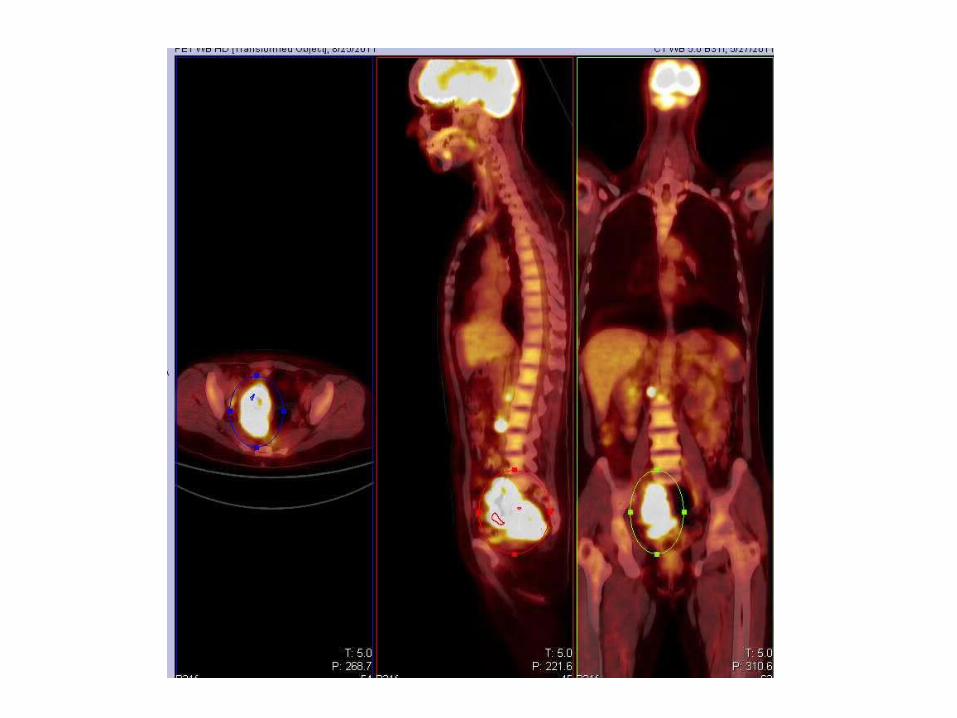
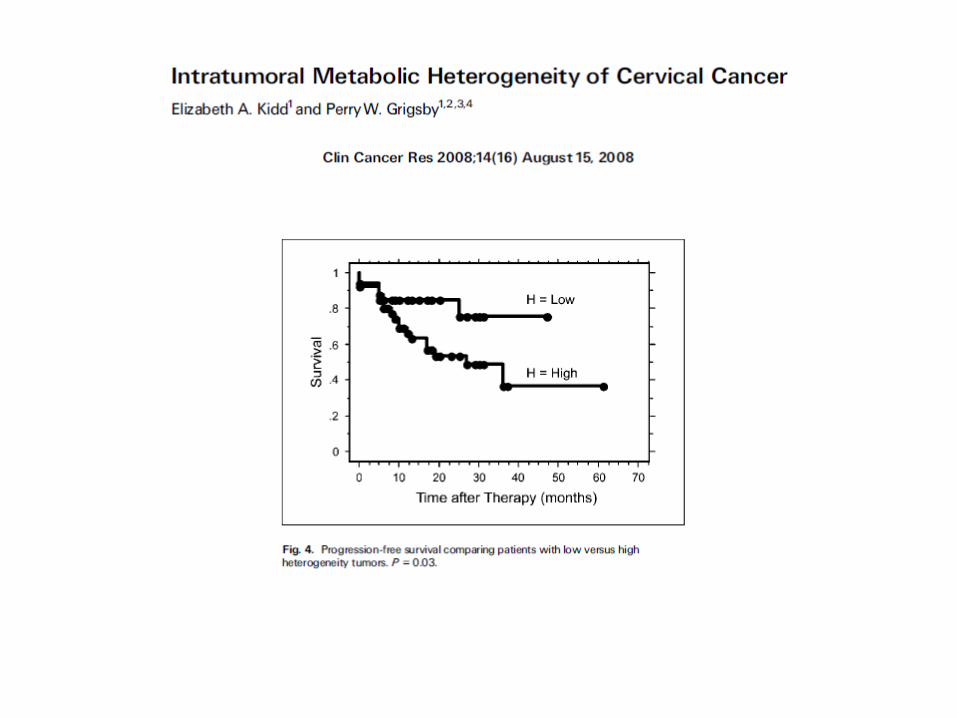
INTRA-TUMORAL METABOLIC HETEROGENEITY OF CERVICAL CANCER
Perry Grigsby
Tumor Heterogeneity
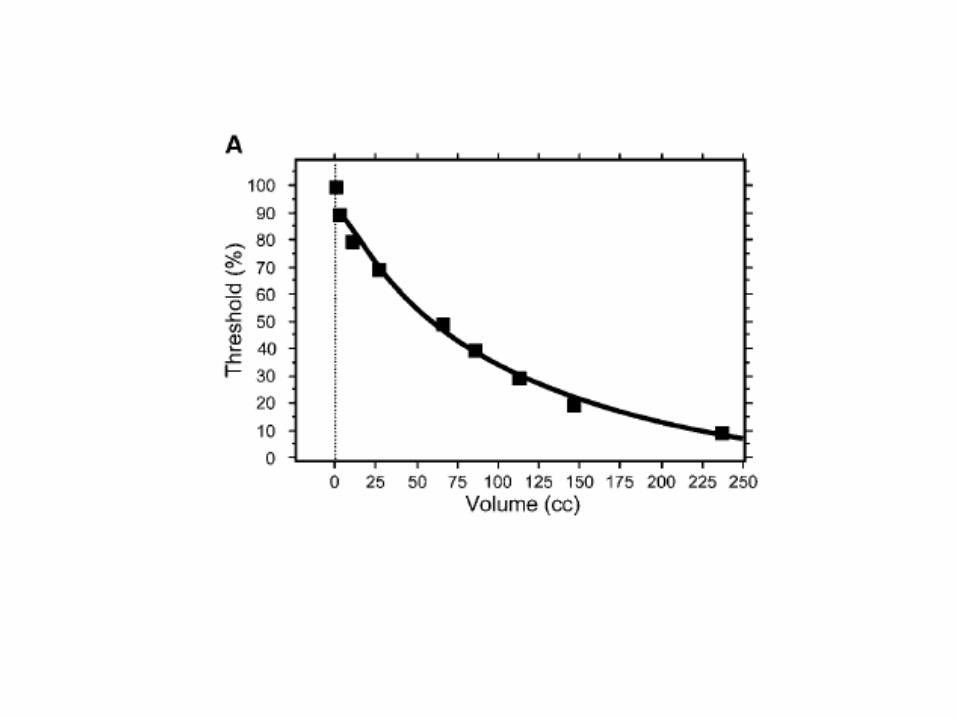
Definition

Pre-Treatment


-100
0
100
200
300
400
500
600
Y V
aria
bles
0 10 20 30 40 50 60 70 80 90 100 110Percent Threshold
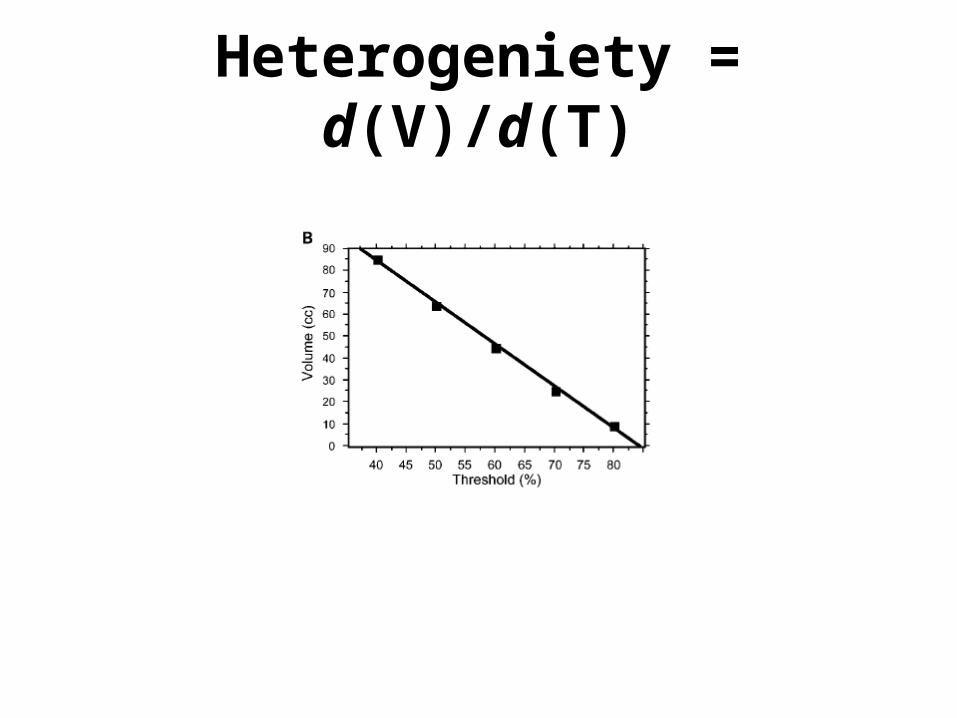
Heterogeniety = d(V)/d(T)
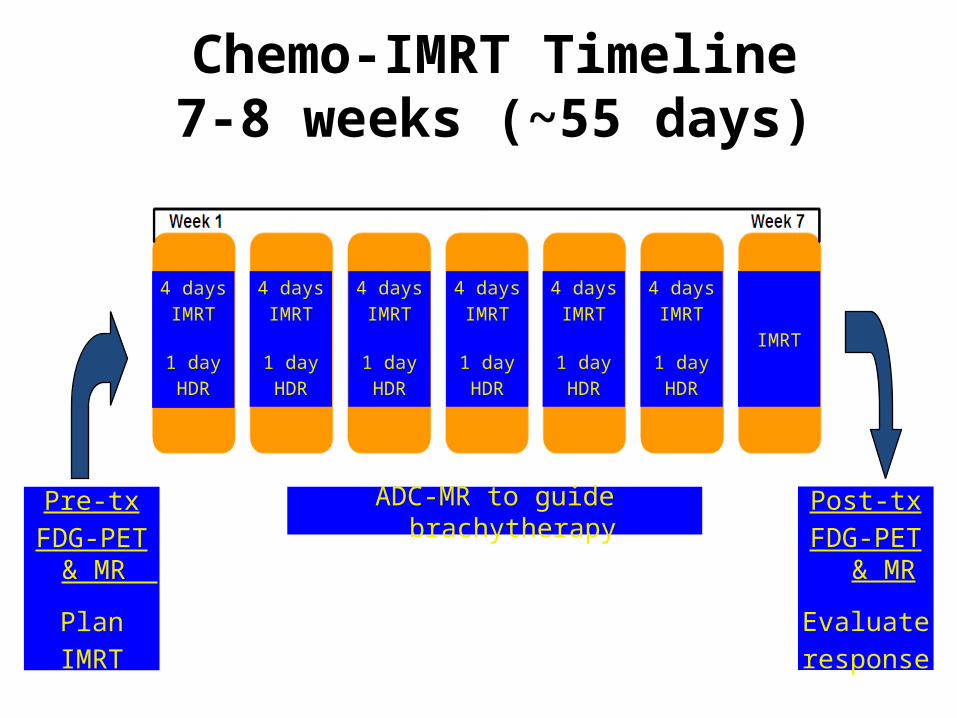
Chemo-IMRT Timeline7-8 weeks (~55 days)
Pre-tx
FDG-PET & MR
Plan
IMRT
Post-tx
FDG-PET & MR
Evaluate
response
ADC-MR to guide brachytherapy
4 days
IMRT
1 day
HDR
4 days
IMRT
1 day
HDR
4 days
IMRT
1 day
HDR
4 days
IMRT
1 day
HDR
4 days
IMRT
1 day
HDR
4 days
IMRT
1 day
HDR
IMRT

Change in Heterogeneity During Treatment
-1
-.9
-.8
-.7
-.6
-.5
-.4
-.3
-.2
Het
erog
enei
ty (
dV/d
T)
Pre-Treatment Week 2 Week 4
Cell Point ChartError Bars: ± 1 Standard Error(s)
Cu-ATSMHypoxia
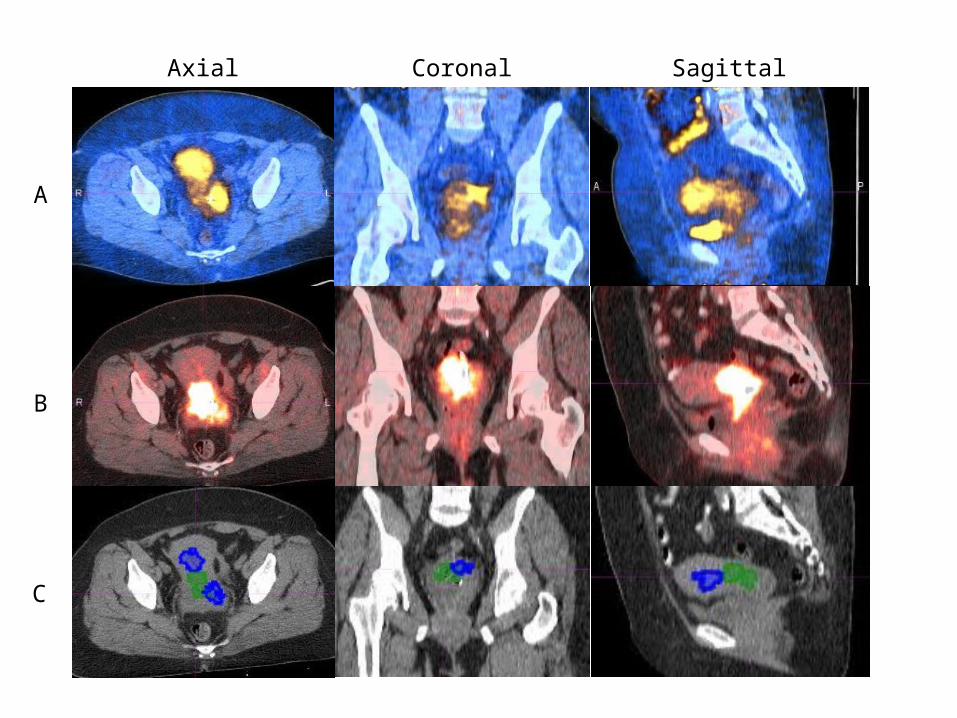
A
B
C
Axial Coronal Sagittal
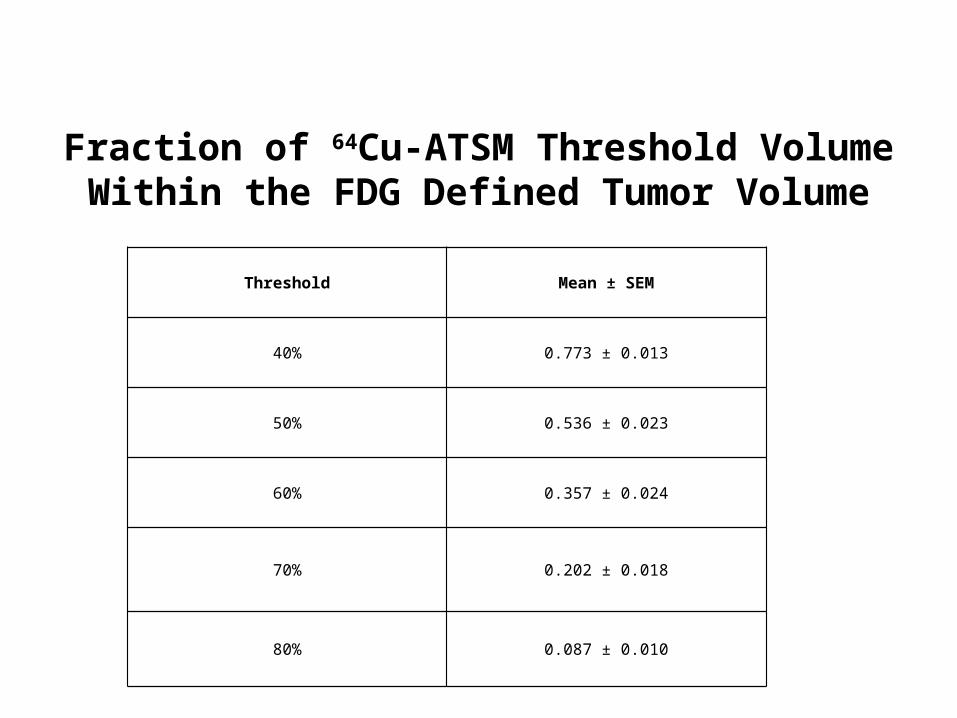
Threshold Mean ± SEM
40% 0.773 ± 0.013
50% 0.536 ± 0.023
60% 0.357 ± 0.024
70% 0.202 ± 0.018
80% 0.087 ± 0.010
Fraction of 64Cu-ATSM Threshold Volume Within the FDG Defined Tumor Volume

64Cu-ATSM Heterogeneity
0
0.2
0.4
0.6
0.8
1
0 5 10 15 20 25 30 35 40 45
p=0.04Hetero > -1.7Hetero ≤ -1.7
Time (Months)
Pro
gre
ssio
n F
ree
Su
rviv
al
Non-Spatial
Other Measures of Heterogeneity
Texture & Shape of Metabolism

A toy example for demonstration of constructing the co-occurrence matrix. (a) Test image of size 4x4 and 4 intensity levels (M=4). The corresponding co-occurrence matrix assuming single pixel distance in: (b) East direction and (c) all directions. The matrix is converted into a probability mass function by normalization so that the sum is equal to unity.
12
34
56
78
0
2
4
6
8
0
0.05
0.1
Co-occurrence matrix for 40% SUV

02
46
8
0
2
4
6
80
0.01
0.02
0.03
0.04
0.05
Co-occurrence matrix for 40% SUV

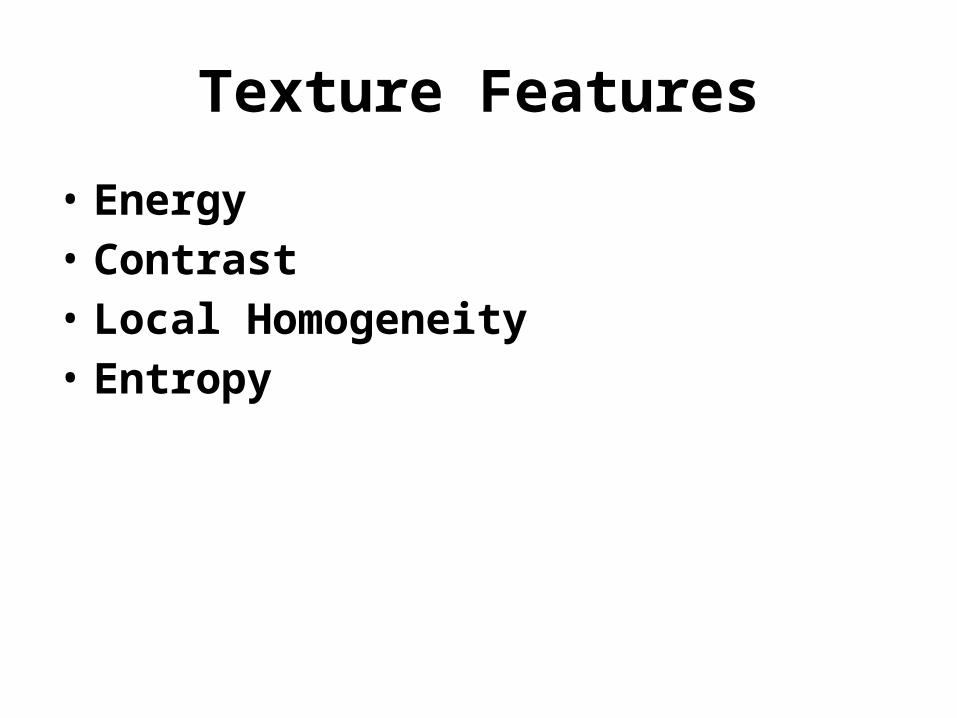
Texture Features
• Energy• Contrast• Local Homogeneity• Entropy

Shape-based Features
• Eccentricity• Euler Number• Solidity• Extent

30
Volumetric run length type texture
Feature Definition Description
Short Run Emphasis Measures the distribution of short runs. The SRE is highly dependent on the occurrence of short runs and is expected large for fine textures.
Long Run EmphasisMeasures distribution of long runs. The LRE is highly dependent on the occurrence of long runs and is expected large for coarse structural textures.
Low Gray-Level Run Emphasis Measures the distribution of low gray level values. The LGRE is expected large for the image with low gray level values.
High Gray-Level Run Emphasis Measures the distribution of high gray level values. The HGRE is expected large for the image with high gray level values.
Short Run Low Gray-Level EmphasisMeasures the joint distribution of short runs and low gray level values. The SRLGE is expected large for the image with many short runs and lower gray level values.
Short Run High Gray-Level EmphasisMeasures the joint distribution of short runs and high gray level values. The SRHGE is expected large for the image with many short runs and high gray level values.
Long Run Low Gray-Level EmphasisMeasures the joint distribution of long runs and low gray level values. The LRLGE is expected large for the image with many long runs and low gray level values.
Long Run High Gray-Level EmphasisMeasures the joint distribution of long runs and high gray level values . The LRHGE is expected large for images with many long runs and high gray level values.
Gray-Level Non-uniformityMeasures the similarity of gray level values through out the image. The GLNU is expected small if the gray level values are alike through out the image.
Run Length Non-uniformityMeasures the similarity of the length of runs through out the image. The RLNU is expected small if the run lengths are alike through out the image.
Run PercentageMeasures the homogeneity and the distribution of runs of an image in a specific direction. The RP is the largest when the length of runs is 1 for all gray levels in specific direction.
21 1
1 ( , )M N
i jr
P i jSRE
n j
2
1 1
1( , )
M N
i jr
LRE P i j jn
21 1
1 ( , )M N
i jr
P i jLGRE
n i
2
1 1
1( , )
M N
i jr
HGRE P i j in
2 2
1 1
1 ( , )M N
i jr
P i jSRLGE
n i j
2
21 1
1 ( , )M N
i jr
P i j iSRHGE
n j
2
21 1
1 ( , )M N
i jr
P i j jLRLGE
n i
2 2
1 1
1( , )
M N
i jr
LRHGE P i j i jn
2
1 1
1( , )
M N
i jr
GLNU P i jn
2
1 1
1( , )
N M
j ir
RLNU P i jn
rn
RPM N
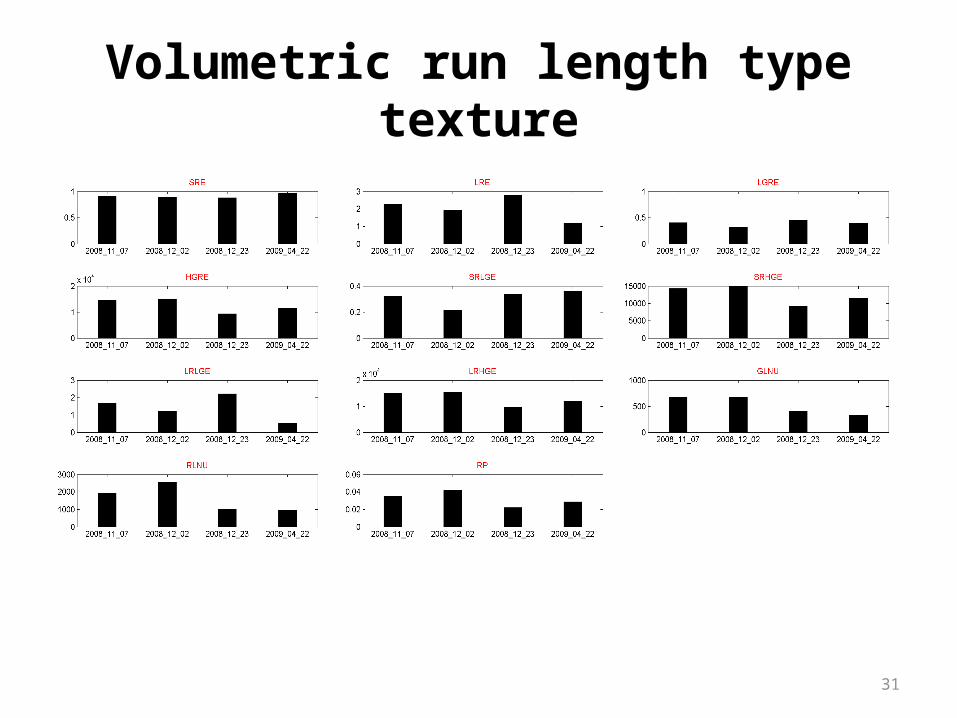
Volumetric run length type texture
31
32
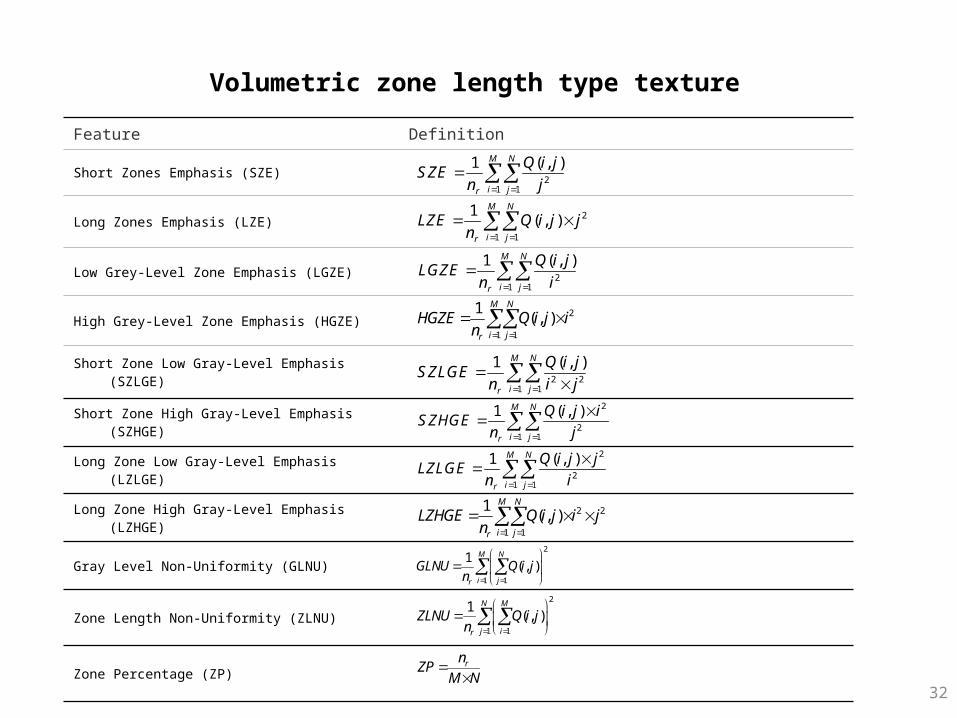
Volumetric zone length type texture
Feature Definition
Short Zones Emphasis (SZE)
Long Zones Emphasis (LZE)
Low Grey-Level Zone Emphasis (LGZE)
High Grey-Level Zone Emphasis (HGZE)
Short Zone Low Gray-Level Emphasis (SZLGE)
Short Zone High Gray-Level Emphasis (SZHGE)
Long Zone Low Gray-Level Emphasis (LZLGE)
Long Zone High Gray-Level Emphasis (LZHGE)
Gray Level Non-Uniformity (GLNU)
Zone Length Non-Uniformity (ZLNU)
Zone Percentage (ZP)
21 1
1 ( , )M N
i jr
Q i jSZE
n j
2
1 1
1( , )
M N
i jr
LZE Q i j jn
21 1
1 ( , )M N
i jr
Q i jLGZE
n i
2
1 1
1( , )
M N
i jr
HGZE Q i j in
2 2
1 1
1 ( , )M N
i jr
Q i jSZLGE
n i j
2
21 1
1 ( , )M N
i jr
Q i j iSZHGE
n j
2
21 1
1 ( , )M N
i jr
Q i j jLZLGE
n i
2 2
1 1
1( , )
M N
i jr
LZHGE Q i j i jn
2
1 1
1( , )
M N
i jr
GLNU Q i jn
2
1 1
1( , )
N M
j ir
ZLNU Q i jn
rn
ZPM N

Volumetric zone length type texture
33

Chemo-IMRT Timeline7-8 weeks (~55 days)
Pre-tx
FDG-PET & MR
Plan
IMRT
Post-tx
FDG-PET & MR
Evaluate
response
ADC-MR to guide brachytherapy
4 days
IMRT
1 day
HDR
4 days
IMRT
1 day
HDR
4 days
IMRT
1 day
HDR
4 days
IMRT
1 day
HDR
4 days
IMRT
1 day
HDR
4 days
IMRT
1 day
HDR
IMRT

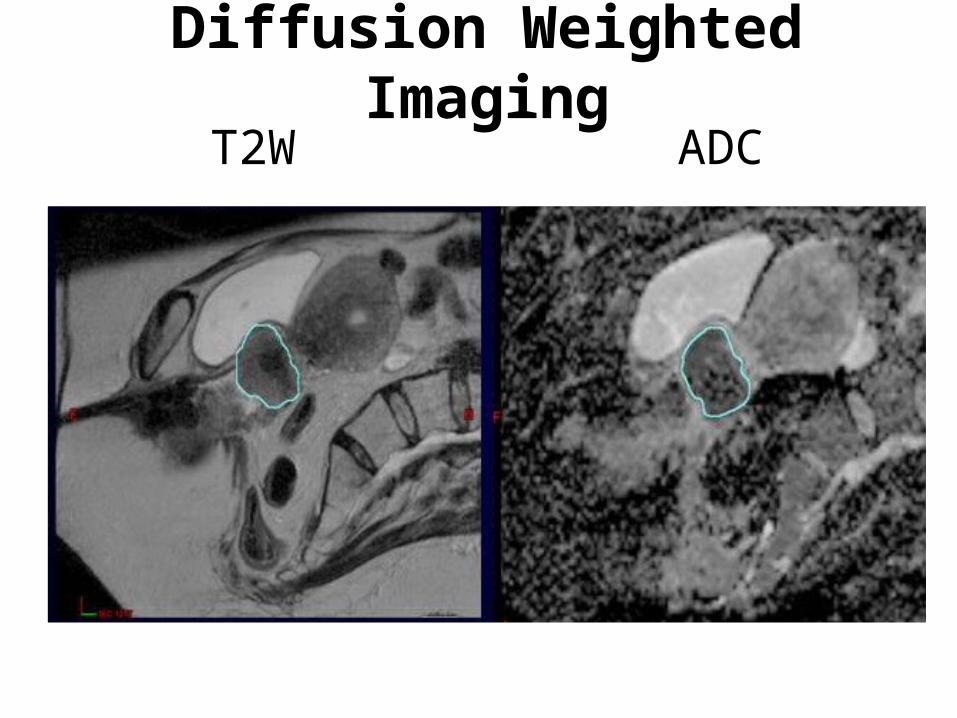
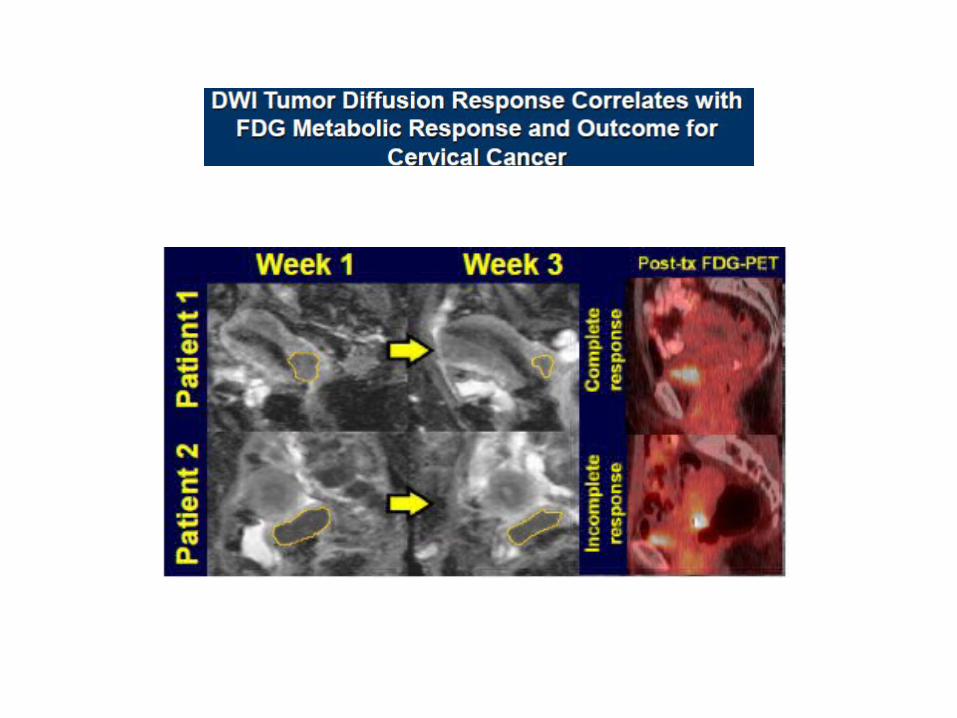
Diffusion Weighted ImagingT2W ADC

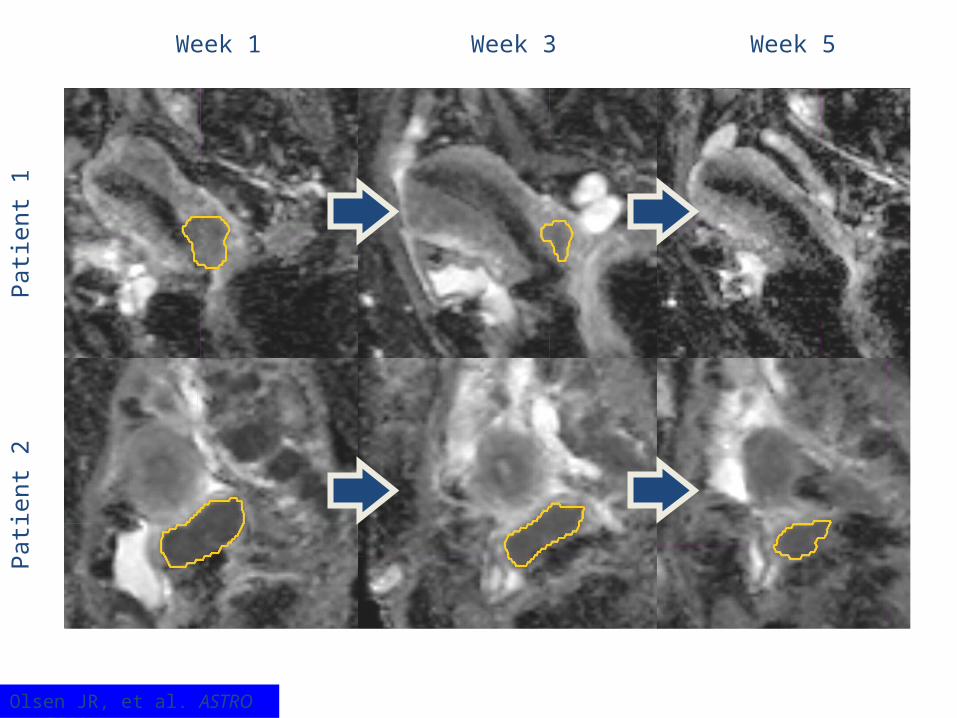
Week 1 Week 3 Week 5P
atie
nt 2
Pat
ient
1
Olsen JR, et al. ASTRO 2011.
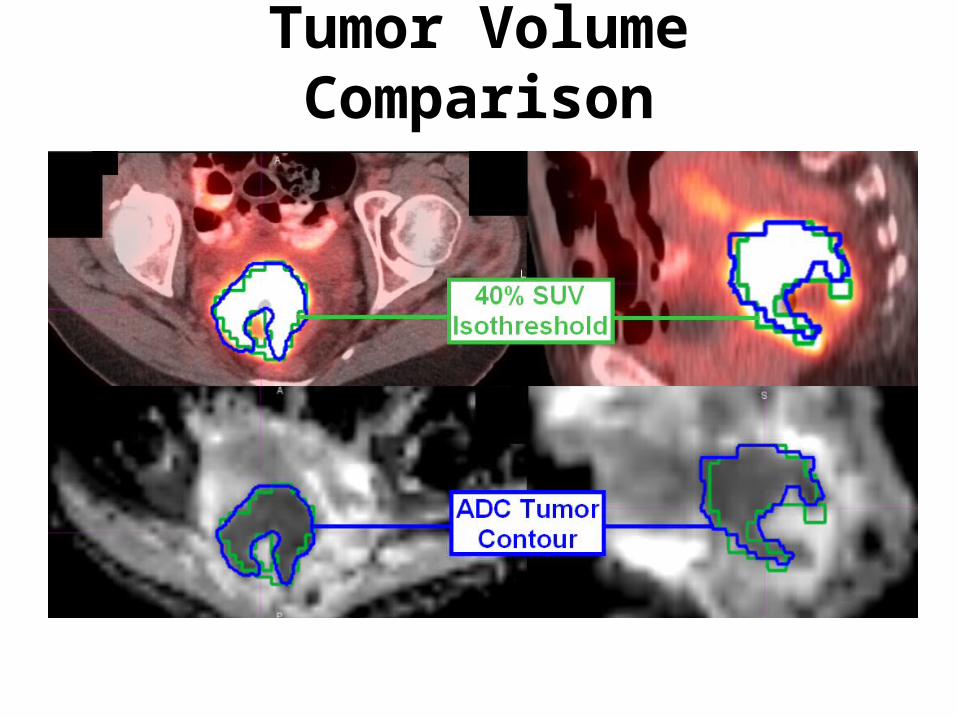
Tumor Volume Comparison

Tumor Sub-Volume Comparison
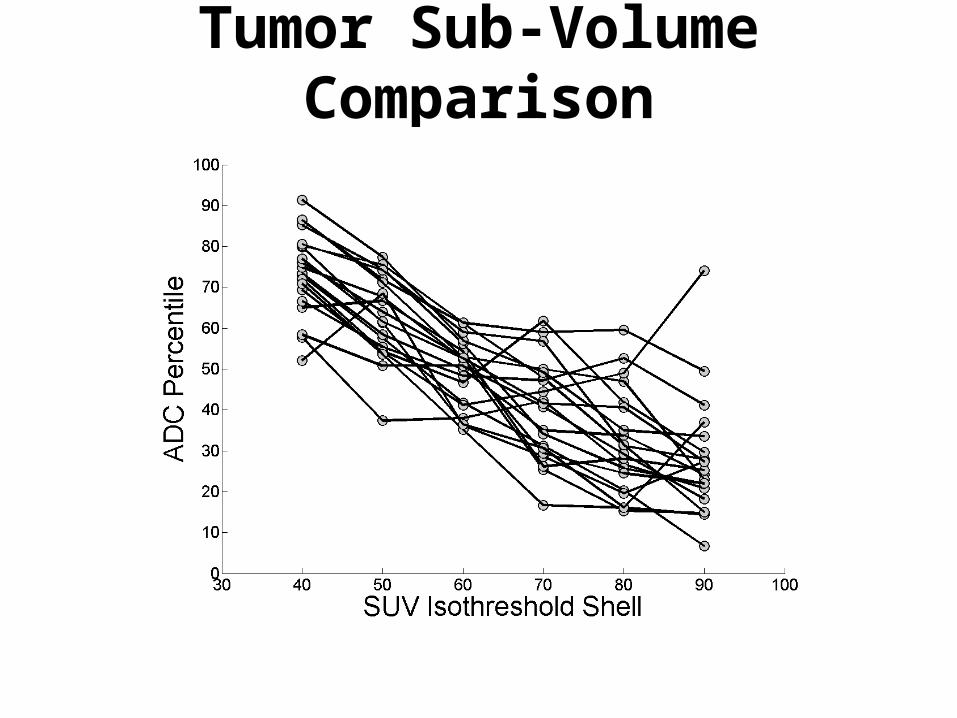
Tumor Sub-Volume Comparison
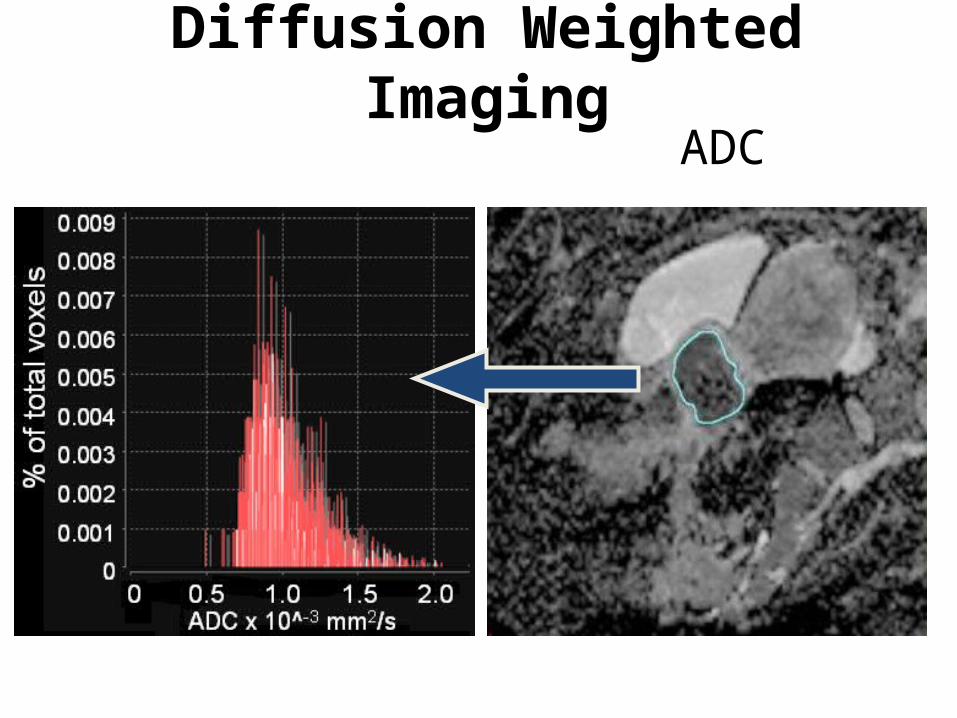
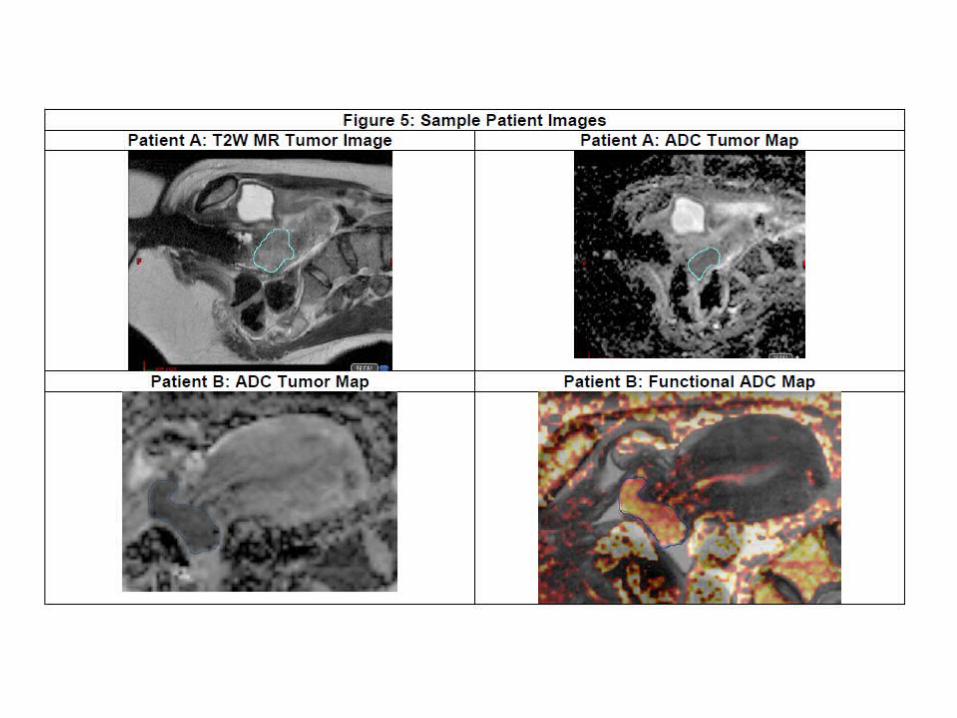
ADC
Diffusion Weighted Imaging
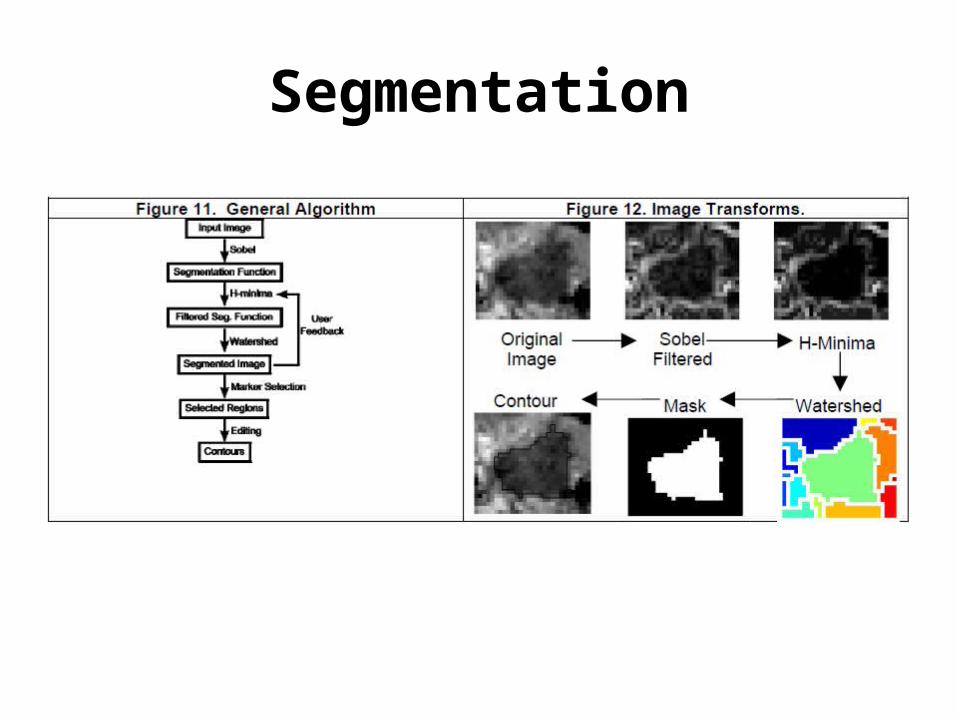
Segmentation

DTI

DTI

Goals
• Identify Biologic Targets
• Improve Image Guided Therapy

0
.2
.4
.6
.8
1
Cum
. Sur
viva
l
0 20 40 60 80 100 120 140 160 180Time
Improve Survival with IMRT/IGRTExternal RT & Brachytherapy

0
.05
.1
.15
.2
.25
Cum
. Haz
ard
0 20 40 60 80 100 120 140 160 180Time
Decrease Complications with IMRT/IGRT External RT & Brachytherapy
Future Directions
Spatial Heterogeneity
Pre-Treatment
Intra-Treatment
Post-Treatment
Future Directions

Whole-Body PET/MR Hybrid Imaging