Embed Size (px)
Citation preview

International Journal of Scientific & Engineering Research Volume 8, Issue 5, May-2017 564 ISSN 2229-5518
IJSER © 2017 http://www.ijser.org
Interpretation of gravity anomaly of Parts of Lower and Middle Benue Trough,
Nigeria
MukailaAbdullahi, Upendra K. Singh, Jeetendra Soren
ABSTRACT - The airborne gravity anomalies interpretation of the lower and middle Benue Trough of Nigeria have carried out. The early cretaceous sedimentary rocks of the study area and the outcropping and intruded basaltic rocks are considered to be the primary source of the mineral potential of the study area. Depth to the subsurface structures has been carried out using spectral analysis and the Euler deconvolution technique. The minimum depth to anomalous sources of 0.80 km was recorded while a maximum depth of 3.0 km was recorded by the Euler deconvolution technique and minimum depth of 0.83 km and maximum of 3.4 km were recorded using the spectral analysis method. The depth estimate by the two methods is in good agreement as well as with result of the previous depth estimate by some researchers.
Key words -Benue Trough, gravity anomalies, Precambrian, cretaceous sediments, basalts, spectral analysis, Euler deconvolution.
—————————— —————————— 1 Introduction
The Nigerian Benue Trough is located on the
West Coast of Africa. It is a rift that was
developed during the second phase of the
rifting of Gondwana supercontinent which
resulted in the opening of the South Atlantic
Ocean, Gulf of Guinea and the separation of
South America in the Late Jurassic to Early
Creataceous[7]; [3].
As can be seen in figure 1, the Benue
Trough is an integral of the West and Cental
African Rift System [8]; [10], starting from the
northern end of the Niger Delta Basin in the
southern Nigeria and extends in the north-east
direction to the Bornu Basin in the east to join
the other African intra-continental rift system
of Chad, Niger, Cameroon and Sudan. [4],
stated that the structural evolution of the
Trough may be attributed to the extension of
the Atlantic Ocean fractures on the continent
through the transcurrent movement along the
deep seated basement faults. It is
approximately 1050 km long and 250 km wide
in the southern (Niger Delta Basin) to a width
of 120 km in the eastern part (Bornu Basin)
with Creataceous thickness of around 4-6 km
and trends NE-SW direction unconfromably
resting on the Precambrian crystalline
basement [5]. The Nigerian Benue Trough was
divided into three sub Troughs viz; the Lower
Benue Trough (LTB), the Middle Benue
Trough (MBT) and the Upper Benue Trough
(UBT) on the basis of their tectonic and
sedimentary characteristics [14] (figure 1).
In this paper we intent to interpret the
new airborne gravity data obtained from the
Nigerian Geological Survey Agency (NGSA)
in association to the geological map in order to
understand to causative sources of the
anomalies.
2Geological Settings of the Study Area
IJSER

International Journal of Scientific & Engineering Research Volume 8, Issue 5, May-2017 565 ISSN 2229-5518
IJSER © 2017 http://www.ijser.org
The study area is composed of metamorphic
rocks of Neo-Proterozoic age[2]; [13]. The
crystalline basement rocks are mainly Biotite
Gneiss, Porphroblastic Gneiss and Granite
Gneiss (Migmatitic_Gneiss complex) and
coarse porphyritic granites (Pan-African older
granitoid) with thin dykes of intermediate-
basic intrusive (figure 3). The basement rocks
are said to be grouped into two; the migmatite-
Gneiss complex and the Pan-African older
granitoids. The coarse porphyritic granite of
around Gboko area can be seen to be cross-cut
by the rhyolitic (of the Pan-African younger
granitoid) dyke.
The Early Cretaceous sedimentary
rocks of this area include; the Neocomian –
Cenomanian Asu River Group, the early to late
Turonian Eze–Aku Group, the Coniacian –
Santonian Awgu-Ndeaboh formation, the
Nkporo formation and the Nsukka formation
(figure 2). The Asu River Group represents the
earliest clastic fill of the Lower Benue Trough.
It consists of upper marine shale and limestone
with sandstone intercalations. The Asu River
Group is overlain by the Turonian Eze–Aku
Group which consists of fossiliferous
calcareous sandstones, shale and siltstones of
unknown thicknesses. Overlying the Turonian
Eze–Aku Group is the Awgu Group consisting
of the thick black shale and limestones.
Overlying the Awgu formation is the Nkporo
formation consisting of shale and mudstone.
3Analysis of the airborne gravity anomalies
Airborne gravity data is collected for the study
area from Nigerian Geological Survey Agency
(NGSA). The data is acquired at a terrain
clearance of 80 m, along NE-SW oriented
flight lines with 4000 m flight line spacing.
The data is available in digitized sheet maps.
The data is then analyzed to obtain the
complete Bouguer anomaly map (figure 7) of
the study area using geophysical survey
software (Geosoft).
The gravity anomalies H1, H2, H3, H5, H6,
L1, L2, L3 and L4 are related to the
underlying cretaceous sedimentary rocks. The
large variations between these anomalies
within the cretaceous sedimentary rocks may
be due large density variations in the
constituent’s sediments and/or other geological
bodies like the barite ores, gypsum, lead-zinc
sulphide deposits, sills, dykes, pyroclasts,
volcanic rocks and basaltic lava intruded into
the sedimentary strata. The low anomalies may
be related to the basin and sub-basins in the
study area. The anomalies H4 and H8 may be
associated to the near-surface high density
bodies like basalts with some of which
intruded into the overlying the sedimentary
rocks and others exposed on the surface
(figure 2). The anomalies of H7, H9 and H10
and adjoin area which are relatively complex
varying in amplitude from 15 mGal to above
33 mGal. These anomalies are associated to
the Precambrian crystalline basement rocks
(biotite-gneiss, porphroblastic-gneiss and the
granite-gneiss).
Figure 4 below shows the anomaly
(residual) map of the Bouguer anomaly. This
gives the anomalies due to the subsurface
buried bodies. This is obtained through low-
pass filter at 7.0 km cut-off wavelength.
IJSER

International Journal of Scientific & Engineering Research Volume 8, Issue 5, May-2017 566 ISSN 2229-5518
IJSER © 2017 http://www.ijser.org
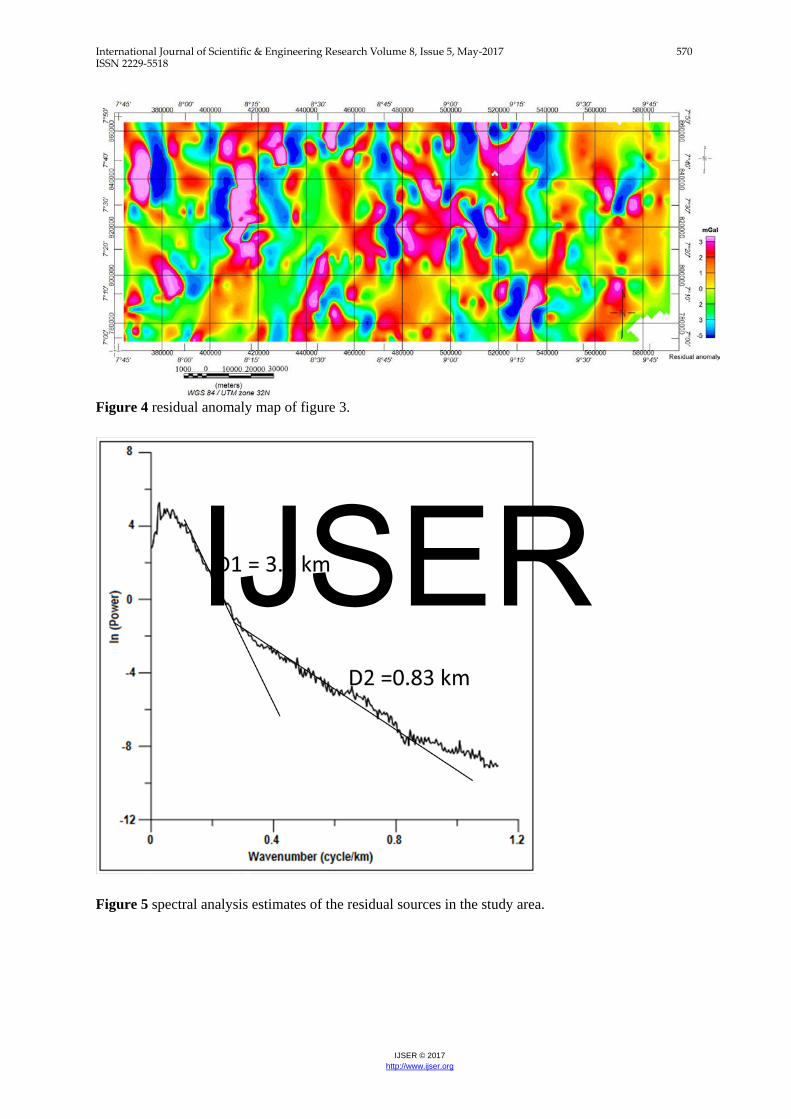
4Spectral Analysis
Spectral analysis is a useful technique based
on the statistical analysis method using the
Fourier Transform for the estimation of
basement depth [6]; [15]; [9]; [11]. We applied
the spectral analysis technique on the residual
gravity anomaly map (figure 3). The radial
average power spectrum method was deployed
in the calculation of the basement depth. Fast
Fourier Transform (FFT) was applied to the
airborne gravity anomaly map to calculate the
power energy spectrum. The energy decay
curves include linear sections with slope
distinctions which are attributed to the deeper
and shallower sources. The method depends
on the logarithmic plot of the power spectrum
against the wavenumber and the depth is
estimated on the basis of moving data window.
That is, by selecting the steepest straight line
segment of the power spectrum. Figures 6
shows the radially average power spectrum of
the gravity anomaly which showed different
segments of straight line that decreases in
slope with increasing wavenumber. The slope
of each section yields the averaged estimates
of the depth to the sought causative sources. In
the figure we have showed the average depth
of the deeper sources as 3.4 km while that of
the shallower sources as 0.83 km.
5Euler deconvolution
Euler deconvolution is based on homogeneity
equation. The homogeneity equation relates
the magnetic field and the components of its
gradient to the location of the sources with a
degree of homogeneity been N. N is known as
the structural index [16]. This parameter is
defined as the rate of change of the field with
distance.
To calculate the basement depth, the
residual anomaly grid was processed and then
the euler deconvolution using a range of
structural indices from 0.0 (thin sheet
edge/dyke), 1.0 (pipe/cylinder/thin bed fault),
and 2.0 (for sphere). The Euler solution of the
residual anomaly map was calculated to fit a
dyke model (N = 0.0) at window size of
10x10. Figure 5, shows the clustering of
circles with linear shape, indicating the depth
ranges of anomalous soures from 0.80 km to
over 3.0 km.
The result of the depth estimates by
the spectral analysis and the Euler
deconvolution technique showed a sharp
agreement. Maximum depth of about 3.5 km
was recorded by [1] around this area.
6Conclusion
The airborne gravity anomalies of the parts of
Lower and the Middle Nigerian Benue Trough
have been analyzed and interpreted in line
with the geological formations that are
probably the causative sources of the
anomalies. The area is found to be intruded by
basaltic rocks with some of them been exposed
IJSER

International Journal of Scientific & Engineering Research Volume 8, Issue 5, May-2017 567 ISSN 2229-5518
IJSER © 2017 http://www.ijser.org
to the surface as seen from the geological map.
The anomalies of the area is also been
characterized by a basin and sub-basins which
may be separated by a horst like structure.
Depth to the subsurface structures has been
carried out using spectral analysis and the
Euler deconvolution technique. The minimum
depth to anomalous sources of 0.80 km was
recorded while a maximum depth of 3.0 km
was recorded using Euler deconvolution
technique and a minimum depth of 0.83 km
and the maximum of 3.4 km using the spectral
analysis method. The depth estimate by the
two methods is in good agreement as well as
with result of the previous depth estimate by
some researchers.
Acknowledgements
The first author wishes to acknowledge the
Federal Government of Nigeria through
ModibboAdama University of Technology,
Yola. The Airborne gravity data was provided
by the Nigerian Geological Survey Agency
(NGSA).
References
[1] O.K. Agagu and C.I. Adighije “Tectonic
and sedimentation framework of the lower
Benue Trough, southeastern Nigeria”
Journal of African Earth Science, vol.5,
pp267- 274, 1983.
[2] C.O. Ajayi and D.E. “Ajakaiye Structures
deduced from gravity data in the middle
Benue Trough, Nigeria” Journal of
African Earth Science, vol. 5, pp359 –
369, 1986.
[3] G.K. Anudu, R.A. Stephenson and D.I.M.
Macdonald “Using high-resolution
aeromagnetic data to recognize and map
intra-sedimentary volcanic rocks and
geologicalstructures across the cretaceous
middle Benue Trough, Nigeria” Journal of
African Earth Sciences vol. 99, pp625-636,
2014.
[4] J. Benkhelil “Benue Trough and Benue
chain” Geol. Mag. Vol. 119, pp155 – 168,
1982.
[5] J. Benkhelil “The origin and evolution of
the Cretaceous Benue Trough, Nigeria”
Journal of African Earth Sciences vol. 8,
pp251-282, 1989.
[6] B.K. Bhattacharyya “Two dimensional
harmonic analysis as a tool for magnetic
interpretation” Geophysics vol. 30,
pp829-857, 1965.
[7] J.D. Carter, W. Barber, E.A. Tait and
Jones G.P. “The geology of parts of
Adamawa, Bauchi and Bornu provinces
in northeastern Nigeria” Bull. Geological
Survey of Nigeria, vol. 30, pp109, 1963.
[8] J.D. Fairhead “Geophysical controls on
sedimentation within the African rift
systems” Geological Society of London.
Vol. 25, pp19 – 27, 1986.
[9] J. Garcia-Abdeslem and G.E. Ness
“Inversion of the power spectrum from
magnetic anomalies” Geophysicsvol.59,
pp391-401, 1994.
[10] G.J. Genik “Regional framework,
IJSER

International Journal of Scientific & Engineering Research Volume 8, Issue 5, May-2017 568 ISSN 2229-5518
IJSER © 2017 http://www.ijser.org
structural and petroleum aspects of rift
basins in Niger, Chad and Central
African Republic (CAR)” Tectonophysicsvol.
213, pp169 – 185, 1992.
[11] F. Maurizio, Q. Tatina and S. Angelo
“Exploration of a lignite bearing in Northern
Ireland, using ground magnetic”
Geophysics vol. 62, pp1143-1150, 1998.
[12] NGSA “Geological map of Nigeria” From
Nigerian Geological Survey Agency (NGSA),
2009.
[13] N.G. Obaje “Geology and Mineral
Resources of Nigeria” Springer,
Dordrecht, 221, 2009.
[14] C.O. Ofoegbu “Interpretation of
aeromagnetic anomalies over the Lower
and Middle Benue Trough of Nigeria”
Geophys. J. Roy. Astron. Soc.Vol. 79,
pp813–823, 1984.
[15] A. Spector and F.S. Grant “Statistical
model for interpreting aeromagnetic
data” Geophysics vol. 35, pp293–302,
1970.
[16] D.T.T. Thompson “Euler, a new
technique for making computer assisted
estimates from magnetic data”
Geophysics vol. 47, pp31-37, 1982.
Figure 1 Relief map of Nigeria and adjoin; showing the Benue Trough and its sub-divisional Troughs, modified after [3].
IJSER

International Journal of Scientific & Engineering Research Volume 8, Issue 5, May-2017 569 ISSN 2229-5518
IJSER © 2017 http://www.ijser.org
Figure 2 Geology of the study area modified after [12].
Figure 3 complete Bouguer anomaly map of the study area.
IJSER
International Journal of Scientific & Engineering Research Volume 8, Issue 5, May-2017 570 ISSN 2229-5518
IJSER © 2017 http://www.ijser.org
Figure 4 residual anomaly map of figure 3.
Figure 5 spectral analysis estimates of the residual sources in the study area.
IJSER

International Journal of Scientific & Engineering Research Volume 8, Issue 5, May-2017 571 ISSN 2229-5518
IJSER © 2017 http://www.ijser.org
Figure 6 Euler deconvolution depth estimates of the residual anomaly map (figure 4).
MukailaAbdullahi is a junior research scholar Department of Applied Geophysics at IIT(ISM), Dhanbad, India. Email: [email protected] Upendra K. Singh is an associate professor Department of Applied Geophysics at IIT(ISM), Dhanbad, India. Email: [email protected] Jeetendra Soren isa junior research scholar Department of Applied Geophysics, IIT(ISM), Dhanbad, India Email: [email protected]
IJSER