Embed Size (px)
Citation preview
\<tq~(4S"
C·:2 ... INTERPRETATION OF REGIONAL
MAGNETIC AND GRAVITY DATA
IN CAPE YORK PENINSULA,
QUEENSLAND
By P. WELLMAN
AUSTRALIAN GEOLOGICAL SURVEY _,' ORGANISATION
AGS 0AW114.11OPW4mdille6111/AAUSTRALIANGEOLOGICAL SURVEYORGANIS AlfON
Interpretation of regional magnetic and gravity data in Cape YorkPeninsula, Queensland
Record 1995/45
A contribution to the National Geoscience Mapping AccordNORTH QUEENSLAND PROJECT
Peter Wellman
Regional Geology and Minerals Program
U ^I^14111 1 111 @ Australian Geological Survey Organisation 1995
DEPARTMENT OF PRIMARY INDUSTRIES AND ENERGY
Minister for Resources: Hon. David Beddall, MPSecretary: Greg Taylor
AUSTRALIAN GEOLOGICAL SURVEY ORGANISATION
Executive Director: Neil Williams
© Commonwealth of Australia 1995
ISSN: 1039-0073ISBN: 0 642 22353 X
This work is copyright. Apart from any fair dealings for the purposes of study,research, criticism or review, as permitted under the Copyright Act 1968, no part maybe reproduced by any process without written permission. Copyright is theresponsibility of the Executive Director, Australian Geological Survey Organisation.Requests and inquiries concerning reproduction and rights should be directed to thePrincipal Information Officer, Australian Geological Survey Organisation, GPOBox 378, Canberra City, ACT, 2601.
0 Australian Geological Survey Organisation 1995^ 2
CONTENTS
Abstract Introduction Magnetic and gravity data, and its interpretation
Data Interpretation of magnetic and gravity data Separation of compositional layering, faults/fractures and dykes Interpretation of boundaries between major rock bodies
Proterozoic metamorphic rocks Eu2 Eul Edward River metamorphic Group, Ee 1, Ee2, Ee3 Holroyd Group Coen Metamorphic Group Newberry Metamorphic Group Eu3, Eu4 and Eu5 Yambo Metamorphic Group Staaten Metamorphic Group Etheridge Group Dargalong and McDevitt Metamorphics Metamorphics in RED RIVER
Granites Cape York Peninsula Batholith Possible Proterozoic granites (E-Dgr) Staaten granites, S-Dgz Granites in RED RIVER
Permo-Carboniferous igneous activity Volcanic-subsidence structures and associated volcanics Dykes Plugs
Permian sediments - Lakefield Basin Basin defInition Well data Seismic data Extent of Lakefield Basin Position of eastern margin of Lakefield Basin Cause of Lakefield and Laura Basins Possible Permianffriassic sediments in WALSH
Faults and lineations Palmerville Fault Yin~ingga Fault Zone Gamboola Fault NNW -trending faults and structural boundaries NW -trending shear zones Magnetic lineations
Overview Folding Metamorphic texture/deformation Metallogenic implications
Geological history Acknolvledgments Appendix 1. Seismic refraction results References Figures
© Australian Geological Survey Organisation 1995
4 5 5 5 6 7 7 8 8 8 9 10 10 10 11 11 12 13 14 14 14 14 16 16 17 17 17 18 19 19 19 19 19 21 21 22 23 23 23 23 25 25 26 26 26 26 27 27 27 28 29 30 33
3
ABSTRACT
The oldest rocks of this region are Proterozoic and were deposited prior to 1550 Ma ago. They are represented by the Etheridge, Yambo and Newberry Metamorphic Groups, and probably also the rocks along the western margin of the mapped areas. These rocks were deformed, metamorphosed, and intruded by granites 1570-1550 Ma ago. A further accumulation of about 10 km of clastic sediments was deposited between 1550 and 1450 Ma ago. These now crop out as the Holroyd, Coen, Edward River and Staaten Metamorphic Groups, forming a north-south band near the middle of the sheet areas.
A multiphase Siluro-Devonian event, involving a deformation, metamorphism and intrusion, effected all but the westernmost parts ofthe area. North of the Gamboola Fault the orogeny had three phases: the first folding, faulting, and greenschist grade metamorphism, the second granite intrusion and metamorphism of greenschist to upper-amphibolitJ grade, and the third shearing on NNW -trending faults. The intensity of folding, faulting and transposition increases eastwards, from negligible in the west, to stronger in the east. Regional metamorphic grade increases eastwards, but granites are surrounded by a wide higher-grade aureole. 'S' -type granites occur in much of the area up to 100 km west from the Palmerville Fault System, their tops are near the basement surface in the west, and their bases near the basement surface in the east, so the batholith and basement has a regional west dip.
The Permo-Carboniferous was an important period of both sedimentation and igneous activity. Thick Permian sediments and minor igneous rocks occur in a 10 km deep, 50 km by 200 km trough associated with the Palmerville Fault and Yintjingga Fault Zone. A narrow trough of thick sediments may be associated with the Gamboola Fault. Permo-Carboniferous igneous rocks occur scattered over much of the four sheet areas; they are the dominant rocks only in the area of the Townsville-Mornington Island Igneous Belt. The igneous rocks in this belt are largely thin volcanics over pre-Carboniferous basement, and large, deep subsidence structures of volcanic and intrusive rocks.
, I
© Australian Geological Survey OrganisatiCln 1995 4
i I
INTRODUCTION
This record provides an interpretation of the magnetic and gravity data of four 1 :250 000 sheet areas in Cape York Peninsula in terms of the geology of outcropping and sub-cropping preJurassic rocks. The interpretation presented here is based on the magnetic and gravity anomalies in the four sheet areas, interpretation of these anomalies in the north Queensland region as a whole (Wellman, 1992a), on the mapped geology of the basement inliers in the four sheets and surrounding sheets, on the small amount of information from drilling through the cover rocks, and on seismic surveys in one small area. The geophysical interpretation and ideas expressed in this record have been jointly developed during discussions with other members of the Australian Geological Survey organisation (AGSO)-Geological Survey of Queensland (GSQ) North Queensland Project team; ideas have originated from the field mapping program, from subsequent laboratory studies on collected rocks, and from the geophysical interpretation. This work is a contribution to the National Geoscience mapping Accord projects. Previous interpretations of the geophysics of the area in include Shirley & Zadoroznyj (1974), Shirley (1979), and Wellman (1992a, b).
A key to the names of 1 :250 000 and 1: 100 000 sheet areas of the area studied, and the surrounding area is given in Figure 1. In the following text the nkmes of 1 :250 000 sheet areas are given in capitals ( ego EBAGOOLA for the Ebagoola 1 :250000 sheet area). The rock-body names and symbols used in this report are those of the 1:250000 preliminary geological maps of 1994.
MAGNETIC AND GRAVITY DATA, AND ITS INTERPRETATION
Data
The distribution of the aeromagnetic coverage is shown in Figure 2. Aeromagnetic surveys of EBAGOOLA consist of a 1973 AGSO survey with 1.5 km spacing over land and 6 km over water, a 1990 Broken Hill Proprietary Minerals (BHP Minerals) survey of part of the outcrop area at 300 m flight-line spacing (Sheppard 1991), and a 1990 AGSO survey at 400 m flight-line spacing over land. Aeromagnetic surveys in HANN RIVER consist of a 1974 AGSO survey at 3 km flight-line spacing, a BHP Minerals survey of part of the outcrop area at 300 m flight-line spacing (Sheppard, 1991), and a 1991 AGSO survey at 400 m flight-line spacing. Aeromagnetic surveys of WALSH consist ofa 1969 AGSO survey with 1.6 km flight line spacing at the high altitude of 250 m above ground level, and a 400 m flight-line spacing surveys of the eastern half of the sheet by AGSO in 1991 and GSQ in 1992-1993. Aeroma~netic surveys of RED RIVER consist of a partial survey of the western half in 1962 by Mid Eastern Oil NL CKarumba Basin Survey), a 1982 survey by AGSO at 1.5 km flight-line spacing, 1987 surveys by CRAB (Red River Survey) and PNC (Maureen Survey) in part of the sheet at 200 m flight line spacing, and a 1992-1993 survey by GSQ of the eastern two thirds of the sheet area at 400 m flight line spacmg.
Interpretations in this report are primarily based on the 400 m flight-line spacing surveys by AGSO and GSQ, the 200 m flight-line spacing Red River Survey by CRAB, and for the remaining area in WALSH and RED RIVER on 1.5 to 6 km flight line spacing AGSO surveys. Most of the interpretation is based on images of the short-wavelength component (given by the east gradient, or easterly illumination) of the total magnetic intensity (TMI), and the longwavelength component given by the anomaly reduced-to-the-pole (Fig. 3).
© Australian Geological Survey Organisation 1995 5
In the area covered by this study there are many magnetic anomalies having the form of a large negative and a smaller positive, that are caused by rocks with a strong normal remanent magnetisation (NRM). These rocks comprise two main groups: some rocks of the Staaten Metamorphic Group, and the Permo-Carboniferous igneous rocks. The directiQn ofNRM magnetisation in the Staaten Metamorphic Group is poorly known, but is approximately opposite the present Earth's field. The subsidence structures of Permo-Carboniferous age generally have small highs to the south and east, so the NRM is close to reversed, but has a significant east component. In an attempt to better define the margins of the bodies, images were prepared of the analytic signal of the total magnetic intensity (Roest et aI., 1992), which should give highs over the changes in magnetisation. However, the image did not map the many weaker boundaries within the Staaten Metamorphic Group, and it did not separate the short and longer wavelength anomalies within the subsidence structures, so the image is of limited use. It was not used in preparing maps.
The gravity anomaly coverage of the area is mainly based on a 1966 AGSO helicopter survey on an approximately 11 km grid (Shirley & Zadoroznyj, 1974). Interpretation is based on Bouguer anomalies (Fig. 4), and the residual anomaly when a 24-minute-of-arc wavelength regional is removed from the Bouguer anomaly.
Interpretation of magnetic and gravity data
The relations between known geology and geophysical anomalies in areas of outcrop have been used to infer subcropping geology in areas of cover. In the area bfbasement outcrop the main correlations between geophysical anomalies and geology are as follows. In the outcrop areas of EBAGOOLA , HANN RIVER, and WALSH the granites correlate with gravity lows, and metamorphic rocks with gravity highs. High grade metamorphic rocks (amphibolite and granulite facies) correlate with areas of high magnetisation, and granites and the lower grade metamorphic rocks (greenschist facies) with areas ofIow magnetisation. In the RED RIVER outcrop area the Permo-Carboniferous igneous subsidence structures correlate with deep gravity lows, other rocks correspond with relative gravity highs. Granites of Proterozoic, Siluro-Devonian and Permo-Carboniferous age, and Proterozoic metamorphics have generally low, uniform magnetisation, and Permo-Carboniferous volcanic rocks have generally high, irregular magnetisation. In EBAGOOLA and HANN RIVER thick Permian sediments and volcanics underlying the Laura Basin (shown by drilling and seismic reflection surveys) correlate with a regional gravity and magnetic low, with local gravity and magnetic highs.
For most of the study area, but excluding the region of Permo-Carboniferous igneous rocks, the following characteristics and relationships are inferred: in these comparisons the densities and magnetisations are relative to the surrounding region of about 50 km diameter. Metamorphic rocks are relatively dense, their magnetisation has a high variability, with average values generally increasing with metamorphic grade; bedding/lithological layering is generally mappable in greenschist and lower amphibolite facies rocks, whereas a fradture pattern is generally prominent in the higher grade rocks. Granites has a low density, magnetisation is uniform and generally low, and dyke swarms are commonly prominent in the magnetic anomalies. Sediments (sub greenschist facies) have a similar character to granites, a relatively low density, and a magnetisation that is uniform and low.
Within the southern part of the areas where Permo-Carboniferous rocks predominate, the Permo-Carboniferous igneous subsidence structures have a very low density, and a characteristic oval pattern in magnetic anomalies. Rocks within these subsidence structures are
© Australian Geological Survey Organisation 1995 6
likely to be all Permo-Carboniferous igneous rocks. High variable magnetisation is likely to be due to volcanic rocks, while low uniform magnetisation's could be due to granites or to flat lying volcanics. The rock types between these subsidence structures cannot be identified with confidence, because in the area of outcrop the correlation between magnetic anomaly and rock type is not consistent. Areas of high and variable magnetisation are likely to be mainly PermoCarboniferous volcanics. Areas oflow, uniform magnetisation are likely to be mainly metamorphic rocks and granites of Proterozoic, Siluro-Devonian and Permo-Carboniferous age. Small areas of high, uniform magnetisation are likely to be Perqlp-Carbonifero~s granites.
Separation of compositional layering, faultsifractures and dykes
The criteria used to separate anomalies due to layering, faults and dykes is listed below.
Layering Faults/fractures Dykes Waveform complex simple simple Apparent body width narrow to wide wide narrow Continuity continuous/ continuous continuous
segmented Magnetisation normal or reverse often zero normal or reverse Adjacent anomalies sub-parallel sub-parallel! or sub-parallel
orthogonal disimilar similar similar
Compositional layering in low grade (slate/phyllite) rocks is recognisable because the anomalies have continuity, different widths and amplitudes, and outline folds with mirror image structure across the fold. In rocks of higher metamorphic grade the anomalies due to lay~ring are segmented, sub-parallel, unequal in magnitude and separation, and generally due to high positive or negative magnetisation. Major faults are generally mapped at abrupt, nearly-linear changes in magnetisation, magnetic texture, and structure. Along some faults there is an associated magnetic anomaly; generally the anomaly is a broad low due to demagnetisation, rarely there are elongate anomalies due to in-faulted slithers of rock, or due to dykes along the fault. Fractures/lineations are poorly-defined, linear features of low magnetisation that do not displace bedding/lithological layering; they generally form a sub-parallel arrays, or two sets of subparallel arrays nearly mutually orthogonal. They can generally only be mapped in areas of high magnetisation. Anomalies attributed to dykes, are straight, of consistent magnitude and shape throughout their length, and with a top at the surface of the basement. Dykes generally occur in swarms that are sub-parallel, with sub-equal spacing, thickness, magnitude of magnetisation, and direction of magnetisation.
Interpretation of boundaries between major rock bodies
The primary information used for most of the interpretation was of three kinds: 1) Shortwavelength magnetic anomaly, in the form of a grey-scale image of the east gradient, giving magnetic texture and strike. 2) Long-wavelength magnetic anomaly, in the form of an intensitycoloured image of the reduction-to-the-pole of the TMI, giving a measure of relative average magnetisation. 3) Simple Bouguer anomalies, in the form of contours, giving a measure of relative density.
© Australian Geological Survey Organisation 1995 7
Interpreted rock-unit boundaries were located where there was both a change in magnetic texture, and a change in average magnetisation. Generally, the actual or observed position of the boundary was more accurately indicated by the boundary derived from a change in magnetic texture, than that derived from a change in average magnetisation.
The dip of rock-unit contacts can be determined from reduction-to-the-pole magnetic anomalies, and from gravity anomalies. The dip is likely to be vertical where reduction-to-thepole magnetic anomalies that are the same at the body margins as at the centres. Dip is towards the higher magnetisation material where the reduction-to-the-pole anomalies become more extreme towards the margins of the body. Dip is towards the lower magnetisation material at boundaries where reduction-to-the-pole anomalies become less extreme towards the margin of the body. The dip of the boundary between bodies of different density is given ~y the offset between the boundary at the basement surface (given by the mapped geology or shortwavelength magnetic anomalies) and the inflection of the gravity anomalies, where the inflection point is at the change in anomaly surface from concave to convex.
PROTEROZOIC METAMORPHIC ROCKS
Metamorphic rocks have a high density, a medium to high magnetisation at long-wavelength, and variable magnetisation at short wavelength. Short wavelength magnetic anomalies correlate with bedding in areas of greenschist facies metamorphism, and correlate with both compositional layering and crosscutting structures at higher metamorphic grade. Figure 5 shows the subdivision of the metamorphic rocks, and Figure 6 shows the inferred metamorphic texture.
Eu2
Along the western margin ofEBAGOOLA, HANN RIVER and WALSH is a north-striking, elongate area of medium, variable magnetisation and high density, about 15 km wide and extending 270 km (Fig. 5). The main rock of these areas is thought to be metamorphics of Proterozoic age (Bu2), on the basis of the relatively high density, and medium, variable magnetisation. The dominant strike in Bu2 is northerly, given by1the margins o£the areas ofB u2, and its internal features.
Within Bu2 the most prominent features are north-striking bands of lower magnetisation, 6-15 km long. The elongate features have been mapped as bands of metamorphic rocks with lower magnetisation in HANN RIVER and WALSH (Bu2a), and as overlying volcanics in EBAGOOLA (C-Pvl).
Adjacent to Bu2, in HANN RIVER and WALSH, are areas (Bu2b) with a magnetisation about one halfBu2, and a high density similar to Bu2. These areas are interpreted to be metamorphic rocks that are a continuation ofBu2, but of a lower magnetisation.
Associated with Bu2 and Bu2b are areas of low magnetisation and low density that are thought to be granites (B-Dgr).
Eul
In EBAGOOLA and HANN RIVER there is a band of rocks with low magnetisation, and high density, between Bu2 and the Edward River Metamorphic Group (Fig. 5). The band has a width of 8-16 km, and a length of at least 110 km. Along the approxiniate centre of the band is a
© Australian Geological Survey Organisation 1995 8
, I
magnetic high (Eula), which is subparallel to the margins, and to structures in the western part of the Edward River Group. Eul is thought to be mostly metamorphosed sedimentary rocks on the basis of its relatively high density, and to unconformably overlie Eu2 and to be conformably overlain by the Edward River Metamorphic Group, on the basis of the parallelism ofEul boundaries. It is possible, but considered less likely, that Eula is the axis ofa fold, and that Eul is faulted against Eu2 along its western margin.
Edward River Metamorphic Group, Eel, Ee2, Ee3
Rocks of the Edward River Metamorphic Group (Blewett et al., 1992) form a band of relatively high magnetisation and high density, 13-19 km wide and at least 170 km long, in EBAGOOLA and HANN RIVER (Fig. 5). The rocks have been subdivided into three primary units: upper and basal units of medium magnetisation (Eel & Ee3), and a middle unit of high magnetisation (Ee2). Within Eel are two bands of higher magnetisation (Eela).
The group crops out in small areas of the Coen Inlier in both EaAGOOLA andlHANN RIVER; it includes quartzite, schist, phyllite, meta-basalt, and interbedded meta- mudstone, siltstone, sandstone and conglomerate (Blewett et aI., 1992; 1 994b ).
In the northern half ofHANN RIVER the magnetic anomalies are consistent with Eel, Eela and Ee2 forming a fold, 10 km wide, with a nearly horizontal axis. Magnetic features are symmetrical across the fold axis, and one features forms a fold closure across the fold axis. Magnetisation is fairly consistent along strike, and there is very little disruption due to faulting. One area of complexity is interpreted as due to a small, subcropping granite. The simple folding, and the different magnetisation of the units, is consistent with low deformation and low heating, with the rocks being slates and phyllites. Outcrop geology shows that the eastern limb dips west, so the fold is probably an upright syncline that plunges gently south. Units of this fold structure have been mapped to the north and south, mainly using the higher magnetisation ofE e2.
In the southern half of HANN RIVER magnetisation of the metamorphics is more irregular along strike, there are cross cutting fractures, and subcropping granites within the metamorphics are more numerous and larger. The presence of these subcropping granites together with the gravity data show that the Cape York Peninsula Batholith probably underlies the western two thirds of the Edward River Metamorphic Group and that it is relatively thick in this area. This proximity to the batholith is consistent with the apparently higher metamorphic grade of Edward River Metamorphic Group in the southern half ofHANN RIVER.
In the southern half ofEBAGOOLA the Edward River Metamorphic Group units are displaced by faults, and the magnetisation of the units is fairly even along strike in the east, and uneven in the west and north. This is weak evidence for higher metamorphic texture in the west and north.
Along strike of the Edward River Metamorphic Group, in the northern half ofEBAGOOLA, gravity anomalies are low, and magnetic anomalies have a medium average-amplitude, and are fairly flat. They have elongate, gently-arcuate, short-wavelength magnetic anomalies attributed to faulting. Subcropping rocks are likely to be metamorphic rock (Eul, Edward River Metamorphic Group, Holroyd Group) underlain by a shallow, granite, or, more unlikely, a subcropping magnetic granite.
© Australian Geological Survey Organisation 1995
, I
9
From the TMI images the metamorphic texture is inferred to be ~late/phyllite in northern HANN RIVER, schist in southern EBAGOOLA and southern HANN RIVER, and po~sibly schist/gneiss in northern EBAGOOLA (Fig. 6).
Holroyd Group
Holroyd Group (Blewett et a1., 1992) metamorphic rocks crop out in EBAGOOLA and HANN RIVER. Their density is relatively high.
In the area of slate/phyllite, situated in the west, the average magnetisation is relatively low. Formations generally have different magnetisations, and these magnetisations are relatively constant. These differences in magnetisations may be due to pre-metamorphic NRM or susceptibility, or be due to later creation of magnetite, the amount of which was dependant on rock type/composition. In the north there are gently-arcuate, positive anomalies, up to 30 km long, and with similar profiles along their length. They are thought to be due to magnetic material in the plane of strike-slip faults
In the areas of schist and gneiss, situated in the east, the magnetisation is generally uniformly high. This areas is composed of the same formations as in the area ofless deformation to the west (Blewett et aL, 1992). The higher, near-uniform magnetis~~ion must be du1e to the minerals formed when the rocks recrystaIIised due to the greater deformation, and/or the regional metamorphism. Narrow bands of low magnetisation are interpreted to be due to demagnetisation along fault lines. In the southwestern part of the Holroyd Group most of the area has high magnetisation, but there are bands, generally adjacent to granites, where the apparent magnetisation is near zero.
Within the Holroyd and Coen Groups, in EBAGOOLA and HANN RIVER, there are the following differences in magnetisation. In the area of slate/phyllite, the bedding appears little faulted, fold closures are seen, features are crisp, and magnetisation is low. In the area of schist, the dominant feature is faulting, beddingllithologicallayering can be recognised, there are few fold closures, features are less crisp, fractures are more prominent, and magnetisation is high. In areas of gneiss some compositional layering can still be recognised in places, faults are important, fractures are stronger, and magnetisation is medium-high.
eoen Metamorphic Group
(Blewett et al., 1992). Magnetisation is medium, and density is high. Magnetic anomalies have a strong NW trend. There appears to be no systematic difference in magnetisation between schist and gneiss units, but the larger anomalies appear to be associat~d with the bOUlldaries between these units. The central area of gneiss is associated with a short-wavelength (0.5 km), elongate, sinuous, small-amplitude (4 nT) magnetic anomaly, which is interpreted as a wide shear zone. Elsewhere there are correlatable long-wavelength magnetic high anomalies, and spectrometric expressions of quartzite, that are consistent with lithology being semicontinuous for distances of 7-15 km. Elongate semi-continuous, magnetic lows are interpreted as faults.
Newberry Metamorphic Group
(Blewett et a1., 1992). Magnetisation is medium, and density is high. Compositional layering is recognised in EBAGOOLA and northernmost HANN RIVER. It is indicated by an approximately north-striking grain given by compositional layering features of higher than
© Australian Geological Survey Organisation 1995 10
average magnetisation. These features extend 10-30 km, are broken along their length to segments 3-5 km long by minor offsets and short gaps oflower magnetisation, and are subparallel to adjacent bedding features. This compositional layering is cut by N- and NNWtrending faults and NE- and NW -trending fractures. Magnetic anomalies have an irregular appearance. In the southern part ofEBAGOOLA the dominant ragnetic features are normally magnetised, arcuate, 6-10 km in length, 40-100 nT in amplitude, with an easterly strike; they are thought to be fault controlled structures.
There appears to be a decrease in recognisable compositional layering to the south, interpreted to be due to a decrease in the difference in magnetisation of adjacent beds, and to an increase in faulting; compositional layering is fairly continuous in the northern third ofEBAGOOLA, is more disrupted by faulting in the middle third ofEBAGOOLA, and rare with abundant faults in the southern third of the sheet and northernmost HANN RIVER. Further south in HANN RIVER (Kimba Gneiss) there is no compositional layering apparent in magnetics.
Eu3, Eu4 and Eu5
Abutting the northern end of the Newberry Metamorphic Group in EBAGOOLA there are areas of rocks with different trends and different magnetisation. Rocks of these areas either do not crop out, or crop out poorly. NW-trending Bu3 and Bu4, are bands of high and low magnetisation that may be part of a shear zone. Bu5 has low average magnetisation, and small amplitude short-wavelength anomalies. Its magnetic anomaly pattern is consistent with subparallel compositional layering, with a strike ranging regionally from NW in the south to NNW in the north. The western part ofBu5 has a 7 km diameter dish~~haped anomal~, 75 nT in amplitude, that is interpreted as resulting from an intrusion below the basement surface. Along the eastern margin ofBu5 is a linear, narrow, north-striking, magnetic high, this is interpreted here as most likely to be high magnetisation associated with a shear zone.
Yambo Metamorphic Group
(Blewett et aI, 1994b). Rocks have a high density, and generally an average to high magnetisation. Formation boundaries and compositional layering are NE-trending in most of the area. They are NW-trending for the small area of Jeddah Schist (Byj 1, Byj2), north trending within 10 km of the PalmerviIIe Fault, and NW-trending within 30 km of the Gamboola Fault. Prominent, straight magnetic lineations with a NW trend are mapped at different locations in the field to be faults, and dykes.
In the northwestern part of the Yambo Inlier, mainly within the Jedda Creek sheet area, the photo and field interpretation is that the dominant trend is NE in Bya, Bys2, Bys, Bys5, and is NW in Byj 1, Byj2 and Bys. The total magnetic intensity image interpretation is that the main lithology trends NE within this whole area, and that the NW features are faults, fractures and dykes.
,I I In the southern part of the Yambo Inlier, the field observations give NW trends in lithological layering, a formation boundary, and numerous dykes, and some NE trending lithological layering. These features are reflected in the magnetic anomalies. A major feature of the magnetic anomalies is that within 30 km of Gamboola Fault, mainly under cover, the metamorphic rocks have a relatively uniformly and weak magnetisation, and have numerous normally-magnetised, NW-trending linears interpreted as dykes. The rocks of this 30 km wide band are thought to originally have been similar to those forming the Yambo Inlier to the NE, but to have been
© Australian Geological Survey Organisation 1995 11
subsequently modified by heating and deformation associated with the Gamboola Fault.
Less than 30 km from the Palmerville Fault, in the eastern part of the Yambo Inlier, magnetic trends are generally northerly. Airphotograph, field and magnetic observations give lithological layering and rock type boundaries that in the east have north trends parallel to the adjacent Palmerville Fault, and in the west have NNW and NE trends that are parallel to the adjacent granite margins, and parallel to the NE-trend of the rocks to the west. Weak magnetic and radiometric anomalies are consistent with the mapped folds. Rocks up to 30 km north ofthe exposed metamorphic rocks have similar north-trends and high pagnetisation; these rocks are thought to be continuous with those of the eastern part of the Yambo Inlier. I
The boundary between the Yambo and Newberry Metamorphic Groups is taken to be the boundary between rocks of high, uniform magnetisation (Y ambo )( Eyu), and rocks of average but variable magnetisation (Newberry)( Ewb).
The dominant structures are thought to be oldest in the northwestern part of the Yambo Inlier, where there are NE-trends, different lithologies give different magnetisation both at the lithological layering scale and the named unit scale, and outcrop level is near the top of the granites. Elsewhere the rocks reflect later deformation and heating events; because trends are subparallel to adjacent major faults, and magnetisation is more uniform.
Staaten Metamorphic Group
(Bain et aI, 1994)(Figs 5 & 7). Crossing WALSH, and extending into HANN RIVER and RED RIVER is a 170 km long, 70 km wide, area of prominent, subparallel, elongate magnetic anomalies. Anomalies have wavelengths of3-4 km, and amplitudes averaging about 100 nT. Anomalies are prominent lows with minor highs, in an area oflow regional magnetic intensity, and consequently appear to be due to reverse remanent magneti~ation.
The anomalies form patterns symmetrically repeated about their long axes, suggestive of folding, rather than faulting. The Staaten Metamorphic Group is here subdivided into three subgroups (Etl, Et2 and Et3), with Etl and Et3 having low average magnetisation, and Et2 having reversed magnetisation (Fig. 7 legend). The flanks of the magnetic anomalies reduced to the pole, or with north-strike, do not have equal slopes; the direction of dip ofEt2 is mapped as the direction with the most gentle slope. Using these dips anticlines and synclines can be inferred, and Etl interpreted as the top of the sequence. The magnitude of the dips, estimated by comparing anomaly profiles with theoretical profiles, is roughly 50-80°. Using minor magnetic features, often intermittent along strike, these three subgroups can be further subdivided. In the main area of the Staaten Metamorphic Group nine "units" can be recognised: ranging from Et1a to Et3c (Fig. 7 legend).
A major NNE trending fault displaces the Staaten Metamorphic Group near its southern margin (Fig. 7). Rocks have been correlated across this fault, by correlating the broad negative east of the fault with Et2, and by taking the almost collinear fold axes in the south as the same syncline. Two additional "units" Et3d and Et3e occur in this area. Additional confidence in the correlations is given by the relative thicknesses of adjacent "units": Et2a and Et3 a are abnormally thick. At its SE margin the Staaten Group appears t,q be truncated 9Y NE-trending faults.
The thickness of the Staaten Metamorphic Group can be roughly determined from the
© Australian Geological Survey Organisation 1995 12
horizontal distance between subcropping formation boundaries. The horizontal distance from the top of Btl to the base ofBt2 is about 9 km, and the horizontal distance from the top to the base ofBt3 about 6 km. If the average dip is about 60°, then the thickness of rocks in the Staaten Metamorphic Group is 15 km x 0.86 = 13 km.
Structures of the Staaten Metamorphic Group become progressively more poorly defined to the ENE, and also within 15-20 km of the Gamboola Fault. In the SW the magnetic anomalies form bands of high and low anomaly, the bands having sub-parallel margins and near constant magnetisation differences. To the north and east there are no bands, only strings of oval magnetic lows, with a lower magnetisation contrast. In the far NE most of the area has constant magnetisation, and the oval areas oflow magnetisation are so separated they cannot be grouped into strings. Using the analogy of the Holroyd Group to the north in EBAGOOLA and HANN RIVER, this regional variation of the magnetisation of the Staaten Group is interpreted to be due to metamorphic texture increasing from slate/phyllite in the ~outh and SW, to schist in the north and NE. Rocks in the ENE labelled Bt are thought to be relatively more deformed and metamorphosed Staaten Metamorphic Group, based on this area being continuous with the area of Staaten Metamorphic Group rocks, its similar average magnetisation, the occurrence of characteristic magnetic lows, and its relatively high density. The magnetic characteristics of the rocks within 15-20 km of the Gamboola Fault may have been modified by the effects of metamorphism, deformation, or fluids.
The Staaten Metamorphic Group is thought to be of similar age to the Holroyd Group and Edward River Metamorphic Group because its similar deformation.
Within the area of Staaten Metamorphic Group subcrop, and on its western margin, are irregular shaped and oriented areas, commonly 10-20 km in diameter, with low density, and high and uniform magnetisation. These are interpreted to be granites (SDgz).
Etheridge Group
In GEORGETOWN, to the south of RED RIVER, Etheridge Group sediments and volcanics form basement (Bain et aI, 1985). They are older than a metamorPhism at 1550 Ma (Black & Withnall, 1993). These rocks are in general oflow magnetisation. John Bain (p~rs comm) recognised that in the Proterozoic outcrop area of GEORGETOWN magnetic anomalies largely occur in three rock types: 1) Etheridge Group rocks adjacent to the western margin of the Proterozoic Forsayth Batholith. 2) Stockyard Creek Mudstone Member, a 'dark grey to black pyritic, carbonaceous mudstone' (Bain et aI., 1985), near the top of the Etheridge Group, and to a lesser extent to some of the overlying formations which are also pyritic and carbonaceous. And, 3) irregular short-wavelength magnetic lows due to metadolerite. The Etheridge Groups rocks adjacent to the western margin of the Forsayth Batholith gives several parallel magnetic lows, due to sources with significant width, with the highest amplitude anomaly adjacent to the magnetically-quiet granite. Additional support for this mapping of the Forsayth Batholith/Etheridge Group contact is given by the gravity low and flat magnetics over the Forsayth Batholith. Magnetic anomalies associated with the Stockyard Creek Mudstone Member and higher horizons are of shorter wavelength; the highest amplitudes are over the Stockyard Creek Mudstone Member, anomalies appear to be due to thin, steeply-dipping sources, some with positive and some with negative magnetisation. These Forsayth Batholith and Stockyard Creek anomalies can be correlated 100 km; for about 50 km across an area of outcrop in GEORGETOWN, and for a further 50 km NW across an area of cover, to about 8 km into RED RIVER (Figs. 5 & 8). The Etheridge Group has a regional west dip, and
© Australian Geological Survey Organisation 1995 13
, I
Stockyard Creek Mudstone Member is near the top of the Etheridge Group, so the upper part of the Etheridge Group extends just into the Strathmore 1: 100 000 sheet of RED RIVER. The Etheridge Group rocks outcropping and subcropping in much of the remainder RED RIVER are tentatively interpreted to be lower in the sequence than Stockyard Creek Mudstone Member. The outcrop and sub crop of the Stockyard Creek Mudstone Member is sinuous in the south and straighter in the north (Fig. 5), this is attributed to the WNW-trending folds mapped in the south being absent in the north.
Dargalong and McDevitt Metamorphics
East of RED RIVER, in Mungana 1: 1 00 000 sheet area (Bultitude, 1990), Dargalong Metamorphics crop out in much of the northern part of the sheet, and McDevitt Metamorphics of greenschist facies crop out in much of the southern part of the sheet. The Dargalong Metamorphics are amphibolite grade, more variable in rock type, and they are intruded by the 50 km long, 23 km wide, Early Silurian "Nundah Granodiorite". This intrusion forms a gravity anomaly low. The "Nundah Granodiorite", and Dargalong and McDevitt Metamorphics, have a fairly flat, low magnetisation. In the south, irregular short-wavelength highs over dolerite/amphibolite occur in an area of20 km diameter. Both tHese series ofmetamorphics are likely to be part of the Etheridge Group. Regional strikes are west and NW. Both these metamorphic units crop out along the eastern edge of RED RIVER, so both must outcrop/sub crop within RED RIVER. One area which is most likely to be McDevitt Metamorphics is area Pm2 in Walsh and Blackdown 1: 100 000 sheet areas (Fig. 5). Here, shortwavelength magnetic anomalies trend NW, approximately on strike with NW trending McDevitt Metamorphics in the adjacent Mungana sheet area, the magnetic anomaly is not irregular like adjacent areas of volcanics, and the gravity anomaly is high.
Metamorphics in RED RIVER
In the area of outcrop in southeastern RED RIVER it is difficult to separate metamorphics from granites using gravity or magnetic anomalies, because both metamorphics and granites form gravity highs, have low magnetisation, and in general no short-wavelength magnetic texture. The area of probable metamorphics and granites has been combined in the adjacent area of cover but similar geology.
GRANITES
Granites have low density, and magnetisation that is uniform arid generally 10w.'(Figs. 8 & 9).
Cape York Peninsula Batholith
In EBAGOOLA, HANN RIVER and WALSH there are extensive granites of Siluro-Devonian age (Black et al. 1992) that form the southern part of the Cape York Peninsula Batholith. The rocks have been subdivided into two supersuites (Mackenzie & Knutson, 1992): the 'S'-type Kintore Supersuite forming 80% of the outcrop is composed of leucogranite, granite and granodiorite, and the 'I' -type Flyspeck Supersuite forming 20% of the outcrop is composed of monzogranite and granodiorite.
Most granites have no detectable changes in magnetisation towards their margins, so contacts between plutons, and the internal structure of plutons cannot be seen in the magnetic data. The main magnetic anomaly features seen within the Batholith are leucogranites which produce
© Australian Geological Survey Organisation 1995
I I
14
irregular areas of positive anomaly, dykes either alone or in swarms, isolated areas of metamorphics, and shear zones. Many minor magnetic features have an unknown cause .
. I I
These granites have low, uniform magnetisation, and low density. Hence where the granite/metamorphic boundary is near vertical it coincides with an abrupt increase in reducedto-the-pole magnetic anomaly, a change from quiet to noisy short-wavelength magnetic anomalies, and a gradient between low to high gravity anomaly. The boundary given by the change from quiet to noisy short-wavelength magnetic anomalies is the least influenced by the dip of the boundary.
These granites are relatively wide, so the direction of dip of the boundary between granite and metamorphic rock can be estimated from both the gravity anomalies, and reduced-to-the-pole magnetic anomalies. Using gravity anomalies, the direction of dip is given by the offset between the boundary at the basement surface (given by geology or magnetics) and the inflection of the gravity anomaly; where the inflection point is the change in anomaly surface from convex to concave. Using reduction-to-the-pole magnetic anomalies: the contact is vertical where these anomalies have constant values towards the contact, the granite contact dips under the metamorphics where the anomalies are more extreme towards the contact, and the metamorphics dip under the granite where the anomalies become less extreme towards the contact. These two methods generally give consistent results in the mapped area: granite generally dips under the metamorphics along the western and southern margins of the batholith, dips are near vertical along much ofthe margins of the Coen and some ofNewlberry Metamorphic Groups, and the metamorphics dip under the granite along much of the eastern margin of the batholith.
The position of the generalised top and base of the batholith is shown in Figure 6. The metamorphic rocks at the upper and lower contacts of the granite have a different magnetic expression. Those near the generally arcuate upper surface of the batholith have somewhat disrupted bedding/compositional layering, lineaments are not dominant, magnetisation may be enhanced or reduced, and the short-wavelength anomalies are flatter than away from the granite. The lower surface of the granite is highly irregular, and adjacent metamorphics rarely show recognisable lithological layering (short displaced segments), has medium to high averagemagnetisation, and high-amplitude short-wavelength magnetic anomalies.
The present thickness of the granites (h) can be estimated from the density contrast between the granites and metamorphic rocks (dc), and the gravity anomaly change over the granite/metamorphic rock boundary (dg), using the formula for the gravitational attraction of a slab: dg = h . dc . 0.4186. It is estimated (D.E. Mackenzie, pers comm.) that the average density of the granites is 2.66 t.m-3
, and the metamorphics is 2.75 t.m-3. On the western boundary of the
Newberry Metamorphic Group the gravity anomaly change is 220-240 Jlm.s-2, so the calculated
granite thickness is 6 km. On the eastern boundary of the HolroYd Group the gravity anomaly change is 300-450 Jlm.s-2
, so the calculated granite thickness is 8-12 km. From these calculations and the distribution of gravity anomalies (Fig. 4), Cape York Peninsula Batholith granites commonly have a thickness of about 6 km, and have a maximum thickness of 8-12 km.
In the Coen Inlier region the dominant gravity feature is a gravity low, 50 km wide, 320 km long, about 450 Jlm.s-2 maximum value (Figs. 4 & 9). The low has a banana shape, with its southeastern end near the northern margin ofHANN RIVER, and its northern end near the west margin of CO EN. This is interpreted to give the present distribution of thickest part of the Cape
© Australian Geological Survey Organisation 1995 15
York Peninsula Batholith. Granites west of this low are generally found to be below the basement surface and thin. Granites east and NE of this low are generally exposed at their middle or lower levels. There are no similar gravity lows within 100 km of this low, so it seems unlikely that there are adjacent thick portions of the Cape York Peninsula batholith.
Figure 9 shows the distribution of the Siluro-Devonian part of the Cape York Peninsula Batholith. The distribution of the batholith in EBAGOOLA, HANN RIVER and WALSH is based on that derived for the new pre-Mesozoic basement maps (Blewett et al 1994a, b). The distribution of the batholith in COEN and CAPE WEYMOUTH within the Coen Inlier is based on Knutson et al. (1994), and west of the Coen Inlier is based on the distribution of gravity lows, the distribution offlat magnetic anomaly, and on the presence ofS-D granite in GSQ Weipa-l drill hole. The batholith is bounded by the Gamboola Fault in the south, and by the Palmerville Fault and the Yintjingga Fault Zone in the east. The batholith extends about 440 km north-south, and 100 km east-west, has a thickness commonly about 6 km, and with a regional WSW dip of about 12 km in 100 km, or 7°. '1' -type granites are concentrated near the centre of the batholith.
Possible Proterozoic granites (E-Dgr)
Along the western margin ofHANN RIVER and WALSH, and the NW of RED RIVER, there are areas with low density, low magnetisation, and little or no short-wavelength structure, that are interpreted as granite (E-Dgr in Fig. 8). These granites are most commonly in contact with the high-density, high-magnetisation basement with north trends, that is interpreted as metamorphic rocks, Eu2. Their boundaries as determined by either the boundary between high and low density, or between high and low magnetisation, are similar, so the mapped contacts are taken from the magnetic data because this has higher resolution. I The possible age of these granites ranges from Mesoproterozoic to Devonian; the preferred age is Proterozoic.
In southwestern RED RIVER, areas with similar low magnetisation, and little or no shortwavelength magnetic structure, may also be granite, but the density cannot be proved to be low.
Staaten granites, Sdgz
Within the area of Staaten Metamorphic Group and abutting it to the west, are areas of low density, and fairly-uniform, medium magnetisation, that are interpreted to be granites (Figs. 7 & 8). Gravity anomalies indicate two large areas oflow density about 15 km wide by 50 km long, and two small areas about 15 km diameter. The gravity anomaly difference to the adjacent Staaten Metamorphic Group rocks is generally 140-240 /-lm.s-2. Overlying much of the area of these gravity anomalies are seven smaller areas where either the magnetic anomaly is smooth with a medium value, or where the magnetisation of the metamorphic rock units has been enhanced. On the reduced-to-the-pole magnetic image the anomaly is lower in the northern part of each area compared with the southern part, probably because magnetisation is not in the direction of the present Earth's field. For many anomalies the structure of the adjacent Staaten Metamorphic Group sediments is continuous through the area of medium magnetisation, but with a lower amplitude. Within the area of Staaten Metamorphi6 Group the gravity anomalies have a greater extent than the magnetic anomalies, so the bodies causing the anomalies are wider at depth. The rock causing the gravity and magnetic anomalies is interpreted to be granite, with a top generally just above sub cropping basement. Abutting the western side of the Staaten Metamorphic Group is an area with low density, and medium uniform magnetisation. This is thought to be a related granite, but with the present basement surface further down the granite.
© Australian Geological Survey Organisation 1995 16
The age of all these granites could be between Mesoproterozoic and Devonian, but because of their location, level of exposure, and significant magnetisation, they are likely to be 'I' -type and Siluro-Devonian in age.
Granites in RED RIVER
(Figs 6 & 8). The mapping of granites in RED RIVER is more difficult than in the north, because both granites and metamorphics generally have low magnetisation, and a higher density than the volcanic subsidence structures.
In the NW of the sheet is an area of inferred granite (B-Dgr), having low densitlf, and low, uniform magnetisation. A small area in the SW is thought to be the western margin of the Mesoproterozoic Forsayth Batholith, because it is a gravity low, has low and uniform magnetisation, and it has a characteristic contact anomaly (Fig. 8) that can be traced from outcrops in GEORGETOWN, as detailed above under Etheridge Group.
The granites that crops out in the southeastern part of RED RIVER are thought by Champion and Heinemann (1994) to be Proterozoic Forsayth Batholith on the extreme western margin of outcrop, Siluro-Devonian granites mainly west of 143°30'E, and Permo-Carboniferous granites within or rarely adjacent to volcanic-subsidence structures, and on the southeastern border of the sheet.
The likely age and distribution of granites in the whole of RED RIVER can be determined from the distribution of granites in outcrops in RED RIVER, and in outcrops in the adjacent sheet areas to the south and east - CROYDON, GEORGETOWN, EINASLEIGH, and ATHERTON. Proterozoic granites are widely distributed in the inlier outcrop and constitute 20-30% of Proterozoic rock, so they are likely to form a similar proportion of Proterozoic rock in the whole of RED RIVER. In the area of outcrop, Siluro-Devonian granites are restricted to east of 143°30'E, (with the exception of Brandy Hot Granodiorite at 143°20'E). They are common, large, and constitute 50% of pre-Devonian outcrop. As the west1ern boundary dfthe Cape York Batholith is also approximately north-striking, it seems likely that the western boundary of the Siluro-Devonian granites across the whole of RED RIVER is about 143°30'E, and the granites form 50% of pre-Devonian basement east of this line. Permo-Carboniferous granites form about 50% of basement in ATHERTON and the northern half ofEINASLEIGH, while in the remaining area of basement outcrop they form a small part of basement and are mainly restricted to within subsidence structures. Magnetic images and outcrop data indicate that the depth of erosion increases eastwards, so volcanic rocks predominate west of 144°E, and intrusive rocks to the east of 144°E (Wellman et aI, 1994). In RED RIVER Permo-Carboniferous granites are thought to occur mainly within subsidence structures.
PERMO-CARBONIFEROUS IGNEOUS ACTIVITY
Volcanic-subsidence structures and associated volcanics
A prominent feature in EBAGOOLA, WALSH and RED RIVER are oval areas, 8-50 km in diameter, with a low density, and very deep magnetic lows around their margins (Fig. 10). Geological and geophysical mapping in the outcrop areas of GEORGETOWN, RED RIVER, and ATHERTON shows that these features are mainly Permo-Carboniferous volcanicsubsidence structures, and very rarely stocks. Adjacent to these ~olcanic-subsidence structures are areas of high magnetisation, either uniform or non-uniform in intensity. In areas of outcrop
© Australian Geological Survey Organisation 1995 17
these correlate both with volcanics that are associated with volcanic-subsidence structures but occur outside them, and with pre-Permo-Carboniferous rocks that have had their magnetisation enhanced by the adjacent igneous activity. The larger volcanic-subsidence structures correlate with well defined gravity lows, commonly 250 Ilm.s·2 lower than the country rock. The country rock has in some areas a high proportion of granite, so, as these volcanic-subsidence structures are of much lower average density than country rock, they must be deep structures containing more volcanics than granite.
The volcanic-subsidence structures give several magnetic anomaly patterns (Fig. 10). Anomalies which are high-amplitude at long-wavelength, and smooth, are thought to be thick and uniform bodies, such as equi-dimensional intrusions. Anomalies which are high-amplitude at shortwavelength are thought to be thin variable bodies, such as volcanics. Anomalies that are flat at long and short wavelength, are thought to be non-magnetic material, either granite or volcanics. Anomalies that are flat at long wavelength but are covered by a prominent fracture pattern, are thought to be flat lying lava that have been subsequently fractured.
Just inside the margins of many of the volcanic-subsidence structures are arcuate bands of OOlow/reverse magnetisation; in some areas there are several concentric bands. Rarely the magnetisation is strong and normal. These anomalies are thought to be due to reversemagnetised ring dykes, but there is a possibility that they are due to alteration of volcanics around the margin of the caldera.
The depth of post-Permian erosion is indicated by the rocks cropping out at the pre-Mesozoic surface. In RED RIVER, and southeastern WALSH the magnetics and outcrops are interpreted as indicating that, within the calderas there are more volcanics than intrusions, and outside the caldera are Permo-Carboniferous volcanics, some Permo-Carboniferous intrusives and preCarboniferous rocks. This is indicative that in this area post Permian erosion was to approximately the level of the pre-Carboniferous surface. In southwestern EBAGOOLA the volcanic-subsidence structures have volcanics to the south, again consistent with erosion to about the pre-Carboniferous surface level.
Dykes
Dykes either alone or in swarms, have been mapped using magnetic anomalies in most of the area where pre-Mesozoic rocks are shallower than 500-600 m below the land or water surface (Fig. 11). Where basement is deeper they are difficult to recognise on images of the magnetic data. They are most numerous and extensive in granites, but they also cut metamorphics, Permo-Carboniferous volcanics, and Permian and Mesozoic sediment. Dykes within areas of30-50 km diameter often comprise a swarm with similar strike, spacing, amplitude and polarity of magnetisation. The swarms differ in strike and polarity, so they are thought to be unrelated, and of somewhat different age. The dykes mapped by magnetics are strongly magnetised, so are thought to be un-metamorphosed. Most of the dykes cut Siluro-Devonian granites, so they must be younger than these granites; these dykes are most likely to be of Devonian or PermoCarboniferous age, as these are the most important periods oflater igneous activity. Dykes are mapped cutting Permo-Carboniferous igneous rocks in RED RIVER, cutting Permian sediments in Kalinga 1: 100 000 sheet area, and cutting Mesozoic sediments in western EBAGOOLA at 14°38'S 142°45'E. The composition of dykes mapped from magnetics is not in general known. They are thought to be mainly intermediate and mafic on the basis of their high magnetisation, their length, and their composition at the few outcrops.
© Australian Geological Survey Organisation 1995 .1
18
, I Plugs
Plugs are thought to be the cause of 1-2 km diameter, reverse-polarised magnetic anomalies in EBAGOOLA (C-Pj).
PERMIAN SEDIMENTS - LAKEFIELD BASIN
Basin Definition
The western part of the Laura Basin unconformably overlies a basin of gently-dipping sediments, at least in part of Permian age (Pinchin, 1974). This is here referred to as the Lakefield Basin.
Well data
Along the eastern margin ofEBAGOOLA, four oil exploration wells and one stratigraphic hole were drilled through the Laura Basin sediments and bottomed in indurated-sediments, volcanics and granite. These wells are listed below; their locations are shown in Figure 12.
Well Base of Laura Depth drilled below Laura Basin
,I I Lithology below Laura Basin
Ebagoola-l 1092m Marina-l 1153m
88m 10m
sandstone, siltstone, ignimbrite sediments and basalt
Breeza Plains-l 923m Broken Rope-l 794m Lakefield-l 921m
64m 112m 10m
sediments and volcanics sandstone, siltstone, shale granite
The rocks at the base of these wells are thought to be Permian, because of the presence of carbonised pollen of?Permian age in Ebagoola-l (APG Consultants, 1989), carbonised pollen of?mid Permian age in Broken Rope-l (APG Consultants, 1991), Glossopteris indica of Permian age in Marina-l (de Keyser & Lucus, 1968), by the lithological similarity of the basal unit ofEbagoola-l to the Normanby Formation (Hawkins & Williams, 1990), and by the similarity of the granite in Lakefield -1 to Carboniferous-Permian granites in north Queensland (Hardy, 1970).
The Ebagoola-l sediments are described by Hawkins and Williams (1990, p. 8) as 'slightly indurated, cream to light green sandstone, dark grey siltstone and minor conglomerate. The sandstones are often interbedded with similarly indurated, green Ituffaceous rock. The unit dips from 25 to 30 degrees, is fractured in part and contains minor sulfides and rare calcite veins.' The Broken Rope-l sediments are described by Willis (1991, p. 15) as 'interbedded sandstone, siltstone and shale. The sandstone and siltstone were indurated, often very cherty, with quartz grains overgrown and with no visual porosity. The shales were also indurated and extremely carbonaceous, yielding large gas peaks.'
Seismic data
Lakefield Basin rocks under the Laura Basin are imaged on some seismic reflection surveys (Burke et ai, 1963; Pinchin, 1974). Surveys in the Laura Basin area are as follows:
© Australian Geological Survey Organisation 1995 19
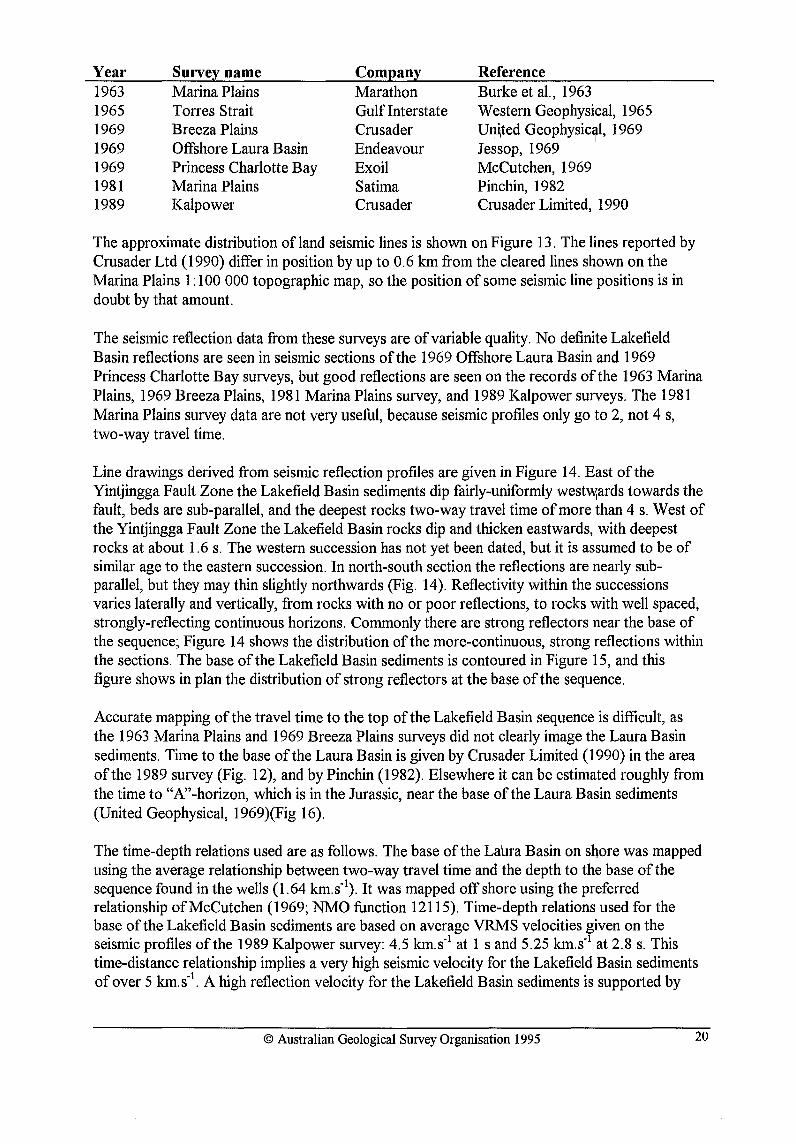
Year Survey name Company Reference 1963 Marina Plains Marathon Burke et al., 1963 1965 Torres Strait Gulf Interstate Western Geophysical, 1965 1969 Breeza Plains Crusader U~ted Geophysic~l, 1969 1969 Offshore Laura Basin Endeavour Jessop, 1969 1969 Princess Charlotte Bay Exoil McCutchen, 1969 1981 Marina Plains Satima Pinchin, 1982 1989 Kalpower Crusader Crusader Limited, 1990
The approximate distribution of land seismic lines is shown on Figure 13. The lines reported by Crusader Ltd (1990) differ in position by up to 0.6 km from the cleared lines shown on the Marina Plains 1: 100 000 topographic map, so the position of some seismic line positions is in doubt by that amount.
The seismic reflection data from these surveys are of variable quality. No definite Lakefield Basin reflections are seen in seismic sections of the 1969 Offshore Laura Basin and 1969 Princess Charlotte Bay surveys, but good reflections are seen on the records of the 1963 Marina Plains, 1969 Breeza Plains, 1981 Marina Plains survey, and 1989 Kalpower surveys. The 1981 Marina Plains survey data are not very useful, because seismic profiles only go to 2, not 4 s, two-way travel time.
Line drawings derived from seismic reflection profiles are given in Figure 14. East of the Yintjingga Fault Zone the Lakefield Basin sediments dip fairlY-l,lUiformly west\\jards towards the fault, beds are sub-parallel, and the deepest rocks two-way travel time of more than 4 s. West of the Yintjingga Fault Zone the Lakefield Basin rocks dip and thicken eastwards, with deepest rocks at about 1.6 s. The western succession has not yet been dated, but it is assumed to be of similar age to the eastern succession. In north-south section the reflections are nearly subparallel, but they may thin slightly northwards (Fig. 14). Reflectivity within the successions varies laterally and vertically, from rocks with no or poor reflections, to rocks with well spaced, strongly-reflecting continuous horizons. Commonly there are strong reflectors near the base of the sequence; Figure 14 shows the distribution ofthe more-continuous, strong reflections within the sections. The base of the Lakefield Basin sediments is contoured in Figure 15, and this figure shows in plan the distribution of strong reflectors at the base of the sequence.
Accurate mapping of the travel time to the top of the Lakefield Basin sequence is difficult, as the 1963 Marina Plains and 1969 Breeza Plains surveys did not clearly image the Laura Basin sediments. Time to the base of the Laura Basin is given by Crusader Limited (1990) in the area of the 1989 survey (Fig. 12), and by Pinchin (1982). Elsewhere it can be estimated roughly from the time to "A"-horizon, which is in the Jurassic, near the base of the Laura Basin sediments (United Geophysical, 1969)(Fig 16).
The time-depth relations used are as follows. The base of the Laura Basin on shore was mapped using the average relationship between two-way travel time and the depth to the base of the sequence found in the wells (1.64 km.s·l). It was mapped offshore using the preferred relationship of McCutchen (1969; NMO function 12115). Time-depth relations used for the base of the Lakefield Basin sediments are based on average VRMS velocities given on the seismic profiles of the 1989 Kalpower survey: 4.5 km.S·1 at 1 sand 5.25 km.s· l at 2.8 s. This time-distance relationship implies a very high seismic velocity for the Lakefield Basin sediments of over 5 km.s·l. A high reflection velocity for the Lakefield Basin sediments is supported by
© Australian Geological Survey Organisation 1995 20
seismic refraction velocities of the top of the sub-Laura sediments of 5.4 km.s· l east of the fault, and 4.2 km.s· l west of the fault; these velocities were calculated from observations reported by Bourke et al (1963) and are given in detail in Appendix 1. This high velocity for the Lakefield Basin sediments is thought to be due to the sediments being highly indurated with little porosity, and due to the presence of volcanics within the sediments. Depths in kilometres of the base of the Lakefield Basin and the base of Laura Basin are given in Figure 17. The thickness of preserved sediments is about 10 km, but the strong induration of the upper sediments indicates that the sediments were originally much thicker.
, I
Some of the strong reflectors within the Lakefield Basin may be coal seams, because significant carbonaceous matter is commonly reported in the Lakefield Basin well samples, and in adjacent outcrops of Permian age (Little River Coal Measures and Normanby Formation, de Keyser & Lucus, 1968)( Fig. 17). This coal could be an important source of hydrocarbons (pinchin, 1982).
Extent of Lakefield Basin
Within the area that is inferred to be subcropping Lakefield Basin, the reduced-to-pole magnetic anomalies have two shapes. 1) Oval magnetic anomalies of7-30 km maximum diameter with either normal or reverse magnetisation occur in most of the area. Some of the larger of these anomalies correlate with local gravity highs of 50-200 l..Im.s·2 amplitude. 2) Very elongate magnetic highs with a roughly north strike occur close to the trace of the Cainozoic Yintjingga Fault Zone. The magnetic anomalies of both these shapes are thought to be due to a concentration of volcanic and intrusive material in the Lakefield Basin sediments; igneous material near the fault forming linear north-striking bodies close to fault planes, and material away from the fault forming oval areas. In general these magnetic anomalies occur within or east of the Yintjingga Fault Zone; however five small anomalie~ pf similar char~cter occur 1-8 km west of the fault zone in EBAGOOLA are inferred to be due to related igneous material. The occurrence of these anomalies supports the view that the sediments west of the fault zone are of similar age to sediments east of the fault zone.
The western boundary of the Lakefield Basin has been mapped using the inflection in the gravity anomalies, the position of the change in character in the magnetic anomalies, and most importantly from an abrupt eastward reduction in apparent susceptibility indicated in the reduction-to-pole magnetic anomalies.
The regional extent of Lakefield Basin sediments (Fig. 17) is indicated by 1) the location of the five oil/stratigraphic wells, 2) the seismic reflection data and its extrapolation to zero thickness, 3) the area covered by the characteristic magnetic anomalies, and 4) the area of thickest Lakefield Basin as indicated by a relative gravity low. These data taken together indicate that the subcropping Lakefield Basin extends in an area about 70 km east-west and at least 200 km north-south, with no control further north. Outcropping similar age sediments in the wider region comprise Normanby Formation and Little River Coal Measures in COOKTOWN (de Keyser & Lucus, 1968)(Fig. 17), and Mount Mulligan Coal Measures in MOSSMAN (de Keyser & Lucus, 1968).
, I
Position of the eastern margin of the Lakefield Basin
Mulgrave and Chillagoe Formations (Ordovician to Devonian age) crop out immediately east of
© Australian Geological Survey Organisation 1995 21
the Palmerville Fault on COOKTOWN and MOSSMAN; they form the western margin of the Hodgkinson Province. Strong positive magnetic anomalies are associated with this area of outcropping Chillagoe Formation. In the area of Laura Basin cover to the north there are similar magnetic anomalies; their distribution shows that subcropping Chillagoe Formation trends just east of north, to cut the coast of Princess Charlotte Bay at about 144°20'E. The wavelengths of the magnetic anomalies associated with these formations are consistent with the Chillagoe Formation sub cropping at the base of the Laura Basin. Gravity lows are common in the Hodgkinson Basin area. In areas of outcrop these lows correlate with mainly 'S'-type PermoCarboniferous granites. These lows are abruptly truncated near the western margin of the inferred sub cropping Chillagoe Formation, supporting the idea that Hodgkinson Province rocks do not extend further west. From these observations it is inferred that the Palmerville Fault trends just east of north, Hodgkinson Basin rocks extend westward only to this fault, and preserved Lakefield Basin sediments cannot extend east of the P~lmerville Fault with any significant thickness.
The seismic data shows that the base of the Lakefield Basin sediments shallows eastward (Figs. 15 & 17); if this dip is extrapolated the sediments would be thin just west of the Palmerville Fault. Just west of the Palmerville Fault are characteristic magnetic anomalies, and the gravity gradient with a low to the west (Fig. 17); this is consistent with a significant thickness of Lakefield Basin sediments, and in apparent contradiction with the extrapolation of the seismic data.
Cause for the Lakefield and Laura Basins
The time of Lakefield Basin sedimentation is poorly constrained. The samples from drill holes show that the top of the preserved section is likely to be Permian. Many sedimentary remnants within a 200 km radius range in age from Permian to Triassic, and Triassic spores are common in the overlying Laura Basin sediments. Therefore the missing, upper part of the Lakefield Basin may be as young as Triassic.
The data available for the Lakefield Basin are not adequate to es,tablish a model for its formation. The thick sediments east of the Yintjingga Fault Zone show no significant thinning east-west, and about 30% thinning northwards, so the basin subsided without significant tilting, and the Yintjingga Fault Zone cannot have been the basin margin. In particular there is no evidence that the basin is a half-graben against either the Yintjingga Fault Zone or the Palmerville Fault. The maximum thickness of sediment preserved is about 10 km. The uppermost sediments are highly indurated, so several kilometres of Lakefield Basin sediments must have been removed by erosion the Laura Basin sediments were deposited. It is unlikely that this 10+ km thickness of sediment could have covered a large part of the region surrounding the Lakefield Basin, so the preferred model is for subsidence being restricted to the area of the Lakefield Basin and the immediate surrounding area. Space for this sediment must have been created by some (undefined) form of crustal extension.
If space for the Lakefield Basin resulted from some form of crustal extension, the subsequent cooling of the lithosphere, and the accompanying thermal subsidence would have resulted in an overlying thermal sag basin. A thermal subsidence origin for the Laura Basin is indicated by the shapes of the basins and their relative age. The narrow and deep Lakefield Basin underlies the deepest part of the wide and shallow Laura Basin (Fig. 17). The time period between the two periods of sedimentation is likely to be ?Middle Triassic to ?Middle Jurassic .
. I
© Australian Geological Survey Organisation 1995 22
,I
Possible PermianITriassic sediments in WALSH
Within the eastern part of WALSH, associated with the Gamboola Fault, are two bands, 12 km by 50 km and 4 km by 20 km, of rock which has low magnetisation and lower density than the adjacent metamorphic rock. This rock has the properties of a granite, but the subcrop is apparently fault controlled, making a granite origin unlikely. These bands of rock are thought to be fault troughs of sediments. The most likely age for sediments in this position is Permian/Triassic.
FAULTS AND LINEATIONS
Figure 18 shows the distribution of the mapped faults. The major faults influencing the study area are the Palmerville Fault, Gamboola Fault, and Yintjingga Fault Zone, which constitute the northern sector of the Palmerville Fault System.
The Palmerville Fault .1
The Palmerville Fault crops out east of the study area in COOKTOWN and MOSSMAN as a major fault separating Proterozoic metamorphic rocks to the west, from Palaeozoic Hodgkinson Province rocks to the east. The western margin of the Hodgkinson Province consists of a band ofMulgrave and Chillagoe Formations, about 10 km wide. As mentioned above, aeromagnetic data are consistent with the Chillagoe and Mulgrave Formations not extending north to the western margin of the Princess Charlotte Bay as previously thought, but extending east of north towards Cape Bathurst. The Palmerville Fault is thought to follow the western margin of these formations (Fig. 17). Along this northern extension, the fault separates Permian sediments and volcanics in the west, from Hodgkinson Province rocks in the east. Major movements occurred on this fault during the Siluro-Devonian, and Permo-Carboniferous time (de Keyser, 1963; Shaw et aI, 1987). Tertiary movement is indicated by the northern part of the fault coinciding with a Landsat feature interpreted by Senior (unpublished) as a fault downthrown to the east.
The main influence of the Palmerville Fault in HANN RIVER and WALSH is that metamorphic structure up to 20 km west of the fault is sub-parallel to the fault, due to shearing of the rocks west of the fault during the Siluro-Devonian or earlier.
The Yinijingga Fault Zone ,I
The Yintingga Fault Zone is a splay of the Palmerville Fault System, that trends just west of north, and abuts the Palmerville Fault at about 15°30'S (Figs. 17 & 18). Below the Lakefield Basin the rocks west ofthe Yintjingga Fault Zone are Proterozoic metamorphic rocks, and east of the fault zone the rocks are unknown but probably the same. Reactivation of the fault zone has resulted in fault elements cutting Laura Basin and Lakefield Basin sediments.
Lakefield Basin sediments west of the fault zone are up to 3 km thick, and they dip and thicken towards the fault zone, indicating that the fault zone was active during this sedimentation. Lakefield Basin sediments east of the fault zone are up to 10 km thick, dipping but not thickening towards the fault zone. One trace of the fault is therefore inferred to have been active between the end of Lakefield Basin sedimentation and the start of deposition of the Laura Basin sequence in the Middle Jurassic. The fault trace separating Lakefield Basin sediment packages is not imaged by the seismic reflection profiles, but its position can be inferred from the extent of
© Australian Geological Survey Organisation 1995 23
,I
Permian sediment bedding reflections (Fig. 14). The fault trace dips westwards 60-80°, with thicker sediments to the east, so it has a reverse component. Its ~urface trace is I north-striking (Figs 12 & 14).
A major feature of the magnetic anomalies is a band 2-5 km wide of north-striking, linear, magnetic-highs. These magnetic highs are thought to be due to igneous rocks of Permian age, interbedded with or intruding the Lakefield Basin sediments, with positions controlled by a band of faults over the full width ofthe Yintjingga Fault Zone. This band offaults must have been active during sedimentation, but there are no vertical offsets in the Lakefield Basin seismic horizons.
Jurassic-Cretaceous fault movements are inferred by Pinchin (1982) from reversal of anticlines and synclines during Laura Basin sedimentation, and from thickening of the of Late Jurassic to Early Cretaceous Gilbert River Formation adjacent to faults.
Post Lower Cretaceous movement on the Yintjingga Fault Zone is indicated by warping and faulting of the whole Laura Basin sequence, shown most clearly by the shape of the base of the sequence (Figs 12, 14 & 16). On line 89-Kl displacement of the base of the Laura Basin at the main fault is by 0.18 s two-way travel time (~310 m). Sediments are domed up west of this fault (Fig. 12), indicating that during this time period the movement was reverse, on a west-dipping fault. In the south the base of the Laura Basin is faulted. The faJlt is poorly defined in position (Fig. 16), so it is not clear whether it coincides with the north-striking fault displacing the Lakefield Basin sediments (Fig. 15), or with the more NNW-trending Late Cainozoic fault (Fig. 12).
The trace of the main Late Cainozoic movement on the Yintjingga Fault Zone (Figs 12, 14 & 17) has been mapped by three techniques. Fault segments were mapped from Landsat images by Senior (unpublished); he interpreted the main faults to be downthrown to the west in EBAGOOLA, and downthrown to the east in HANN RIVER. Seismic shot hole altitudes mapped by United Geophysical (1969) in EBAGOOLA show an elongate ridge 20-50 m altitude, generally 2 km wide, with the base of the steep western margin coincident with the fault of Senior (unpublished); this is consistent with the faulting being east-dipping and reverse. Over land, images of short-wavelength magnetic anomalies show an almost-continuous, linear, short-wavelength feature, generally coinciding with a magnetic-image texture change from smooth in the west, to rough in the east. This indicates uplift on the eastern side, inconsistent with Senior (unpublished) in HANN RIVER. Note that this Late Cainozoic fault is approximately coincident in the north with the fault displacing the base of the Lakefield Basin, but in the south the faults are 6 km apart (Fig. 14).
In summary the Yintjingga Fault Zone has had a complex histoij, with movemJnt of various types on a band of fault planes 2-6 km wide at the surface. Transcurrent movement is undefined but likely from the linear form of the fault zone, and the regional environment. Pre-Permian movement is unknown, but likely. Permian movement is suggested by the rapid thickening of the western sediment package toward the Yintjingga Fault Zone, and the magnetic anomalies thought to be caused by Permian igneous bodies adjacent to a band of subparallel fault planes. Between the Permian and Jurassic there was over 10 km of east block down movement on a 60-80° west-dipping reverse fault. Post Cretaceous movement is about 0.3 km on a west-dipping reverse fault. During the Late Cainozoic there was reverse movement on an east-dipping fault that is generally on the eastern margin of the fault zone.
© Australian Geological Survey Organisation 1995 24
The Gamboola Fault
(Bain et al., 1994) This is a major, NW trending, sub-cropping fault zone, 220 km long. PreJurassic rocks have a large but unknown displacement across this fault, and Jurassic and younger rocks have minor displacements.
, I I
This fault zone lies just south of the southeastern end of the 400 km-Iong, 25 km wide, Alice Palmer Structural Zone (Smart et aI, 1980, Structural Elements map); a zone of possible Cretaceous, and definite Cainozoic flexure. The Gamboola Fault underlies the Alice Palmer Structural Zone at its southeastern end, and is 25 km SW of the zone's margin at its NW end. The main fault of the Gamboola Fault corresponds with a surface fault displacing Late Cretaceous to Early Tertiary sediments. This surface fault is 15 km long on the First Edition geological map (Grimes & Whitaker 1977), and 23 km long on the magnetic images. On this fault a soda spring is mapped by Grimes & Whitaker (1977).
The Gamboola Fault separates Proterozoic metamorphic groups (except the poorest known :e u2), and is the boundary between mainly 'I'-type Siluro-Devonian granites to the south and mainly lSI_type to the north. In the western part ofHANN RIVER and WALSH the regional strike of metamorphic rocks changes near the fault. Rocks north of the fault bend to the SE (subparallel to the fault), and rocks south of the fault bend to the NE (at right angles to the fault). There is no systematic change in density or magnetisation across the fault, but there is a striking change in magnetic character across the fault, and the fault truncates anomalies from the south and north.
The basement geology up to 30 km from the fault is strongly influenced by the tleformation associated with the fault zone. North of the fault zone rocks of the Yambo Metamorphic Group have a strong fracture pattern, and an intense dyke swarm, parallel to the fault zone, in a band about 30 km wide. The Edwards River Metamorphic Group has a fracture pattern parallel to the fault zone and extending 20 km from it. South of the fault zone, in WALSH and RED RIVER, the faults and structures in the Permo-Carboniferous igneous rocks are parallel to the fault zone up to 20-25 km from it.
In northeastern WALSH where basement is shallow, and there is good quality magnetic data, the main fault is composed of numerous segments, 10-30 km long, and separated by 2-6 km long jogs with a north or west strike. The main fault is subparallel to minor faults 2 to 13 km distant. Two rectangular areas, 12 km by 50 km and 4 km by 20 km ofIow density and low magnetisation, are interpreted to be fault-bounded troughs ofPermianiTriassic sediment.
NNW-trending faults and structural boundaries
Many of the boundaries of metamorphic groups are either fault controlled, or possibly fault controlled.
The Cattle Swamp (CSSZ) and Lindalong (LSZ) Shear Zones (fig. 18) are maj10r faults striking about 350° that are likely to have had considerable horizontal and vertical displacement. The vertical displacement is indicated by the significant change across the faults in metamorphic texture, evident both in the field geology and magnetic images. The horizontal displacement is indicated by the apparent ~30 km sinistral displacement across the Cattle Swamp Shear Zone of the areas ofIow deformation in the Edwards Metamorphic Group, and Holroyd Group (Fig. 6).
© Australian Geological Survey Organisation 1995 25
Numerous NNW-striking faults cut the Holroyd Group and Coen Metamorphic Group. They form boundaries to the metamorphic rock formations, so they must have considerable displacement. They are truncated by the granites, so are thought to pre-date them.
Other north-trending boundaries in the area may be controlled by north-striking faults of this age. The boundary between Eul and Eu2 may be an unconformity, and may be a fault similar to the Cattle Swamp Shear Zone. Several intrusive boundaries of granite against metamorphic rock are nearly linear, north striking, and may be controlled by pre-intrusive north-striking faults.
NW-trending shear zones . I
The NW-striking Lukin River (LRSZ), Lucy Swamp (LSSZ), Ebagoola (ESZ) and Coen (CSZ) Shear Zones (Fig. 18) are wide shear zones across metamorphic and granite areas. These shear zones form minor rock type boundaries in the metamorphics, but do not significantly offset the granite boundaries. They therefore have relatively small strike-slip and dip-slip movements, that were both pre-granite and post-granite in age (Blewett, 1992).
Magnetic lineations
A texture is given to magnetic gradient images by numerous, sub-parallel lineations, that are due to lower magnetisation than the surrounding rocks, and. The trend directions are mainly NW and NE (Fig. 19). The lineations are interpreted to be due to fracture systems causing bands of low magnetisation. No corresponding fractures were seen on the ground. The lineations are generally of low amplitude and limited length. Their mapping is subjective; and those mapped on the 1:250 000 geology maps give only an indication of the direction, but not the number that could be mapped. North of the Gamboola Fault lineations are mainly seen in rocks of relatively high magnetisation - metamorphic of schist/gneiss texture. South of the Gamboola Fault they are found in some areas of low-magnetisation in volcanic subsidence structures, and in areas of high-magnetisation volcanics outside the volcanic subsidence structures. The tiline of formation of the lineations is unknown north of the Gamboola Fault, and Permian or later to the south of the fault.
Larger amplitUde lineations occur in EBAGOOLA and RED RIVER as sets of adjacent subparallel features (Fig. 19). Major NW- and NE-trending lineation sets, with an inter-set spacing of 30-50 km, are most prominent in the Newberry and Yambo Metamorphic Groups but they appear to extend across to the Edward River Metamorphic Group, although they are generally not recognisable in the granites. NW-trending lineations occur southeast of, and collinear with, the Coen Shear Zone; these lineations are thought to result from minor movement on this zone of weakness. A NE-trending major lineation set immediately NW of the Yambo Metamorphic Group gives lineations crossing the granite, and is associated with large areas of high magnetisation in the granite; the later could be due to either alteration of the granite, or to buried metamorphic rocks.
OVERVIEW
Folding
Figure 20 shows that structural trends are consistent within large areas. When rocks close to the major faults are ignored, the Yambo Metamorphic Group has NE trends, and other areas have NW to north trends.
© Australian Geological Survey Organisation 1995 26
Metamorphic textureldeformation
In areas of outcrop the metamorphic texture (phyllite/schist/gneiss) and intensity of deformation can be roughly correlated with magnetic~image characteristics ~ intensity of magnetisation, broadness offeatures, and continuity of bed dingl compositional layering. In areas of cover these magnetic~image characteristics have been used to infer the metamorphic texture and intensity of deformation (Fig. 6), as detailed above in the section 'Proterozoic metamorphic rocks'.
The general pattern of metamorphic texture/deformation is for gneiss and schist in the east, schist near the centre of sheet areas and slate/phyllite in the mid~west. The slate/phyllite abuts (?overlies) possible schists further west (Fig. 6). This pattern is partly disrupted by post~ metamorphic movements on the Gamboola Fault and Lindalong and Cattle Swamp Shear Zones.
,I I The variation in metamorphism and deformation inferred from the magnetics for the whole area has been described in the text above describing metamorphic rocks. This variation can be correlated with regional metamorphism and deformation, and with local deformation associated with major faults, and local heating associated with upper level granites.
Metallogenic implications
North of the Gamboola Fault much of the area investigated has a low potential for major mineral deposits, mainly because of the relatively poor prospectivity of the common rock lithologies (for example non~enriched granites, and the dominance of unreactive relatively~ quartzose sediments). Hydrothermal deposits are most likely to have formed in regions of high fluid flow, such as near the long~lived and deep Palmerville and Gamboola Faults, and in the apices of granite intrusion close to the outcrop/sub crop surface. An area of relatively high prospectivity, because of reactive lithologies and indications of hydrothermal activity, occurs immediately east ofthe Palmerville Fault (Wellman, 1994).
South of the Gamboola Fault in ATHERTON many mineral deposits are associated with Permo~Carbonifeous 'I' ~type igneous rocks, especially those that are fractionated. These deposits do not have a known common magnetic signature. It is lexpected that this high prospectivity would extend east to similar rocks mapped by the magnetic anomalies in WALSH and RED RIVER (Wellman et al., 1994) that are either exposed or beneath shallow cover.
GEOLOGICAL HISTORY
The pre-Jurassic basement rocks can be placed in four discrete periods of geological activity: older than 1550 Ma, 1550-1450 Ma, Cambrian-Devonian, and Carboniferous-Permian. Figure 21 shows the known and possible rocks of these four periods. Metamorphic and deformational events are shown diagrammatically as slate/schist and schist/gneiss boundaries.
Rocks older than 1550 Ma cover much of the region (Fig. 21a). Newberry and Yambo Metamorphic Groups are intruded by 'I' ~type granites about 1570 Ma ago, the Etheridge Metamorphic Group are intruded by 'S'~type granites about 1550 Ma ago. The schist/gneiss boundary is north-trending, and in the south the slate/schist boundary is NW trending. Much of the basement west of these rocks is thought to be older than 1550 Ma old on the basis of interpretation of the magnetic and gravity anomalies (Wellman, 1992a). In the east the Barnard Metamorphics may be of this age.
© Australian Geological Survey Organisatidn 1995 27
Rocks of 1550-1450 Ma age (Fig. 21b) comprise felsic volcanics, intrusives and minor sediments (Mackenzie et aI., 1985) of the Croydon Block, sediments and minor mafic intrusives of the Holroyd, Edward River and Eu 1 Metamorphic Groups, and probably the Staaten Metamorphic Group.
Cambrian to Devonian rocks are restricted to the eastern part of the area (Fig. 21c). CambrianOrdovician rocks comprise sediments in the Broken River Embayment (Withnall & Lang, 1994), igneous rocks in an adjacent orogenic zone (Withnall et aI., 1991), 'S' and 'I'-type granites in the Barnard Metamorphics, and sediments along the western margin of the Hodgkinson Basin (Bultitude, 1994). Siluro-Devonian rocks comprise a north-striking band of granites 100-150 km wide, adjacent to a north-striking band of sediments of similar width. The granites in the Georgetown Inlier (Champion & Heinemann, 1994) are 'I' -type of Silurian age. They are associated with greenschist facies retrogressive metamorphism. The granites associated with the Staaten Metamorphic Group are thought to be also 'I'-type granites. The granites of the Coen and Yambo Inliers are mainly'S' -type with 20% 'I' -type and of Siluro-Devonian age; they are associated with prograde amphibolite-facies metamorphism. Silurian to Devonian sedimentation occurred in the Hodgkinson and Broken River Provinces.
,I I Carboniferous to Permian rocks are widespread, but the volume of rock is smaller than for earlier periods (Fig. 21d). The sediments occur as small areas of non-marine clastics, that are probably a remnant of a larger area. The igneous rocks can be subdivided into three groups. Most of the igneous rocks are part of the Townsville-Mornington Island Igneous Belt (Wellman et ai, 1993; Champion & Heinemann, 1994) of mainly 'I' -type volcanics and intrusives. 'S' -type, and some 'I' -type, granites intrude the Hodgkinson Province sediments. 'I' -type intrusives and volcanics occur in an extensive area in the northern part of Cape York (Wellman, 1992a).
The above summary of regional geology shows that the area covered by this report has a geological history with many features in common with the Georgetown Inlier area. The crustal history of the region is that of four major sedimentary and igneous events. Most major features have a northerly strike. The long history of activity in the region is possibly attributable to reactivation of a Mesoproterozoic orogenic zone.
ACKNOWLEDGMENTS
This record is based on interpretation of geophysical data, and discussions on the relationship between this interpretation and field geology with other members of the AGSO/GSQ team -John Bain, Lance Black, Richard Blewett, Bob Bultitude, John IDraper, FriedriQh von Gnielinski, Jan Knutson, Doug Mackenzie, Ian Rees, Shen-Su Sun, and David Trail. I am grateful to Clive Collins for calculating the seismic refraction data, Friedrich von Gnielinski for obtaining data in Brisbane, Russell Korsch, Jim Jackson and Jim Leven for commenting on the seismic reflection profiles, and Richard Blewett, Alan Whitaker and John Bain for reviewing the draft text.
© Australian Geological Survey Organisation 1995 28
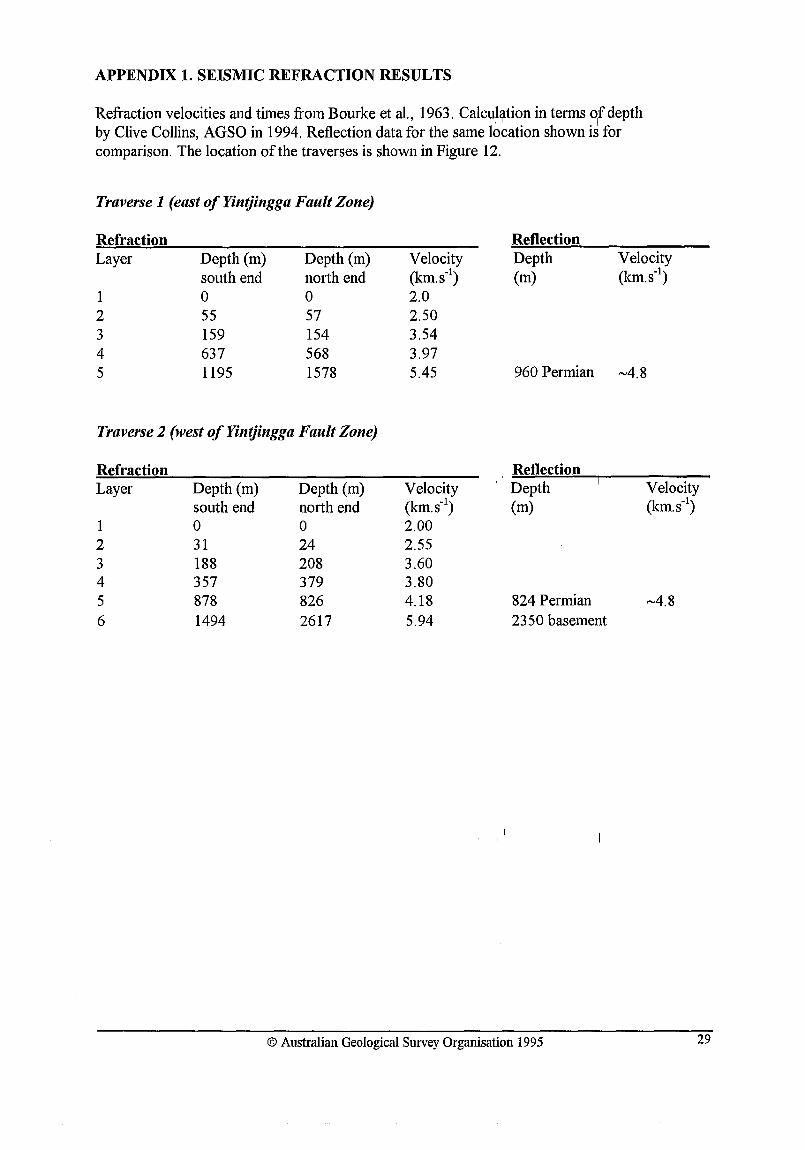
APPENDIX 1. SEISMIC REFRACTION RESULTS
Refraction velocities and times from Bourke et aI., 1963. Calcu~~tion in terms 9f depth by Clive Collins, AGSO in 1994. Reflection data for the same location shown is for comparison. The location of the traverses is shown in Figure 12.
Traverse 1 (east of Yinijingga Fault Zone)
Refraction Layer Depth (m) Depth (m)
south end north end 1 0 0 2 55 57 3 159 154 4 637 568 5 1195 1578
Traverse 2 (west of Yinijingga Fault Zone)
Refraction
Velocity (kIn.s· l
)
2.0 2.50 3.54 3.97 5.45
Reflection Depth (m)
960 Permian
I Reflection
Velocity (kIn.s· l
)
~4.8
Layer Depth (m) Depth (m) Velocity . Depth Velocity south end north end (km.s· l
) (m) (kIn.s· l)
1 0 0 2.00 2 31 24 2.55 3 188 208 3.60 4 357 379 3.80 5 878 826 4.18 824 Permian ~4.8
6 1494 2617 5.94 2350 basement
, I
© Australian Geological Survey Organisation 1995 29
REFERENCES
APG Consultants, 1989 - GSQ Ebagoola No 1. Palynological report No. 571/9. Report for Queensland Department of Mines. Unpublished report held by Queensland Department of Mines as CR 20533.
APG Consultants, 1991 - Broken Rope No 1, palynological report No. 247/8. In, Willis, B.l, 1991 - Broken Rope No.1, ATP 368P, Well completion1report, Crusader Limited (unpublished). . I
Bain, lH.C., Withnall, I.W., Oversby, B.S., & Mackenzie, D.E., 1985 - Geology of the Georgetown region (1:250000 scale map). Bureau of Mineral Resources, Canberra
Bain, lH.C. and the AGSO-GSQ project team, 1994 - Contrasts in the early geological histories of the Coen and Georgetown inliers, north Queensland. In, Extended conference abstracts, New developments in geology and metallogeny: northern Tasman Orogenic Zone, eds. RA. Henderson and B.K. Davis, James Cook University of Queensland, Townsville, Australia, p. 65-66.
Black, L.P., & Withnall, I.W., 1993 - The ages of Proterozoic granites in the Georgetown Inlier of northeastern Australia, and their relevance to the dating of tectonothermal events. AGSO Journal of Australian Geology & Geophysics, 14,331-341.
Black, L.P., Bultitude, Rl, Sun, S-S., Knutson, l, & Blewett, RS., 1992 - Emplacement ages of granitic rocks in the Coen Inlier (Cape York): Implications for local geological evolution and regional correlation. BMR Journal of Australian Geology and Geophysics, 13, 191-200.
Blewett, RS., 1992 - The structural and metamorphic geology of the Ebagoola 1 :250 000 Sheet (SD54-12), Coen Inlier, Cape York Peninsula. Bureau of Mineral Resources, Australia, 1992/67.
Blewett, RS., Trail, D.T. & von Gnielinski, F., 1992 - The stratlgraphy and metamorphic rocks of the Ebagoola 1 :250 000 Sheet area in Cape York peninsula, north Q~eensland. Bureau of Mineral Resources, Australia, Record 1992174.
Blewett, RS., Mackenzie, D.E., Trail, D.S., Wellman, P., Knutson, l, von Gnieliniski, F.E. & Bain lH.C., 1994a - Ebagoola - basement geology (1 :250000 scale map). Australian Geological Survey organisation, Canberra.
Blewett, RS., Mackenzie, D.E., Wellman, P., Bultitude, Rl, Trail, D.S., von Gnielinski, F.E., Rees, I.D., & Bain, lH.C., 1994b - Hann River - pre-Mesozoic Geology (1 :250000 scale map). Australian Geological Survey Organisation, Canberra.
Bultitude, Rl, 1990 - Mungana geology (1:100000 scale map). Department of Resources and Industry, Queensland.
Bultitude, Rl, 1994 - Geology of the Hodgkinson Province. In, Extended conference abstracts, New developments in geology and metallogeny: northern Tasman Orogenic Zone, eds. RA. Henderson and B.K. Davis, James Cook University of Queensland, Townsville, Australia, p. 55-58.
Burke, RR, Harwood, C.R., & Vind, E.W., 1963 - Marina Plains reflection seismograph survey by Marathon Petroleum Ltd. Bureau of Mineral Resources, Australia, Petroleum Search Subsidy Acts Report 63/1517 (unpublished).
Champion, D.C., & Heinemann, M.A., 1994 - Igneous rocks of north Queensland, 1:500000 scale maps. Australian Geological Survey Organisation,. ~anberra. I
Crusader Limited, 1990 - ATP 368P Laura Basin, north Queensland, 1989, Kalpower seismic survey, interpretation report. Unpublished report held by Queensland Department of Mines as CR 22047.
© Australian Geological Survey Organisation 1995 30
de Keyser, K, 1963 - The Palmerville Fault - a 'fundamental' structure in north Queensland. Journal of the Geological Society of Australia, 10, 273-278.
de Keyser, K & Lucus, KG., 1968 - Geology of the Hodgkinson and Laura basins, North Queensland. Bureau of Mineral Resources, Australia, Bulletin 84.
Grimes, KG. & Whitaker, W.G., 1977, Walsh, Queensland, 1:250000 geological series explanatory notes. Bureau of Mineral Resources, Australia.
Hardy, llW., 1970 - Well completion report, Breeza Plains No.1 and Lakefield No. 1. Bureau of Mineral Resources, Australia, Petroleum Search Subsidy Acts Report 1970/650 (unpublished) .
Hawkins, P.l & Williams, LJ., 1990 - Review of the geology and economic potential of the Laura Basin. Queensland Resource Industries, Record, 1
1
99012. Jessop, R.G.C., 1969 - Offshore Laura basin seismic survey - Endeavour Oil Company NL.
Bureau of Mineral Resources, Australia, Petroleum Search Subsidy Acts Report 69/3041 (unpublished).
Knutson, l, Bultitude, R.l, & Sun, S-S., 1994 - Granitic rocks of the Cape Weymouth 1:250 000 sheet areas, Cape York Peninsula, north Queensland: reconnaissance, field, petrographic and geochemical data. Australian Geological Survey Organisation, Record 1994/9.
Mackenzie, D.E., Henderson, G.A.M., Warnick, lV., & Bain, lH.C., 1985 - Geology of the Croydon region 1 :250 000 map. Bureau of Mineral Resources, Canberra.
Mackenzie, D.E., Bultitude, Rl, & Rienks, I.P., 1993 - Geology of the Featherbed Cauldron Complex, Queensland, 1: 100 000 scale map. Australian Geological Survey Organisation, Canberra.
Mackenzie, D.E. & Knutson, 1992 - Igneous rocks of the Ebagoola 1 :250000 Sheet area, Cape York Peninsula, north Queensland: Field, petrographic, and geochemical data. Bureau of Mineral Resources, Australia, Record 1992/75.
McCutchen, E.O., 1969 - Princess Charlotte Bay offshore seismic survey - Report by United Geophysical Co. for Exoil N.L. Bureau of Mineral Resources, Australia, Petroleum Search Subsidy Acts Report 69/3047 (unpublished).
Pinchin, l, 1974 - A reinterpretation of the seismic data in the Llaura Basin, Queensland. Journal of the Geological Society of Australia, 21, 437-445. ' I
Pinchin, l, 1982 - Interpretation of recent seismic data from ATP 245P, Laura Basin, Queensland. Final report, Marina Plains seismic survey for Scott Sunlea Pty Ltd, April 1982. Unpublished report held by the Queensland Department of Mines as CR 10705.
Roest, W.R, Vehoef, l, and Pinkington, M., 1992 - Magnetic interpretation using the 3-D analytic signal. Geophysics, 57, 116-125.
Senior & Associates, unpublished - Laura Basin Landsat study, map 1 :500000 scale. Senior & Associates.
Shaw, RD., Fawckner, IF., & Bultitude, Rl, 1987 - The Palmerville fault system: an imbricate thrust fault system in the northern Tasmanides, north Queensland. Australian Journal of Earth Sciences, 34, 69-93.
Sheppard, M.l, 1991, EPMs 7341, 7702 and 7769 Glengarland, Coleman River and Strath Haven combined annual report for the period ending 17 July 1991, R 7226, BHP Minerals (unpublished).
Shirley, lE., 1979 - The deep crustal structure of north Queensland. BMR Journal of Australian Geology and Geophysics, 4, 309-321.
Shirley, lE. & Zadoroznyj, 1.,1974 - Reconnaissance helicopter gravity survey, northern Queensland, 1966. Bureau of Mineral Resources, Australia, Record 1974/140.
, I
© Australian Geological Survey Organisation 1995 31
Smart, 1., Grimes, KG., Doutch, H.F. & Pichin, 1., 1980, The Carpentaria and Karumba Basins, north Queensland. Bureau of Mineral Resources, Australia Bulletin 202.
United Geophysical Corporation, 1969 - Breeza Plains seismic survey - report to Crusader Oil N.L. by United Geophysical Corp. Bureau of Mineral Resources, Australia, Petroleum Search Subsidy Acts Report 69/3059 (unpublished).
Wellman, P. 1992a - A geological interpretation of the regional gravity and magnetic features of north Queensland. Bureau of Mineral Resources, Australia, Record 1992177.
Wellman, P., 1992b - Interpretation ofEBAGOOLA aeromagnetic and gravity data. Bureau of Mineral Resources, Australia, Record 1992176.
Wellman, P., 1994 - Mapping large-scale hydrothermal systems using coincident magnetic and gamma-ray spectrometric anomalies. AGSO Research Newsletter, 20, 16-17.
Wellman, P., Mackenzie, D.E., & Bain, 1.H.C., 1994 - Permian-Carboniferous magmatism in north Queensland, a new perspective. AGSO Research Newsletter, 20, 8-9.
Willis, BJ., 1991 - Broken Rope No.1. ATP 38P, Well completion report, Crusader Limited (unpublished). I
Withnall, I.W. & Lang, S.C., 1994 - Geology of the Broken River Province. In,1 Extended conference abstracts, New developments in geology and metallogeny: northern Tasman Orogenic Zone, eds. RA. Henderson and B.K Davis, James Cook University of Queensland, Townsville, Australia, p. 51-54.
WithnaU, I.W., Black, L.P., & Harvey, K1., 1991 - Geology and geochronology of the Balcooma area: part of an Early Palaeozoic magmatic belt in North Queensland. Australian Journal of Earth Sciences, 38, 15-29.
, I
© Australian Geological Survey Organisation 1995 , I
32
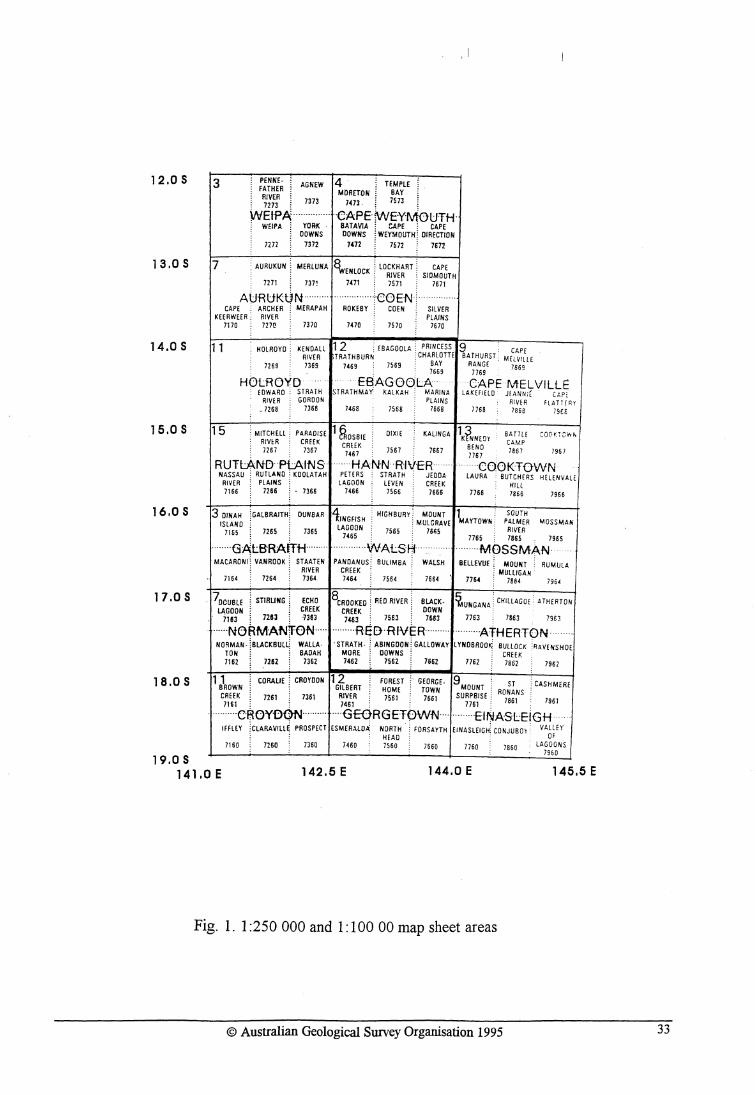
12.0 S
13.0 S
14.0 S
15.0 S
16.0 S
17.0 S
18.0 S
3 : PENNE· : AGNEW 4 TEMPLE : FATHER : MORETON BAY
: Ri~;3R ! 7373 H73: 7573 .
WEiPA·············· ·CAPE1WEYMouTH . WEIPA : YORK BATAViA: ::APE : CAPE
DOWNS DOWNS: WEYMOUTH! DIRECTION 7171 7372 7472 7572 7671
7 , AURUKUN .. :. MER LUNA B.",ENLOCK .. : LOCKHART: CAPE RIVER SIOMOUTH
7111 731' IHl 7511 1611
AiJRUKUN· CAPE . ARCHER ' MERAPAH ROKEBY CO EN
KHRWEER, RIVER
11
7170 7210 )JI0
, HOLROYD: KENDALL RIVER
7269 7369
7470 IS 70
12 : EBAGOOLA TRATHBURN
1469 7569
' PRINCESS : CHARLOTTE
BAY 7669
, I
9 CAPE BATHURST, MELVILLE
RANGE 7869 1769
HOLROYD EDWARD: STRATH
ESAGOOLA CAPE MEL VILLE: RIVER . GORDON
_ 7268 7368
STRATHMA'( KALKAH MARINA LAKHIEL D JfANN;( U.P~ PLAINS RIVER FLATTERY
7468 7568 7668 7768 7868 75££
15 : MITCHELl: PARADISE RIVcR CREEK 7267 )J67
1 810SBIE DIXIE KALINGA \~NNEOY BATTLE COCtl(~C·'h'''' CAMP CRf.EK
7561 1661 BEND 7867 7967 7467 7767
RUTLANDPtAlNS NASSAU : RUTLAND' KDOLATAH
RIVER PLAINS: 1166 7266! • 1366
····HANNRIVER ·COOKTOWN PETERS STRATH JEODA LAURA BUTCHERS HELENVALE LAGDON LEVEN CREEK HILL
7466 1566 7666 1766 7866 7966
3 DINAH 'GALBRAITH: DUNBAR .11. : HIGH BURY , MOUNT 1 = KINGF/SH: MUlGRAVE MAyroW,.:
SOUTH
ISLAND 1265 1365 LAGODN 7565· IM5 1165 7465
PALMER MOSSMAN RIVER
1765 : 7865 . 7965
·······GAlBRAffH······ WALSH MOSSMAN .... MACARONI; VANROOK STAATEN PANDANUS' BULIMBA' WALSH BELLEVUE: MOUNT RUMULA
RIVER CREEK· . : MULLIGAN· 7164 7164 1364 1464 7564 7664 7764 . 7864 795'
. 70CUBLE LAGOON 1m
:
: STIRUNG!. ECHO CREEK
7283 : -7383
··NORMANTON····· NO~MAN· !BLACKBUL~ WALLA·
TON . BADAH 1162 7182 1362
7863 7963
8CROOKED : REO RIVER; CREEK . . 7463 7563
BLACK. ~UNGANA: CHillAGOE: ATHERTON DOWN . 1683 7763
·····-HEBRIVER········ ·····ATHERTON . STRATH· : ABINGDON: GALLOWAY LYNOBROO~ BULLOCK 'RAVENSHOE
MORE . OOWNS ' . CREEK 1462 7562 7662 1762 1862 7962
11 CORAUE ; CROYDON 12 FOREST :. GEORGE· 9 MOUNT. ST : CASHMERE BROWN GILBERT HOME TOWN SURPBISE' RONANS CIR1~;K : 7261 ,1361 ~I::r, 1561 : 7661 7761· 7861 7961
····CROYDQN····· ···GEORGETOWN ... ·······ElrIIASlEiGH Iff LEY :CLARAVILL~ PROSPECT ESMER~LDIi NORTH : FORSAYTH EINASLEIGIf. CONJUBO\' VA6;EY
HEAD 7160 7260 7360 7460
19.0 S 141.0 E 142.5 E
7\60 7660 7750 7860 LA~906~NS
144.0 E 145.5 E
Fig. 1. 1 :250 000 and 1: 100 00 map sheet areas
© Australian Geological Survey Organisation 1995 33
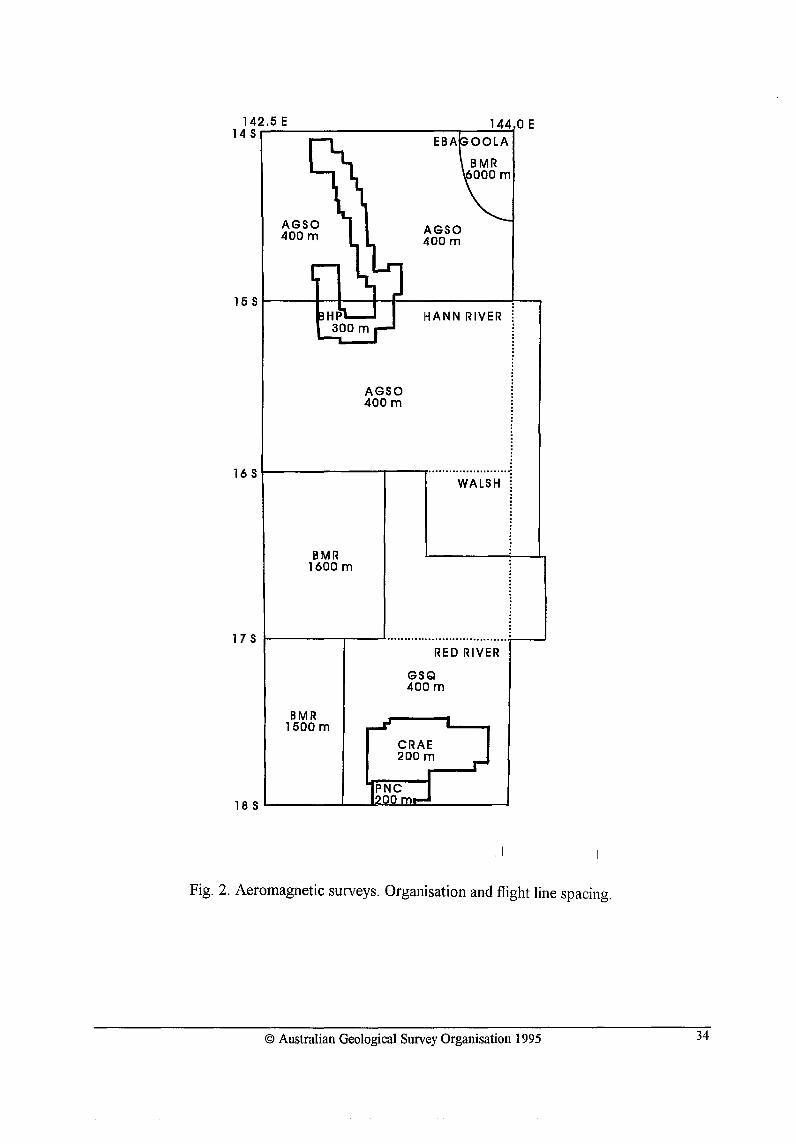
142.5 E 14 S
AGSO 400 m
EBA
AGSO 400 m
15S~----+-~--~-+------------~--,
AGSO 400m
HANN RIVER
16 S I-------r--r ..................... ..
BMR 1600 m
WALSH
1 7 S 1----------,------' .................................. .
BMR 1500 m
RED RIVER
GSQ 400 m
18S~------~--~~~~------~
, I
Fig. 2. Aeromagnetic surveys. Organisation and flight line spacing.
© Australian Geological Survey Organisation 1995 34
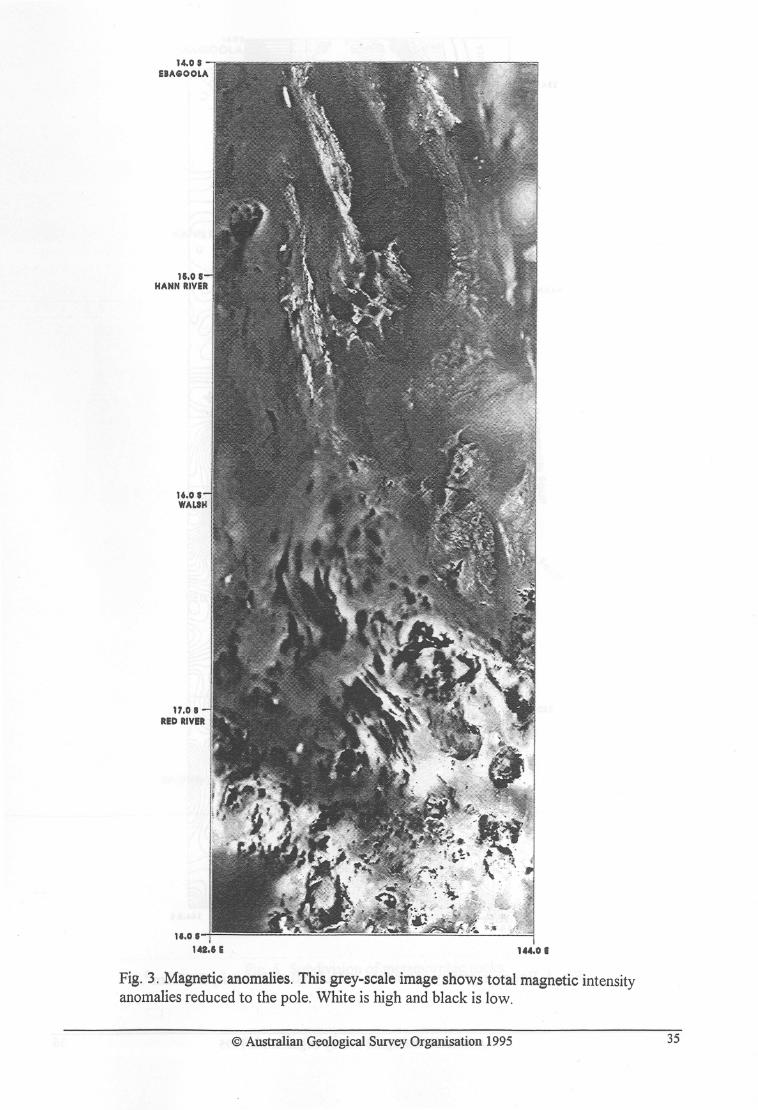
Fig. 3. Magnetic anomalies. This grey-scale image shows total magnetic intensity anomalies reduced to the pole. White is high and black is low.
© Australian Geological Smvey Organisation 1995 35
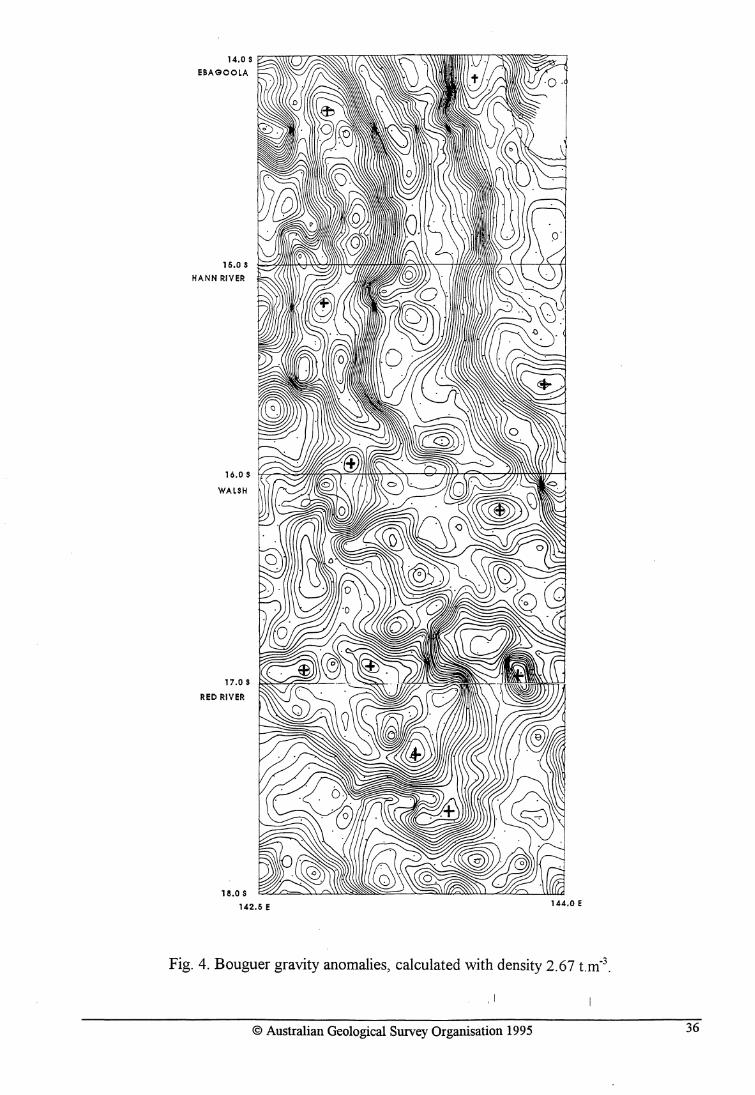
14.0 S y \\\(17 \ 7 ~"'" \ I ? \\\\\\\\\( ~ (\\\\
EBAGOOLA
16.0 S ~~II\\\J\~1~uf8B$,0\~~V\ ).)/11/ \ ( (2\ ~ HANN RIVER
160 S rf ~ '-Yilt' ":\ () fti =- ~r.', .( ~ ii:':1. II I":\' =) ~\~ '\"/~ ~ WALSH
17.0 S
REO RIVER
18.0 S
142.6 E 144.0 E
Fig. 4. Bouguer gravity anomalies, calculated with density 2.67 t.m-3.
, I
© Australian Geological Survey Organisation 1995 36
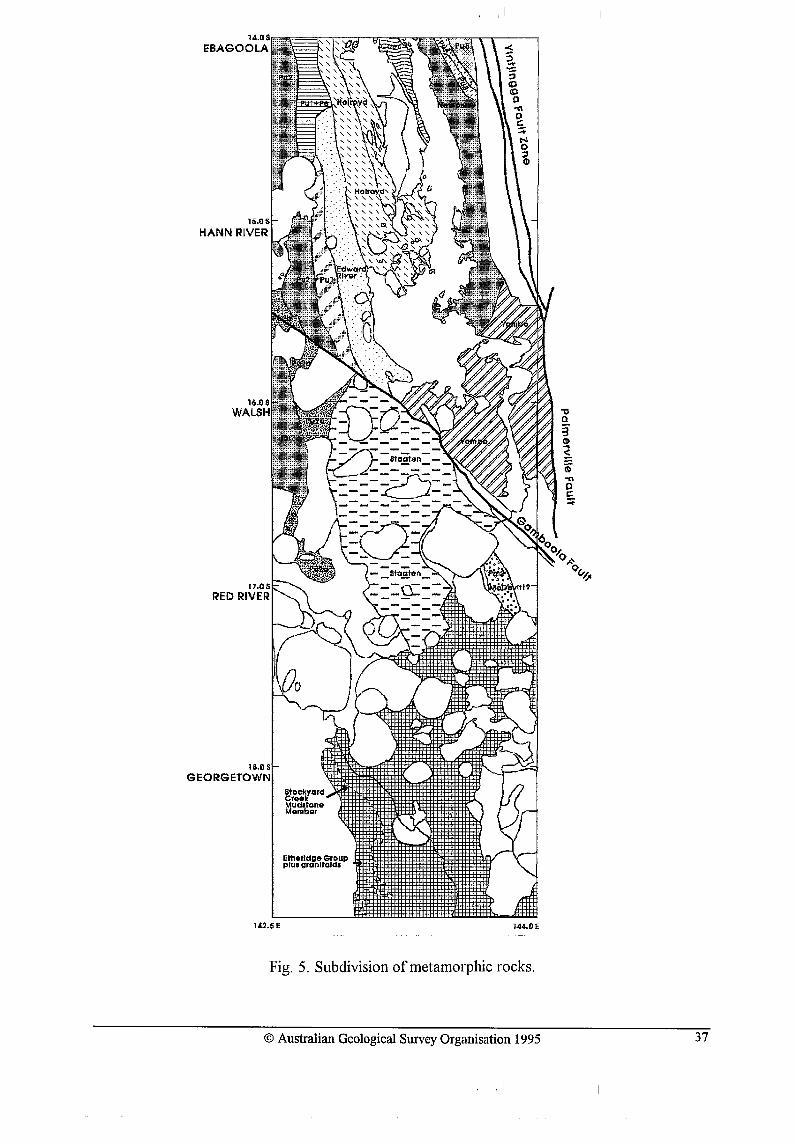
182.8 E 144.0 E
37© Australian Geological Survey Organisation 1995
14.0 S
ESAGOOLA
16.0 S
HANN RIVER
16.08WALSH
17.08RED RIVER
18.08GEORGETOWN
Fig. 5. Subdivision of metamorphic rocks.
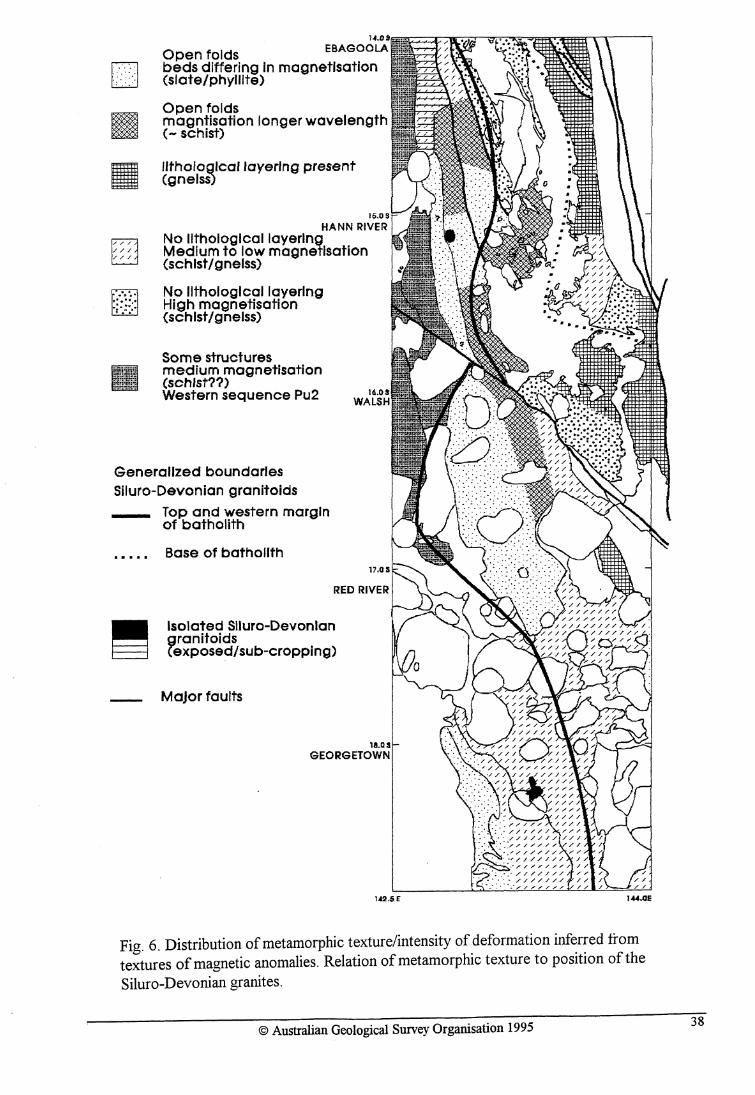
Open folds EBAGOOLA
1:'.'.-::' :1 beds differing In magnetlsotion .;.:::. (slate/phyllite)
II
;;;
1/ / / ///
, ..... . [ill .... . ;-.::."
Open folds mogntisation longer wavelength (- schist)
If tho logical layering present (gneiss)
16.05
HANN RIVER No lithological layering MedIum to low magnetlsation (schist/ gneiss)
No lithological layering High magnetisatlon (schist/gneiss)
Some structures medium magnetisation (schist??) Western sequence Pu2
Generalized boundaries Siluro-Devonian granitoids _ Top and western margin
of batholith
~
Base of batholith
Isolated Siluro-Devonian granitoids (exposed/sub-cropping)
Major faults
la.as GEORGETOWN
1.&2.5 E 144.GE
Fig. 6. Distribution of metamorphic texture/intensity of deformation inferred from textures of magnetic anomalies. Relation of metamorphic texture to position of the
Siluro-Devonian granites.
© Australian Geological Survey Organisation 1995 38
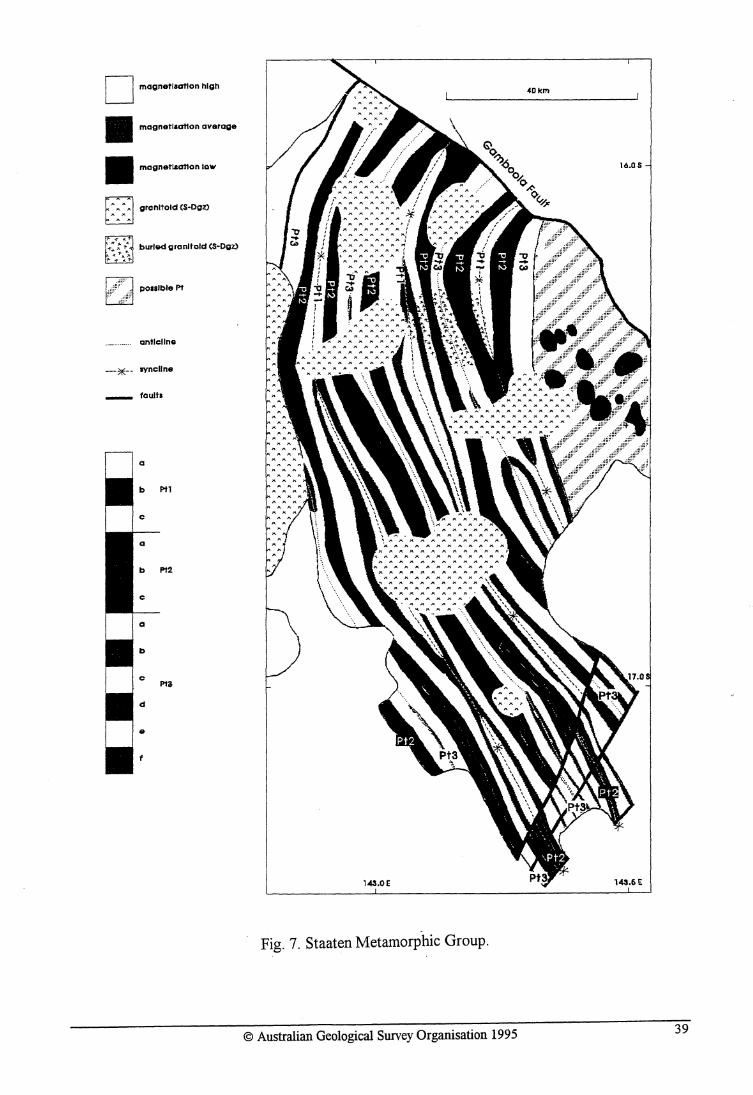
D magnetllGf10n high
magnetlaallon average
magnet~allon low
grQnltold (S-Doz'
~ <
or: ~ 1"; burled granitoid (S"'Dgz) ,...0: ~'1-
pOlslble pt
anticline
___ * __ syncline
_ faults
Pfl
Pf2
Fig. 7. Staaten Metamorphic Group.
© Australian Geological Survey Organisation 1995 39
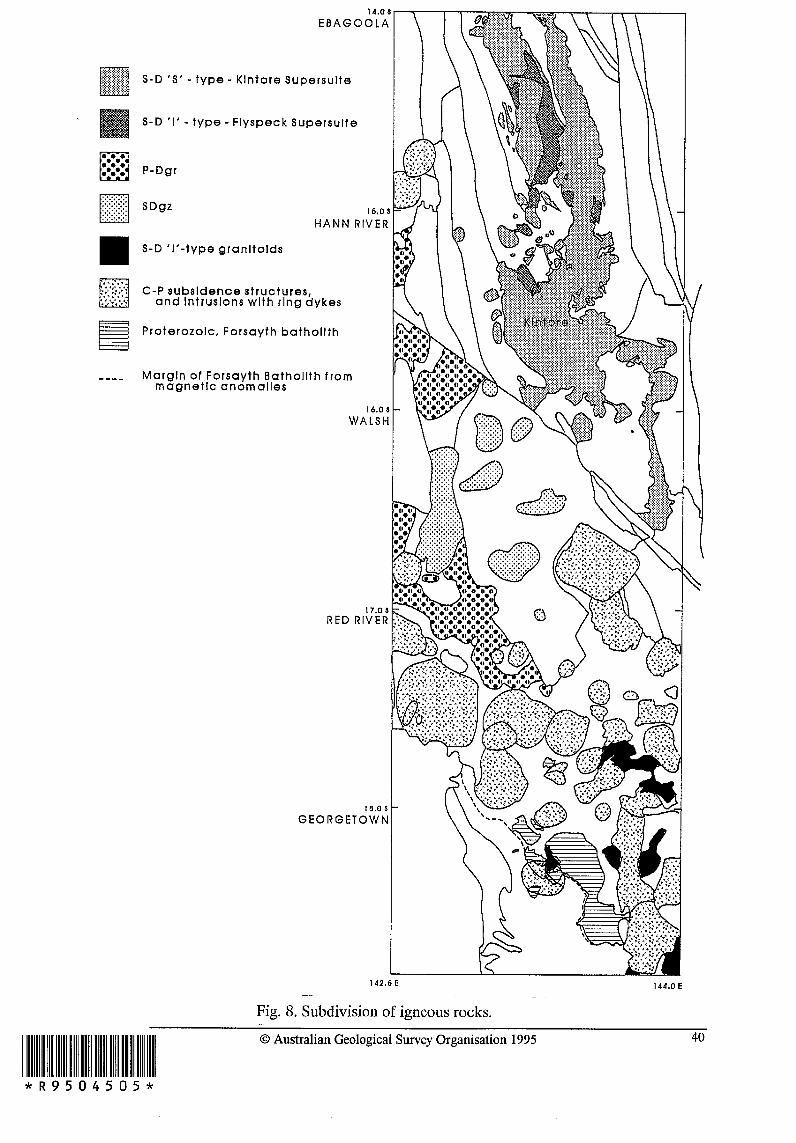
14.0 $
EBAGOOLA
S-D 'S' - type - Klntore Supersulte
• S-D 'I' - type - Flyspeck Supersulte
P-Dgr
SDgz
111 S-D 'I'-type granitolds
15.0 $
HANN RIVER
C-P subsidence structures,and Intrusions with ring dykes
Proterozoic, Forsayth bathollth
Margin of Forsayth Bathollth frommagnetic anomalies
16.06
WALSH
17.0$
RED RIVER
18.0 $
GEORGETOWN
142.6 E
Fig. 8. Subdivision of igneous rocks.40© Australian Geological Survey Organisation 1995II HII1010111
* R 9 5 0 4 5 0 5 *
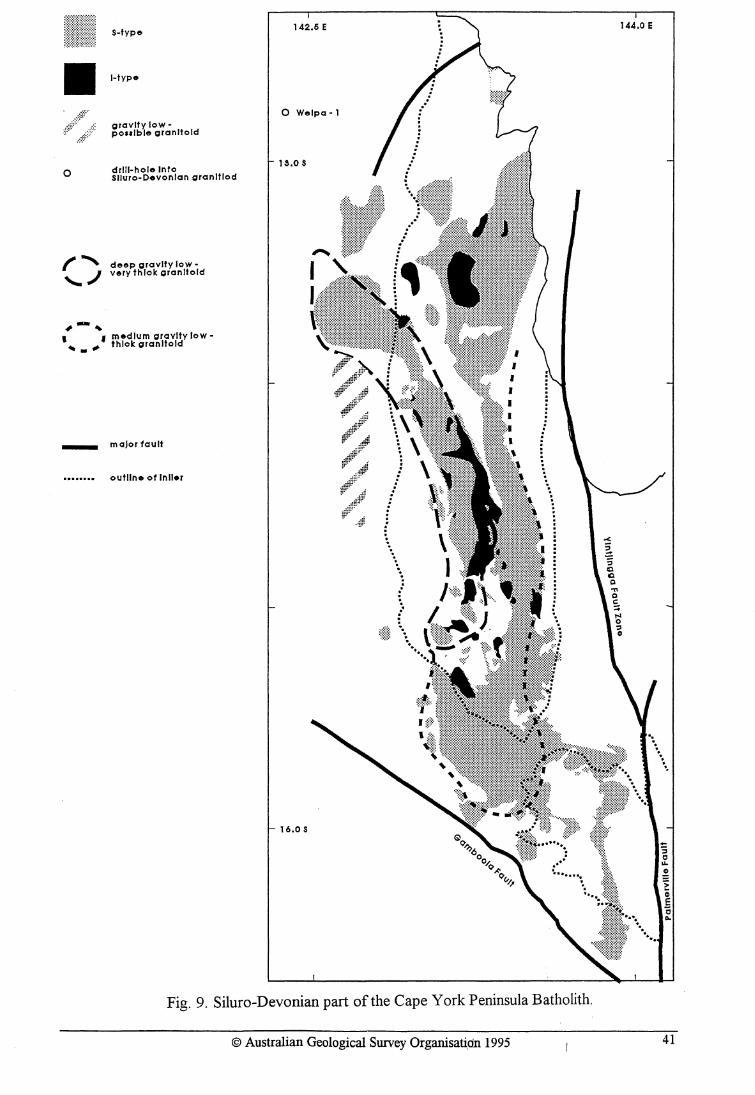
s-type
I-type
gravity lowpoulble granitoid
drill-hole Into
142.6 E
o Welpa-1
u.os o Slluro-Devonian granlflod
#-,
deep gravity lowvery thlolc granitoid
I • medium gravity low-, _, thlolc granitoid
- maJor fault
outline of Inlier
16.0 S
Fig. 9. Siluro-Devonian part ofthe Cape York Peninsula Batholith.
© Australian Geological Survey Organisat~dn 1995
144.0 E
41
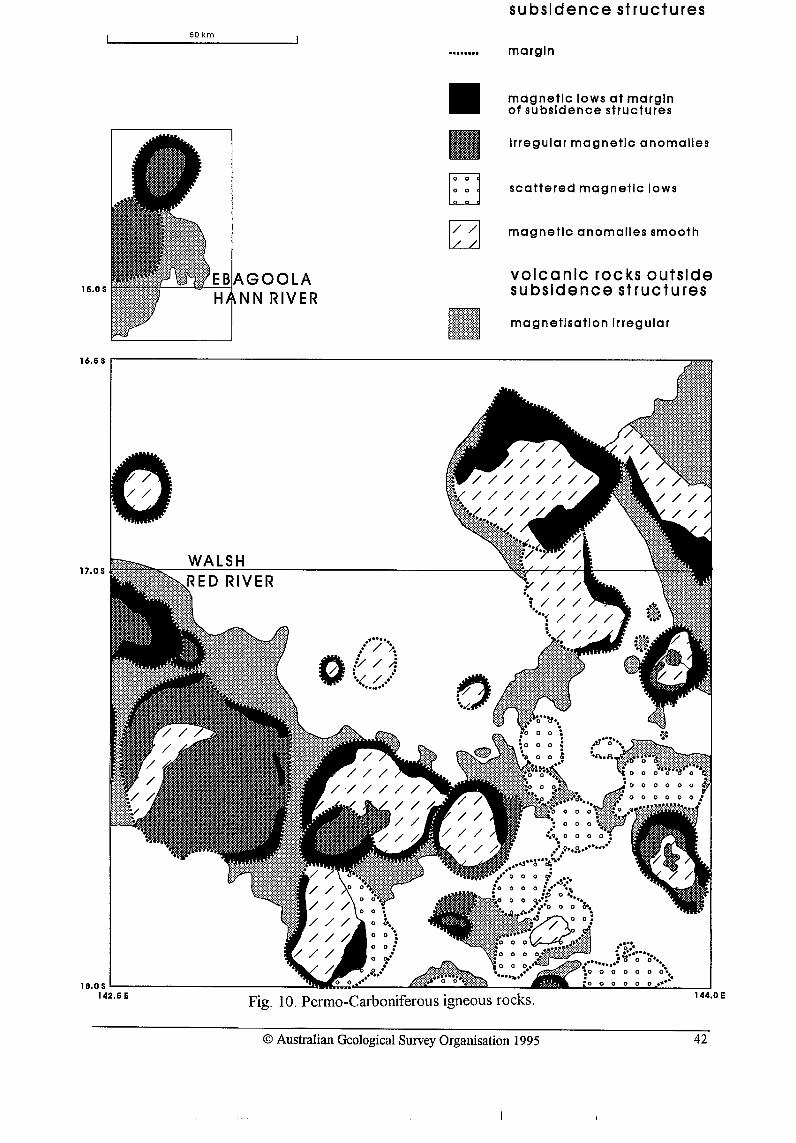
subsidence structures
42© Australian Geological Survey Organisation 1995
margin
magnetic lows at marginof subsidence structures
Irregular magnetic anomalies
scattered magnetic lows
magnetic anomalies smooth
volcanic rocks outsidesubsidence structures
magnetisation Irregular
O 0 (
O 0 (
n n I
/ // /
16.0 SAGOOLANN RIVER
Fig. 10. Permo-Carboniferous igneous rocks.
I^50 km 1
••
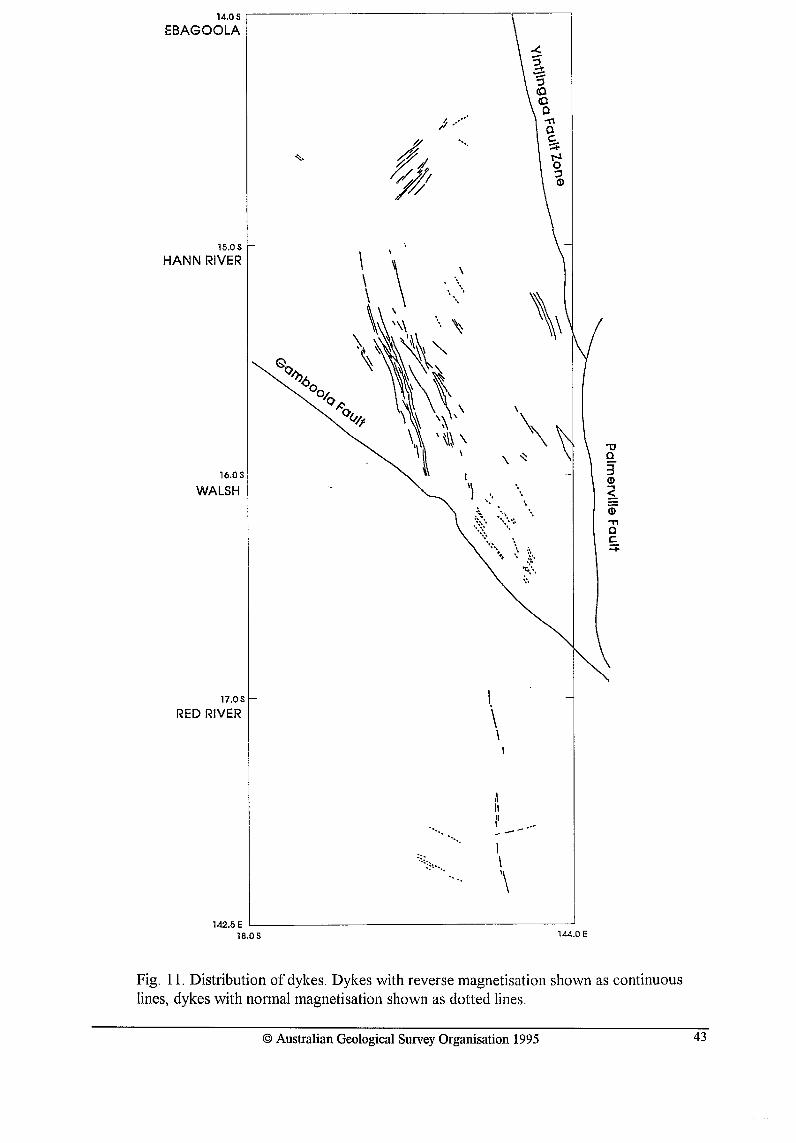
Fig. 11. Distribution of dykes. Dykes with reverse magnetisation shown as continuouslines, dykes with normal magnetisation shown as dotted lines.
@ Australian Geological Survey Organisation 1995^ 43
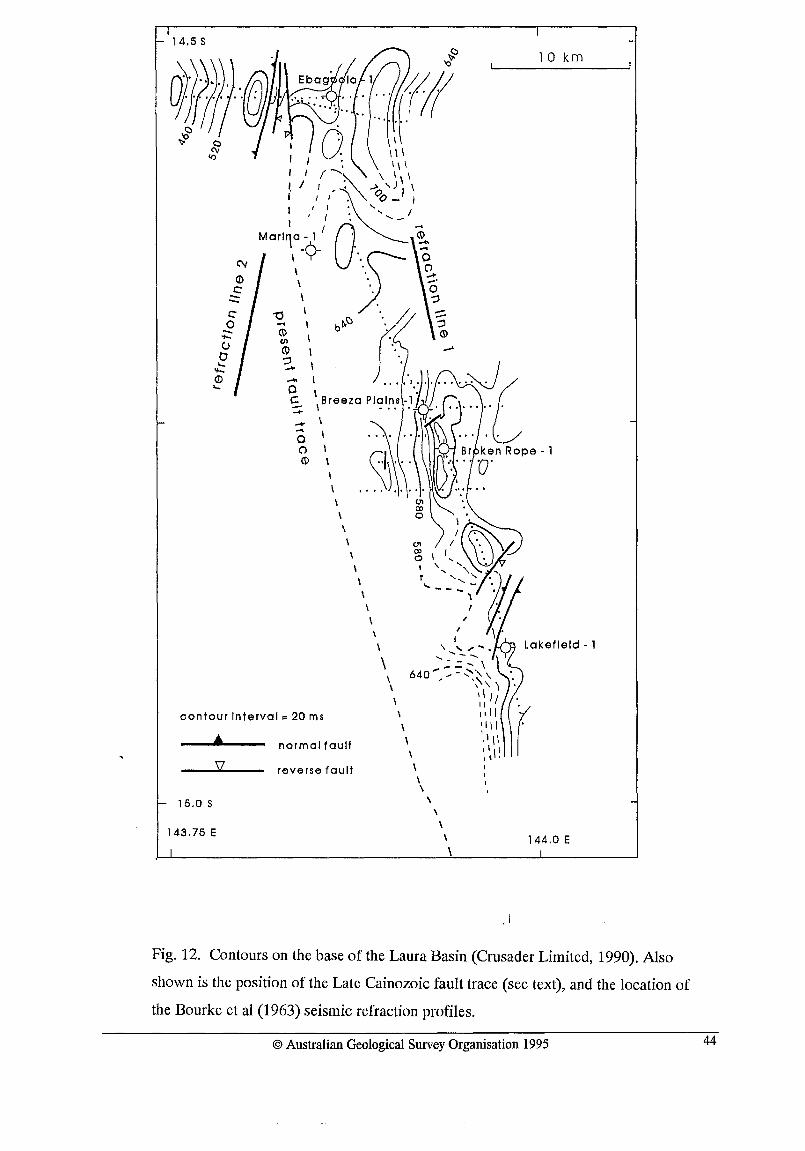
— 14.5 S
— 15.0 S
143.75 E144,0 E
10 km
1
-a0
CDm()^CD
0i Breeze Plains
0 '0 I^ ken Rope - 1(D
. •
COa
m^fo I ,I \,r^■_
Lakefleld - 1
contour Interval = 20 ms
111/1.11■1111111111■41111■11■1•11111 normal fault
\-7
reverse fault
Fig. 12. Contours on the base of the Laura Basin (Crusader Limited, 1990). Also
shown is the position of the Late Cainozoic fault trace (see text), and the location of
the Bourke et al (1963) seismic refraction profiles.
© Australian Geological Survey Organisation 1995^ 44
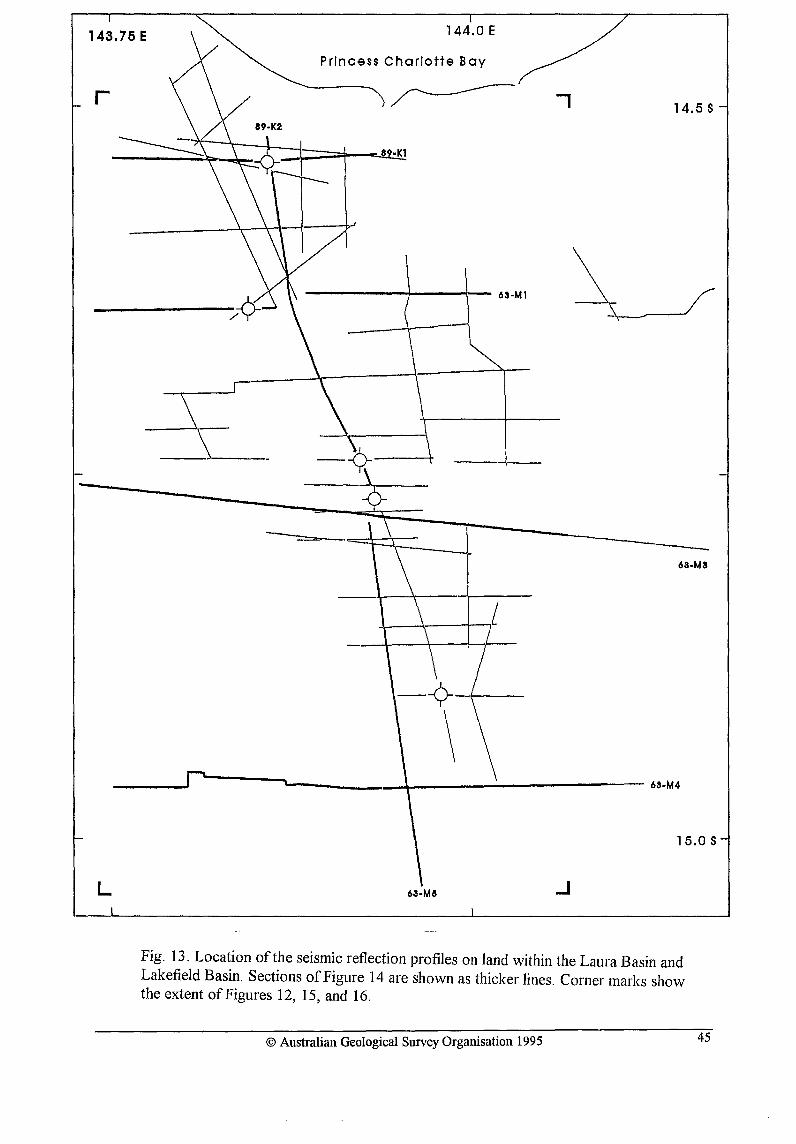
143.75E 144.0 E
r
L
Princess Charlotte Bay
14.5 S
9·Kl
------4----{--- 63.M1
___ ..Jr----~ .. - _____ --\.----..:....------- 63.M4
15.0 S
63·M5 ..J
Fig. 13. Location of the seismic reflection profiles on land within the Laura Basin and Lakefield Basin. Sections of Figure 14 are shown as thicker lines. Corner marks show the extent of Figures 12, 15, and 16.
© Australian Geological Survey Organisation 1995 45
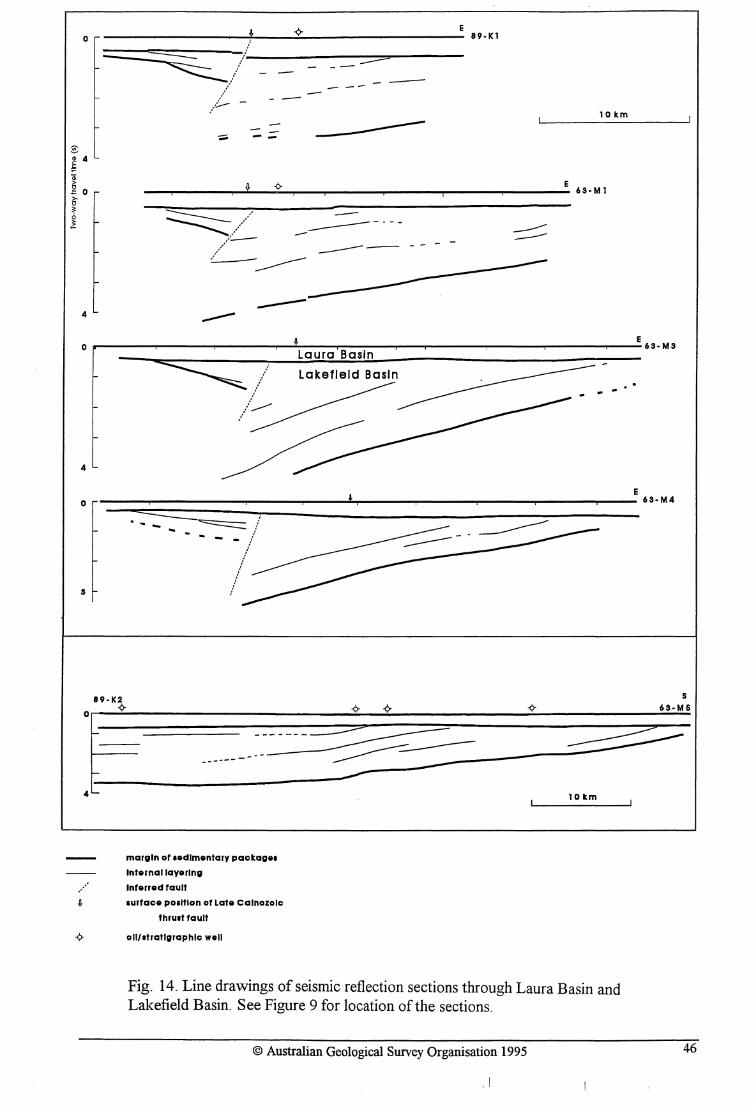
o
;4 E ~ g 0 >o ~ o ~
4
=~---,-/ -Q- 89·Kl
~
~/ --" i--
10 km
-- - - -----* -Q- - 63·Ml
:::::::::::--... // ~'-- --------
.. / , ---::..----- -----------------
--------o t i E
Laura Basin 63·M3
- .. ~ Lakefield Basin
4
o t . oe::::::::::::: E _ -=::::::::::::: 63 • M 4
3
89·K2 -Q-
!
/! ....
-Q- -Q- -Q-S
63·M 6
::=::::===> ~ ------------~--
margin of .edlmentary package.
Internal layering
,/ Inferred fault
~ surface pOlltlon of Late Cainozoic
thru,t fault
-Q- oll/.tratlgraphlc well
----------10 tm
Fig. 14, Line drawings of seismic reflection sections through Laura Basin and Lakefield Basin. See Figure 9 for location of the sections,
© Australian Geological Survey Organisation 1995
, I
46
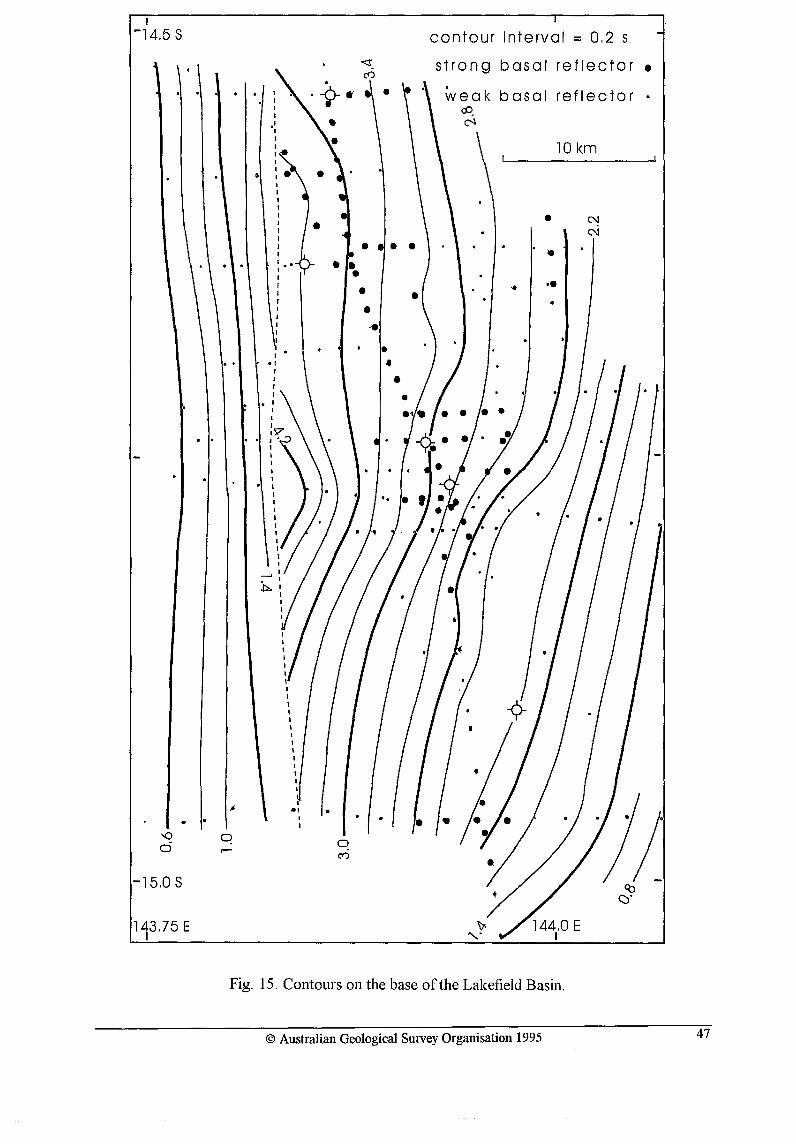
I -14.5 S
-15.0 S
I
• • • • • • I I
• 1
• I
I
• • • I
I , -. I
• o
• •
o C0
• • • •
• • ..
• • •
co nto ur interval = 0.2 s
strong basal reflector.
weak basal reflector cJ)
~
10 km
• N N
• .. • •
Fig. 15. Contours on the base of the Lakefield Basin.
© Australian Geological Survey Organisation 1995 47
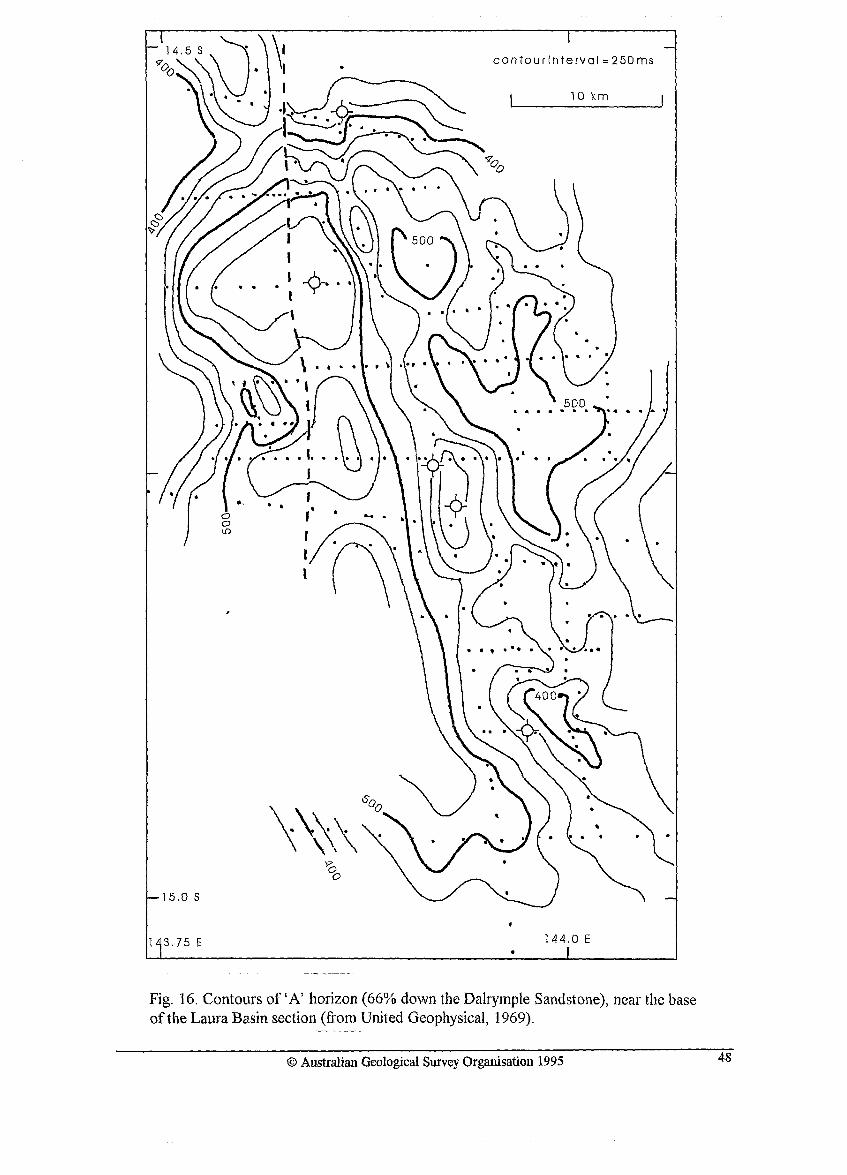
15.0 S
1 3.75 E
o o Lf.l r
I
contourlnterval =250ms
10 km
144.0 E
Fig. 16. Contours of 'A' horizon (66% down the Dalrymple Sandstone), near the base of the Laura Basin section (from United Geophysical, 1969).
© Australian Geological Survey Organisation 1995 48
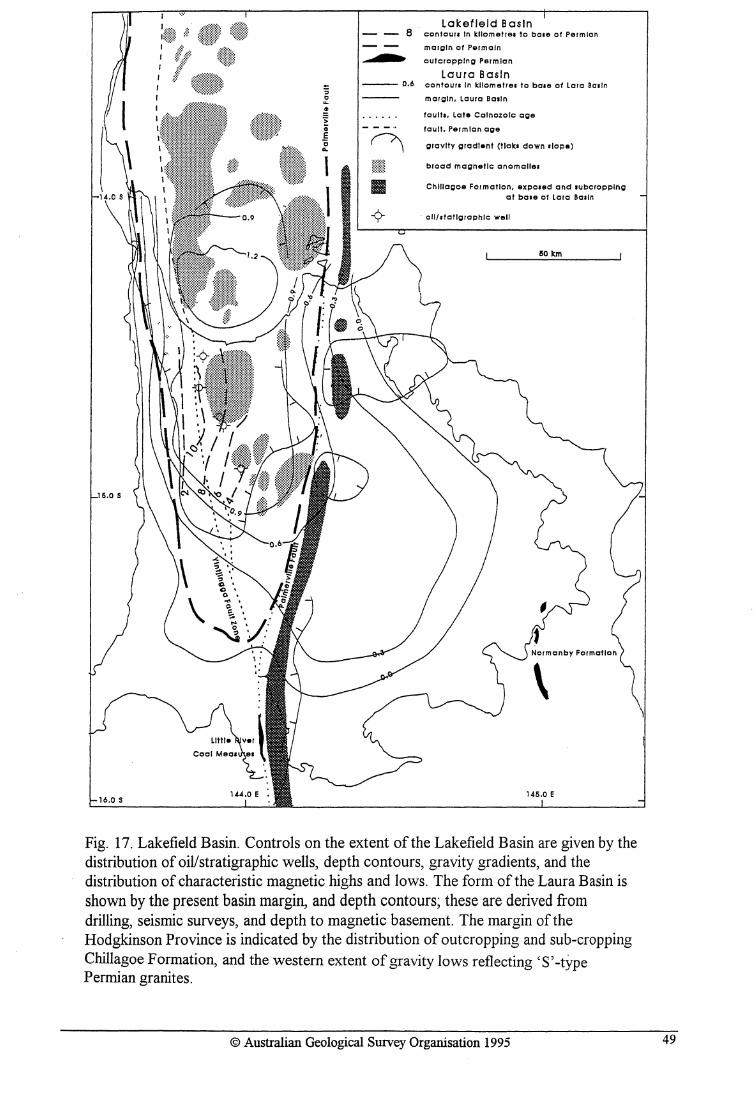
5.0 S
16.0 S
n
Lakefield Basin 8 contour. In kllometrea to bOle 01 Perm Ion
margin of Permoln
outcropping Permian
Laura Basin -- 0.6 contour. In kilometre. to bele cflora Bo.ln
margin, lauro Balin
fault., Lote Cainozoic age
foult. Permian age
gravity gradl.nt (liak. down .'ope)
broad magnetic anomolls.
Chillagoe Formation, expoled and lubcropplng ot bOle 01 lara Bosln
. oll,.tatlgraphlc: we"
eo km
145.0 E
Fig. 17. Lakefield Basin. Controls on the extent of the Lakefield Basin are given by the distribution of oil/stratigraphic wells, depth contours, gravity gradients, and the distribution of characteristic magnetic highs and lows. The form of the Laura Basin is shown by the present basin margin, and depth contours; these are derived from drilling, seismic surveys, and depth to magnetic basement. The margin of the Hodgkinson Province is indicated by the distribution of outcropping and sub-cropping Chillagoe Formation, and the western extent of gravity lows reflecting'S' -type Permian granites.
© Australian Geological Survey Organisation 1995 49
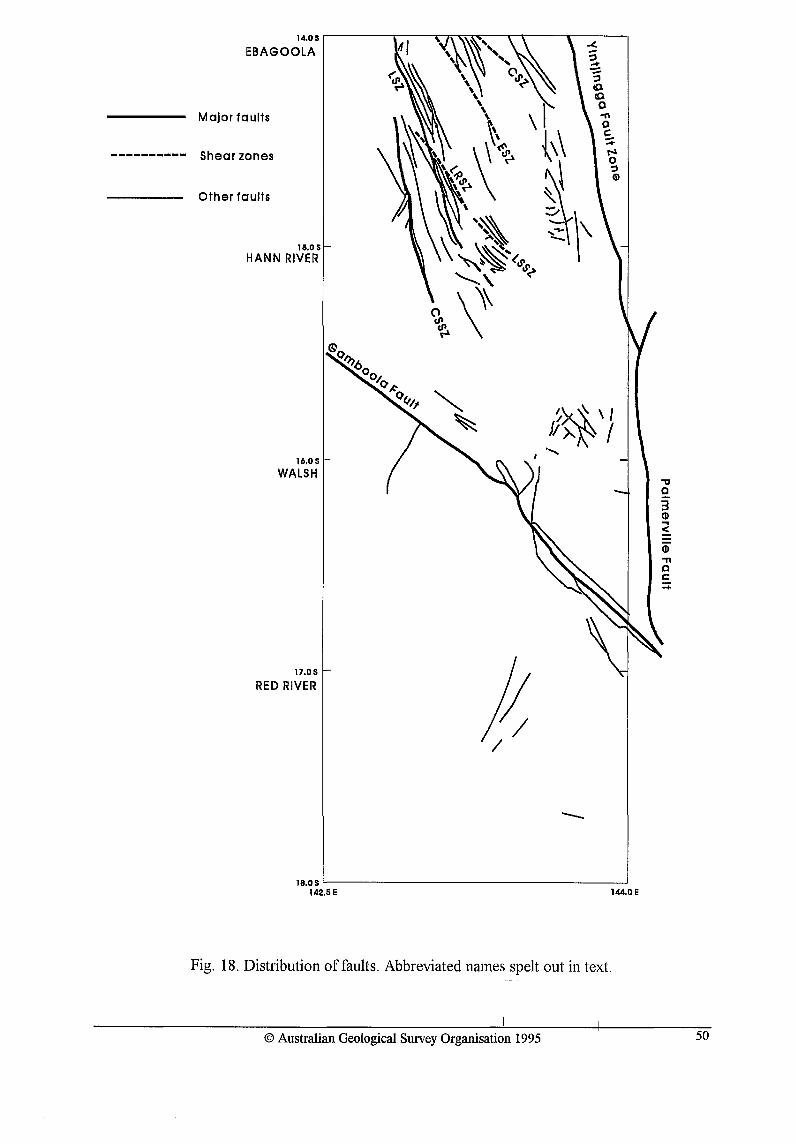
14.0 S .--------.--------.:---..-~~-r_'~-__y--__,
EBAGOOLA
Major faults
---------- Shear zones
Other faults
16.0S HANN RIVER
16.0S
WALSH
17.0S
RED RIVER
--18.0S L--________________ _
142.SE 144.0 E
Fig. 18. Distribution of faults. Abbreviated names spelt out in text.
© Australian Geological Survey Organisation 1995
"U C
3 (J)
:2 = CD "T1 Q c: ::;:
50
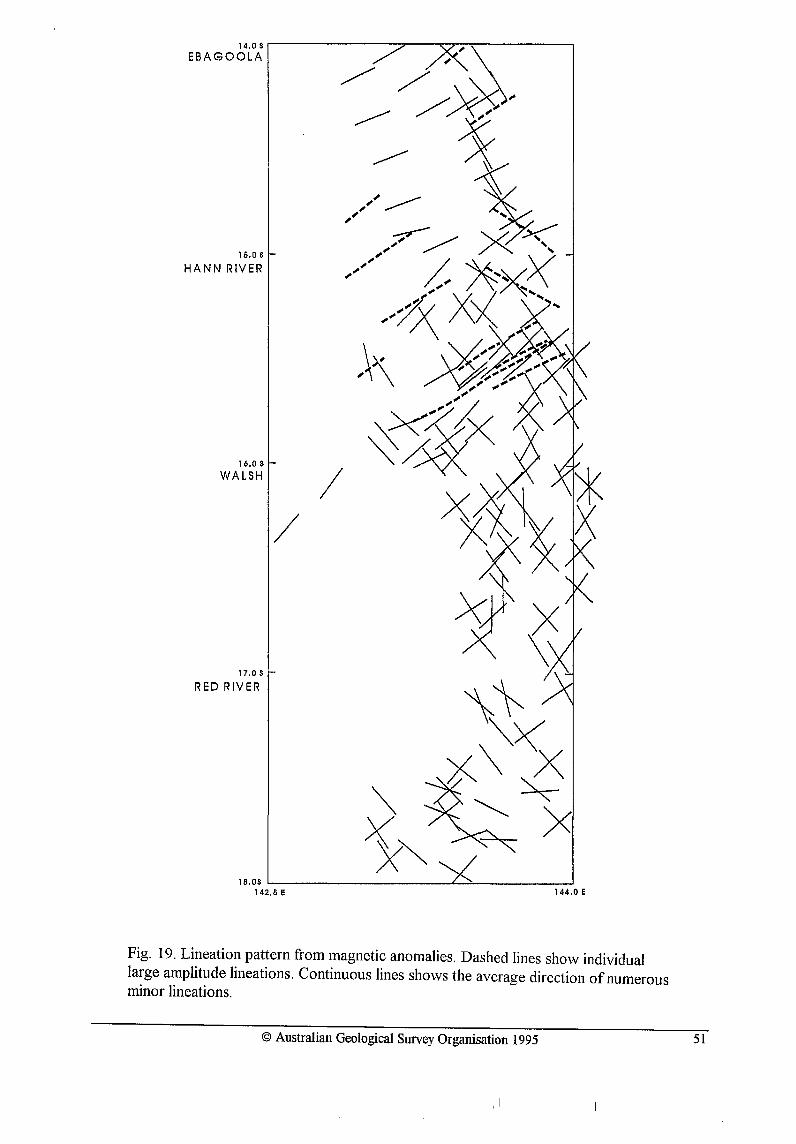
14.0 S ..-----------;l~-~_:_;:__----___,
EBAGOOLA
15.0 S
HANN RIVER
16.0 S
WALSH
17.0 S
RED RIVER
/
18.0S L------------L~-----1-l44.0 E 142.5 E
Fig. 19. Lineation pattern from magnetic anomalies. Dashed lines show individual large amplitude lineations. Continuous lines shows the average direction of numerous minor lineations.
© Australian Geological Survey Organisation 1995
, I
51
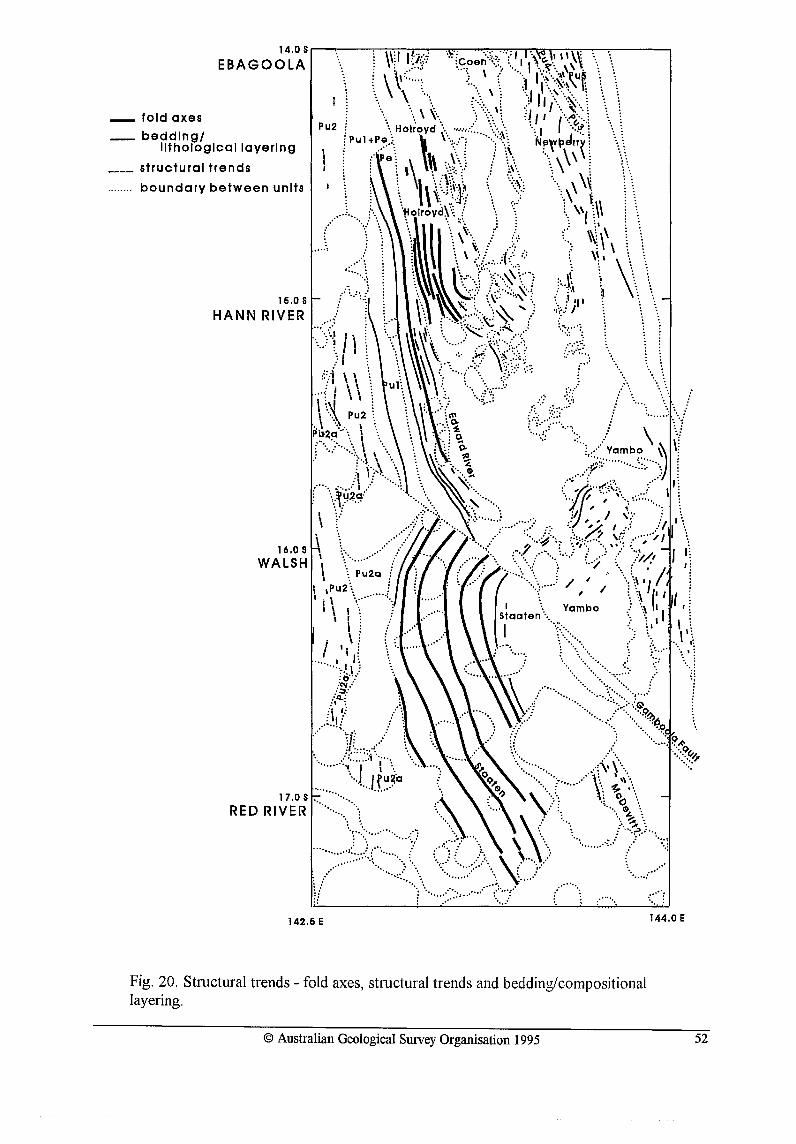
_ fold axes
_ beddlngl lithological layering
____ . structural trends
........ boundary between units
.....
142.6 E
Fig. 20. Structural trends - fold axes, structural trends and bedding/compositional layering.
© Australian Geological Survey Organisation 1995
. ..... .
·::::'f 144.0 E
52
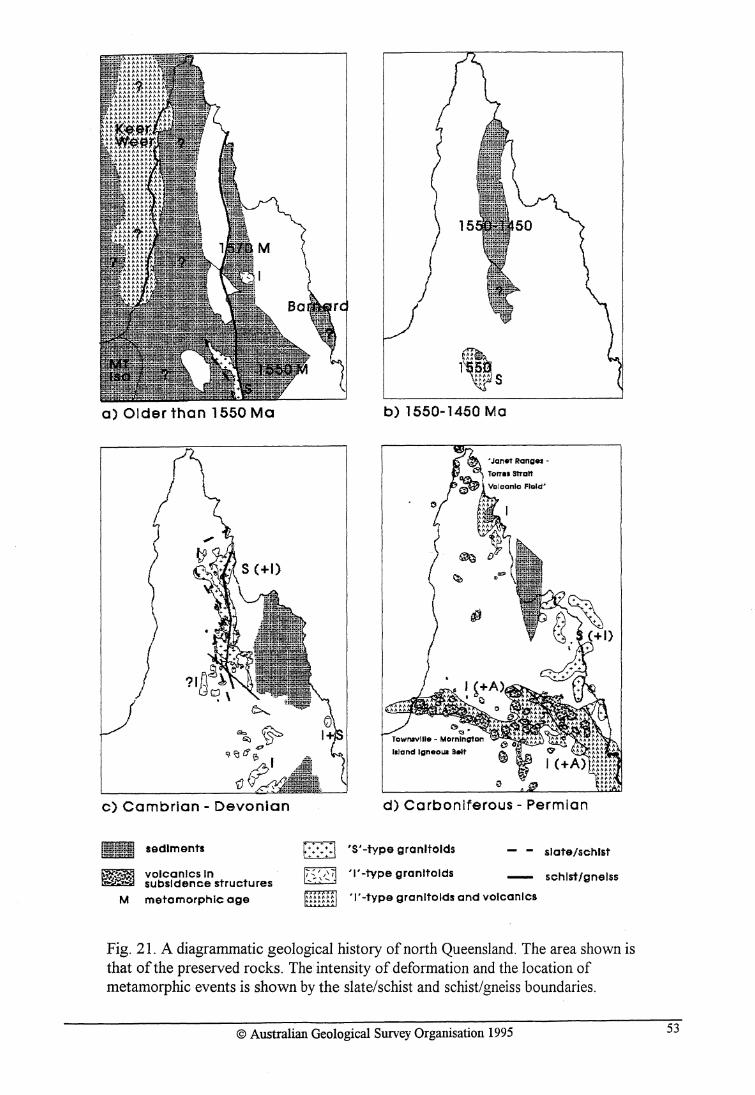
a) Older than 1550 Ma
c) Cambrian - Devonian
M
sediments
volcanics In subsidence structures
metamorphic age
b) 1550-1450 Me
Illand IgneoUi Belt
d) Carboniferous - Permian
~::::::! 'S'-type granitoids slate/schist
I'" / I ~"\ ....... , ..... T -type granitoids schist/gneiss
T-type granitoids and volcanics
Fig. 21. A diagrammatic geological history of north Queensland. The area shown is that of the preserved rocks. The intensity of deformation and the location of metamorphic events is shown by the slate/schist and schist/gneiss boundaries.
© Australian Geological Survey Organisation 1995 53