Embed Size (px)
Citation preview

Interpretation of Airborne Magnetic Data of Upper Benue Trough, Northeastern Nigeria*
Omeje Maxwell1, E.S Joel2, Olusegun Adewoyin2, O. Meludu3 and Okolie T. A. Sociis4
Search and Discovery Article #10888 (2016)** Posted December 12, 2016
*Adapted from extended abstract prepared in conjunction with oral presentation given at AAPG 2016 International Conference and Exhibition, Cancun, Mexico, September 6-9,2016. AAPG © 2016. **Datapages © 2016 Serial rights given by author. For all other rights contact author directly.
1Department of Physics, College of Science and Technology, Covenant University, P.M.B. Ota, Ogun State; Nigeria ([email protected]) 2Department of Physics, College of Science and Technology, Covenant University, P.M.B. Ota, Ogun State; Nigeria 3Department of Physics, Modibbo Adama University of Technology, Yola, Nigeria. 4Department of Mechanical Engineering, College of Engineering, Covenant University, KM 10, Idiroko Road,Ota, Ogun State, Nigeria
Abstract
Compilation of the airborne magnetic data was conducted by digitizing along the flight line, picking the contour values across each flight line over the upper Benue Trough, Northeastern Basement complex Nigeria. It shows complicated arrangement of long wavelength anomalies, with significant magnetic low. The study of airborne magnetic data revealed some features that are interpreted in terms of deep geologic structures with variation in susceptibility of the basement rocks of thick Cretaceous sediments. The NE-SW trending of the lineament map identifies the same trending of the Benue Trough. Such same trending may be inferred to have the same subsurface structural control. The residual magnetic anomaly map towards the SW region which is the location of Dong and Numan is smoother, which is masked off by the effect of the stronger magnetic basement likely to be a sedimentary basin. The NE-SW revelation shows that this basement region is polygenetic and has experienced magmatism, metamorphism, and structural deformations caused by Pan-Africa Orogeny.
Introduction
The magnetic method of exploration is oldest of the geophysical methods. In mineral exploration, it is used for prospecting magnetic minerals (e.g. magnetite, ilmenite, etc.) or non-magnetic minerals where structures controlling their acumination can be mapped because of associated magnetic minerals (Dobrin 1976). In oil exploration, it is ordinary used to determine thickness of sedimentary section or to map structure on the basement surface. This is because sedimentary rocks are non-magnetic for all intents and purposes, compared to the igneous or metamorphic rocks below them, such that practically all the magnetic variations measurable at the surface are associated with topographic or lithological changes at the basement. The depth parameter, which is considered the most universal application of magnetic data (Thompson 1982) allows mapping the surface and topography of basement rocks as well as the thickness of sedimentary cover (Breiner 1973). Estimation of the depth of magnetic source using different methods is preferably applied to profiles of large magnetic data sets. Some geophysicists prefer to use gridded data for a relative simple and quick display, but Phillips (2002) has been addressed that the interpretation of individual profiles is preferable for most geophysicists because they show fine sampling intervals, which generally lead to good understanding of the geology.
The cost of geophysical data acquisition has forced mineral and petroleum exploration companies to rely on the aeromagnetic techniques as an economical method for both reconnaissance and detailed determination of subsurface geological structures. This interest generated an active search for better techniques to process and interprets the volume of date that is being accumulated. This study aimed at verifying the magnetic trend of minerals of interest causing disturbances or anomalies in the intensity of the earth’s magnetic field.
General Geology of the Area The important geological features of the region comprises the sedimentary and volcanic rocks ranging in age from upper Cretaceous to Quaternary overlying and ancient crystalline basement made up mainly of Precambrian granite and gneisses. Some areas are covered by the Benue Alluvium are marshy during most of the rainy season. The extensive igneous activity which took place on the lower Cretaceous of Nigeria was most intense during the late Albian time (Ofoegbu 1985). The intrusions are widely distributed throughout the area and the younger intrusive are represented by volcanic plugs, dykes, and sills in the study area. Smaller dykes of basic masses occasionally produce contact metamorphism in the sediments, characteristic of a short time interval between segmentation, folding, and intrusion (Cratchely and Jones 1965). Figure 1 shows the geology map of the study area.
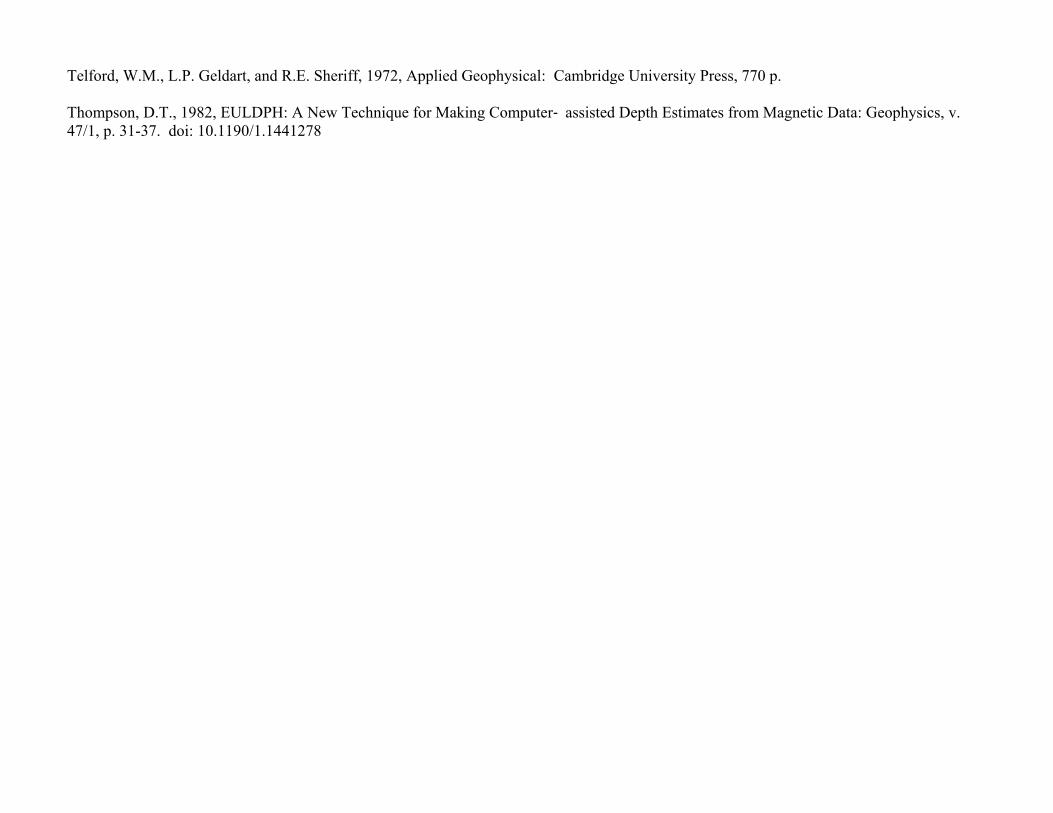
Materials and Method Data Acquisition The dataset used in this study was compiled on 1x1 systems using visual interpolation method. This procedure was adopted from the original data recorded. Four aeromagnetic maps cover the study area. They have index numbers of 174, 175, 195, and 196. These maps were obtained from the Geological Surveys of Nigeria, Kaduna, and Nigeria. The contour lines in all the maps were dense, therefore it was easy to adopt the flight line digitization used with very minimal errors of human judgment. The maps were digitized on a 1x1 system. This spacing imposed a Niquisit Frequency of ½ km-1 so that the narrowest magnetic feature that can be defined by the digitized data has a width of “2” km. The anomalies are much wider than 2 km and therefore lie in a frequency range from aliasing which do not occur with a 1 km digitizing grid. Having digitized each aeromagnetic map, the data were stored in 55x55 coding sheets, each of which contains records of the boundary longitudes and latitudes, the map number, and name of the town overflow. The data were entered into a computer file. The data file thereafter became the input file for a computer program, which picked all the data points row by row, calculate their longitude and latitude, and the magnetic value for coordinates respectively. Each output file for this operation was given a meaningful name for easy identification. The three dimensional coordinates from x, y, z, is made to be acceptable to a contouring package “SURFER 7.0”. The SURFER is a menu-driven interactive computer program, which places each magnetic data point according to their longitude and latitude bearing and thereafter produces contour maps to ensure that they correspond with their respective original maps. The maps are Figure 2, Figure 3, Figure 4 and Figure 5.
The compilation of the aeromagnetic maps of Numan, Dong, Guyuk, and Shelleng form a composite map. The composite aeromagnetic map of the study area was produced by joining the four maps covering the study area together. The computer program used to determine the longitude and latitude for each small map was also used to determine the longitude and latitude for the composite map. This map would be the subject of analysis and interpretation in other section of this work. Figure 5 shows the total magnetic field map of the study area.
Magnetic Data Processing (regional-residual separation) The Polynomial Fitting Method In this work, the polynomial fitting method which is the most flexible and most applied of the analytical methods for determining regional magnetic field (Skeels 1967, Johnson 1969; and Dobrin 1976) was used. In this method, matching of regional by a polynomial surface of low order express the residual features as random error. This treatment is also based on statistical theory. The observe data are used to compute, usually by least square, which is the mathematical describable surface giving the closest fit to the magnetic field that can be the regional field and the residual field is the difference between the magnetic field values as actually mapped and the regional field thus determined. The Least-Square Method The least square method was applied to the study area. Because the study area seemed adequate and reasonable to assume that the regional field is a first polynomial surface. All the regional were therefore calculated as a two dimensional first – degree polynomial surface. To eliminate the regional field, a plane surface was fitted to the data by multiple regression least-squares criteria established by applying the surface equation T(x,y).The values of the coefficients C1, C2, and C3 calculated for the study are as follow C1 = 32841.26, C2 = - 25.51836, and C3 = 47.90632. The mathematical concept of the least squares by (Skeels 1967, Johnson 1969, and Dobrin 1976) was used as described below: T(x,y) = 32841.26 – 25.51836x + 47.90632y. Where x and y are units of spacing of the digitized magnetic data to produce the total filed map as shown in Figure 6. The polynomial coefficients were used to compute the regional map of the study area. The resultant map is shown in Figure 7. A computer program was used to subtract values of the regional filed from the total magnetic field value at grid points. The residual values were contoured using computer software (SURFER 7.0) to produce a residual map of magnetic anomalies. The data were inputted into the contouring software program, which automatically generated contours over the area. The residual magnetic anomaly contour map is shown in Figure 8a and Figure 8b, but Figure 8b has the contours filled with arrangement from magnetic low. The 3-D version of Figure 8a is presented in Figure 9.
Discussion The regional field map in Figure 7 revealed a trend of NE-SW and E-W geological characteristics. On the residual Figure 8a, the situation looks different because the contour lines of the total residual magnetic field are concentrated more in the northern and southern part of the study area. This may be explained that the basement complex outcropping here is not homogeneous mineralogically. In addition, the presence of faults in the area which are mainly basement faults, while others are granitic and pegmatitic dykes is in agreement with the Cornachia and Dars (1983) investigation. This inferred zone may be interpreted as major fracture zones of the weakness within the trough. And Cornachia and Dars (1983) reported an ENE-WSW trend as a foliation direction produced as a late Pan African event. Some of the ENE-NSW lineament is seen to be south and northeast of the total field map. The NE-SW lineaments are found more towards the northeast and southwestern part of the study area with some extension in the southwest of the study area. They mainly affected by the Pan Africa granite. This structural direction is related to the West African rift system made up of the northeasterly Benue Trough and Cameroon volcanic line (Flitton 1983 and Bassey 2006). From the 3-D residual magnetic field, the area within Dong and Numan is likely to be a sedimentary basin which is W-E trending. It shows that the magnetic field there is smoother with weathered overburden. The occurrence of residual positive anomaly at the NW of Guyuk has maximum amplitude ranging from 80 to 100 nT. Significantly, the SE of Naman which presumed to be Ngurore basalt has maximum amplitude ranging from 40 to 70 nT.
Conclusion This study throws more lights on the magnetic nature of the upper Benue with the identification of NE-SW trending faults in the area which correlate with the geology of the area. This shows that the Benue Trough trends NE-SW and have the same structural control as the Benue Trough.
Acknowledgment The authors of this present study would like to thank Federal University of Technology, Yola now known as Modibbo Adama University of Technology, Yola for providing materials for the execution of this present study. Also, thanks to the management of the Covenant University, Ota, Ogun State for their financial support to actualize this study.
References Cited Bassey, N.E., 2006, Structure of Madagali Hill's NE Nigeria from Airborne Magnetic and Satellite Data over Hawal Basement Complex: Global Journal of Geological Science, v. 4/1, p. 73-78. Breiner, S., 1973, Application Manual for Portable Magnetometers: Geometrics, Sunnyvale, CA, 58 p. Cornachia, M., and Dars, R., 1983, Un trait structural majeur du continent africain: les line´aments centrafricains du Cameroun au golfe d’Aden: Bulletin de la Socie´te´ Ge´ologique de France 25, p. 101-109.

Cratchely, C.B., and G.P. Jones, 1965, An Interpretation of the Geologic and Gravity Anomalies of the Benue Valley, Nigeria: Overseas Geological Survey, London, Geophysical Paper, No. 1. Dobrin, M.B., 1976, Introduction to Geophysical Prospecting: McGraw-Hill, NY, 630 p. ISBN-10: 0070171955 Ekwueme, B.N., 1994, Structural Features of Southern Obudu Plateau, Bamenda Massif, SE Nigeria: Preliminary Interpretations: Journal of Mining Geology, v. 30/1, p.45-49. Ekwueme, B.N., 2003, The Precambrian Geology and Evolution of the Southeastern Nigerian Basement Complex: University of Calabar Press, 135 p. Ene, K.E., and W.C. Mbonu, 1988, The Metasedimentary Belts of Nigerian Basement Complex: Facts, Fallacies and New Frontiers, in P.O. Oluiyide (ed.), Precambrian Geology of Nigeria: Geological Survey of Nigeria Publication, p. 53-67. Fitton, J.G., 1983, Active Versus Passive Continental Rifting: Evidence from the West African Rift System: Tectonophysics, v. 94, p. 473-481. Geological Survey of Nigeria, 2005, Geological Map of Nigeria, Scale, 1: 200,000. Johnson, W.W., 1969, The Least-squares Method of Interpreting Magnetic Anomalies Caused by Two Dimensional Structures: Geophysics, v. 34, p. 65-74. Nur, A., 2001, Spectral Analysis and Hilbert Transformation of Gravity Data over Southwest of Chad Basin, Nigeria: Journal of Mining Geology, v. 37/2, p. 9-98. Odeyemy, I.B., Y.B. Anifowose, and Y.A. Asiwuja-Bello, 1999, Multitechnique Graphical Analysis of Fractures from Remote Sensing Images of Basement Regions of Nigeria: Journal of Mining Geology, 35/1, p. 9-21. Oluiyide, P.O., 1988, Structural Trends in the Nigerian Basement Complex, in P.O Oluiyide (ed.), Precambrian Geology of Nigeria: Geological Survey of Nigeria, Kaduna, p.93-98. Ofuegbu, C.O., 1985, Interpretation of a Linear Magnetic Features near Mutum Biyu, Nigeria: Revister Brasiteria Geoscience, v. 3/1, p. 91-95. Phillips, J.D., 2002, Processing and Interpretation of Aeromagnetic Data for the Santa Cruz Basin-Patagonia Mountains Area, South-Central Arizona: U.S. Geological Survey Open-File Report 02-98. Skeels, D.C., 1967, What Is Residual Gravity?: Geophysics, v. 32/5, p. 872-876. doi: 10.1190/1.1439896
Telford, W.M., L.P. Geldart, and R.E. Sheriff, 1972, Applied Geophysical: Cambridge University Press, 770 p. Thompson, D.T., 1982, EULDPH: A New Technique for Making Computer‐ assisted Depth Estimates from Magnetic Data: Geophysics, v. 47/1, p. 31-37. doi: 10.1190/1.1441278

Figure 1. Geological Map of the Study Area (After Geological Survey of Nigeria Agency, 2005).
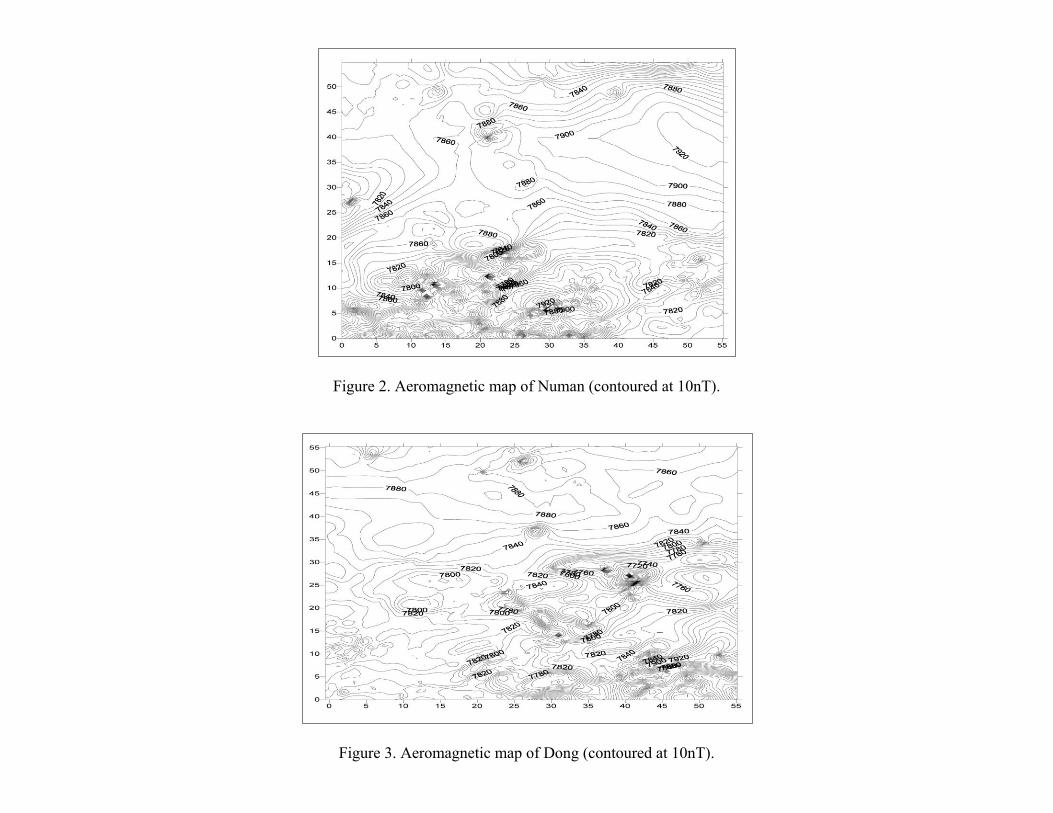
Figure 2. Aeromagnetic map of Numan (contoured at 10nT).
Figure 3. Aeromagnetic map of Dong (contoured at 10nT).
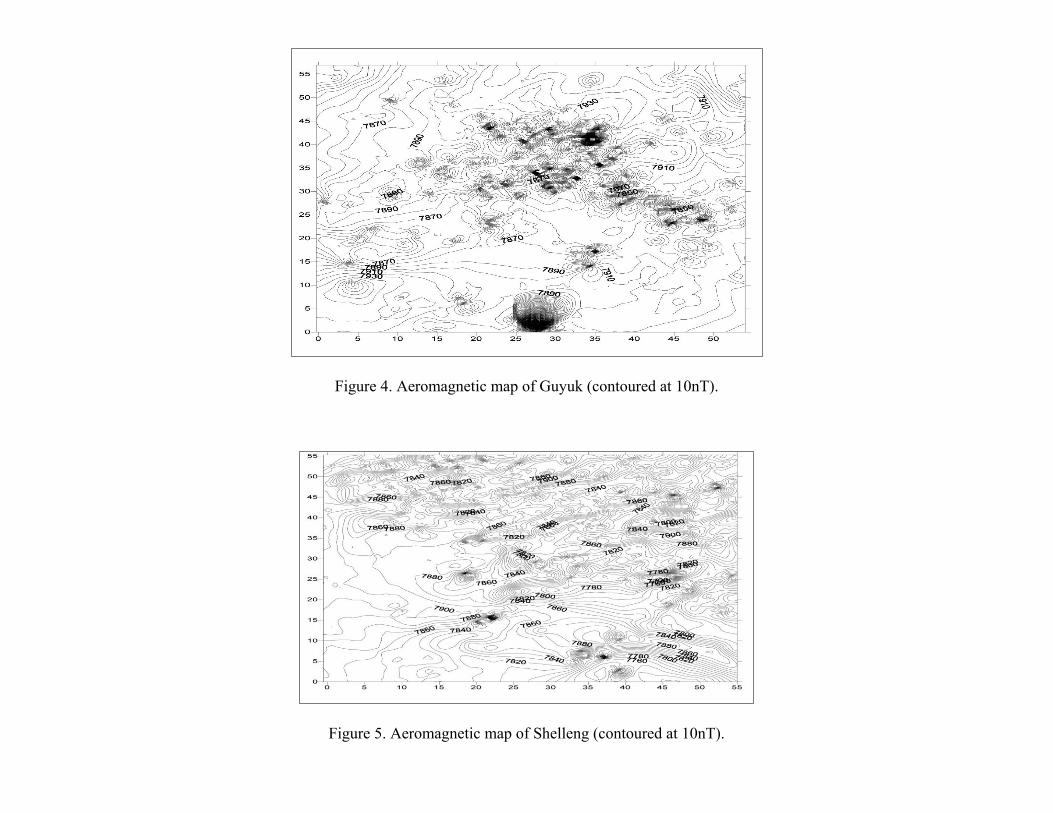
Figure 4. Aeromagnetic map of Guyuk (contoured at 10nT).
Figure 5. Aeromagnetic map of Shelleng (contoured at 10nT).

Figure 6. Total Aeromagnetic field of the study area (contoured at 10nT).
Figure 7. Regional field map of the study area (contoured at 5nT).
Figure 8a. Residual map of the study area (contoured at 10nT).
Figure 8b. Residual magnetic map of the study area (contoured in 10nT).

Figure 9. 3-D Residual magnetic anomaly map of the study area.


![Petroleum Potentials of the Nigerian Benue Trough and ... · the Central Benue Trough[30] perhaps caused by a com- pressional event In the Central Benue Trough, [31,32]. the regressive](https://img.pdfslide.us/doc/110x75/5f08f7a67e708231d42497ec/petroleum-potentials-of-the-nigerian-benue-trough-and-the-central-benue-trough30.jpg)