Embed Size (px)
Citation preview
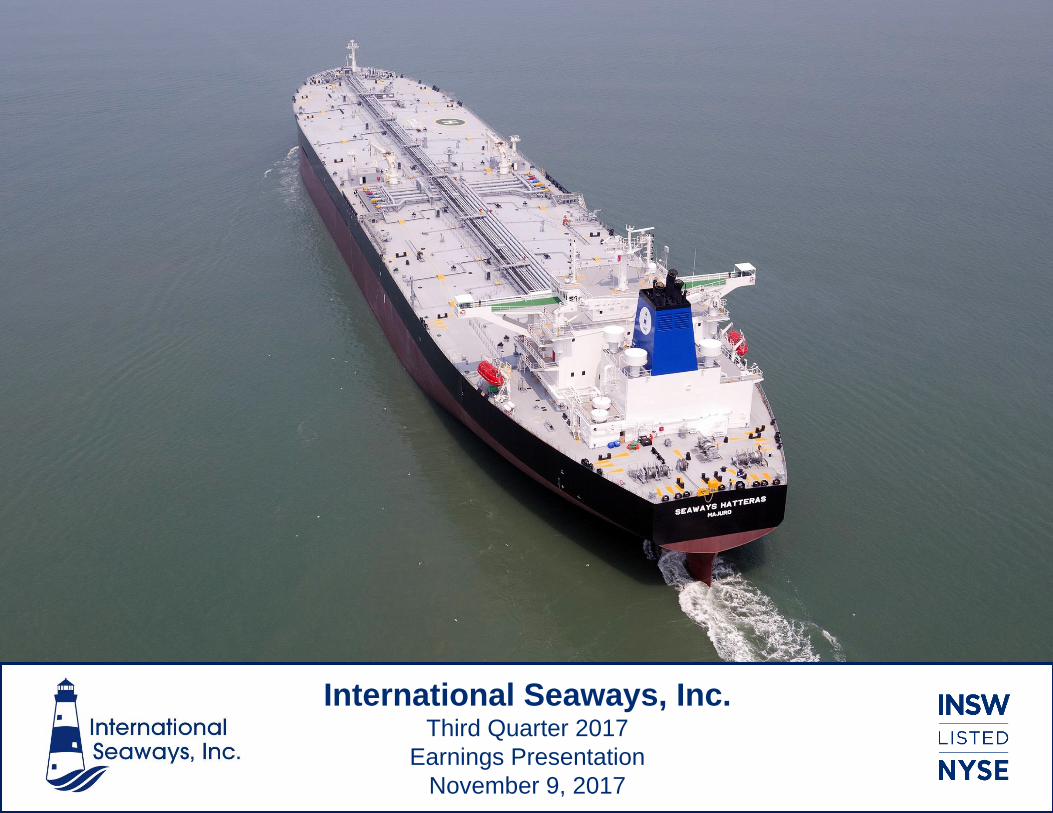
International Seaways, Inc.
1
International Seaways, Inc.Third Quarter 2017
Earnings Presentation
November 9, 2017
International Seaways, Inc.2
Disclaimer
Forward-Looking StatementsDuring the course of this presentation, the Company (International Seaways, Inc. (INSW)) may make forward-looking statements or provide forward-looking information. All statements other than statements of historical facts should be considered forward-looking statements. Some of these statements include words such as ‘‘outlook,’’ ‘‘believe,’’ ‘‘expect,’’ ‘‘potential,’’ ‘‘continue,’’ ‘‘may,’’ ‘‘will,’’ ‘‘should,’’ ‘‘could,’’ ‘‘seek,’’ ‘‘predict,’’ ‘‘intend,’’ ‘‘plan,’’ ‘‘estimate,’’ ‘‘anticipate,’’ ‘‘target,’’ ‘‘project,’’ ‘‘forecast,’’ ‘‘shall,’’ ‘‘contemplate’’ or the negative version of those words or other comparable words. Although they reflect INSW’s current expectations, these statements are not guarantees of future performance, but involve a number of risks, uncertainties, and assumptions which are difficult to predict. Some of the factors that may cause actual outcomes and results to differ materially from those expressed in, or implied by, the forward-looking statements include, but are not necessarily limited to, general economic conditions, competitive pressures, the nature of the Company’s services and their price movements, and the ability to retain key employees. The Company does not undertake to update any forward-looking statements as a result of future developments, new information or otherwise.
Non-GAAP Financial MeasuresIncluded in this presentation are certain non-GAAP financial measures, including Time Charter Equivalent (“TCE”) revenue, EBITDA, Adjusted EBITDA, and total leverage ratios, designed to complement the financial information presented in accordance with generally accepted accounting principles in the United States of America because management believes such measures are useful to investors. TCE revenues, which represents shipping revenues less voyage expenses, is a measure to compare revenue generated from a voyage charter to revenue generated from a time charter. EBITDA represents net (loss)/income before interest expense, income taxes and depreciation and amortization expense. Adjusted EBITDA consists of EBITDA adjusted for the impact of certain items that we do not consider indicative of our ongoing operating performance. Total leverage ratios are calculated as total debt divided by Adjusted EBITDA. We present non-GAAP measures when we believe that the additional information is useful and meaningful to investors. Non-GAAP financial measures do not have any standardized meaning and are therefore unlikely to be comparable to similar measures presented by other companies. The presentation of non-GAAP financial measures is not intended to be a substitute for, and should not be considered in isolation from, the financial measures reported in accordance with GAAP. See Appendix for a reconciliation of certain non-GAAP measures to the comparable GAAP measures.
This presentation also contains estimates and other information concerning our industry that are based on industry publications, surveys and forecasts. This information involves a number of assumptions and limitations, and we have not independently verified the accuracy or completeness of the information.
Additional Information You should read the Company’s Quarterly Report on Form 10-Q for the quarter ended September 30, 2017, and the other documents the Company has filed with the SEC for additional information regarding the Company, its operations and the risks and uncertainties it faces. You may obtain these documents for free by visiting EDGAR on the SEC Web site at www.sec.gov, or from the Company’s website at www.intlseas.com.
Business Review – Lois K. Zabrocky, President & CEO
International Seaways, Inc.4
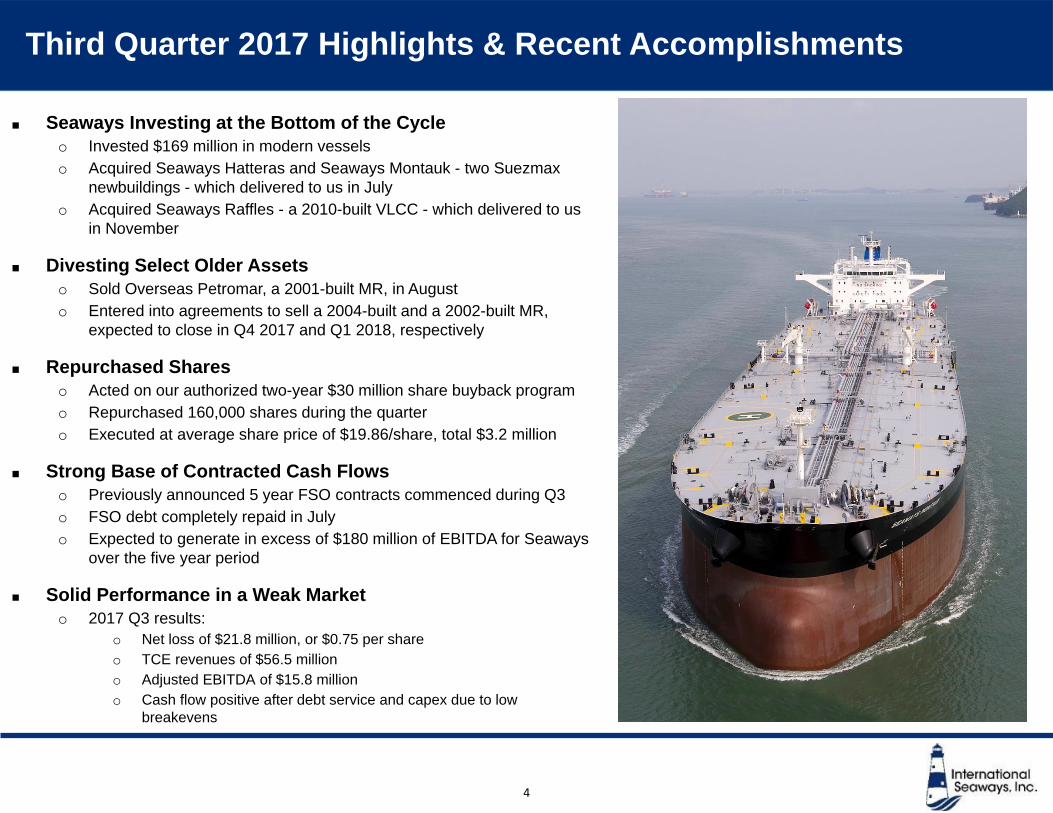
Third Quarter 2017 Highlights & Recent Accomplishments
Seaways Investing at the Bottom of the Cycle
o Invested $169 million in modern vessels
o Acquired Seaways Hatteras and Seaways Montauk - two Suezmax
newbuildings - which delivered to us in July
o Acquired Seaways Raffles - a 2010-built VLCC - which delivered to us
in November
Divesting Select Older Assets
o Sold Overseas Petromar, a 2001-built MR, in August
o Entered into agreements to sell a 2004-built and a 2002-built MR,
expected to close in Q4 2017 and Q1 2018, respectively
Repurchased Shares
o Acted on our authorized two-year $30 million share buyback program
o Repurchased 160,000 shares during the quarter
o Executed at average share price of $19.86/share, total $3.2 million
Strong Base of Contracted Cash Flows
o Previously announced 5 year FSO contracts commenced during Q3
o FSO debt completely repaid in July
o Expected to generate in excess of $180 million of EBITDA for Seaways
over the five year period
Solid Performance in a Weak Market
o 2017 Q3 results:
o Net loss of $21.8 million, or $0.75 per share
o TCE revenues of $56.5 million
o Adjusted EBITDA of $15.8 million
o Cash flow positive after debt service and capex due to low
breakevens
International Seaways, Inc.
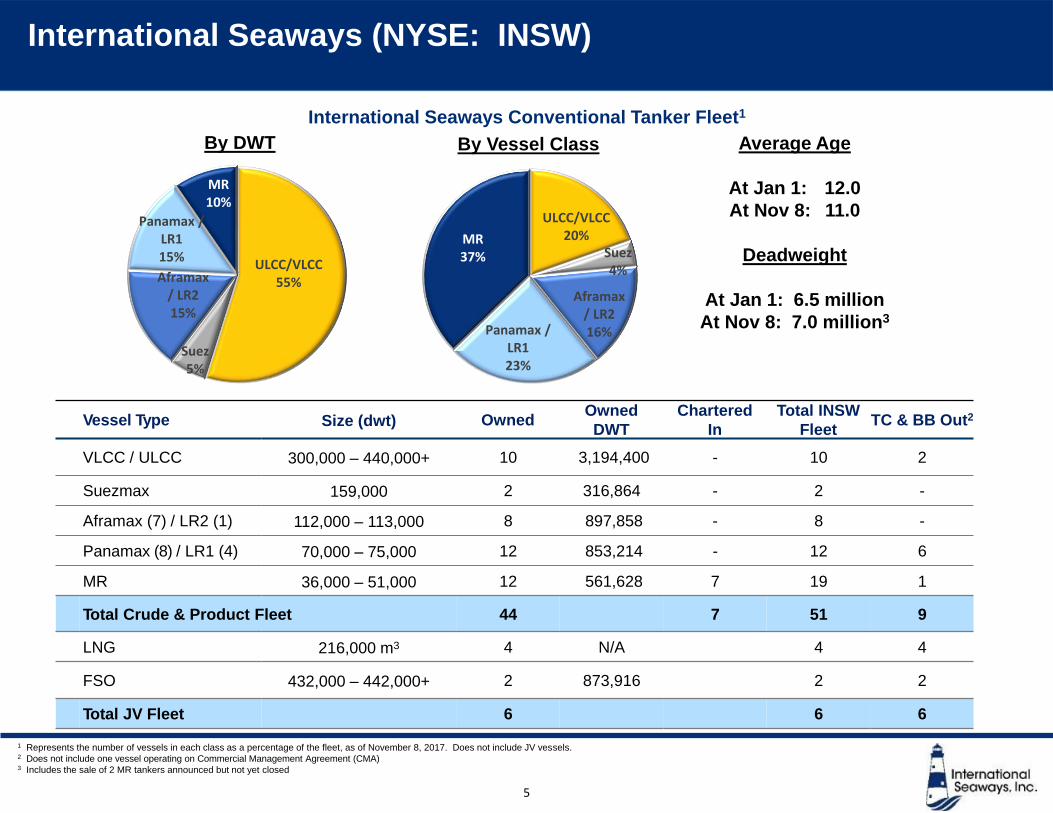
International Seaways (NYSE: INSW)
Vessel Type Size (dwt) OwnedOwned
DWT
Chartered
In
Total INSW
FleetTC & BB Out2
VLCC / ULCC 300,000 – 440,000+ 10 3,194,400 - 10 2
Suezmax 159,000 2 316,864 - 2 -
Aframax (7) / LR2 (1) 112,000 – 113,000 8 897,858 - 8 -
Panamax (8) / LR1 (4) 70,000 – 75,000 12 853,214 - 12 6
MR 36,000 – 51,000 12 561,628 7 19 1
Total Crude & Product Fleet 44 7 51 9
LNG 216,000 m3 4 N/A 4 4
FSO 432,000 – 442,000+ 2 873,916 2 2
Total JV Fleet 6 6 6
5
International Seaways Conventional Tanker Fleet1
ULCC/VLCC20%
Suez4%
Aframax / LR216%Panamax /
LR123%
MR37%
By Vessel Class
ULCC/VLCC55%
Suez5%
Aframax / LR215%
Panamax / LR115%
MR10%
By DWT Average Age
At Jan 1: 12.0
At Nov 8: 11.0
Deadweight
At Jan 1: 6.5 million
At Nov 8: 7.0 million3
1 Represents the number of vessels in each class as a percentage of the fleet, as of November 8, 2017. Does not include JV vessels.2 Does not include one vessel operating on Commercial Management Agreement (CMA)3 Includes the sale of 2 MR tankers announced but not yet closed
International Seaways, Inc.
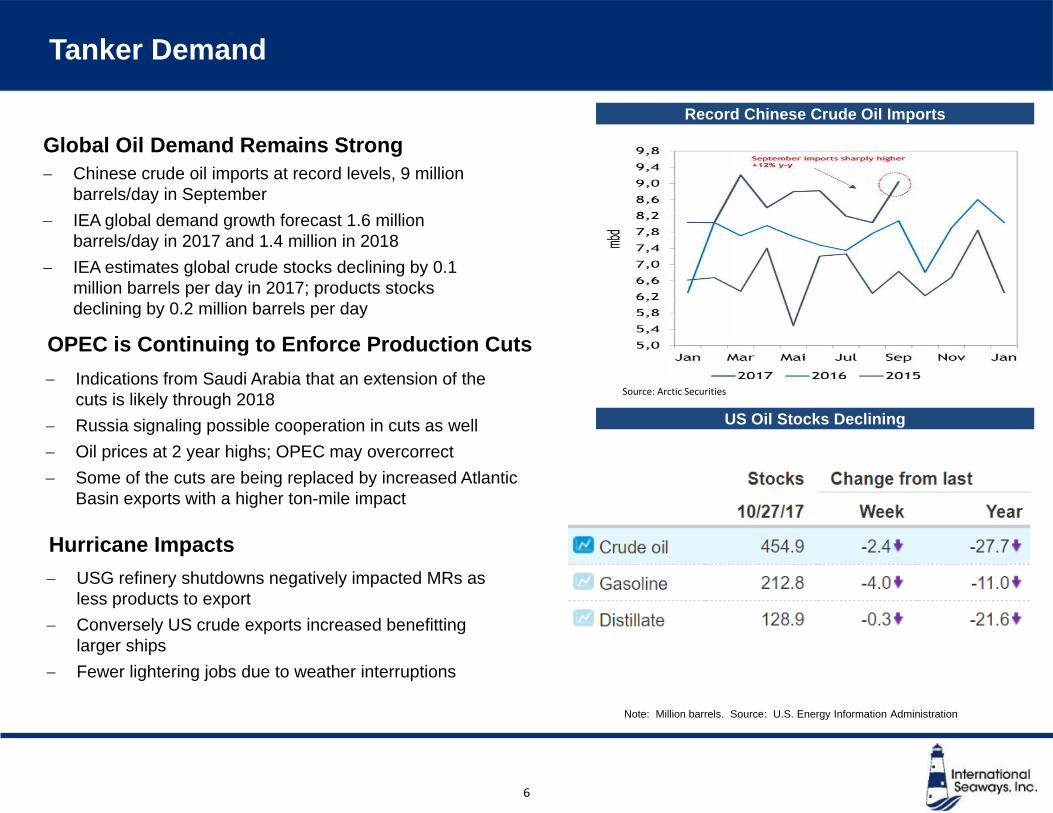
Tanker Demand
Source: Arctic Securities
OPEC is Continuing to Enforce Production Cuts
Indications from Saudi Arabia that an extension of the
cuts is likely through 2018
Russia signaling possible cooperation in cuts as well
Oil prices at 2 year highs; OPEC may overcorrect
Some of the cuts are being replaced by increased Atlantic
Basin exports with a higher ton-mile impact
Global Oil Demand Remains Strong
Chinese crude oil imports at record levels, 9 million
barrels/day in September
IEA global demand growth forecast 1.6 million
barrels/day in 2017 and 1.4 million in 2018
IEA estimates global crude stocks declining by 0.1
million barrels per day in 2017; products stocks
declining by 0.2 million barrels per day
Hurricane Impacts
USG refinery shutdowns negatively impacted MRs as
less products to export
Conversely US crude exports increased benefitting
larger ships
Fewer lightering jobs due to weather interruptions
Record Chinese Crude Oil Imports
6
Note: Million barrels. Source: U.S. Energy Information Administration
US Oil Stocks Declining
International Seaways, Inc.
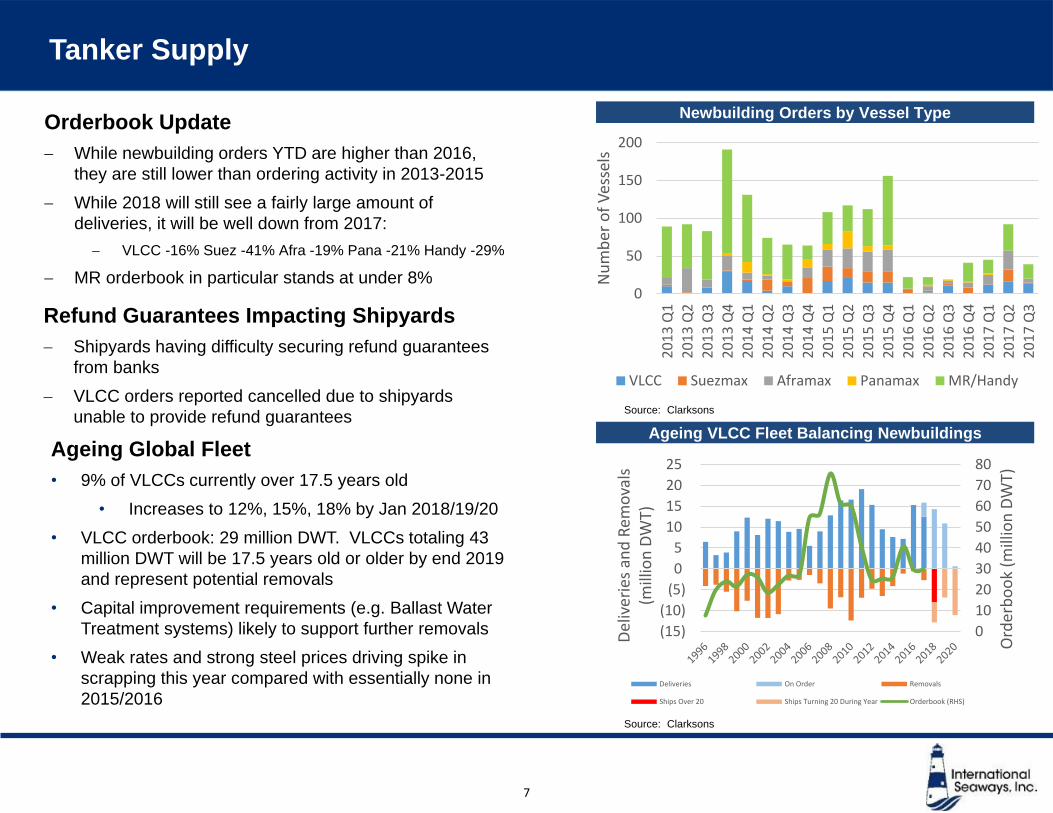
Newbuilding Orders by Vessel Type
Tanker Supply
Orderbook Update
While newbuilding orders YTD are higher than 2016,
they are still lower than ordering activity in 2013-2015
While 2018 will still see a fairly large amount of
deliveries, it will be well down from 2017:
VLCC -16% Suez -41% Afra -19% Pana -21% Handy -29%
MR orderbook in particular stands at under 8%
Refund Guarantees Impacting Shipyards
Shipyards having difficulty securing refund guarantees
from banks
VLCC orders reported cancelled due to shipyards
unable to provide refund guarantees
7
Source: Clarksons
Ageing VLCC Fleet Balancing Newbuildings
Source: Clarksons
0
10
20
30
40
50
60
70
80
(15)
(10)
(5)
0
5
10
15
20
25
Ord
erb
oo
k (m
illio
n D
WT)
Del
iver
ies
and
Rem
ova
ls
(mill
ion
DW
T)
Deliveries On Order Removals
Ships Over 20 Ships Turning 20 During Year Orderbook (RHS)
0
50
100
150
200
20
13
Q1
20
13
Q2
20
13
Q3
20
13
Q4
20
14
Q1
20
14
Q2
20
14
Q3
20
14
Q4
20
15
Q1
20
15
Q2
20
15
Q3
20
15
Q4
20
16
Q1
20
16
Q2
20
16
Q3
20
16
Q4
20
17
Q1
20
17
Q2
20
17
Q3
Nu
mb
er o
f V
esse
ls
VLCC Suezmax Aframax Panamax MR/Handy
Ageing Global Fleet
• 9% of VLCCs currently over 17.5 years old
• Increases to 12%, 15%, 18% by Jan 2018/19/20
• VLCC orderbook: 29 million DWT. VLCCs totaling 43
million DWT will be 17.5 years old or older by end 2019
and represent potential removals
• Capital improvement requirements (e.g. Ballast Water
Treatment systems) likely to support further removals
• Weak rates and strong steel prices driving spike in
scrapping this year compared with essentially none in
2015/2016

Financial Review – Jeffrey D. Pribor, SVP & CFO
International Seaways, Inc.
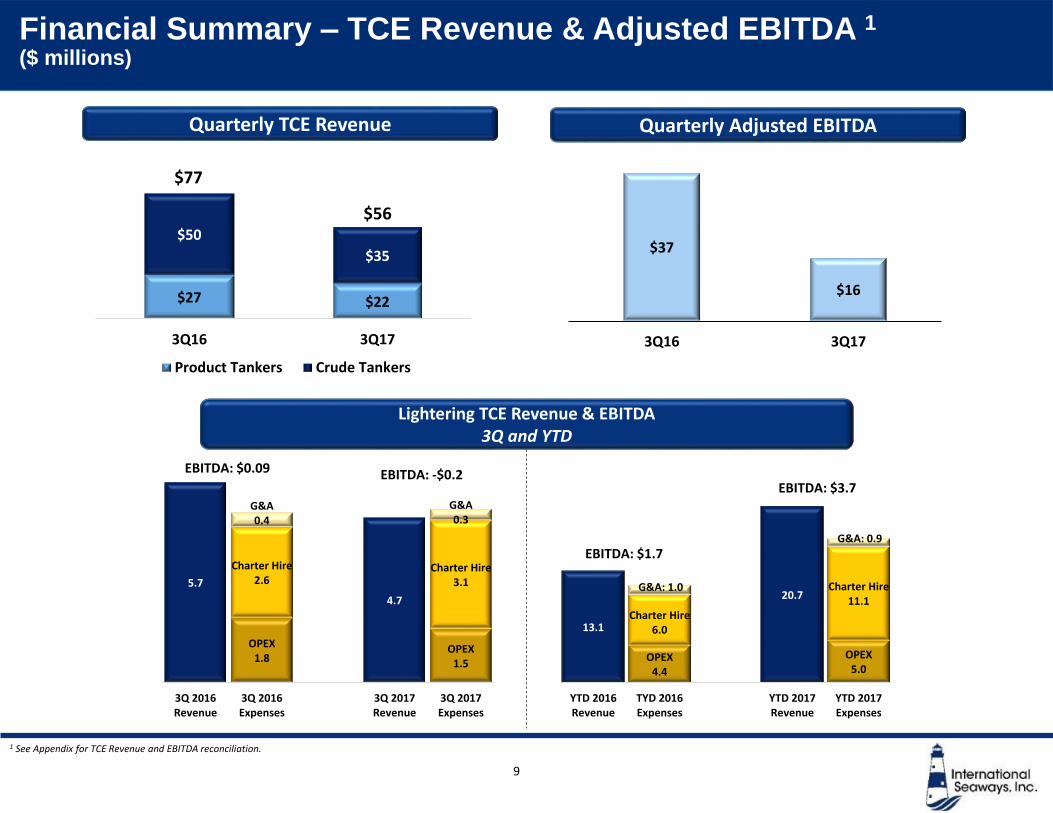
Financial Summary – TCE Revenue & Adjusted EBITDA 1($ millions)
Quarterly Adjusted EBITDA
9
Lightering TCE Revenue & EBITDA3Q and YTD
5.7
OPEX 1.8
4.7
OPEX 1.5
Charter Hire2.6
Charter Hire3.1
G&A0.4
G&A0.3
3Q 2016Revenue
3Q 2016Expenses
3Q 2017Revenue
3Q 2017Expenses
EBITDA: $0.09 EBITDA: -$0.2
Quarterly TCE Revenue
$27 $22
$50
$35
3Q16 3Q17
Product Tankers Crude Tankers
$77
$56
$37
$16
3Q16 3Q17
1 See Appendix for TCE Revenue and EBITDA reconciliation.
13.1
OPEX4.4
20.7
OPEX5.0
Charter Hire6.0
Charter Hire11.1
G&A: 1.0
G&A: 0.9
YTD 2016Revenue
TYD 2016Expenses
YTD 2017Revenue
YTD 2017Expenses
EBITDA: $1.7
EBITDA: $3.7
International Seaways, Inc.
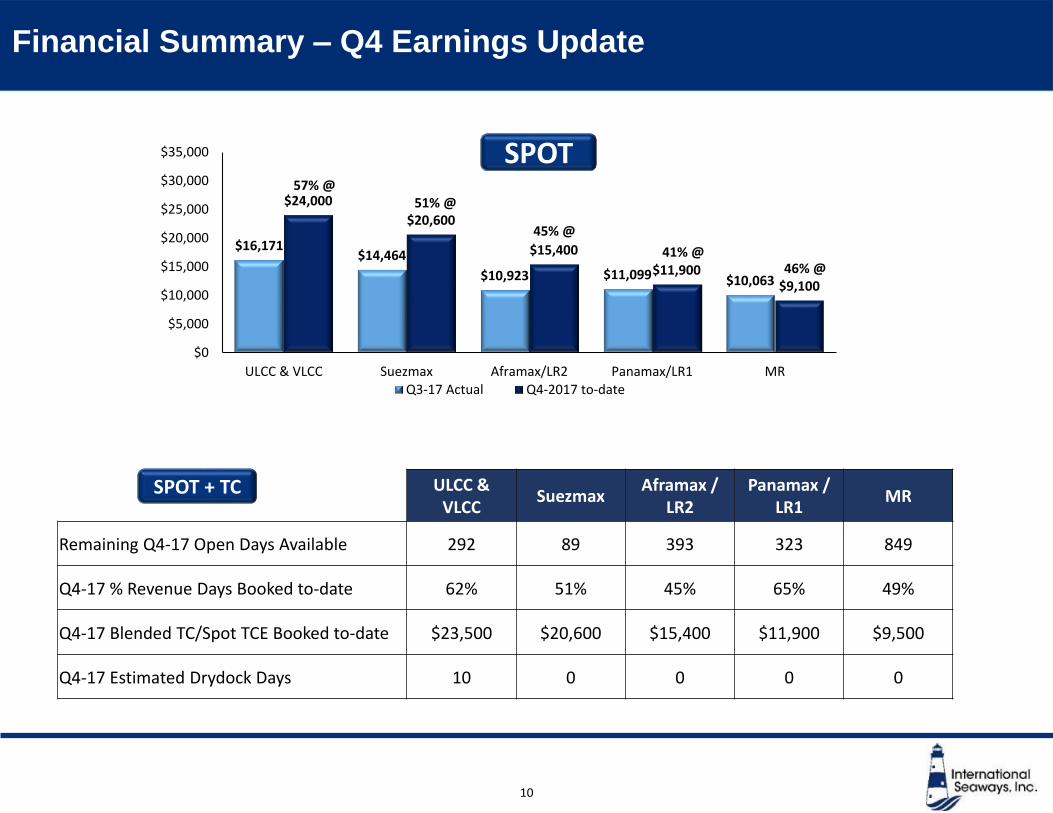
Financial Summary – Q4 Earnings Update
$16,171$14,464
$10,923 $11,099 $10,063
$24,000
$20,600
$15,400
$11,900$9,100
$0
$5,000
$10,000
$15,000
$20,000
$25,000
$30,000
$35,000
ULCC & VLCC Suezmax Aframax/LR2 Panamax/LR1 MRQ3-17 Actual Q4-2017 to-date
ULCC & VLCC
SuezmaxAframax /
LR2Panamax /
LR1MR
Remaining Q4-17 Open Days Available 292 89 393 323 849
Q4-17 % Revenue Days Booked to-date 62% 51% 45% 65% 49%
Q4-17 Blended TC/Spot TCE Booked to-date $23,500 $20,600 $15,400 $11,900 $9,500
Q4-17 Estimated Drydock Days 10 0 0 0 0
10
57% @
45% @
41% @46% @
SPOT
SPOT + TC
51% @
International Seaways, Inc.
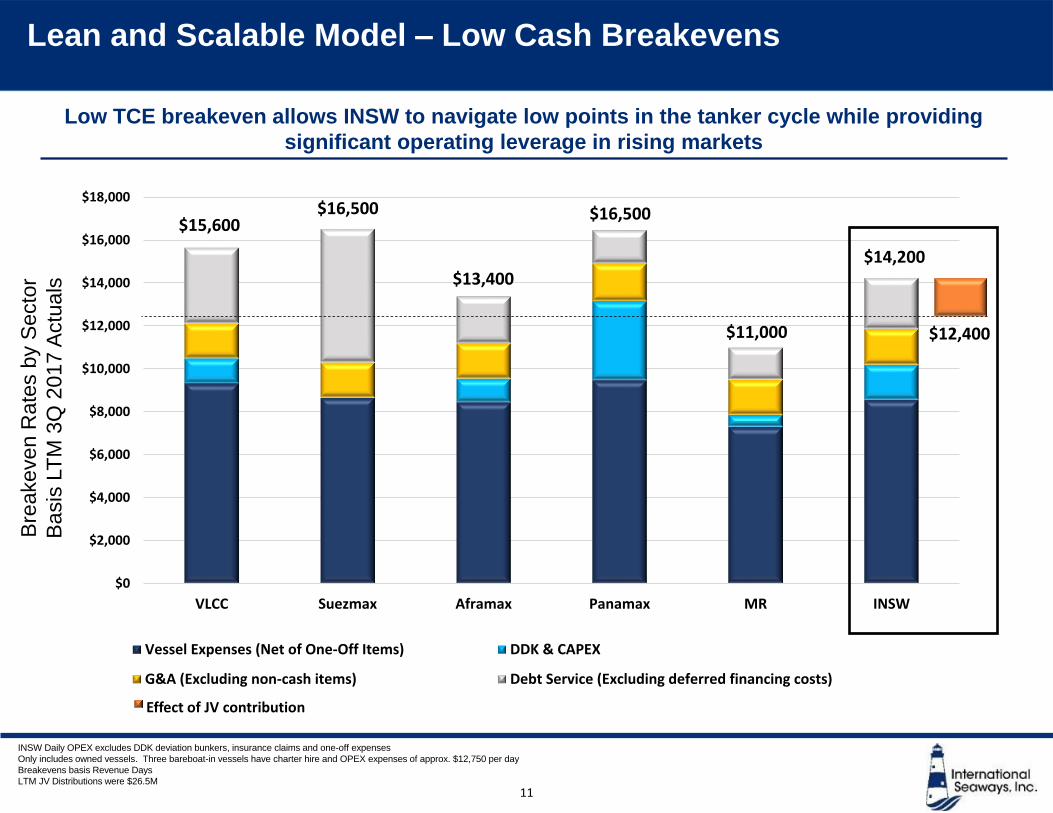
Lean and Scalable Model – Low Cash Breakevens
11
INSW Daily OPEX excludes DDK deviation bunkers, insurance claims and one-off expenses
Only includes owned vessels. Three bareboat-in vessels have charter hire and OPEX expenses of approx. $12,750 per day
Breakevens basis Revenue Days
LTM JV Distributions were $26.5M
Low TCE breakeven allows INSW to navigate low points in the tanker cycle while providing
significant operating leverage in rising markets
Bre
ake
ve
n R
ate
s b
y S
ecto
r
Ba
sis
LT
M 3
Q 2
01
7 A
ctu
als
$0
$2,000
$4,000
$6,000
$8,000
$10,000
$12,000
$14,000
$16,000
$18,000
VLCC Suezmax Aframax Panamax MR INSW
Vessel Expenses (Net of One-Off Items) DDK & CAPEX
G&A (Excluding non-cash items) Debt Service (Excluding deferred financing costs)
$15,600
$13,400
$16,500
$11,000
$14,200
$16,500
$12,400
Effect of JV contribution
International Seaways, Inc.
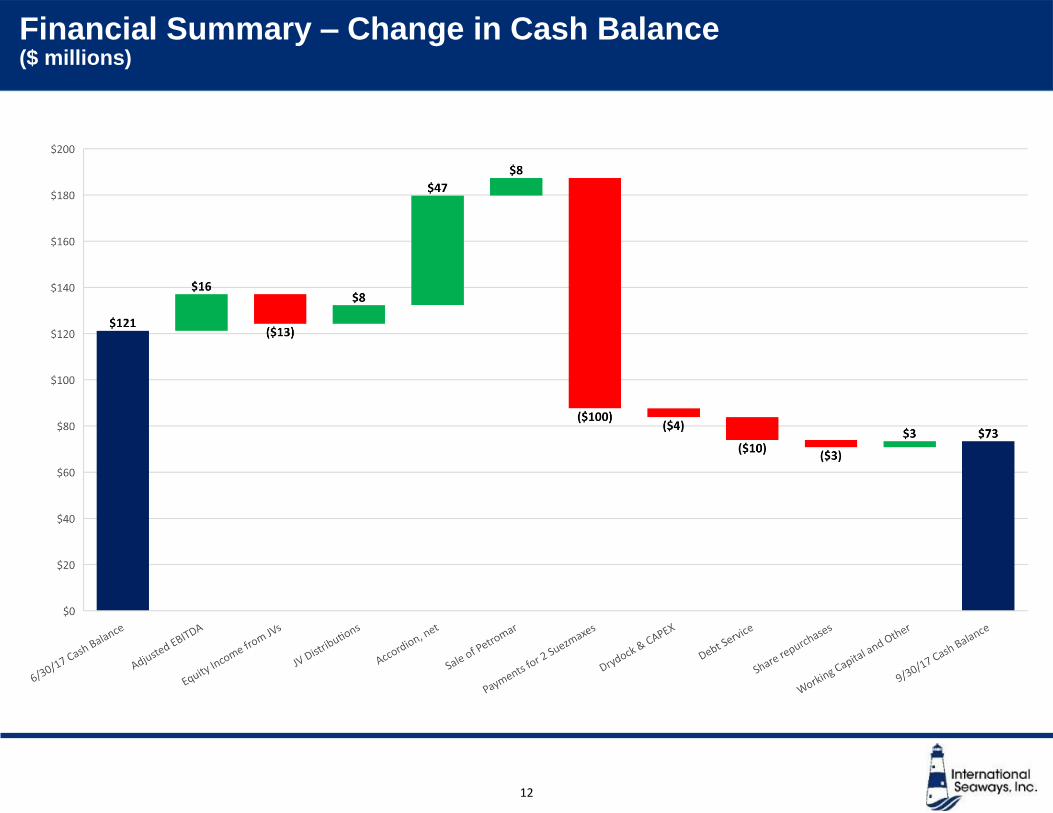
Financial Summary – Change in Cash Balance ($ millions)
12
International Seaways, Inc.
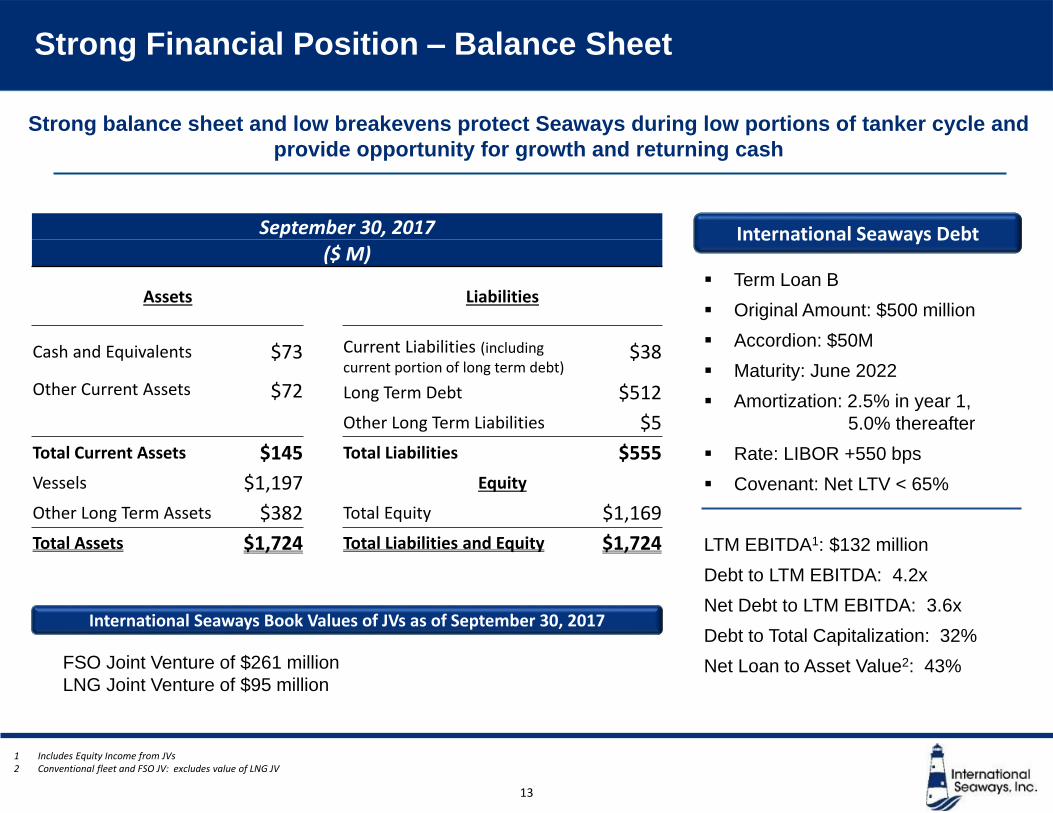
Strong Financial Position – Balance Sheet
13
Strong balance sheet and low breakevens protect Seaways during low portions of tanker cycle and
provide opportunity for growth and returning cash
▪ Term Loan B
▪ Original Amount: $500 million
▪ Accordion: $50M
▪ Maturity: June 2022
▪ Amortization: 2.5% in year 1,
5.0% thereafter
▪ Rate: LIBOR +550 bps
▪ Covenant: Net LTV < 65%
LTM EBITDA1: $132 million
Debt to LTM EBITDA: 4.2x
Net Debt to LTM EBITDA: 3.6x
Debt to Total Capitalization: 32%
Net Loan to Asset Value2: 43%
International Seaways Debt
1 Includes Equity Income from JVs2 Conventional fleet and FSO JV: excludes value of LNG JV
FSO Joint Venture of $261 million
LNG Joint Venture of $95 million
International Seaways Book Values of JVs as of September 30, 2017
September 30, 2017($ M)
Assets Liabilities
Cash and Equivalents $73 Current Liabilities (including current portion of long term debt)
$38
Other Current Assets $72 Long Term Debt $512
Other Long Term Liabilities $5
Total Current Assets $145 Total Liabilities $555
Vessels $1,197 Equity
Other Long Term Assets $382 Total Equity $1,169
Total Assets $1,724 Total Liabilities and Equity $1,724
Summary – Lois K. Zabrocky, President & CEO
International Seaways, Inc.
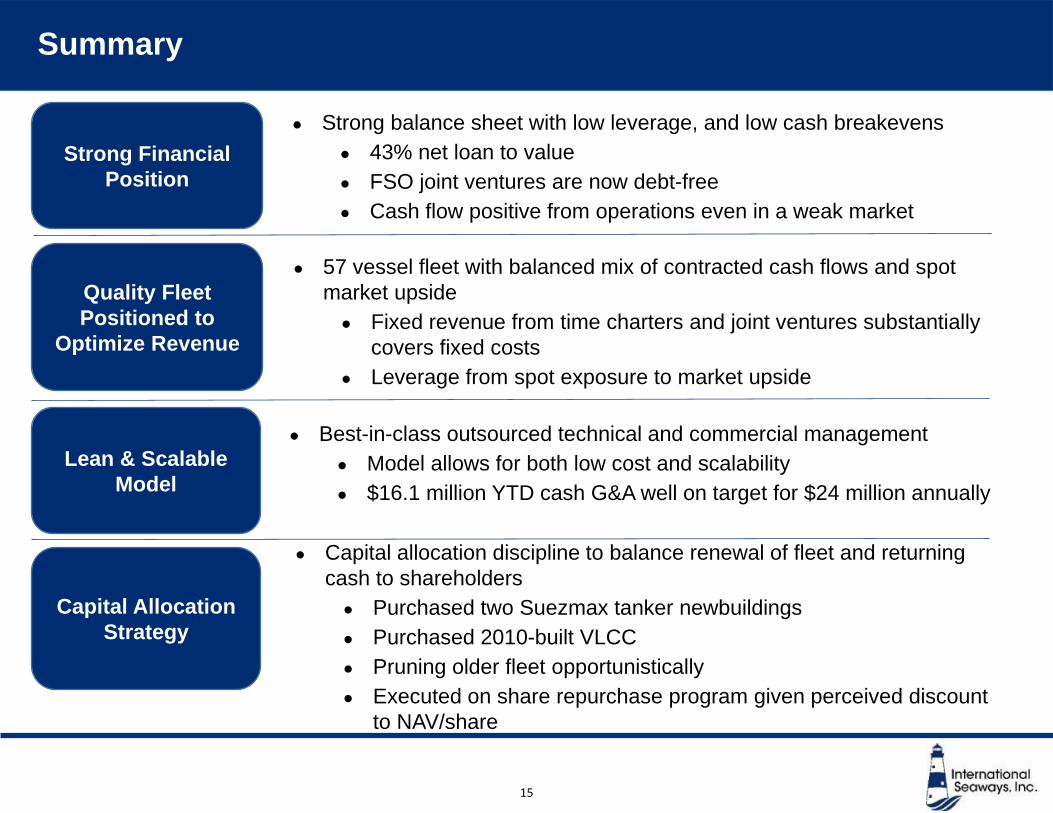
Summary
15
Quality Fleet
Positioned to
Optimize Revenue
● 57 vessel fleet with balanced mix of contracted cash flows and spot
market upside
● Fixed revenue from time charters and joint ventures substantially
covers fixed costs
● Leverage from spot exposure to market upside
Lean & Scalable
Model
● Best-in-class outsourced technical and commercial management
● Model allows for both low cost and scalability
● $16.1 million YTD cash G&A well on target for $24 million annually
Capital Allocation
Strategy
● Capital allocation discipline to balance renewal of fleet and returning
cash to shareholders
● Purchased two Suezmax tanker newbuildings
● Purchased 2010-built VLCC
● Pruning older fleet opportunistically
● Executed on share repurchase program given perceived discount
to NAV/share
Strong Financial
Position
● Strong balance sheet with low leverage, and low cash breakevens
● 43% net loan to value
● FSO joint ventures are now debt-free
● Cash flow positive from operations even in a weak market
Appendix
International Seaways, Inc.
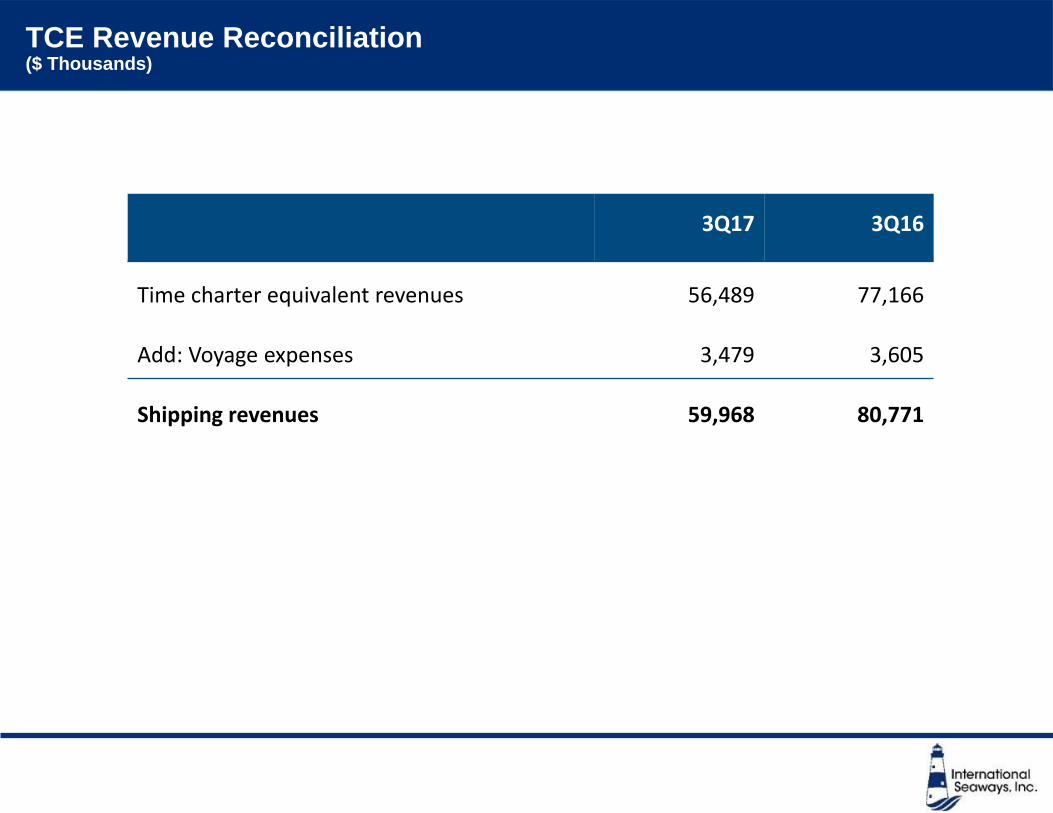
TCE Revenue Reconciliation($ Thousands)
3Q17 3Q16
Time charter equivalent revenues 56,489 77,166
Add: Voyage expenses 3,479 3,605
Shipping revenues 59,968 80,771
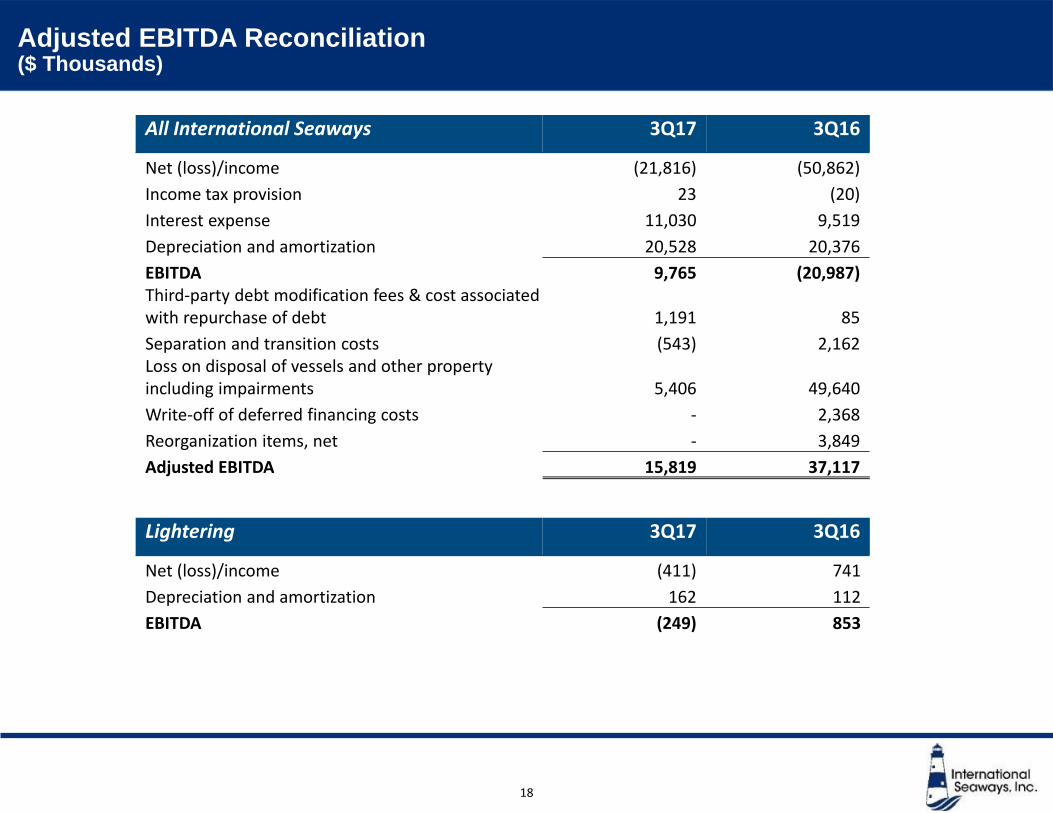
International Seaways, Inc.18
All International Seaways 3Q17 3Q16
Net (loss)/income (21,816) (50,862)
Income tax provision 23 (20)
Interest expense 11,030 9,519
Depreciation and amortization 20,528 20,376
EBITDA 9,765 (20,987)Third-party debt modification fees & cost associated with repurchase of debt 1,191 85
Separation and transition costs (543) 2,162Loss on disposal of vessels and other property including impairments 5,406 49,640
Write-off of deferred financing costs - 2,368
Reorganization items, net - 3,849
Adjusted EBITDA 15,819 37,117
Adjusted EBITDA Reconciliation($ Thousands)
Lightering 3Q17 3Q16
Net (loss)/income (411) 741
Depreciation and amortization 162 112
EBITDA (249) 853