Embed Size (px)
Citation preview
INTERNATIONAL PATENT SYSTEM:AN EMPIRICAL ANALYSIS
October 14, 2002
∗∗∗∗Biswajit Dhar∗∗∗∗C. Niranjan Rao
Research and Information SystemFor the Non-Aligned and Other Developing Countries
India Habitat Centre, New Delhi
∗ The opinions and views expressed herein are solely those of the authors and should not be attributed to WIPO or their employers.
1
Table of Contents
ACKNOWLEDGEMENTS......................................................................................................................... 1
INTRODUCTION ........................................................................................................................................ 2
REVIEW OF LITERATURE...................................................................................................................... 4
DOMESTIC PATENTING BEHAVIOUR ............................................................................................................ 4FOREIGN PATENTING BEHAVIOUR............................................................................................................... 5
METHODOLOGICAL ISSUES ................................................................................................................. 8
LIMITATIONS OF THE PATENT DATA ............................................................................................................ 8PATENTS AS INDICATORS OF INVENTIVE ACTIVITY ...................................................................................... 8INTERNATIONAL COMPARABILITY OF PATENT DATA.................................................................................... 9USE OF PATENT APPLICATIONS DATA ........................................................................................................ 14
DATABASE FOR THE STUDY ............................................................................................................... 16
SMALL ECONOMIES................................................................................................................................... 17LEAST DEVELOPED COUNTRIES ................................................................................................................ 17OAPI......................................................................................................................................................... 19RE-REGISTRATION COUNTRIES .................................................................................................................. 20FORMER SOCIALIST COUNTRIES................................................................................................................ 20 COUNTRIES WHICH HAVE REPORTED FOR LESS THAN 12 YEARS ................................................................ 21COUNTRIES WITH ZERO RESIDENT PATENT APPLICATIONS FOR MORE THAN 11 YEARS ............................ 21COUNTRIES WITH ZERO PATENT GRANTS FOR MORE THAN 11 YEARS....................................................... 21JAPAN........................................................................................................................................................ 21CHANGE IN COVERAGE SINCE 1985........................................................................................................... 22PROBLEMS WITH THE PCT DATA .............................................................................................................. 23ESTIMATION OF MISSING DATA ................................................................................................................ 26INCOMPLETE DATA ................................................................................................................................... 27THE FINAL DATA SET................................................................................................................................ 27
A STATISTICAL PROFILE OF THE INTERNATIONAL PATENT SYSTEM ............................... 28
DOMESTIC PATENTING .............................................................................................................................. 28FOREIGN PATENTING................................................................................................................................. 30PROPORTION OF DOMESTIC PATENTS IN TOTAL PATENTS......................................................................... 32GRANT RATIO ........................................................................................................................................... 33GROWTH OF PATENT APPLICATIONS ......................................................................................................... 35EUROPEAN PATENT CONVENTION............................................................................................................. 40ASEAN COUNTRIES ................................................................................................................................. 42CHINA AND SOUTH KOREA ....................................................................................................................... 43
DEVELOPMENT AND PATENTING ACTIVITY................................................................................ 46
THE MODEL .............................................................................................................................................. 47THE RESULTS ............................................................................................................................................ 50
SUMMARY AND CONCLUSIONS......................................................................................................... 54
BIBLIOGRAPHY ...................................................................................................................................... 61
1
Acknowledgements
The authors would like to thank Dr. Guriqbal Singh Jaiya, Deputy Director, World Intellectual Organization for taking interest in the project and giving us unstinted support. We would also like to acknowledge the help received from Mr. William Guy, Head, Industrial Property Information and Special Projects Section of the WIPO for making supplementary data available to us.
Last, but not the least, we are grateful to Dr. V.R. Panchamukhi the Director General of our organisation, for providing all the encouragement necessary to see the project to its fruition.
2
Introduction
The restructuring of the patent system world wide that the Agreement on TRIPs
has brought about also brought into sharp focus the need to look at the dynamics of
patenting activity in various countries. In this context, it was particularly important to
recognise that patenting activity has evolved over a period of time and given this fact the
phenomena had to be examined over an extended period of time.
Several studies have been conducted in the past that provide an analysis of cross-
country patenting activity. These studies have tried to explain either domestic or foreign
patenting activity using macro-economic variables. The interesting feature of this
literature is that all but one of these studies has been done in the period prior to 1985. Yet
another aspect of the available literature on the issue at hand is that developing countries
have not been included in any of these barring a singular exception.
This, in other words, indicates that a comprehensive analysis of patenting activity,
as it has taken place across countries, has not been attempted thus far. This lacuna is
particularly galling in the context of the current discussion on the post-TRIPs patent
system, one that has constantly underlined the need for countries to take advantage of the
emerging regime.
The present study is an attempt to address the above-mentioned gap in the
literature. There are two salient points of this study. The first is that the study takes into
consideration a set of countries that is larger than has been done in the past. The countries
included in the study cover the entire development spectrum. The second feature of this
study is that the analysis uses time series data, spanning 24 years.
The study has several parts. The first provides a brief survey of literature, which
helps in putting the study in perspective. The two following sections discuss the
methodological issues and explain the data set that has been used. The criteria for
selective of the countries that have been included have been spelt out length.
The trends in patenting activity observed across countries have been analysed in
the next section. This section presents the data both for applications as well as grants as
have been recorded in the Industrial Property Statistics of the WIPO.
3
The final section provides an econometric analysis of development and patents
using a limited set of macro-economic variables. This exercise had to be limited in scope
because comparable data set for countries included in the study were not available.
This exercise should be seen as the first attempt at a more comprehensive
understanding of the patenting activity across countries. More than anything else, the
study helps in identifying the data limitations that exist and which need to be addressed if
an adequate understanding of dynamics of the patent system across countries is to be had.
4
Review of Literature
In this section, we will review some of the major studies on the Economics of the
Patent System, which try to explain either domestic or foreign patenting behaviour or
both in an inter-country comparative framework. A feature of these studies that have
been discussed in this section is that they deal with the developed countries.
Domestic patenting Behaviour
Vayrynen [1977] estimates Spearman's rank-order correlation coefficients for 10
African countries between patents granted (both domestic and foreign) per capita and GDP
(as a measure of the market size) and GDP per-capita (as a measure of development) both
for 1971. The correlation coefficient he obtains is 0.90 for patents and GDP and 0.85 for
patents and GDP per-capita.
Schiffel and Kitti [1978] try to explain domestic patent applications (Source:
WIPO's December issue of Industrial Property) in Canada, France, West Germany, Japan
and the United States by R&D expenditures lagged by two years. The data covered the
period 1963-74 for all countries except Japan for which the data covered the period 1967-74.
The results showed that for Canada and Japan the R&D coefficient was positive and
significant, for West Germany, it was negative and significant and for France and the United
States, it was not significant. The authors try to explain these results by saying that R&D is
difficult to measure.
Soete [1981] explains domestic patenting in 19 OECD countries (Source: Industrial
Property Statistics]. The dependent variable is the log of domestic patent applications per
capita averaged for the years 1976-78 and the independent variable is R&D per capita in the
business enterprise sector for the year 1975. He finds that the R&D in the business
enterprise sector is positive and significant in explaining domestic patents.1
Watanabe [1985] estimates correlation coefficients between log of resident patent
applications (Source: Industrial Property Statistics) percapita and log of gross domestic
manufacturing product per capita (for 53 countries, 16 of which are developed) and log of
1 He also uses log of patents granted percapita and obtains the same results.
5
GNP per capita (for 60 countries, 21 of which are developed) for the year 1979 and shows a
positive and significant relationship.
Foreign Patenting Behaviour
Schiffel and Kitti [1978] try to explain foreign patenting activity in the United
States by applicants from Canada, France, West Germany, Japan, Netherlands, Sweden,
Switzerland and the United Kingdom (Source: Industrial Property Statistics). The
independent variables are exports to the US by countries to which the foreign applicants
belong and patents taken by the residents in the same set of countries, or domestic
patents. The period covered by this study is 1965-74 for all countries except the
Netherlands in which case the period is 1965-73. The domestic patents variable is
positive and significant for Switzerland, and negative and significant for the Netherlands.
For all other countries, it is not significant. The exports variable is positive and
significant for all countries except for the Netherlands.
In the same paper, Schiffel and Kitti have attempted to explain foreign patenting
activity in Japan by Canada, France, West Germany, Netherlands, Sweden, Switzerland,
the United Kingdom and the United States (Source: Industrial Property Statistics). The
independent variables as in the earlier case are, exports to Japan by countries to which the
foreign applicant belongs and domestic patents in the same set of countries. The period
covered for this exercise is identical to that considered for the earlier case. In the case of
Japan, domestic patents as an explanatory variable are found to be positive and
significant for Canada and Switzerland, and negative and significant for West Germany
and Sweden. For all other countries, it is not significant. The exports variable is positive
and significant for Canada, Sweden and Switzerland, and not significant for all the other
countries.
The paper by Bosworth [1980] explains foreign patenting by the United States in
50 countries2 for the year 1974 (Source: Industrial Property Statistics). The explanatory
variables are gross domestic product and gross domestic product percapita of the 50
countries in which inventors belonging to the US have obtained patents as also exports
2 Bosworth does not identify the countries.
6
and foreign investment3 originating in the United States to each of the above mentioned
countries. The log-linear results show that all the independent variables are positive and
significant buy only exports and foreign direct investment variables are significant at one
percent level of significance.
Soete [1981] tries to explain patenting behaviour of foreign applicants from 17
OECD countries in France, West Germany, Japan, the United Kingdom and the United
States. The dependent variable is the patents granted averaged for the years 1976-78 and
the independent variable is the R&D expenditures of the business enterprise sector for the
year 1975. The interesting feature of this study is that domestic R&D expenditure
undertaken by each of the 17 countries was used to explain foreign patenting activity in
that country. The log-linear results of regression between foreign patent percapita and
business enterprise R&D percapita show that business enterprise R&D is positive and
significant for all the countries.
Bosworth [1984] tries to explain UK patenting activity abroad. He uses cross-
section data (source UK Patent Office) for 50 countries4 for the year 1974. The explanatory
variables are GDP, GDP per capita, exports of UK to the countries concerned and size of
operations of multinational enterprises (proxied by the number of UK subsidiaries in each
country). The log-linear regression shows that all the independent variables are positive and
significant.
In the same paper, Bosworth also tries to explain foreign patenting activity (Source:
Industrial Property Statistics) in the UK. He uses cross-section data for 22 countries for the
year 1974. The explanatory variables are imports into UK from the countries included in
the sample, size of operations of multinational enterprises from that country (proxied by the
number of subsidiaries from the originating country) and domestic patenting in the
originating country. The log-linear regression shows that the size of operations of
multinational enterprises and domestic patenting activity of the country are positive and
significant while imports from that country is not significant in explaining foreign patenting
activity in the UK.
3 The number of foreign firms was used as a proxy.4 Bosworth does not identify the contries.
7
Eaton and Kortum [1996] try to explain the flow of patent applications among 19
OECD countries for the year 1988. The explanatory variables are, human capital (average
years of schooling), imports of one country from another country relative to one's GNP, the
ratio of R&D scientists and engineers to total labour force, relative productivity of one
country to the concerned country. The log-linear equation explaining ratio of patent
applications and total labour force shows that human capital, intensity of R&D scientists and
engineers employment and relative productivities are positive and significant, while import
intensity if not significant. This equation also contains four variables to account for strength
of the patent system. They find that while countries providing strong patent protection
attract more foreign patents, patent strength and domestic patents are not so related.
8
Methodological Issues
Limitations of the Patent data
Patents have long been considered as a key output of R&D activity. Technology
studies, which have a paucity of data to measure technological capability, rely on patent
data. But at the outset let us enumerate some of the problems that are encountered while
using patent data.
These problems could be grouped under three broad headings relevant for our study:
1. Patents as indicators of inventive activity
2. International comparability of patent data
3. Use of patent applications data
Patents as indicators of inventive activity
There are at least two sets of problems that need to be taken into account while
using patents as indicators of inventive activity. The first is the fact that not all
patentable inventions are patented. The second problem arises from the quality of patent
data. Mansfield [1986] estimates that while in the pharmaceutical, oil and machinery
industries, more than 80 percent of patentable inventions are patented, it is only 60
percent in case of primary metals and automobile industries. This not only shows that
some patentable inventions are not patented but also points out to inter-industry
differences in patenting. The inter-industry differences in propensity to patent arise from
the fact that while some industries such as pharmaceuticals depend on patent protection
as an appropriation mechanism the others do not. Taylor and Silberston [1973] showed
that fine chemical industry in general and pharmaceutical industry in particular depends
on the patent system. Ease of imitation is one of the reasons for this. Industries such as
aircraft industry depend much less on the patent system; while they spend heavily on
R&D, their output of patents is very small.
There are considerable differences in quality among patents within a country.
While some patents are important, most of the others are not.
9
In an inter-country comparative perspective the differences in the quality of
patents from one country to the other might result from such factors as the capabilities of
patent offices and the differences in the interpretation of patentability criteria viz.,
novelty, non-obviousness and industrial applicability by different patent offices.
This point can be illustrated by the fact that a significant proportion of patents
whose validity is challenged are held to be invalid by courts. One reason given is that the
patent offices, do not have the resources to do a through examination of each and every
patent, whereas a court is obliged to conduct a through examination of a patent in order to
determine its validity (Engel [1985]).
There have been attempts to quantify differences in quality of patents through the
use of number of claims, renewal information and citations. The most successful of these
attempts were the patent renewal models. Many countries have a requirement that for the
patent to be effective it has to be renewed periodically. The main reason for this is to
weed out economically useless patents from being in force. Hence, we can assume that a
patent, which has been renewed through its lifetime, is more valuable than the one, which
was allowed to lapse. This information has been used to model patent renewal by Pakes
[1986] and Schankerman and Pakes [1986]. Using the patent renewal information and
patent fee schedules Schankerman and Pakes [1986] have shown that the distribution of
private value of patents is highly skewed, while a few patents are very valuable a large
majority of patents do not have any value.
Firm level differences in propensity to patent arise from the strategic perspectives
of these firms towards R&D and patenting. Finally, these inter-industry and inter-firm
propensities could change over time.
International comparability of patent data
Patent data may not be comparable among countries because of differences in
patent laws. There are vast differences in patent laws of different countries. A country's
patent law will certainly influence the patent output of that country. It could hence be
argued that patent data across countries are not comparable. Further, these differences in
patent laws would be accentuated by differences in practices of the patent offices in
interpreting these laws and ultimately the enforcement of these provisions.
10
The differences in patent laws could arise because of differences in various
provisions concerning patent protection. The more important among these are
patentability criteria, coverage, duration, compulsory licensing and definitions of
residents. Moreover, these laws could change over time, but changes in patent laws are
not very frequent.
The generally accepted patentability criteria are novelty (new), non-obviousness
(inventive step) and industrial applicability (usefulness). But, for example, in India the
Indian Patents Act, 1970 had only novelty and industrial applicability as criteria of
patentability and not non-obviousness. In addition, there are differences in the manner in
which patent laws define novelty, which is taken either as novel in the world or in the
country. Some countries have only a patent registration system where there are only
requirements of form to be fulfilled and no substantive examination of the patent takes
place. Some of the former colonies have or had a dependent patent system linked to the
former colonial power, for example, Hong Kong and Singapore. Australia, Germany and
Japan and the Netherlands followed a "deferred examination system" where substantive
examination takes place only if specific request has been made within a specified period,
which can be up to seven years from the date of application (UNCTAD [1975] p.7). All
these differences in patent laws have the potential to influence patent applications and
hence patent data.
Historically, there have been substantial differences in the patentable subject
matter as between countries. Countries have excluded specific sectors from the ambit of
patenting. Among the sectors that have been excluded are: pharmaceutical product
patents, pharmaceutical process patents, food products, food processes, chemical
products, methods of treatment of human or animal body, cosmetics, fertilizers, mixture
of metals and alloys, agricultural machines and anti-contaminants. The other explicit
exclusions found in some countries include, animal varieties, plant varieties, biological
processes for producing animal or plant varieties, microorganisms and substances
obtained by microbiological processes. Computer programs and nuclear inventions have
also been excluded by certain countries (WIPO [1988]).
The duration of patent protection is another important source of differences in
patent laws of countries. The patent term could vary among countries; it could be
11
different for different sectors within a country and the date from which the terms starts
could vary from country to country, while some countries give a 20-year patent term
some countries provide a patent term of 10 years. For example, the Indian Patent Act,
1970 provides a patent term of 14 years from the date application for all inventions
except for pharmaceutical and food inventions. Under the Indian Act, pharmaceutical
and food inventions have a term of five years from the date of grant or seven years from
the date of application, whichever is shorter. The date on which the term of the patent
starts varies among countries. The most important are, the date of application and the
date of grant.
There could be important differences in the way the compulsory licensing
provisions are incorporated in different patent laws. Compulsory licenses can be granted
to counter non-working of the patent in the country of grant. Other grounds for grant of
compulsory licenses can be public interest, including those relating to public health.
Non-working of a patent, which is the ground for the grant of compulsory licenses that is
recognized by the Paris Convention, is also considered as an abuse of patent rights.
While many countries in the world have compulsory licensing provisions in their patent
law to check possible abuses of patent monopoly, the United States is the only country,
which uses anti-trust provisions to the same effect. Many developed5 countries, which
had strong compulsory licensing provisions in the past, diluted them in later years as they
attained technological capability. Developing countries, which inherited colonial patent
laws, reformed their patent systems in the late 1960s and early 1970s, an important
component of which was to have compulsory licensing provisions. As of late 1980s,
while developed countries had less stringent compulsory licensing provisions many
developed countries had strong compulsory licensing provisions. The presence of a
strong compulsory licensing provision could discourage inventors from seeking patent
protection, for instance, Scherer [1977] in a survey of US firms finds that anti-trust
decrees involving compulsory licenses discourage research and development and also
increases secrecy.
5 Through out this paper we consider high-income economies identified as such by World Bank [1993] to be developed countries. High-income economies have GNP per capita of $7620 or more in 1990, World Bank [1993].
12
Generally, the scope of patent rights covers making, selling and using the patented
product. There are significant differences among countries in incorporating importation
as a right of the patent holder. While some counties explicitly include importation as a
right of the patent holder, other countries do not explicitly mention it.
Finally, there are differences in how a country defines residents and non-
residents. While in the US "the concept of residence is determined by the place of
residence of the first-named inventor rather than that of the applicant", in Japan it is "the
concept of residence is determined by the nationality of the applicant rather than the
country of residence of the applicant". All the other countries go by the residence of the
applicant rather than by nationality.
The practices of the patent offices in interpreting the various provisions of the
patent law could differ. One reason for this may be the subjective element, which
normally surrounds these provisions. Another reason could be the differences in
capabilities of patent offices. Many patent offices in developing countries may not have
the human or material resources, which are required to implement a patent law
satisfactorily. The practices of patent offices might have an effect on the number of
patent applications.
There are considerable quality differences among patents in different countries.
We could expect those inventions and hence patents granted in a developing country
could be of less quality in general than those coming from a developed country. Another
reason why the quality of patents coming from developing countries could be low is that
the patent offices of developing countries might not have the resources to undertake a
thorough examination of patent applications. A worldwide search for prior art could be
beyond the reach of patent offices from developing countries both in terms of facilities as
well as monetary resources. We would illustrate this point with the experience of
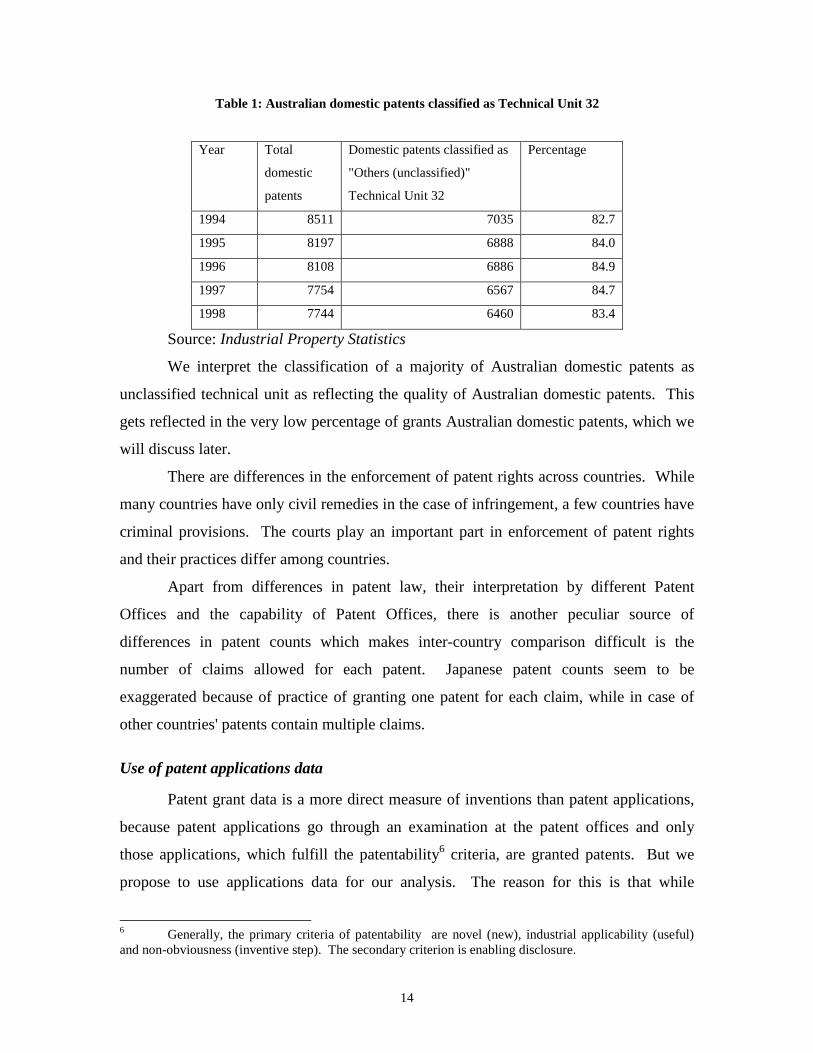
Australia. The Industrial Property Statistics gives patent applications classified into 32
IPC technical units (a technical unit is between a sub-section and a class). Technical unit
32 is titled "Others (unclassified)". For Australian domestic patents a large proportion
falls under this category. This is way above the average for other countries. The next
largest figure is from France which has 550 domestic patents classified under Technical
Unit 32 for the year 1994 making up only 4.39 percent of domestic patents. During the
13
period 1994-98 Australia did not grant even one patent under classification Technical
Unit 32. The table below gives the information.
14
Table 1: Australian domestic patents classified as Technical Unit 32
Year Total
domestic
patents
Domestic patents classified as
"Others (unclassified)"
Technical Unit 32
Percentage
1994 8511 7035 82.7
1995 8197 6888 84.0
1996 8108 6886 84.9
1997 7754 6567 84.7
1998 7744 6460 83.4
Source: Industrial Property Statistics
We interpret the classification of a majority of Australian domestic patents as
unclassified technical unit as reflecting the quality of Australian domestic patents. This
gets reflected in the very low percentage of grants Australian domestic patents, which we
will discuss later.
There are differences in the enforcement of patent rights across countries. While
many countries have only civil remedies in the case of infringement, a few countries have
criminal provisions. The courts play an important part in enforcement of patent rights
and their practices differ among countries.
Apart from differences in patent law, their interpretation by different Patent
Offices and the capability of Patent Offices, there is another peculiar source of
differences in patent counts which makes inter-country comparison difficult is the
number of claims allowed for each patent. Japanese patent counts seem to be
exaggerated because of practice of granting one patent for each claim, while in case of
other countries' patents contain multiple claims.
Use of patent applications data
Patent grant data is a more direct measure of inventions than patent applications,
because patent applications go through an examination at the patent offices and only
those applications, which fulfill the patentability6 criteria, are granted patents. But we
propose to use applications data for our analysis. The reason for this is that while
6 Generally, the primary criteria of patentability are novel (new), industrial applicability (useful) and non-obviousness (inventive step). The secondary criterion is enabling disclosure.
15
applications have a time dimension to it, grant data does not have. This can be explained
by the fact that while the patent applicants decide the date of application, the practices of
the patent office decide the date of grant7. This problem becomes more acute with the
differences in patent office practices between developed and developing countries. While
applications for a year belong to that particular year, grants for a particular year contain
applications made in different years. We regard the time dimension as contained in the
applications data to be crucial for our analysis; hence, we will use applications data.8 The
ideal data set will be grant data arranged according to date of application, but such data is
not available.
The major flaw with using applications data is that only some of the applications
are granted patents. And this grant rate may be different in different countries and may
change over time. We assume that these differences are not major. We will report on
grant rates in different countries in a subsequent section.
7 See Griliches [1989] for a discussion on how the resources available to the patent office determine the grants. Some time these grants do not follow the trends in applications.8 Eaton and Kortum [1999] say "We report on applications than grants because they are much more comparable across countries", (p.542).
16
Database for the Study
The source of data on patenting is the World Intellectual Property
Organization's annual compilation Industrial Property Statistics. We have collected data
on patent applications and grants for residents and non-residents for the period 1975-98.
The choice of 1975 as the initial year for the study was driven by the consideration that
patent laws were changing in many countries.
The total patent figure as reported by the Industrial Property Statistics includes
patents, inventors’ certificates, patents of importation, patents of introduction,
revalidation patents, precautionary patents and petty patents. For some countries, the
data included provisional as well as complete specifications.
A total of 151 countries and OAPI (Organisation Africaine de la Propriete
Intellectuelle), representing the regional arrangement among states of West Africa, have
reported at least once during this period. This number includes countries belonging to
former socialist bloc and those that have emerged after their breakup.
The patent data in Industrial Property Statistics is based on voluntary reporting by
countries, if a country reports, it is included otherwise it is omitted. There is no
mechanism to address the problem of non-reporting by countries. If one is trying to build
up a long time series there are quite a few ‘non-reporting’ observations. There is
endemic non-reporting by a number of developing countries. The extent to which
countries provide patent data may be taken as an indicator of how important they felt the
patent system to be. Some countries report only total applications without giving a break
up of domestic and foreign applications. Only 20 countries have given data for each year
and also the breakup between residents and non-residents during the entire period under
study. Ireland and Italy are developed countries, which either do not report or give no
breakup between residents and non-residents for some years.
After analysing the data compiled, we have decided to drop different sets of
countries from detailed analysis. The set of countries and the reasons for their removal
are discussed below.
17
Small Economies
There are 21 countries, which have a population of less than one million, which
have reported their patenting activities to Industrial Property Statistics at least once
during 1975-98. The reason for dropping these countries from detailed analysis is that
we expect small economies i.e., those that have a population of less than one million, to
have sub-optimal resources to exploit the patent system fully. This reason is reinforced
by the number of zero domestic patents these countries report over time and also the
number of years in which these countries do not report. These countries are Bahamas,
Bahrain, Barbados, Belize, Brunei Darussalam, Cyprus, Fiji, Grenada, Guyana, Iceland,
Kiribati, Luxembourg, Macau, Malta, Monaco, St. Lucia, St. Vincent and the Grenadines,
Samoa, Seychelles, Solomon Islands and Swaziland.
Least Developed Countries
UNCTAD [1995] identifies 48 countries as least developed countries (LDCs).
These countries thus have too few resources to spend on either efficient patent systems or
any meaningful R&D. These countries therefore have either too few domestic patent
applications (most of them zero) or they do not report most of the time. There are 20
LDCs, which have reported to Industrial Property Statistics at least once during this time.
These countries are Angola, Bangladesh, Burundi, Ethiopia, Gambia, Haiti, Lesotho,
Liberia, Madagascar, Malawi, Nepal, Rwanda, Sierra Leone, Somalia, Sudan, Tanzania,
Uganda, Yemen, Zaire and Zambia.
In June 2001 the World Trade Organization (WTO) and the World Intellectual
Property Organization (WIPO) launched an initiative "to help least developed countries
(LDCs) maximise the benefits of intellectual property protection", WTO [2001]. In this
context, let us examine the experience of the LDCs with the patent system.
As many as 15 of the 20 LDCs in our database are members of the Paris Convention
and nine countries are members of the Patent Cooperation Treaty (PCT). Nine of these 20
countries are members of African Regional Industrial Property Organization (ARIPO).
The LDCs have a high incidence of non-reportage. Besides, they also report zero
patents in quite a few years. Out of the total observations of 480 (20 countries and 24
years), of domestic patent applications as many as 273 observations are not reported
18
making up 57 percent of the total. The total number of observations reported zero patent
applications are 100 making up 21 percent of the total. The problems with the data
relating to these countries are indicative of the fact that these countries do not have
functioning patent systems. They report zero domestic patenting when there is a positive
number to be reported in foreign patent applications. Hence, we can assume that many of
the non-reporting cases are actually zero domestic patents. There are fourteen countries,
which either do not report or report zero domestic patent applications in more than twenty
years of the twenty-four years covered by our study. These are Angola, Burundi,
Ethiopia, Gambia, Lesotho, Liberia, Madagascar, Rwanda, Sierra Leone, Somalia, Sudan,
Tanzania, Uganda and Yemen.
Malawi is one country, which never missed reporting. The Gambia national patent
office never reported even once. The average number of domestic patent applications (for
reported years) for Bangladesh is 37, for Zaire, it is eight and for Zambia it is three.
Bangladesh is the most active among the LDCs as far as domestic patent applications are
concerned.
Nine member countries of ARIPO belong to LDCs. This regional patent system
seems to generate domestic patents. Up to 1997, only one domestic patent application was
reported through ARIPO. But in 1998 as many as 36 domestic patents were reported as
being applied through ARIPO in six countries.
Next, we will discuss the foreign patent applications scenario in LDCs. The number
of foreign patent applications received by the national patent offices was declining, as
increasing number of countries have joined PCT or the regional patent organization,
ARIPO. The number of foreign patent applications was very low. The only countries with
more than 50 as the average (reported) foreign patent applications are Bangladesh (106),
Zaire (84) and Zambia (87).
For members of PCT the numbers of designations increase exponentially. While the
average for PCT member countries was 334 in 1985, it rose to 33607 in 1998. Such an
increase in designations was not translating to more foreign patent applications being
received by the national patent offices. It would hence be surmised that these designations
do not reflect the intentions of the patent applicants to actually seek a patent. There is a
19
convergence of foreign patent applications through PCT like in the case of EPC foreign
patent applications.
For the member countries of ARIPO who are also members of PCT, the foreign
applicants seem to prefer applying for patents in member countries through PCT. This is
reflected by the fact that applications have gone up for member countries from 4207 in 1994
to 34153 in 1998. The number of foreign applications reaching ARIPO directly seems to be
very low. On an average, they went up from eight in 1985 to only 65 in 1998.
On the whole, the domestic patenting performance of LDCs seems to be very low.
These countries, which have some acute problems of poverty, malnutrition, education and
health, may not have resources to spend on R&D, which might result in patents. Only after
these problems are solved does it makes sense for these countries to spend on R&D. What
seems to be interesting is that the foreign patent applicant seems to be least interested in
least developed countries. If the patentee is looking for making profits out of his invention,
the LDCs do not seem to matter. If the problem of developing countries is a large number
of foreign patents (see section on Proportion of Domestic Patents in Total Patents), the
problem with LDCs seem to be too few foreign patents.
In these circumstances, unless the basic problems of these countries such as poverty,
malnutrition, education and health are solved these countries may not benefit much from the
patent system.
OAPI
We have excluded OAPI members from our analysis because our focus is on
inter-country comparison. Unlike other regional patent systems such as European Patent
Convention (EPC) and African Regional Intellectual Property Organization (ARIPO),
OAPI is a unitary system, with one patent law applicable in member countries and one
patent office. The other reason for excluding the OAPI members is that 10 out of the 15
member countries of OAPI are LDCs. The member countries of OAPI are Benin, Burkina
Faso, Cameroon, Central African Republic, Chad, Congo, Cote d'Ivoire, Equatorial
Guinea, Gabon, Guinea, Guinea-Bissau, Mali, Mauritania, Senegal and Togo. Guinea-
Bissau and Mali have reported separately for some years.
20
However, we may briefly mention the situation in OAPI countries. The member
countries of OAPI have a unified patent system. The average number of domestic
applications during 1975-98 was 24. The average number of foreign applications was 232
during the same period. The designations in PCT applications of OAPI as the designated
regional patent organization rose from 398 in 1985 to 34692 in 1998. On the whole, OAPI
seems to exhibit the characteristics of the other LDCs in their experience with the patent
system.
Re-registration countries
We have excluded countries, which have a dependent patent system. Countries
which have a re-registration system merely register patents, which are granted in some
other designated country. While this system is not burdensome for foreign patentees,
who just re-register those patents, which were granted elsewhere. It puts particular
burden on domestic patent applicants. Domestic patentees who want to get patent
protection for their inventions in their home country have to apply for a patent in a
foreign country and once it is granted have to register that patent in their home country.
Hence, re-registration system discourages domestic inventors in applying for a domestic
patent. The domestic patent counts would be larger if there were an independent patent
system rather than a re-registration system. The countries are, Hong Kong, which had a
re-registration system till 1998, and Singapore, which had a re-registration system till
1995. The argument that re-registration discourages domestic applicants can be
illustrated by the proportion of domestic patent applications in total patent applications.
This proportion is 1.79 percent for Hong Kong and 0.88 percent for Singapore for the
years 1975-98.
Former Socialist Countries
The main reason for excluding these countries from our analysis is that they had
an 'inventor certificate' system when they were socialist countries. Patents and 'inventor
certificates' counts are not comparable because the law, which governs them, is
fundamentally different. For example while patents grant monopoly rights, 'inventor
certificates' do not do so. An 'inventor certificate' holder does not have control over the
use of his invention but has a right over royalties resulting from its use. Hence, the
21
problem of using the data for former socialist countries in a cross-country analysis.
There are 34 such countries and these are Albania, Bulgaria, Cuba, Czechoslovakia,
Czech, Slovakia, East Germany, Hungary, North Korea, Mongolia, Poland, Romania,
Soviet Union, Armenia, Azerbaijan, Belarus, Estonia, Georgia, Kazakhstan, Kyrgyzstan,
Latvia, Lithuania, Moldova, Russia, Tajikistan, Turkmenistan, Ukraine, Uzbekistan, Viet
Nam, Yugoslavia, Bosnia & Herzegovina, Croatia, Macedonia TFYR and Slovenia.
Countries which have reported for less than 12 years
There are 11 countries, which have not reported their patenting activities in more
than eleven years out of twenty-four years, which our database covers. We have decided
to remove them from further analysis. Their non-reporting shows that the patent system
is not working efficiently. This non-reporting for such a long time will also make
estimating missing observations a more erroneous task. These countries are Dominican
Republic, Jordan, Kuwait, Libya, Namibia, Nicaragua, Nigeria, Paraguay, Saudi Arabia,
Syria and United Arab Emirates.
Countries with zero Resident Patent Applications for More than 11 years
There are three countries with zero resident patent applications for than 11 years
of the 24 years we are covering. Zero resident patent applications for such a long period
of time shows that the patent system may not be working efficiently. These countries are
Botswana, Ghana and Kenya.
Countries with zero Patent Grants for More than 11 years
There are two countries with zero patent grants in more than 11 years of the 24
years we are covering. No patent grants for such a long time signify a non-functioning
patent system. These countries are Algeria and Indonesia.
Japan
The count of patent applications in Japan is not comparable with patent counts in
other countries. While the practice of patent offices in all the other countries is to grant
one patent with multiple claims, Japan has followed the practice of granting a patent to
cover only one claim. Hence, the patent counts from Japan are inflated. "Okada [1992]
22
finds that Japanese patents granted to foreigners contain on average 4.9 times as many
inventive claims as those granted to Japanese inventors" (referred to in Eaton and Kortum
[1996, p.262]. Following them, we would also divide Japanese domestic patent
applications by 4.9 to make them comparable to other countries. With these modified
patent counts Japan was placed third between 1975-79 and second between 1980-98 in
the overall domestic patent ranking, it overtook Germany in 1980.
Change in Coverage since 1985
One of the major problems in constructing and using this database is the change in
coverage since 1985. Before 1985, the Industrial Property Statistics used to give only
data reported by the concerned National Patent Office. This comprised patent
applications filed directly at the National Patent Offices. Since 1985 the Industrial
Property Statistics started reporting data from the Patent Cooperation Treaty (PCT)
(which came into force in 1978) applications.
Apart from this, data pertaining to applications received by European Patent
Office (EPO) (which came into force in 1977) were reported since 1985. Data on
applications received by the African Regional Industrial Property Organization (ARIPO)
(which came into effect in 1978) were reported in Industrial Property Statistics since
1994, only one member country of ARIPO viz., Zimbabwe remains in our sample. OAPI
(which came into force in 1964) and the later Eurasian Patent Organization (EAPO)
(which came into force in 1996) do not create a problem for us because we have excluded
them from our sample. There is a perceptible jump from 1984 to 1985 because of the
change in the way the data are reported.
This is especially true of the patent applications submitted to the EPO. The
member countries of the European Patent Convention (EPC) in 1985 were Austria,
Belgium, France, Germany, Italy, Netherlands, Sweden, Switzerland and the United
Kingdom. Once the EPC came into effect in 1977 there was a shift towards applying for
a patent to the EPO rather than national patent offices. While this shift took place after
an interval in the case of domestic applications, in case of foreign patent applications the
shift was almost immediate. In Belgium, the Netherlands and Switzerland domestic
applications under EPC constituted 35.4, 41.89 and 34.35 percent of the total domestic
23
patent applications respectively during 1985-98. These countries being small countries
the inventors shifted to EPC much more quickly than other member countries. While the
national patent offices in Belgium and Switzerland report a sharp decline in domestic
applications received by these offices, this does not take place in the Netherlands. For
other countries, domestic patent applications received by national patent offices did not
decline so rapidly during 1979-84. The number of domestic patent applications under
EPC constituted much less proportion of total domestic applications. Hence, there is
underreporting of domestic patent applications for those countries, which were EPC
members before 1984.
This is even more true in the case of foreign patent applications. Foreign patent
applicants just stopped approaching the national patent offices. They directly approach
the EPO. The change is apparent as soon as a country becomes a member of EPC. Here
the number of foreign patent applications being received by national patent offices shows
a perceptible decline since 1979. Except for Germany and the United Kingdom, the
proportion of foreign patents through the EPO is more than 90 percent. For Germany, it
is 79.1 percent and for the United Kingdom, it is 80.3 percent. As far as foreign patent
applications in EPC countries are concerned, there is significant underreporting because
the Industrial Property Statistics did not cover it prior to 1985.
Problems with the PCT Data
The Industrial Property Statistics gives two sets of figures for a Patent
Cooperation Treaty (PCT) member for applications and grants. One set of figures refer
to applications received directly by the National Patent Office (N) and the other set of
figures "P: Designations in international applications filed under the Patent Cooperation
Treaty …".
The moot point is how many of these designations actually come before the
National Patent Offices. The PCT requires that an applicant pay for the first six countries
and nothing for any more country designations. This encourages PCT applicants to
designate all the PCT member countries as designated countries. This results in patent
designations, which can be termed as 'frivolous'. This can be illustrated by the example
of North Korea.
24
North Korea joined the PCT in 1980 and stopped reporting its patenting activity
since 1993. The PCT applications, which designate North Korea, were 1041 in 1987
reached a figure of 33918 in 1998. However, there were no grants reported since 1993.
Why are PCT applicants designating North Korea when there is no possibility of getting a
patent granted there? This example shows that many PCT designations could be
'frivolous'.
This may be true of many least developed countries, which were found to have attracted
very large number of designations in the PCT applications. The following least
developed countries attracted more than 10,000 designations in PCT applications in the
year 1998. Malawi (67751), Sudan (67713), Uganda (67603), Lesotho (67485), Gambia
(60267), Madagascar (34941), Liberia (34862), Sierra Leone (33154) and Guinea-Bissau
(15568). Very few of these applications may reach national patent offices, which can be
seen from the case of Trinidad and Tobago. Trinidad and Tobago joined the PCT in
1994. The number of PCT applications, which designated Trinidad and Tobago as a
country, for various years are given below.
1994: 7200; 1995: 15468; 1996: 20723; 1997: 26168; 1998: 34969
The number of PCT applications, which reached Trinidad and Tobago Patent
Office for this period, is given below.
1994: 0; 1995: 17; 1996: 31; 1997: 76; 1998: 90; 1999: 78; 2000: 133
To find out how many PCT designations with Trinidad and Tobago eventually
reach Trinidad and Tobago Patent Office, we have done the following exercise to give a
rough idea. Total PCT applications with Trinidad and Tobago as a designated country
for the years 1994-98 were 104,951. Total PCT applications, which reached Trinidad and
Tobago Patent Office for the years 1994-00, were 425. Hence as few as 0.40 percent of
PCT applications with Trinidad and Tobago designations reached Trinidad and Tobago
Patent Office. If we take PCT applications with Trinidad and Tobago as a designated
country for the years 1994-97 only (69559) and actual PCT applications reaching
Trinidad and Tobago Patent Office for the years 1994-00 (425) then the percentage is
higher at 0.61. In any case, the number may not be much higher than one percent, which
is very low.
25
The patent application figures reported by the National Patent Offices of
respective countries for inclusion in the Industrial Property Statistics contain PCT
applications, which were received by them. Hence, there is an element of double
counting. We feel the quality of data in the Industrial Property Statistics can be
improved if PCT designations are reported separately rather than as part of the patent
applications and grants table. The explanatory notes to the table, which state that the
PCT applications are only designations it is giving a wrong picture. The Industrial
Property Statistics 1998 in its 'Notes applicable to individual countries or organizations'
with regard to Israel says "The (N) figures include international applications filed under
the Patent Cooperation Treaty which entered the national phase in 1998". This note also
figures in the notes pertaining to Luxembourg, Sweden, UK and USA. This is
misleading because this is true for all the PCT member countries.
Finally, some comments on the way PCT works.
1) It seems most useful for marginal inventions. This can be used by individual or small
firms to test whether their invention is worth patenting.
2) The extra time period offered by PCT applications (20 or 30 months if international
preliminary examination is requested gives more time for large corporations to decide
in which countries to apply. This time period is much more than the one-year given
by the Paris Convention.
3) To reduce non-serious designations there should be a fee for all designated countries.
4) WIPO should follow what is happening to PCT applications in designated countries
and report the data. They collect data for PCT applications, which were, granted
patents but not for applications.
We have decided to remove all PCT designation data given in Industrial Property
Statistics.
We have observed that while a country joining the PCT will not have an
immediate or even medium term impact on domestic patent applications, the impact on
foreign patent applications is immediate. Once a country joins the PCT, there will be a
sudden drop in the number of foreign patent applications received by the national patent
offices. With a lag of about one to two years the number of foreign patent applications
received by the national patent offices increase. When a country joins the PCT foreign
26
patent applicants, have an easy way of applying in that country by designating that
country in a PCT application. As it is easy and cost effective to apply in this way, foreign
patent applicants shift to PCT route instead of approaching the national patent office. It
also gives them 24 months to 36 months to decide whether to approach the national
patent office. This is the reason why foreign patent applications received by national
patent offices increases with a lag after joining PCT. On the other hand, domestic patent
applicants do not seem to shift to PCT procedure immediately on a county joining PCT.
They continue to approach the national patent offices and only shift to PCT slowly.
Estimation of Missing Data
Non-reporting or partial reporting of patent data is a critical problem for the
analysis of the kind that has been attempted in this study. As only a single Patent Office
deals with patent matters in a country one would expect it to have aggregate patent data.
One would also expect that the national patent offices report their activities to the
Industrial Property Statistics for data purposes. It would come as a surprise that many
countries fail to report their patent activities regularly to the Industrial Property
Statistics. Some countries do not report a break up of resident and non-resident patent
activities. Out of the 56 countries in our sample, 30 countries have not reported for at
least one year and two countries did not give a breakup between residents and non-
residents for at least one year. Five countries did not report and did not give a breakup
between residents and non-residents at least for one year. We have fitted a trend equation
for available data and then estimated for the missing years. For no break up between
residents and non-residents we have used the average proportions for the nearest
available years. The error in estimation will be less in the case of no break-up being
given for residents and non-residents. But the error in estimation will be higher in the
case of non-reporting. In case of a country, which has experienced major fluctuations in
applications or grants over time the error will be more. Out of the total 1316
observations in our database, the non-reporting observations were 158 (12.0 percent) and
no-breakup between residents and non-residents were 16 (1.2 percent) making a total of
174 (13.2 percent). The countries for which we had to estimate the missing data are:
Argentina, Bolivia, Brazil, Chile, China, Colombia, Costa Rica, Ecuador, Egypt, El
27
Salvador, Greece, Guatemala, Honduras, India, Iran, Iraq, Ireland, Italy, Jamaica, Japan,
South Korea, Malaysia, Mexico, Morocco, Pakistan, Panama, Peru, Philippines, South
Africa, Sri Lanka, Thailand, Trinidad & Tobago, Tunisia, Turkey, Uruguay, Venezuela
and Zimbabwe.
Incomplete Data
Four countries have data missing in the earlier part of the period considered for
the study. These are: China (1975-84); Malaysia (1975-84); Thailand (1975-78) and
Zimbabwe (1975-78). While China adopted a patent system only in 1984, Malaysia had
a re-registration system till 1983. Thailand enacted a patent law only in 1979 and
Zimbabwe did not report between 1975-78. This makes our data set an unbalanced panel
data.
The Final Data Set
The data set used for the analysis in this study contains 56 countries. 52 countries
have complete data (for all the 24 years) and four countries have incomplete data (for less
than 24 years). Out of 56 countries in the data set, 20 developed countries and 36
developing countries. These countries are Argentina, Australia, Austria, Belgium,
Bolivia, Brazil, Canada, Chile, China, Colombia, Costa Rica, Denmark, Ecuador, Egypt,
El Salvador, Finland, France, Germany9, Greece, Guatemala, Honduras, India, Iran, Iraq,
Ireland, Israel, Italy, Jamaica, Japan, South Korea, Malaysia, Mauritius, Mexico,
Morocco, Netherlands, New Zealand, Norway, Pakistan, Panama, Peru, Philippines,
Portugal, South Africa, Spain, Sri Lanka, Sweden, Switzerland, Thailand, Trinidad &
Tobago, Tunisia, Turkey, United Kingdom, United States of America, Uruguay,
Venezuela and Zimbabwe.
9 For the period 1975-91 Germany refers to West Germany and for the period 1992-98 it refers to unified Germany.
28
A Statistical Profile of the International Patent System
In this section the nature of patenting activity across the set of countries included
in the study over the period 1975-98 would be explored. Domestic and foreign patenting
activity in these countries would be analysed with a view to report the broad tendencies
that were observed.
Domestic Patenting
Domestic patenting can be regarded as a better indicator of local inventive
activity. From an analytical standpoint, the use of domestic patenting data seems more
appropriate because it does not involve any double counting unlike foreign applications.
However, it must also be added that counting only domestic patents might understate
patenting activity of countries like Canada, in which inventors are more inclined to apply
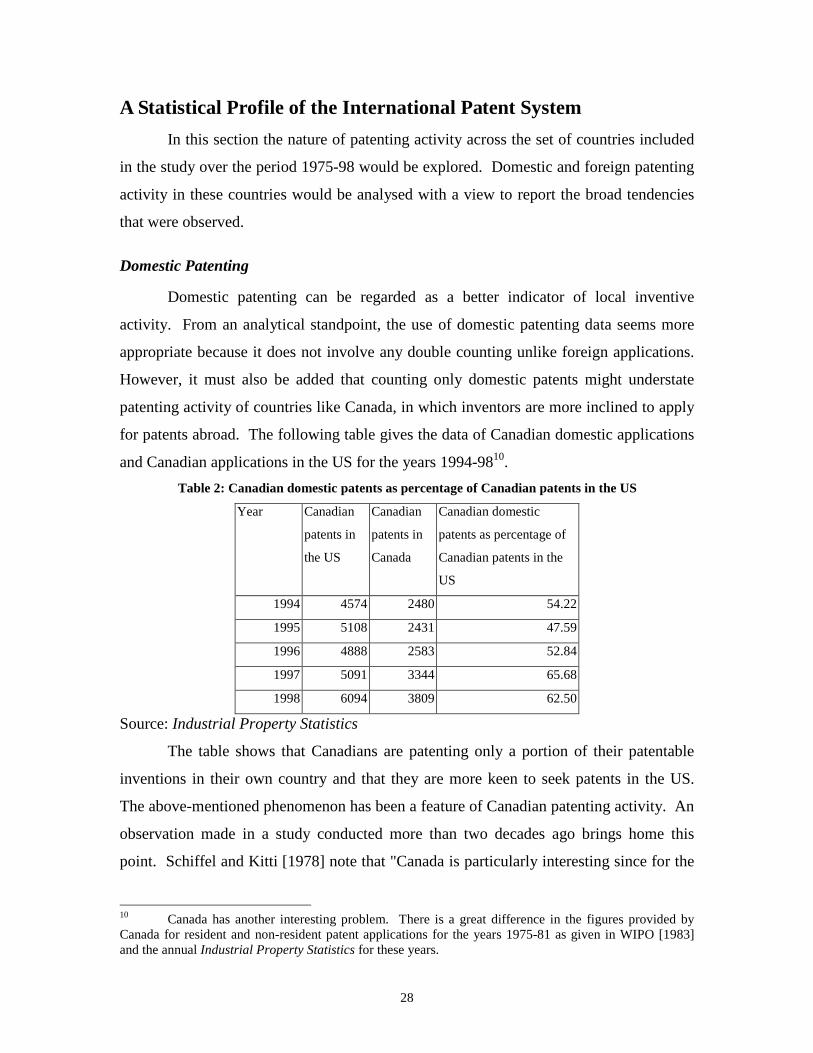
for patents abroad. The following table gives the data of Canadian domestic applications
and Canadian applications in the US for the years 1994-9810.
Table 2: Canadian domestic patents as percentage of Canadian patents in the US
Year Canadian
patents in
the US
Canadian
patents in
Canada
Canadian domestic
patents as percentage of
Canadian patents in the
US
1994 4574 2480 54.22
1995 5108 2431 47.59
1996 4888 2583 52.84
1997 5091 3344 65.68
1998 6094 3809 62.50
Source: Industrial Property Statistics
The table shows that Canadians are patenting only a portion of their patentable
inventions in their own country and that they are more keen to seek patents in the US.
The above-mentioned phenomenon has been a feature of Canadian patenting activity. An
observation made in a study conducted more than two decades ago brings home this
point. Schiffel and Kitti [1978] note that "Canada is particularly interesting since for the
10 Canada has another interesting problem. There is a great difference in the figures provided by Canada for resident and non-resident patent applications for the years 1975-81 as given in WIPO [1983] and the annual Industrial Property Statistics for these years.
29
last four years more patent applications have been filed by Canadians in the US than by
Canadians in Canada" (pp.330). While some Canadians may be applying for patents in
the US and not in Canada, one reason for this phenomenon may be the way the US Patent
Office classifies nationals and non-nationals. While other countries make a distinction
between residents and non-residents irrespective of their nationality, the US Patent Office
classifies inventors on the basis of nationality of the first inventor. Hence, some of the
Canadians applying for patents only in the US and not Canada may be residing in the US.
But this will not account for the large difference in Canadian domestic applications and
applications in the US. According to Grupp and Schmoch [1999] "such countries being
located in the neighborhood of a very large and attractive market for technology (as is
also the case of Switzerland in relation to Germany, for South Korea in relation to Japan
and for Belgium" (pp.383). We found that in relation to Switzerland, South Korea and
Belgium countries for the years 1994-98 domestic patents are higher than foreign patents
from these countries in Germany, Japan and France respectively.
Total domestic patent applications in the 56 countries in our sample, which were
201,875 in 1975, rose to 435,508 in 1998, the yearly average being 278,933 applications for
the period as a whole (see Figure 1). The compound annual growth rate was 3.8 percent per
annum. The share of developed countries in total domestic applications during 1975-98 was
88.10 percent, that of developing countries 11.9 percent.
There are considerable differences in the share of different countries within these
groups. Japan and the US accounted for 48.1 percent of the total patent applications for the
period 1975-98.
The share of developing countries in total applications rose from 6.1 in 1975 to 18.4
percent in 1998. This rise in the share of developing countries in recent years was due to the
high increases registered by China and South Korea. These two countries accounted for
80.5 percent of total patent applications in developing countries in the terminal year of the
study viz., 1998. Without these two countries, the share of developing countries in total
patent applications comes down from 5.5 in 1975 to 3.6 in 1998.
There are only six countries, which had on the average more than 10,000 domestic
patent applications per annum during 1975-98. These are France, Germany, Japan, South
Korea, UK and USA. Of the 17 countries, which have more than 1000 domestic patent
30
applications per annum, only five are developing countries. These are Argentina, Brazil,
China, India and South Africa. Apart from these, all the other countries are developed
countries.
Of the 14 countries, which have on the average less than a 1000 domestic patent
applications and more than 100 domestic patent applications per annum only three countries
viz., Ireland, Israel and Norway are developed countries. The remaining 19 countries have
on the average less than 100 domestic patents per annum. Mauritius comes last with only
two domestic patents per annum. Hence, it is clear from the above analysis that while a few
developed countries can have low average domestic patent applications, very few
developing countries can have high domestic patent applications. The average patent figure
shows clearly the disparities in domestic patent applications as between countries, which is
an indicator of their comparative technological capabilities.
The imbalances in domestic patent applications across countries can be seen in yet
another way. Of the domestic patent applications in all the 56 countries in our sample, the
top five countries accounted for 76.9 percent, while the top ten countries accounted for 90.2
percent in 1998. The bottom twenty countries accounted for 0.16 percent of the total
domestic patent applications.11
Foreign Patenting
Foreign patenting across countries could be motivated by two factors. First, it could
be seen as attempts by the innovators to patent their inventions in countries that are most
likely to imitate their inventions. Secondly, it could represent an interest on the part of the
inventors to transfer their technologies to different countries. Any analysis of foreign
patenting will have to face the problem of double counting. While all the domestic
applications will not result in foreign patent applications, some patent applications will be
applied in more than one country. Some important patent applications may be filed in a
number of countries. This has to be taken into account while doing any analysis of foreign
patenting.
11 For the year 1975 our sample has 52 countries (China, Malaysia, Thailand and Zimbabwe do not have data for earlier years). The top five countries accounted for 76.9 percent while the top tent countries
31
Total foreign patents, by the 56 countries in our sample, which were 323,204 in
1975 rose to 942,620 in 1998, showing an annual compound growth rate of 4.5 percent.
Developed countries accounted for 86.2 percent of foreign patents during 1975-98.
Developing countries accounted for the remaining 13.8 percent.
There were considerable fluctuations in total foreign applications made during the
period. The 1975-84 period saw a sharp decline. The reason for this might be the European
Patent Convention, foreign patentees have started using EPC route for filing patent
applications instead of approaching the national patent offices. The Industrial Property
Statistics started reporting the EPC applications only from 1985. There was a sudden
increase in 1985 to the tune of about 200,000 applications. EPC countries saw an increase
of about 195,000 patent applications from 1984 to 1985, accounting for about 95 percent of
the increase over the previous year. After a steady increase during 1985 to 1990, foreign
patent applications saw a decline again during the period of 1990 and 1996. During the
years 1997 and 1998 a huge increase in the number of foreign patent applications was
recorded, in fact the year 1997 saw an increase of about 256,000 foreign patent applications
over the previous year while 1998 saw an increase of about 203,000 foreign patent
applications. Most of the increase in the foreign patent applications came from the EPC
countries. While the EPC countries saw an increase of about 252,000 foreign patent
applications in 1997 over 1996 (a share of 95 percent), it was about 178,000 in 1998 (a share
of 79.5 percent) over the previous year. Hence, much of the remarkable increase in foreign
patent applications goes to the EPC countries, because of the ease of applying for an EPC
patent.
There are fourteen countries, all of them developed countries12, which attracted on
an average, more than 10,000 foreign patent applications between 1975 and 1998. There are
nineteen countries, which attracted more than 1000 but less than 10000 foreign patent
applications per annum of which six are developed countries. Of the remaining 23
countries, which received less than 1000 foreign patent applications per annum, none of
them was a developed country. The destination of foreign patent applications between
countries thus shows skewedness in favour of the developed countries.
accounted for 88.2 percent of domestic patent applications. The bottom twenty countries accounted for 0.34 percent of domestic patent applications. We can see that concentration increased during this period.12 Eleven of them were members of EPC by 1998.
32
Proportion of Domestic Patents in Total Patents
The proportion of domestic patent applications to total patent applications can be
taken as an indicator of the relative significance of local technological capabilities of a
country. While domestic patents come from one single country, foreign patent applications
come from rest of the world; hence we could assume that foreign patent applications would
outweigh domestic patent applications. The other factor is that all domestic patent
applications do not end up as foreign patent applications. For example, out of total domestic
patent applications in the US only 1.12 percent were applied for in India during 1972-87.
The figure is 1.26 for UK and 0.89 for Germany (Rao [2002]).
We have taken the average proportion of domestic patents in total patents for the
period 1975-98. Of the twenty developed countries in our sample in only three of these
more than 50 percent of total patents came from domestic applicants. These are Japan
(66.72), the US (57.54) and Germany (54.33). Eight countries have domestic patent
applications accounting for more than 25 percent but less than 50 percent of total patent
applications. Among these are United Kingdom (37.42) and France (31.78). There are nine
countries whose domestic patent applications accounted for less than 25 percent of total
patent applications. These are Austria, Belgium, Canada, Denmark, Ireland, Italy, the
Netherlands, Norway and Spain. As many as seven of these countries are members of
EPC. With the ease of applying for an EPC patent there was a surge in foreign patent
applications in EPC member countries. This could be one reason why these countries
displayed a low proportion of domestic patent applications in total patent applications. In
the case of Belgium, the lowest proportion of domestic patents in total patents at 9.50
percent was observed. While the average number of domestic applications in Belgium was
1,000 during 1975-98, the average number of foreign patent applications was 16,000.
Belgium being a member of EPC attracts a large number of foreign patent applications.
Of the 36 developing countries in our sample, only two countries have domestic
patent applications accounting for more than 50 percent of total patent applications. These
are Iraq (56.21) and China (53.36). Iraq is a special case because the steep decline in
foreign patenting increased the share of domestic patent applications to more than 50
percent. The case of China is interesting: the country was generating more domestic patent
applications than the foreign patent applications it was attracting. Seven countries had more
33
than 25 percent and less than 50 percent of total patents being accounted for by domestic
patents. South Korea (43.69) and India (32.04) are in this group. There are 27 countries in
which for less than 25 percent of total patent applications came from domestic patentees. Of
these in six countries, domestic applications were less than ten percent of total patent
applications. These are Jamaica, Malaysia, Pakistan, Philippines, Portugal and Thailand.
One of the main problems faced by developing countries is the high proportion of
foreign patents in total patents. From the above analysis, it is clear that while in a majority
of developing countries the ratio of domestic patents to total patents was low, some
developed countries shared this characteristic. The average proportion of domestic patent
applications in the total was 29.08 percent for developed countries and 20.89 percent in
developing countries. For some of the members of EPC the increase in foreign patenting
activity after they joined EPC might have brought down the proportion of domestic patent
applications out of total patent applications. The fact that many developed countries also
had low proportion of domestic patents should not distract from the fact that developing
countries face acute problem with dominance of foreign patenting activity and also very low
domestic patenting activity.
Grant Ratio
Countries, which have substantive examination requirements for patentability, grant
only a proportion of patent applications. In this sub section, we will analyse the grant ratio
for different countries. In the United States 65 percent of patent applications were granted
patents during the 1970s (Griliches [1990] p.1663). It was 83 percent in the UK during
1950-76, 93 percent in France during 1951-79, and 35 percent in Germany during 1952-78
(Schankerman and Pakes [1986] p.1056). In Finland, it was it was 41 percent during 1974-
79 and in Norway 44 percent during 1974-79 (Pakes and Simpson [1989] p.381)13. There is
a lag between applications and grants and it depends upon the practices of the national
patent offices and the number of applications. According to Griliches [1989 p.295) the
United States Patent Office issued 95.1 percent of patents eventually issued within four
years for the application years 1966-80. The Indian Patent Office on the average took 4.3
years (from the date of application) to grant patents for the application years 1972-87 (Rao
13 The figures covers both domestic and foreign patents.
34
[2002]). Hence, we estimate the proportion of grants with a four-year lag. The application
years will be 1975-94 and the corresponding grant years will be 1979-98.
Domestic Applications: Countries in our sample can be divided into four groups based
on the ratio of grants to applications (hereafter the grant ratio). There are four countries,
in which the grant ratio was more than 90 percent. The countries in this group are
Trinidad and Tobago, Morocco, Tunisia, and Sri Lanka. These countries have a system
of registration of patent specifications hence, they do not do substantive examination of
patent specifications resulting in high grant ratio.
The second group of countries grants patents on less than 75 percent but more than
50 percent of domestic patent applications. There are thirteen countries in this group.
Prominent countries in this group are South Korea and United States with a grant ratio of
70.6 and 64.2 percent respectively. France grants patents to 74.3 percent of its domestic
patent applications.
The third group of countries is the most numerous with 29 countries, in which grant
ratio was between 25 and 50 percent of domestic patent applications. Germany is the most
interesting country with a grant ratio of only 42.3 percent. Differed examination could be
one of the reasons why the grant ratio is low in Germany. Japan had a comparatively a low
ratio grant of 27.5 percent of domestic patent applications. Wineberg [1988] says that in
Japan domestic inventors apply for a patent early in the R&D process, as there is no
requirement to show "reduction of the invention to practice". Apart from this, Japanese
apply for a patent to claim priority and many of the applicants do not request for an
examination (Wineberg [1988], pp.16). This puts Japan in the group of countries, which
grant the lowest percentage of domestic patent applications. India is also in this group with
38.4 percent of domestic patent applications being granted patents.
The last group consists of ten countries, which granted patents to less than twenty
five percent of domestic patent applications. Australia, China and United Kingdom are the
surprising entries in this group of countries. Australia grants only 14.2 percent of domestic
patent applications just above Egypt, the last country at 11.5 percent. China grants 24.2
percent of domestic patent applications while United Kingdom grants 23.3 percent.
Thus, almost 70 percent of the countries included in the sample gave patents 50
percent or less of the total applications made. While some of the more industrialized
35
countries have recorded better grants to patent applications ratios, the leading developing
countries have lower grants ratios.
Foreign Applications: Foreign patent applications had a higher grant percentage as
compared to domestic patent applications. One plausible reason for this could be that
while domestic patent applications come before patent offices for the first time, foreign
patent applications might have already been submitted, if not granted, by the time they
reach patent offices in foreign countries. Because only a low proportion of domestic
patents reach foreign patent offices these might have been chosen with care by the
applicants. Hence, they have more chances of being granted patents by foreign patent
offices.
There are seven countries, in which more than 90 percent of foreign patent
applications were granted patents. Apart from the four we have identified as patent
registration countries, the other three countries are Australia, Switzerland and Venezuela.
In twelve countries, the percentage of foreign patent applications getting patent
rights is between 75 and 90 percent. France and the United Kingdom with 87.6 and 80.9
percent respectively figure in this group.
The most numerous group of countries at 29 are those countries in which between
50 and 75 percent of foreign patent applications are granted patents. Germany grants
patents to 72.4 percent of foreign patent applications. While United States grants 70.6
percent, South Korea grants 61.6 percent of patents to foreign patent applications. India also
figures in this group with 56.7 percent of grants for foreign applications.
Interestingly China and Japan figure in the group of countries, which grant less than
50 percent but more than 25 percent of foreign patent applications. While China grants 46.5
percent of foreign patent applications, it is only 42.9 in Japan, higher than the percentage of
domestic patents granted at 27.5. The last set of countries, which grant less than 25 percent
of foreign patent applications are Jamaica and Costa Rica.
Growth of Patent Applications
In this sub-section, we will analyse the trends in patent applications, both domestic
and foreign patent applications during the period 1975-98. For this purpose, we have
calculated the compound annual growth rates.
36
Domestic Patents: Of the 56 countries in our sample 39 countries experienced a positive
growth rate in domestic patent applications while 17 countries showed a decline in their
domestic patent applications in the period 1975-98.
Of the 20 developed countries in our sample, four countries experienced a decline in
their domestic patent applications. These countries are Austria, Sweden, Switzerland and
United Kingdom. In Austria, the domestic patent applications were remarkably stagnant
over the twenty-four year period, showing a decline of 0.4 percent. Sweden witnessed a
decline in domestic patent applications during the period 1975 to 1990, from 4042 in
1975 the fell to 3340 in 1990. During the 1990s, there was a positive trend in domestic
patenting. Switzerland's domestic patent applications fell drastically during the period
1975-84. After witnessing a sharp increase in 1985 at 4372 domestic patent applications
were stagnant till 1998 reaching a figure of only 4342. Generally, we did not see any
drastic impact of the EPC on domestic patent applications, but in the case of Switzerland,
we feel that EPC might have had an impact on domestic patent applications. Swiss
domestic patent applicants seem to have preferred approaching the EPO rather than Swiss
national patent office. The decline during 1975-84 might be the result of the EPC
applications not being reported in the Industrial Property Statistics. But overall, one can
see that domestic patent applications in Switzerland are stagnant for a long time.
The United Kingdom experienced noticeable fluctuations in its domestic patent
applications during this period. The domestic patent applications, which were 20842 in
1975, fell to 19043 in 1984. During 1985-89, it witnessed a positive trend in domestic
patent applications. But the period 1990 to 1996 experienced a sharp decline. Domestic
patent applications, which were 21649 in 1990, fell to 19479 in 1996. There was,
however, a reversal of the trend in the following years. These fluctuations in domestic
patenting resulted in a decline of 0.03 percent during 1975-98. Of the developed
countries, which showed a positive growth rate, Japan's domestic patent applications grew
at 4.85 percent per annum. There are two distinct periods during 1975-98, which describe
Japan's domestic patenting activity. The first was 1975-87 and the second 1988-98. During
1975-87, domestic patent applications in Japan increased at the rate of 8.26 percent per
annum. The second period 1988-98 period witnessed virtual stagnation in Japan's domestic
patent applications growing at only 1.01 percent per annum. The United States, which
37
experienced increase in domestic patenting of a somewhat lesser magnitude as compared to
Japan, US domestic patent applications showed a growth rate of 3.46 percent per annum
during 1975-98. Two distinct phases are observed in respect of the United States' domestic
patenting activity. In the phase, 1975-83 domestic patent applications in the US declined by
0.68 percent per annum. The second period of 1984-98 saw a growth rate of 5.67 percent
per annum in US domestic patent applications. The growth rates in domestic patent
applications of the other major countries viz., Germany and France were 2.83 percent 1.93
percent per annum respectively.
What comes out clearly from the above analysis of growth trends in domestic patent
applications in the five largest domestic patenting countries is the following. The time
period 1975-98 could be divided into two phases. The first phase roughly covers the period
1975-84 and the second 1985-98. In the first phase France, United Kingdom and United
States of America (1975-83) witnessed a decline in their domestic patent applications of the
magnitude of 0.88, 0.81 and 0.68 respectively. Germany witnessed a growth rate of only
0.36. In the second phase these countries except United Kingdom witnessed positive
growth rates in their domestic patent applications, which were 1.22 percent, 2.66 percent
and 5.74 percent respectively for France, Germany and Japan respectively. United
Kingdom continued to experience a decline. The experience of Japan on the other hand has
been exactly the opposite. During the first phase covering 1975-87, the growth rate in
domestic applications was 8.26 percent, the growth in the second phase covering1988-98
was 1.01 percent per annum. What could be the reasons for this? We speculate that the
macro economic performance of these countries during these phases is responsible for this.
Of the 36 countries developing countries in our sample as many as thirteen countries
experienced a decline in their domestic patent applications during the period 1975-98. These
countries are Argentina, Costa Rica, Ecuador, El Salvador, Greece, Guatemala,
Honduras, Jamaica, Mexico, Pakistan, Peru, Uruguay and Venezuela. Of these thirteen
countries, eleven belong to the Latin American region. The macro economic turmoil faced
by these countries during the period under study seems to have had a severe effect on their
domestic patenting performance. The other two countries, which witnessed a decline in
their domestic patent applications during this period, were Greece and Pakistan. Greece
witnessed one of the most dramatic declines in domestic patent applications with an 8.68
38
percent annual decline. The domestic patent applications, which were 1664 in 1975, fell to
170 in 1998. This period can be divided into two segments. Between 1975 and 1987, there
was a relatively small decline, 1664 applications to 1548 applications. The decline from
1987 to 1988 was very sharp when the number of domestic patent applications fell to 378.
This decline continued till 1998. Pakistan witnessed a decline of 1.75 percent in its
domestic patent applications during the period under consideration.
Among the developing countries, which showed a growth rate of more than ten
percent in their domestic patent applications, are China, Egypt, Iraq, South Korea,
Malaysia and Thailand. Of the countries, which showed more than 10 percent growth per
annum, South Korea and China are interesting cases. South Korea whose domestic patent
applications were 1,326 in 1975 rose up to 50,596 domestic patent applications in 1998, an
increase of 22.59 percent per annum. China introduced a modern patent system in 1984.
Domestic patent applications, which were 4,065 in 1985, went up to 13,726 in 1998. These
two countries will be discussed in depth later.
There are twelve countries, which show a growth rate of more than one percent and
less than ten percent per annum. India with 1.95 percent is in this group. Apart from this,
the countries with a growth rate between zero and one number five.
Foreign Patents: While 34 countries out of the 56 countries in our sample showed a
positive growth rate in foreign patent applications, as many as 22 countries showed a decline
in foreign patent applications during the period 1975-98.
Among 20 developed countries in our sample, four countries experienced a decline
in their foreign patent applications during 1975-98. These are Australia, Canada, Japan and
Norway. In all these countries, the decline was particularly sharp during the 1990s.
Australia witnessed a stagnation of foreign patent applications at around 10000 for the
period 1975-90. Between 1990 and 1998, the number of foreign patent applications fell
from 10502 to 5847. The fall in foreign patent applications in Australia was 2.52 per
annum. In Canada, foreign patent applications grew between 1975 (25237 applications) and
1989 (32060 applications). But they fell sharply thereafter. In 1998, foreign patent
applications were 11338, which was less than half of that in 1975. As a result, Canada
witnessed a decline of 2.82 percent per annum in its foreign applications for the period
1975-98. In Japan, foreign patent applications were stagnant between 1975 (24703
39
applications) and 1992 (24699 applications), but fell between 1992 and 1998 (21280
applications). It is surprising that Japan being a large economy attracted relatively smaller
number of foreign patent applications and also that they were either stagnant are falling
while foreign patenting is growing in other countries. The number of foreign patent
applications in Japan fell by 0.62 percent between 1975 and 1998. The observed tendencies
in foreign patenting activity in Japan can be ascribed to the procedures followed by the
Japanese Patent Office. Wineberg [1988] cites the practice of the Japanese system in having
opposition proceedings at various stages of the grant of a patent as a barrier for foreigners
applying for patents in Japan. Norway also experienced a sharp fall in foreign patent
applications. Foreign patent applications fell from 4122 in 1992 to 2083 in 1993 and
continued falling till they reached a level of 1534 applications in 1998. In Norway, the
foreign patent application fell by 2.17 percent per annum. Among the developed countries
that experienced increases in foreign patenting were the members of EPC. The tendencies
observed in case of these countries would be dealt with in detail in a later section. Three of
the leading countries in terms of patenting activity, viz., the United States, France and
Germany witnessed impressive growth in foreign patenting. The United Sates witnessed a
growth rate of 4.55 percent per annum. France had a growth rate of 4.36 percent per annum,
UK 3.93 percent per annum and Germany 3.42 percent per annum.
Of the 36 developing countries in our sample, as many as 22 countries experienced a
decline in their foreign patent applications. These countries are Bolivia, Brazil, Costa Rica,
Egypt, El Salvador, Guatemala, Iran, Iraq, Jamaica, Mauritius, Morocco, Panama, South
Africa, Sri Lanka, Trinidad & Tobago, Tunisia, Venezuela and Zimbabwe. Nine of these
countries are from Latin America. As was with their domestic patent applications the macro
economic turmoil these countries faced during the period under study, might have had an
adverse impact on foreign patent applications.
Six developing countries experienced a growth rate of more than ten percent per
annum in their foreign patent applications during the period 1975-98. These countries are
China, Greece, South Korea, Malaysia, Portugal and Thailand. Of these countries, the
China (11.2 percent) and South Korea (10.9 percent) recorded the highest increases in
foreign patenting. Foreign patent applications in China increased from 4493 in 1985 to
12,102 in 1997 and 22,234 in 1998. Similarly, foreign patent applications in South Korea
40
went up from 1588 in 1975 to 16,457 in 1997 and 24,637 in 1998. As we have noted in the
previous sub-section these are the countries, which have shown remarkable performance as
far as their domestic patent applications are concerned. In the case of Greece and Portugal,
the increase in foreign patent applications was solely because of their membership of the
EPC. There are nine countries, which have had a growth rate of between one and ten
percent. India is in this group with a growth rate of 5.6 percent. All the three countries,
which experienced a growth rate of zero to less than one in their foreign patent applications,
are from Latin America.
European Patent Convention
Here we will discuss the experiences of countries, which joined the European Patent
Convention after 1985. These countries are Denmark, Finland, Greece, Ireland, Portugal
and Spain. The reason for this choice is because we have breakup of the patent applications
received by the national patent offices and the EPO right from the start of their membership.
The availability of this data would enable us to examine the impact of these countries
joining EPC on production of domestic patent applications. We would also examine the
impact of the membership of EPC on foreign patent applications. As we have seen most of
the increase in foreign patent applications worldwide is coming from new members of EPC.
This analysis may shed some light as to what is likely to happen when developing countries
join the Patent Cooperation Treaty (PCT).
Denmark (1990), Finland (1996), Greece (1986), Ireland (1992), Portugal (1992)
and Spain (1990) have data prior to and after joining the EPC. We had to exclude Finland
because it did not have enough observations and Greece because of a continuous and
precipitous fall in domestic patent applications much before joining the EPC. We did Chow
test to see whether there is a structural break in domestic patent applications and foreign
patent applications after a country joined the EPC.
Table 3: Structural break in domestic and foreign patent applications: Chow test
Country Domestic
applications
Foreign
applications
Denmark **3.24 *5.28
41
Ireland 1.39 *24.37
Portugal 0.78 *18.80
Spain 1.82 1.49
* Significant at 1% level, ** significant at 5% level
It is interesting to note from the above table that the entry into EPC did not have any
major impact on domestic patent applications in Ireland, Portugal and Spain, while there
was an impact on the domestic patent applications of Denmark. While Denmark had the
technological capability to take advantage of joining EPC and hence increase its domestic
patent applications, the other countries did not have the technological capability and hence
could not take advantage of joining the EPC14. Technological capability will have an
impact on patent output rather than ease of patent application procedure. Ease of patent
applications procedure will have a modest impact on patent output.
On the other hand, all the countries except Spain show a structural break in foreign
patent applications after joining EPC. The ease of applications procedure which
membership of EPC affords foreign patent applicants had an immediate impact on the
number of foreign patent applications. Spain on the other hand saw a peak in foreign patent
applications in 1989 before it joined the EPC. It joined the EPC in 1990 actually saw a fall
in foreign patent applications (received both at the national patent office and the EPO) till
1996.
What lessons can be drawn from the experiences of these countries, which joined
after 1985 for countries joining PCT? The ease of applying for foreign patents through PCT
will only give a marginal benefit for the countries joining PCT. A PCT application is not a
worldwide patent application, after an initial period the applicant has to approach the
national patent offices for grant of a patent. Only those countries, which have a
technological capability and produce patents, which are important worldwide, will derive
any benefit from joining PCT and applying through it. This technological capability comes
from elsewhere than by joining PCT alone.
14 Fagerberg [1988] identifies Denmark in a cluster of countries with 'high levels of productivity and relatively low levels of measured technological activity'. He identifies Ireland and Spain in a cluster of countries with ' Low levels of productivity and patenting but their R&D efforts vary considerably (Semi-Industrialised countries)'.
42
Convergence of Number of Foreign Patent Applications: Here we will analyse the
behavior of foreign patent applicant at the EPO. We have the foreign patenting data coming
through the EPO since 1985. Figure 2 depicts the number of foreign patent applications
received by the EPO with particular country designations. The trends in these foreign patent
applications figure are interesting. There was a steady increase in foreign patent
applications from 1985 to 1990 when it reached a peak. After 1990, there was a decline till
1996 with the exception of 1992. The trends in almost all the countries are the same but the
levels are different. During this period the foreign applicants still seems to have chosen the
countries in which their EPC patent will be valid, taking economic reasons into account.
The convergence of patent counts started in 1997 and reached a culmination in 1998 where
the foreign patent application figures for all the countries was around 46000. The only
exception was Germany where the foreign patent applicants seemed to approach the national
patent office instead of going to the EPC, with Germany as a designated country. The
interesting thing about this convergence is that countries such as Finland and Portugal,
which joined the EPC later, were also a part of this. The impact of this convergence in the
number of foreign patent applications will be apparent only after some time.
We can already see similar impact on PCT countries as has happened in the case of
EPC countries. The number of designations is increasing in all the PCT member countries.
But unlike EPC the number of foreign patent applications, reaching the national patent
offices did not show much change.
ASEAN Countries
The countries of Association of South East Asian Nations (ASEAN) have achieved a
remarkable performance in economic growth till the crisis in 1997. In this sub-section, we
will briefly analyse their patenting performance. ASEAN has ten members, which are
Brunei Darussalam, Cambodia, Indonesia, Laos, Malaysia, Myanmar, Philippines,
Singapore, Thailand and Vietnam. Of these, Brunei Darussalam, Cambodia, Laos and
Myanmar never reported to Industrial Property Statistics for the period 1975-98. Vietnam
had an 'inventors’ certificate' system till 1997. As discussed earlier Singapore had a re-
registration system till 1995. The case of Indonesia is interesting. Indonesia joined the Paris
Convention in 1950. It did not have a patent system till 1989. Between 1970 and 1998 on
43
the average, it received 44 domestic patent applications and 1332 foreign patent
applications. It did not report a single patent grant till 1994. How could Indonesia be a
member of the Paris convention with out any patent law in force? According to WIPO
[1984], Indonesia announced provisional measures in anticipation of the introduction of a
patent law. These provisional measures stated that patents might be provisionally filed. But
any grant had to wait the enactment of a patent law, which came about only in 1989.
That leaves us with Malaysia, Philippines and Thailand. Malaysia had a re-
registration system between 1951 and 1983. For Malaysia, patent data is available only
from 1985. For Thailand, it is available only from 1979 when it enacted its first patent law.
The average number of domestic applications was 121 for Malaysia (1985-98), 125 for
Philippines (1975-98) and 161 for Thailand (1979-98). The average number of foreign
patent applications was 2678 for Malaysia, 1907 for Philippines and 1812 for Thailand.
For countries, which have such a high growth path and foreign direct investment
these figures seem to be rather, low. On the average number of domestic patent applications
for the period 1975-98 Thailand, Malaysia and Philippines occupy 32nd, 35th and 36th
position respectively. Comparatively India was in the 19th position. On the average number
of foreign patent applications during the same period Thailand, Malaysia and Philippines
occupy 29th, 31st and 32nd position respectively. Comparatively, India was in the 27th
position.
Although we cannot come to any strong conclusions on such aggregate figures, we
speculate that the foreign direct investment and technology transfer to these countries was
not patent based. Patents, either domestic or foreign did not play any significant role in their
growth performance.
China and South Korea
China and South Korea stand out as outstanding examples of good performance in
domestic patenting. They deserve a special mention. We will make some comments on
their patenting performance in this section.
South Korea had its first patent law in 1961. It joined the Paris convention in 1980
and the PCT in 1984. South Korea's domestic patenting performance especially in the
1990s has been nothing but spectacular. South Korea's domestic patent applications, which
44
were 1326 in 1975 rose to 50596 in 1998. The compound annual growth was 22.6 percent.
The average number of domestic patent applications for this period was 15850.
There are four distinct phases in the emergence of South Korea as a major patenting
country. In the first phase between 1975 and 1984, the average number of domestic patent
applications was 1367. In the second phase between 1985-90, this number increased to
5500. In the third phase (1990 to 1995), this number again rose to 19800. Finally, it
culminated by reaching the figure of 63626 between 1995-98. In the process, it surpassed
France in 1992, the United Kingdom in 1993 and Germany in 1995 in the number of
domestic patent applications. While it occupied 18th position in the number of domestic
patent applications in the year 1975, it rose to 4th in 1998. The average proportion of
domestic patent applications to total applications for the period 1975-98 was a very credible
43.7. The grant percentage of domestic patents was very high at 70.6 percent. La Croix and
Kawaura [1996] while discussing the amendments carried out in 1981 to the Korean Patent
Act, 1961 say "multiple claims for related inventions could be contained in a single
application" (pp.112). This means that South Korea like Japan insisted on one patent for
each claim before 1981. Did the amendment in 1981 apply to foreign inventors only or
domestic inventors too? Does the rise in the domestic patent applications in South Korea
the result of splitting of patents?
Major amendments were carried out to the Korea patent law of 1961, in 1986 under
pressure from the United States.15 Is there any linkage between this change in the patent law
and the performance of the domestic patent applications? Mansfield [1989] says, "When
countries like Korea, Brazil and Taiwan become increasingly industrialized, and as their
industries become more innovative, their attitudes toward patents are likely to change"
(pp.408). While it is important that as a country gets more industrialized (or acquires more
technological capability) it would prefer having a stronger patent system, the important
question is how did it acquire its initial technological capability under a 'weak' patent
regime. As La Croix and Kawaura [1996] say the changes made to the patent act in 1986
were the result of the pressure from the US unlike the change in Japan, which came from
within. Did South Korea take advantage of the advent of a 'strong' patent system and
improve its domestic patenting performance? Does this offer a lesson to other developing
15 For a history of the changes in the patent law in South Korea see La Croix and Kawaura [1996].
45
countries? Are other developing countries in a situation to take advantage of 'strong'
TRIPs-consistent patent systems, which will be in place shortly?
The other developing country, which had performed credibly on the domestic
patenting scene, is China. China introduced a patent system in 1984 with technical help
from Germany. It joined the Paris convention in 1985 and the PCT in 1994. The domestic
patent applications from China, which were 4065 in 1985 rose to 13726 in 1998. They
showed a compound annual growth rate of 12.0 percent. Domestic patent applications
accounted for 53.3 percent of total applications. But the grant percentage of domestic
patents is very low at 24.2 percent.
46
Development and Patenting Activity
In this section, we will analyze the relationship between selected macro-economic
variables and patents. This is the first such large scale study to explain the patenting
behavior of countries through macro-economic variables.
One of the most contentious issues in the discussions on the international patent
system in various fora has been whether countries at different stages of development
benefit from the patent system in the same way (Pretnar [1953]). The developing
countries argued that their stage of technological development, which is a manifestation
of their overall development, requires a 'lesser' level of patent protection than that
afforded in the now developed countries. They also pointed out to the fact that developed
countries in their stages of technological development experimented with the patent
system in various ways and it was only after they achieved technological development
that they tend to have a 'strong' patent system. This argument, which by its very nature is
a post-colonial phenomenon, culminated in many developing countries to 'reform' their
patent systems in the late 1960s and early 1970s. These developments at the national
level were sought to be given an international recognition when developing countries
asked for the revision of the Paris convention. This revision process resulted in a failure
(Rao [1989a]). On the other hand the developed countries, which were successful in
introducing the so-called ‘Trade Related Aspects of Intellectual Property Rights’, in
General Agreement on Tariffs and Trade, succeeded in including an Agreement on TRIPs
as part of the World Trade Organization (WTO). During these GATT negotiations on
TRIPs developed countries argued that 'lesser' level of patent protection in developing
countries is not only distorting trade but also acting as a disincentive for investment in
R&D in developing countries (Rao [1989b]). While the developing country argument is
based on the premise that technological diffusion is comparatively more important than
generation of technology, the developed countries argue that generation of technology is
more important than diffusion. This differences in perceptions arises because,
developing countries are consumers of technology, while developed countries are
generators of technology.
47
It is admittedly difficult to empirically verify the hypothesis about stages of
development and what kind of a patent system should countries have, our attempt here is
to see how a country's patenting is influenced by major macro variables. The major
problem with this will be the fact that the low domestic patenting performance of
developing countries may arise from two sources. One the low technological capability
and the other the 'weak' patent system that most of these countries have. There is no way
to differentiate between these two effects. We assume that technological capability
dominates the strength of the patent system in determining the number of patent
applications.
The Model
We will analyze the determinants of domestic and foreign patenting separately.
Hence, we will give our analytical framework for these separately below.
Domestic Patenting: The macro economic variables, which we use for explaining the
intensity of domestic patenting activity are: GDP per capita and foreign trade intensity.
The rationale and the hypothesis regarding the two macro economic variables
chosen for explaining domestic patenting activity is given below:
GDP Per Capita: We use GDP per capita as a proxy to measure the level of
development. We hypothesize that there is a positive relationship between the level of
development and domestic patenting intensity. The higher the level of development the
higher will be the patent output per 1000 population. With a higher level of
development, a country's capacity to invest in Research and Development (R&D) goes up
and will have a positive impact on patent output.
Foreign trade intensity: Foreign trade intensity is exports plus imports as a
percentage of GDP. We have taken foreign trade intensity as a proxy to measure the
openness of the economy. We hypothesize that the higher foreign trade intensity the
higher the domestic patent output. The trade intensity will indicate the integration of an
economy into the world economy, and the higher intensity means that the economy is
fully integrated and hence will have a better allocation of resources from a global point of
view.
48
We estimate the following equation
DPit = αααα + ββββ1GDPPCit + ββββ2EXIMit + u
Where DP is domestic patenting, GDPPC is Gross Domestic Product per capita and
EXIM is exports and imports as percentage of GDP. The i and t subscripts refer to
individual countries and time periods respectively.
Foreign Patenting: The decision to patent in a foreign country is an important one for
a patentee. As it is expensive to take patents in a foreign country, s/he has to carefully
select those countries in which s/he has to take patents. For a patentee from a developed
country (these are the countries from which foreign patents originate) the first
consideration will be to patent in those countries, which have the technological capability
to imitate his/her invention. Hence, the first reaction is defensive. Most countries in this
list will be developed countries. Some developing countries, which have the
technological capability, can also figure in the list. Depending on the importance of the
invention a patentee may take patent in a number of countries. In this scenario, least
developed countries will not figure what ever may be the importance of the invention for
a particular country.
The macro economic variables through which we will explain foreign patenting
intensity are: GDP per-capita, foreign trade intensity and Net Foreign Direct Investment
intensity.
The rationale and the hypothesis regarding these three macro economic variables
chosen for explaining foreign patenting activity is given below:
GDP Per Capita: We use GDP per capita as a proxy to measure the level of
development. We hypothesize that there is a positive relationship between the level of
development and foreign patenting intensity. The higher the level of development the
higher will be the foreign patent intensity. Foreign patentees while deciding about the
countries in which to take patents choose those countries, which are more developed than
which are less developed. A more developed country will mean a better market for the
patented product or the product made by the patented process.
Foreign Trade Intensity: We have taken the combined export and import intensity
as a proxy to measure the openness of the economy. We hypothesize that the higher the
foreign trade intensity the higher the foreign patent activity. The trade intensity will
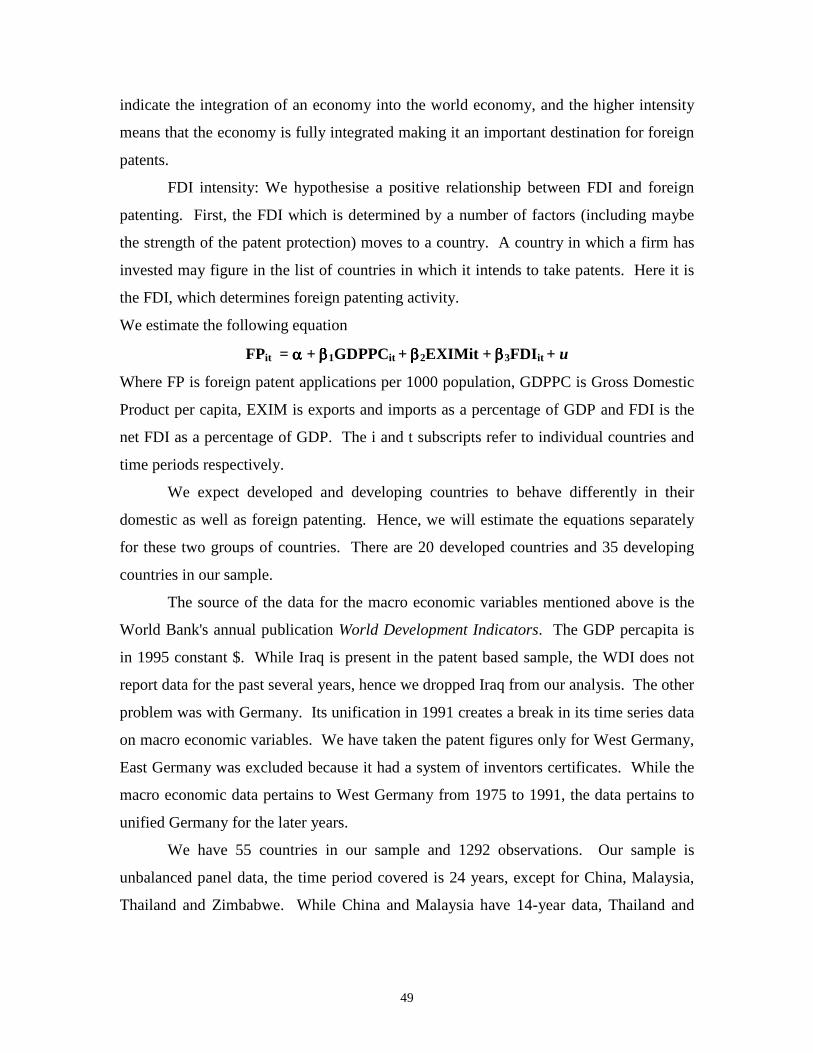
49
indicate the integration of an economy into the world economy, and the higher intensity
means that the economy is fully integrated making it an important destination for foreign
patents.
FDI intensity: We hypothesise a positive relationship between FDI and foreign
patenting. First, the FDI which is determined by a number of factors (including maybe
the strength of the patent protection) moves to a country. A country in which a firm has
invested may figure in the list of countries in which it intends to take patents. Here it is
the FDI, which determines foreign patenting activity.
We estimate the following equation
FPit = αααα + ββββ1GDPPCit + ββββ2EXIMit + ββββ3FDIit + u
Where FP is foreign patent applications per 1000 population, GDPPC is Gross Domestic
Product per capita, EXIM is exports and imports as a percentage of GDP and FDI is the
net FDI as a percentage of GDP. The i and t subscripts refer to individual countries and
time periods respectively.
We expect developed and developing countries to behave differently in their
domestic as well as foreign patenting. Hence, we will estimate the equations separately
for these two groups of countries. There are 20 developed countries and 35 developing
countries in our sample.
The source of the data for the macro economic variables mentioned above is the
World Bank's annual publication World Development Indicators. The GDP percapita is
in 1995 constant $. While Iraq is present in the patent based sample, the WDI does not
report data for the past several years, hence we dropped Iraq from our analysis. The other
problem was with Germany. Its unification in 1991 creates a break in its time series data
on macro economic variables. We have taken the patent figures only for West Germany,
East Germany was excluded because it had a system of inventors certificates. While the
macro economic data pertains to West Germany from 1975 to 1991, the data pertains to
unified Germany for the later years.
We have 55 countries in our sample and 1292 observations. Our sample is
unbalanced panel data, the time period covered is 24 years, except for China, Malaysia,
Thailand and Zimbabwe. While China and Malaysia have 14-year data, Thailand and
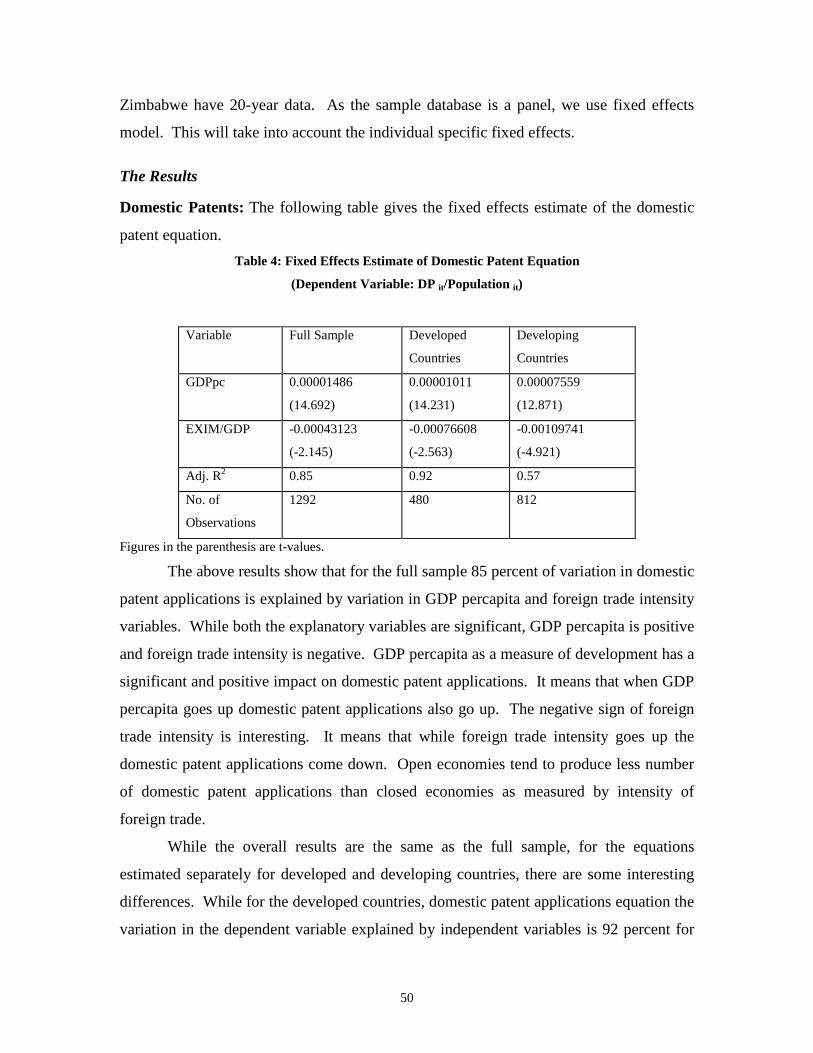
50
Zimbabwe have 20-year data. As the sample database is a panel, we use fixed effects
model. This will take into account the individual specific fixed effects.
The Results
Domestic Patents: The following table gives the fixed effects estimate of the domestic
patent equation.
Table 4: Fixed Effects Estimate of Domestic Patent Equation
(Dependent Variable: DP it/Population it)
Variable Full Sample Developed
Countries
Developing
Countries
GDPpc 0.00001486
(14.692)
0.00001011
(14.231)
0.00007559
(12.871)
EXIM/GDP -0.00043123
(-2.145)
-0.00076608
(-2.563)
-0.00109741
(-4.921)
Adj. R2 0.85 0.92 0.57
No. of
Observations
1292 480 812
Figures in the parenthesis are t-values.
The above results show that for the full sample 85 percent of variation in domestic
patent applications is explained by variation in GDP percapita and foreign trade intensity
variables. While both the explanatory variables are significant, GDP percapita is positive
and foreign trade intensity is negative. GDP percapita as a measure of development has a
significant and positive impact on domestic patent applications. It means that when GDP
percapita goes up domestic patent applications also go up. The negative sign of foreign
trade intensity is interesting. It means that while foreign trade intensity goes up the
domestic patent applications come down. Open economies tend to produce less number
of domestic patent applications than closed economies as measured by intensity of
foreign trade.
While the overall results are the same as the full sample, for the equations
estimated separately for developed and developing countries, there are some interesting
differences. While for the developed countries, domestic patent applications equation the
variation in the dependent variable explained by independent variables is 92 percent for
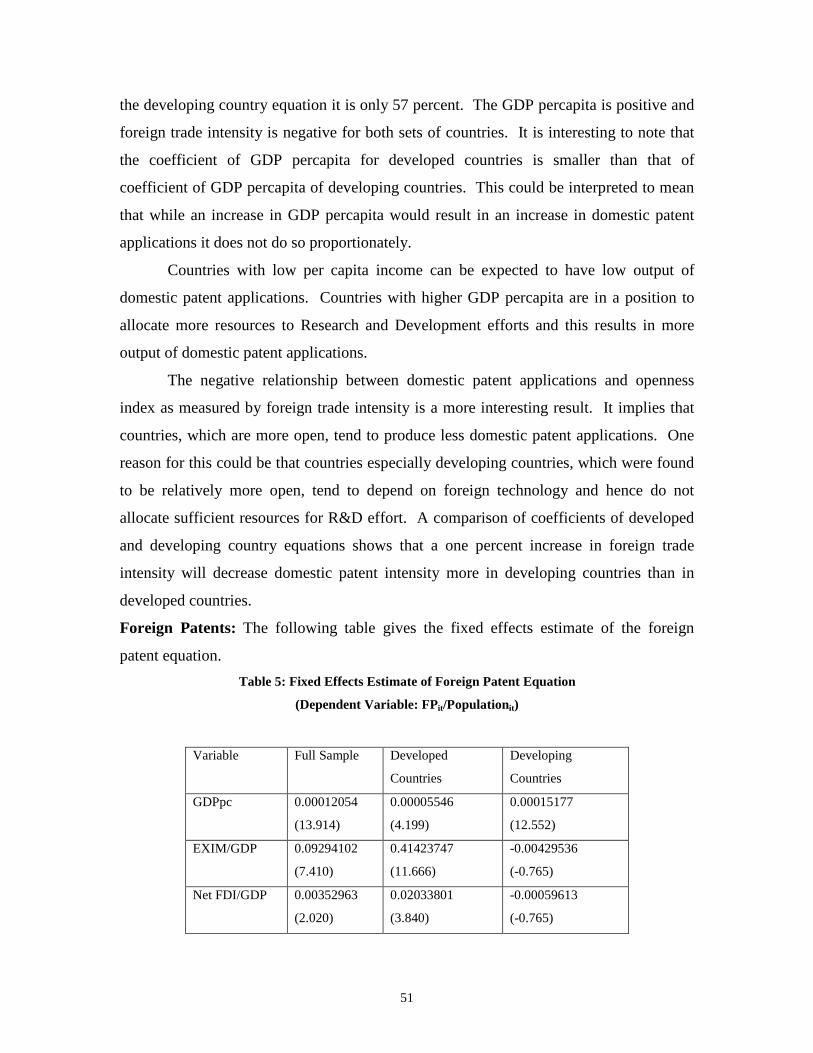
51
the developing country equation it is only 57 percent. The GDP percapita is positive and
foreign trade intensity is negative for both sets of countries. It is interesting to note that
the coefficient of GDP percapita for developed countries is smaller than that of
coefficient of GDP percapita of developing countries. This could be interpreted to mean
that while an increase in GDP percapita would result in an increase in domestic patent
applications it does not do so proportionately.
Countries with low per capita income can be expected to have low output of
domestic patent applications. Countries with higher GDP percapita are in a position to
allocate more resources to Research and Development efforts and this results in more
output of domestic patent applications.
The negative relationship between domestic patent applications and openness
index as measured by foreign trade intensity is a more interesting result. It implies that
countries, which are more open, tend to produce less domestic patent applications. One
reason for this could be that countries especially developing countries, which were found
to be relatively more open, tend to depend on foreign technology and hence do not
allocate sufficient resources for R&D effort. A comparison of coefficients of developed
and developing country equations shows that a one percent increase in foreign trade
intensity will decrease domestic patent intensity more in developing countries than in
developed countries.
Foreign Patents: The following table gives the fixed effects estimate of the foreign
patent equation.
Table 5: Fixed Effects Estimate of Foreign Patent Equation
(Dependent Variable: FPit/Populationit)
Variable Full Sample Developed
Countries
Developing
Countries
GDPpc 0.00012054
(13.914)
0.00005546
(4.199)
0.00015177
(12.552)
EXIM/GDP 0.09294102
(7.410)
0.41423747
(11.666)
-0.00429536
(-0.765)
Net FDI/GDP 0.00352963
(2.020)
0.02033801
(3.840)
-0.00059613
(-0.765)
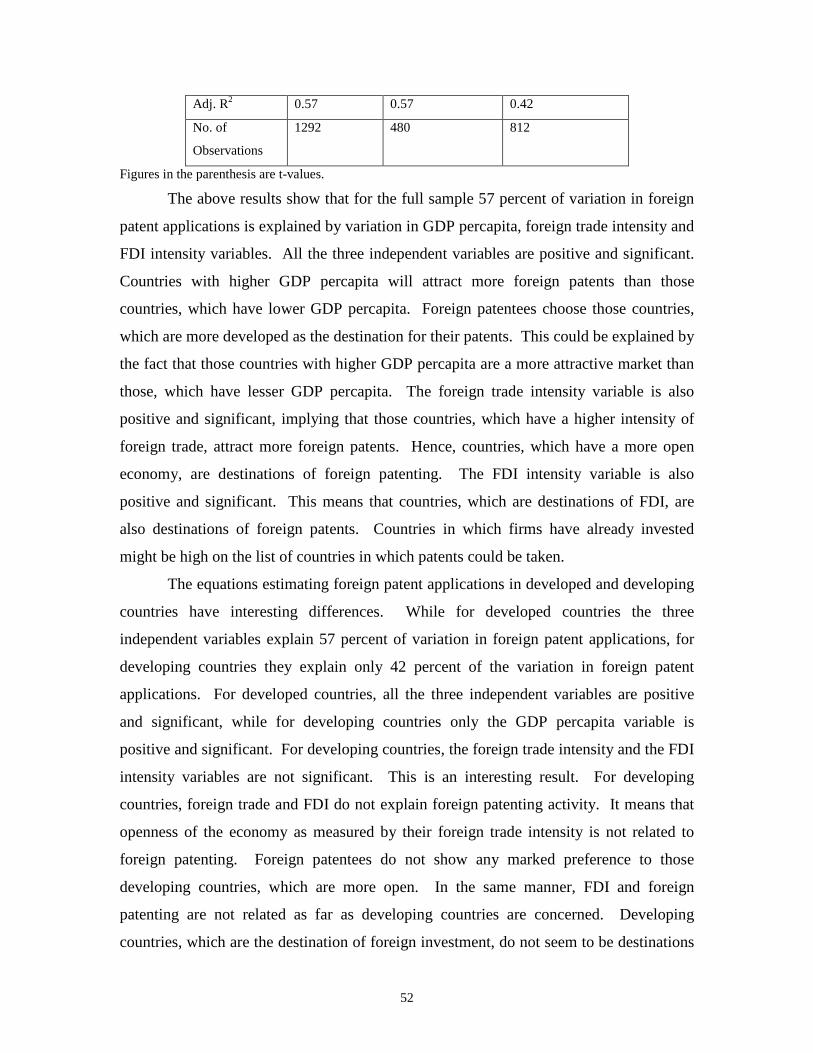
52
Adj. R2 0.57 0.57 0.42
No. of
Observations
1292 480 812
Figures in the parenthesis are t-values.
The above results show that for the full sample 57 percent of variation in foreign
patent applications is explained by variation in GDP percapita, foreign trade intensity and
FDI intensity variables. All the three independent variables are positive and significant.
Countries with higher GDP percapita will attract more foreign patents than those
countries, which have lower GDP percapita. Foreign patentees choose those countries,
which are more developed as the destination for their patents. This could be explained by
the fact that those countries with higher GDP percapita are a more attractive market than
those, which have lesser GDP percapita. The foreign trade intensity variable is also
positive and significant, implying that those countries, which have a higher intensity of
foreign trade, attract more foreign patents. Hence, countries, which have a more open
economy, are destinations of foreign patenting. The FDI intensity variable is also
positive and significant. This means that countries, which are destinations of FDI, are
also destinations of foreign patents. Countries in which firms have already invested
might be high on the list of countries in which patents could be taken.
The equations estimating foreign patent applications in developed and developing
countries have interesting differences. While for developed countries the three
independent variables explain 57 percent of variation in foreign patent applications, for
developing countries they explain only 42 percent of the variation in foreign patent
applications. For developed countries, all the three independent variables are positive
and significant, while for developing countries only the GDP percapita variable is
positive and significant. For developing countries, the foreign trade intensity and the FDI
intensity variables are not significant. This is an interesting result. For developing
countries, foreign trade and FDI do not explain foreign patenting activity. It means that
openness of the economy as measured by their foreign trade intensity is not related to
foreign patenting. Foreign patentees do not show any marked preference to those
developing countries, which are more open. In the same manner, FDI and foreign
patenting are not related as far as developing countries are concerned. Developing
countries, which are the destination of foreign investment, do not seem to be destinations
53
for foreign patenting. One reason for this could be that the foreign direct investment is
not patent related. The fact that these three independent variables are positive and
significant for developed countries mean that foreign patentees react differently to
developed and developing countries in their patenting decisions.
54
Summary and Conclusions
This study had two main objectives. The first was to carry out a cross-country
comparison of patenting activity, spanning the period 1975-98. The second was to relate
the observed patterns in patenting to the economic characteristics of the selected
countries.
The choice of the initial year was guided by the fact that patent laws in many
countries were changing during the 1970s and it was therefore our intention to capture the
changes that the patent laws had caused to the patenting activity in various countries.
The source of our data on patents is the Industrial Property Statistics. We collected
resident and non-resident patent applications and grants for the period 1975-98. A total
of 151 countries and OAPI have reported at least once during this period. After a
preliminary analysis of the data, we have decided to remove various country grouping
from our sample. These are small economies, least developed countries, former socialist
countries, re-registration countries, countries that did not report for more than 12 years,
countries that reported zero domestic patents for more than 11 years, countries that did
not report grant for more than 11 years. The sample consists of 56 countries out of which
36 countries are developing countries.
We did a review of literature of all the studies, which try to explain either
domestic or foreign patenting at country level through macro economic variables. In the
literature, domestic patenting has been explained only through R&D expenditure while in
our study we try to explain domestic patenting through macro economic variables. In the
literature, foreign patenting has been explained through macro economic variables. But
these studies only explain the foreign patenting activity in or by developed countries. In
our study, we try to explain foreign patenting in a country through macro variables. Our
study is also broad based and covers a period of 24 years.
We also discuss the pros and cons of using patent data as an economic indicator.
We discuss this in three broad heads of patents as indicators of technological change,
problems in using patent data across countries and using applications data instead of
grant data.
In our section on Statistical Profile of the International Patent System, we tried to
provide some very basic quantitative information on the international patent system,
55
which has been done for the first time. This section includes trends in the aggregate
domestic and foreign patenting in the countries included in our sample, ownership pattern
according to developed and developing countries, proportion of domestic patents to total
patents, grant ratio and growth of patent applications in individual countries. We also
discuss the structural break in domestic patenting in newer countries of EPC and
domestic and foreign patenting in ASEAN. We also discuss domestic patenting in China
and South Korea, which have experienced remarkable performance.
Aggregate domestic patenting in the countries in our sample is heavily
concentrated in developed countries. The share of developed countries in total domestic
applications during 1975-98 was 88 percent, that of developing countries 12 percent. There
are considerable differences in the share of different countries within these groups. Japan
and the US accounted for 48 percent of the total patent applications for the period 1975-98.
The share of developing countries in total applications rose from 6 in 1975 to 18 percent in
1998. Of the domestic patent applications in all the 56 countries in our sample, the top five
countries accounted for 77 percent, while the top ten countries accounted for 90 percent in
1998. The bottom twenty countries accounted for just 0.16 percent of the total domestic
patent applications.
Likewise, most of the foreign patenting is done in developed countries.
Developed countries accounted for nearly 86 percent of foreign patents during 1975-98.
Developing countries accounted for the remaining 14 percent.
The average proportion of domestic patent applications in the total applications was
about 29 percent for developed countries and just less than 21 percent in developing
countries.
We also found that South American countries, which had macro economic
problems in the 1980s, have shown a remarkable decline in domestic and foreign
patenting.
Chow test to see whether there was a structural break in domestic patenting in the
newer members of EPC has shown that this happened in the case of only Denmark and
not in Ireland, Portugal and Spain. A look at ASEAN countries has shown that their
domestic and foreign patenting does not reflect their growth performance.
56
In the section on development and patents, we tried to find the relationship
between domestic patenting activity and the macro-economic variables of the sample
countries. Lack of comparable data for a number of key variables like R&D expenditure
and the degree of industrialization achieved by the countries, posed severe limitation on
this part of the analysis. From the available data, two sets of variables were included.
These were GDP per capita and Exports plus imports as percentage of GDP (as a measure
of openness). We also try to find the determinants of foreign patenting liking it up with
GDP percapita and Exports plus imports as percentage of GDP (as a measure of
openness) and foreign direct investment as percentage of GDP. We find that while
domestic patenting and GDP percapita are positively related, openness and domestic
patenting are negatively related. On the other hand, while GDP percapita is positively
related to patenting both openness and FDI while positive and significant for developed
countries is not significant in the case of developing countries.
As was stated at the outset, the present study represents the first step towards a
better understanding of patenting behaviour of countries spread across the development
spectrum. This analysis can be refined by supplementing the data that we have used,
particularly for the econometric analysis that looks at the relationship between
development and patenting activity.
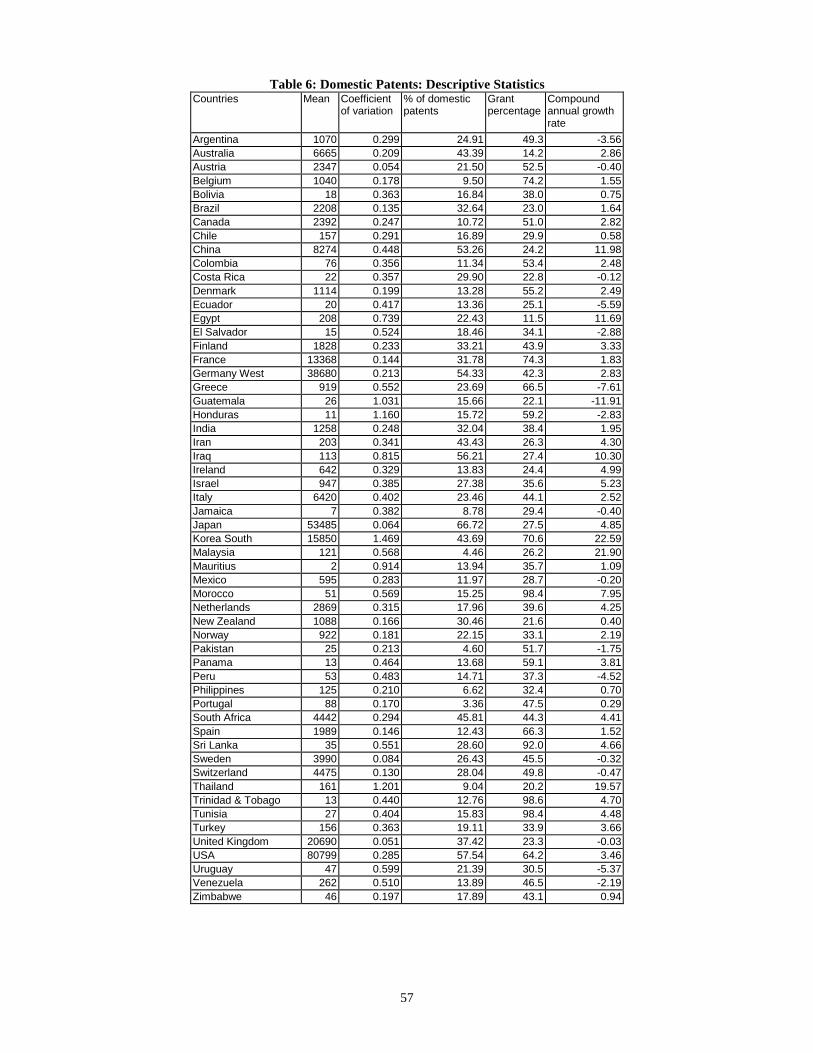
57
Table 6: Domestic Patents: Descriptive StatisticsCountries Mean Coefficient
of variation% of domestic patents
Grant percentage
Compound annual growth rate
Argentina 1070 0.299 24.91 49.3 -3.56Australia 6665 0.209 43.39 14.2 2.86Austria 2347 0.054 21.50 52.5 -0.40Belgium 1040 0.178 9.50 74.2 1.55Bolivia 18 0.363 16.84 38.0 0.75Brazil 2208 0.135 32.64 23.0 1.64Canada 2392 0.247 10.72 51.0 2.82Chile 157 0.291 16.89 29.9 0.58China 8274 0.448 53.26 24.2 11.98Colombia 76 0.356 11.34 53.4 2.48Costa Rica 22 0.357 29.90 22.8 -0.12Denmark 1114 0.199 13.28 55.2 2.49Ecuador 20 0.417 13.36 25.1 -5.59Egypt 208 0.739 22.43 11.5 11.69El Salvador 15 0.524 18.46 34.1 -2.88Finland 1828 0.233 33.21 43.9 3.33France 13368 0.144 31.78 74.3 1.83Germany West 38680 0.213 54.33 42.3 2.83Greece 919 0.552 23.69 66.5 -7.61Guatemala 26 1.031 15.66 22.1 -11.91Honduras 11 1.160 15.72 59.2 -2.83India 1258 0.248 32.04 38.4 1.95Iran 203 0.341 43.43 26.3 4.30Iraq 113 0.815 56.21 27.4 10.30Ireland 642 0.329 13.83 24.4 4.99Israel 947 0.385 27.38 35.6 5.23Italy 6420 0.402 23.46 44.1 2.52Jamaica 7 0.382 8.78 29.4 -0.40Japan 53485 0.064 66.72 27.5 4.85Korea South 15850 1.469 43.69 70.6 22.59Malaysia 121 0.568 4.46 26.2 21.90Mauritius 2 0.914 13.94 35.7 1.09Mexico 595 0.283 11.97 28.7 -0.20Morocco 51 0.569 15.25 98.4 7.95Netherlands 2869 0.315 17.96 39.6 4.25New Zealand 1088 0.166 30.46 21.6 0.40Norway 922 0.181 22.15 33.1 2.19Pakistan 25 0.213 4.60 51.7 -1.75Panama 13 0.464 13.68 59.1 3.81Peru 53 0.483 14.71 37.3 -4.52Philippines 125 0.210 6.62 32.4 0.70Portugal 88 0.170 3.36 47.5 0.29South Africa 4442 0.294 45.81 44.3 4.41Spain 1989 0.146 12.43 66.3 1.52Sri Lanka 35 0.551 28.60 92.0 4.66Sweden 3990 0.084 26.43 45.5 -0.32Switzerland 4475 0.130 28.04 49.8 -0.47Thailand 161 1.201 9.04 20.2 19.57Trinidad & Tobago 13 0.440 12.76 98.6 4.70Tunisia 27 0.404 15.83 98.4 4.48Turkey 156 0.363 19.11 33.9 3.66United Kingdom 20690 0.051 37.42 23.3 -0.03USA 80799 0.285 57.54 64.2 3.46Uruguay 47 0.599 21.39 30.5 -5.37Venezuela 262 0.510 13.89 46.5 -2.19Zimbabwe 46 0.197 17.89 43.1 0.94
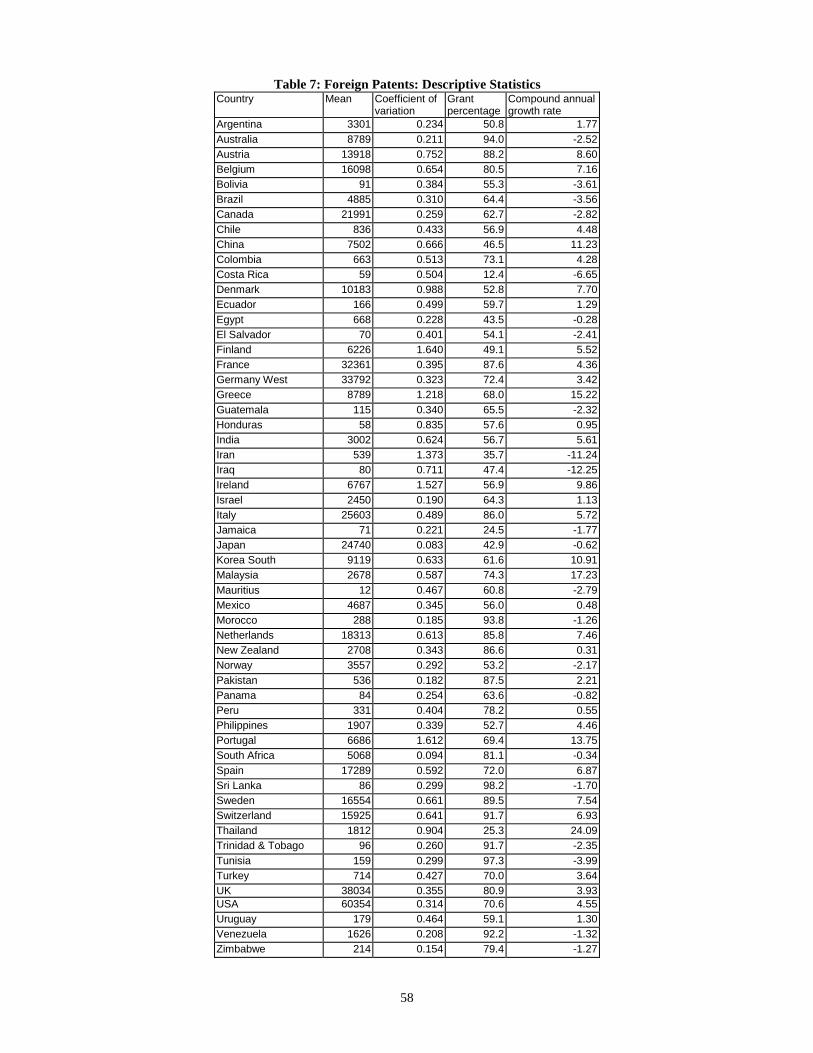
58
Table 7: Foreign Patents: Descriptive StatisticsCountry Mean Coefficient of
variationGrant percentage
Compound annual growth rate
Argentina 3301 0.234 50.8 1.77Australia 8789 0.211 94.0 -2.52Austria 13918 0.752 88.2 8.60Belgium 16098 0.654 80.5 7.16Bolivia 91 0.384 55.3 -3.61Brazil 4885 0.310 64.4 -3.56Canada 21991 0.259 62.7 -2.82Chile 836 0.433 56.9 4.48China 7502 0.666 46.5 11.23Colombia 663 0.513 73.1 4.28Costa Rica 59 0.504 12.4 -6.65Denmark 10183 0.988 52.8 7.70Ecuador 166 0.499 59.7 1.29Egypt 668 0.228 43.5 -0.28El Salvador 70 0.401 54.1 -2.41Finland 6226 1.640 49.1 5.52France 32361 0.395 87.6 4.36Germany West 33792 0.323 72.4 3.42Greece 8789 1.218 68.0 15.22Guatemala 115 0.340 65.5 -2.32Honduras 58 0.835 57.6 0.95India 3002 0.624 56.7 5.61Iran 539 1.373 35.7 -11.24Iraq 80 0.711 47.4 -12.25Ireland 6767 1.527 56.9 9.86Israel 2450 0.190 64.3 1.13Italy 25603 0.489 86.0 5.72Jamaica 71 0.221 24.5 -1.77Japan 24740 0.083 42.9 -0.62Korea South 9119 0.633 61.6 10.91Malaysia 2678 0.587 74.3 17.23Mauritius 12 0.467 60.8 -2.79Mexico 4687 0.345 56.0 0.48Morocco 288 0.185 93.8 -1.26Netherlands 18313 0.613 85.8 7.46New Zealand 2708 0.343 86.6 0.31Norway 3557 0.292 53.2 -2.17Pakistan 536 0.182 87.5 2.21Panama 84 0.254 63.6 -0.82Peru 331 0.404 78.2 0.55Philippines 1907 0.339 52.7 4.46Portugal 6686 1.612 69.4 13.75South Africa 5068 0.094 81.1 -0.34Spain 17289 0.592 72.0 6.87Sri Lanka 86 0.299 98.2 -1.70Sweden 16554 0.661 89.5 7.54Switzerland 15925 0.641 91.7 6.93Thailand 1812 0.904 25.3 24.09Trinidad & Tobago 96 0.260 91.7 -2.35Tunisia 159 0.299 97.3 -3.99Turkey 714 0.427 70.0 3.64UK 38034 0.355 80.9 3.93USA 60354 0.314 70.6 4.55Uruguay 179 0.464 59.1 1.30Venezuela 1626 0.208 92.2 -1.32Zimbabwe 214 0.154 79.4 -1.27
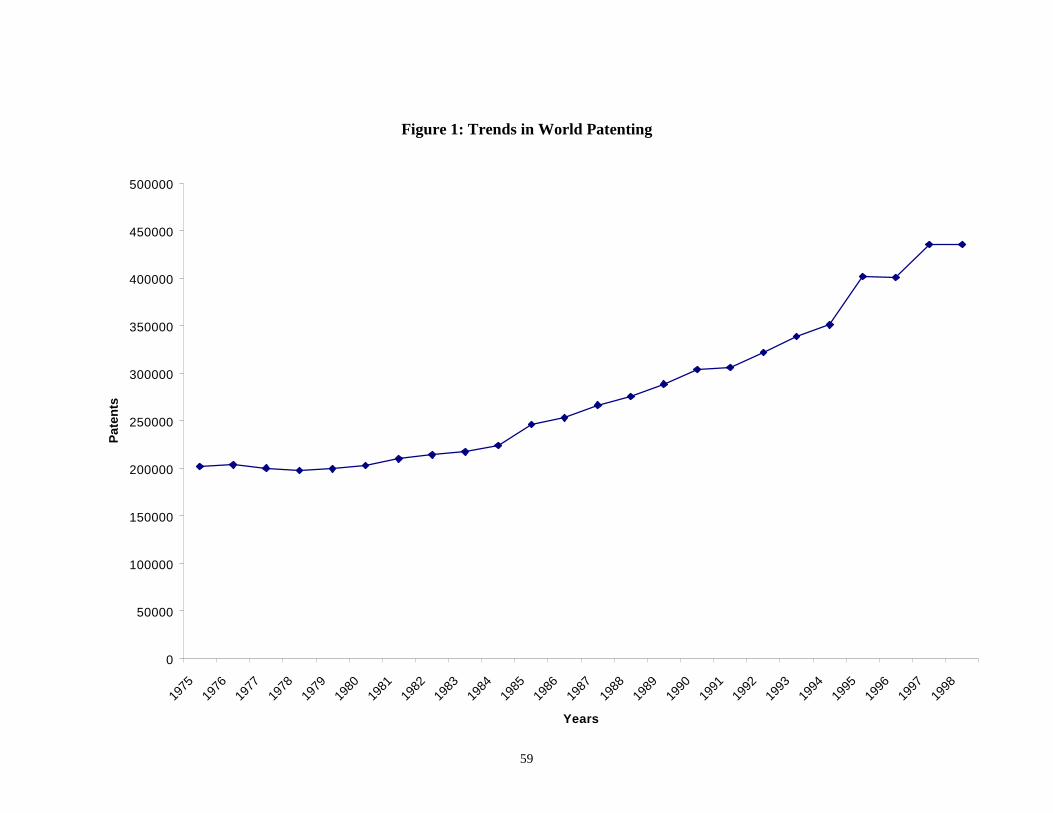
59
Figure 1: Trends in World Patenting
0
50000
100000
150000
200000
250000
300000
350000
400000
450000
500000
1975
1976
1977
1978
1979
1980
1981
1982
1983
1984
1985
1986
1987
1988
1989
1990
1991
1992
1993
1994
1995
1996
1997
1998
Years
Pat
ents
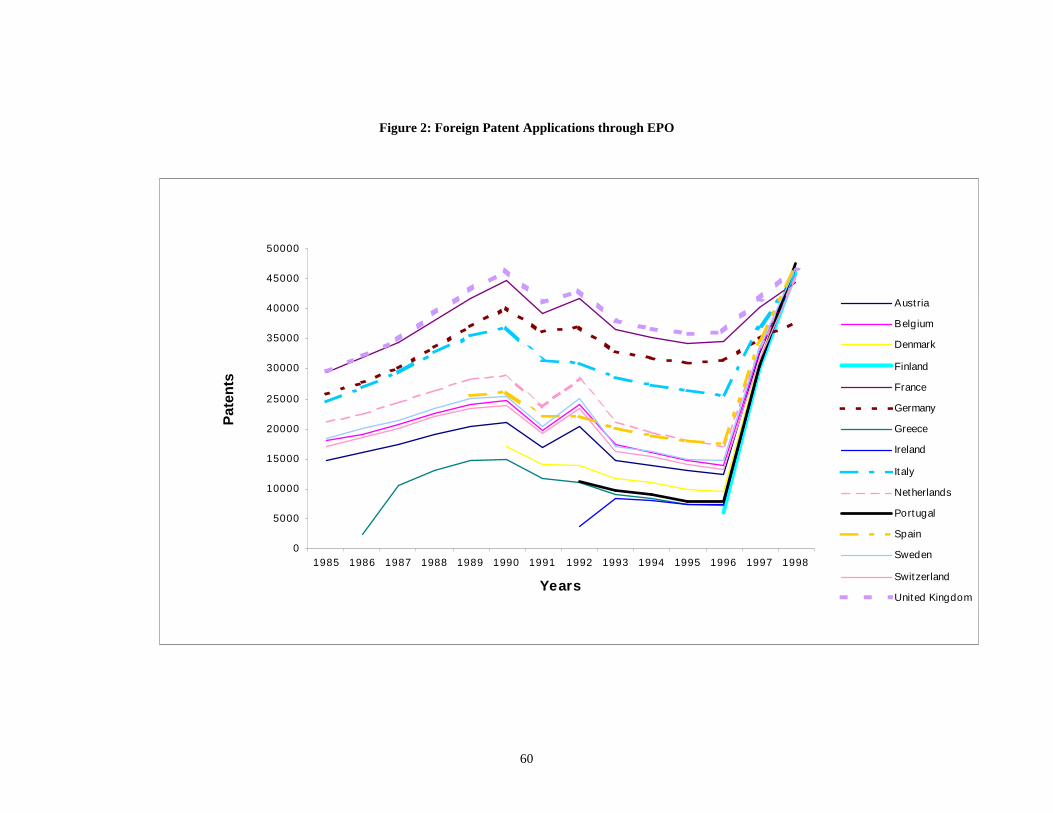
60
Figure 2: Foreign Patent Applications through EPO
0
5000
10000
15000
20000
25000
30000
35000
40000
45000
50000
1985 1986 1987 1988 1989 1990 1991 1992 1993 1994 1995 1996 1997 1998
Years
Pat
ents
Austria
Belgium
Denmark
Finland
France
Germany
Greece
Ireland
Italy
Netherlands
Portugal
Spain
Sweden
Switzerland
United Kingdom
61
Bibliography
Anderfelt U [1971]: International Patent Legislation and Developing Countries, Martinus Nijhoff, The Hague.
Arrow K J [1962]: 'Economic Welfare and the Allocation of Resources for Invention', in R R Nelson (ed), The Rate and Direction of Inventive Activity: Economic and Social Factors, Princeton University Press, Princeton, NJ, (pp.609-625).
Bosworth D L [1980]: 'The Transfer of US Technology Abroad', Research Policy, vol 9, no 4, October, (pp.378-388).
Bosworth D L [1984]: 'Foreign Patenting Flows to and from the United Kingdom', Research Policy, vol 13, no 2, April, (pp.115-124).
Chang H-J [2001]: 'Intellectual Property Rights and Economic Development', Journal of Human Development, vol 2, no 2, July, (pp.287-309).
Crosby M [2000]: 'Patents, Innovation and Growth', Economic Record, vol 76, no 234, September, (pp.255-262).
Eaton J; R Evenson; S Kortum; P Marino and J Putnam [1999]: 'Technological Specialization in International Patenting', in G R Saxonhouse and T N Srinivasan (eds), Development, Duality, and the International Economic Regime: Essays in Honor of Gustav Ranis, University of Michigan Press, Ann Arbor, MI, (pp.301-329).
Eaton J and S Kortum [1996]: 'Trade in Ideas: Patenting and Productivity in the OECD', Journal of International Economics, vol 40, no 3-4, May, (pp.251-278).
Eaton J and S Kortum [1999]: 'International Technology Diffusion: Theory and Measurement', International Economic Review, vol 40, no 3, August (pp.537-570).
Encel S and A Inglis [1966]: 'Patents, Inventions, and Economic Progress', Economic Record, vol 42, no 4, December, (pp.572-588).
Engel R L [1985]: 'Patent Enforcement: The Uncertainties of Patent Litigation', in G S Tolley; J H Hodge and J F Oehmke (eds), The Economics of R&D Policy, Praeger, New York, NY, (pp.95-101).
Evenson R E [1984]: 'International Invention: Implications for Technology Market Analysis', in Z Griliches (ed), R&D, Patents and Productivity, University of Chicago Press, Chicago, IL, (pp.89-126).
Evenson R E [1988]: 'Technology, Productivity Growth, and Economic Development', in G Ranis and T P Schultz (eds), The State of Development Economics: Progress and Prospects, Basil Blackwell, Oxford, (pp.486-527).
Evenson R E [1990]: 'Intellectual Property Rights, R&D, Inventions, Technology Purchase, and Piracy in Economic Development: An International Comparative Study', in R E Evenson and G Ranis (eds), Science and Technology: Lessons for Development Policy, Westview Press, Boulder, CO, (pp.325-355).
62
Fagerberg J [1988]: 'Why Growth Rates Differ?', in G Dosi; C Freeman; R Nelson; G Silverberg and L Soete (eds), Technical Change and Economic Theory, Pinter Publisher, London, (pp.431-457).
Ginarte J C and W G Park [1997]: 'Determinants of Patent Rights: A Cross-national Study', Research Policy, vol 26, no 3, March, (pp.283-301).
Gould D M and W C Gruben [1996]: 'The Role of Intellectual Property Rights in Economic Growth', Journal of Development Economics, vol 48, no 2, April, (pp.323-350).
Greer D F [1973]: 'The Case Against Patent Systems in Less-developed Countries', Journal of International Law and Economics, vol 8, no 2, December, (pp.223-266).
Greif S [1987]: 'Patents and Economic Growth', International Review of Industrial Property and Copyright Law, vol 18, no 2, (pp.191-213).
Griliches Z [1989]: 'Patents: Recent Trends and Puzzles', Brookings Papers on Economic Activity: Micro Economics, no 3, (pp.291-319).
Griliches Z [1990]: 'Patents Statistics as Economic Indicators: A Survey', Journal of Economic Literature, vol 28, no 4, December, (pp.1661-1707).
Grupp H and U Schmoch [1999]: 'Patent Statistics in the Age of Globalisation: New Legal Procedures, New Analytical Methods, New Economic Interpretation', Research Policy, vol 28, no 4, April, (pp.377-396).
Kanwar S and R E Evenson [2001]: Does Intellectual Property Protection Spur Technological Change?, Economic Growth Centre Discussion Paper No. 831, Yale University, New Haven, CT.
Kotabe M [1992]: 'The Impact of Foreign Patents on National Economy: A Case of the United States, Japan, Germany and Britain', Applied Economics, vol 24, no 12, December, (pp.1335-1343).
La Croix S J and A Kawaura [1996]: 'Product Patent Reform and its Impact on Korea's Pharmaceutical Industry', International Economic Journal, vol 10, no 1, Spring, (pp.109-124).
McCalman P [1999]: 'Reaping What You Sow: An Empirical Analysis of International Patent Harmonisation', Journal of International Economics, vol 55, no 1, October, (pp.161-186).
Mansfield E [1986]: 'Patents and Innovation: An Empirical Study', Management Science, vol 32, no 2, February, (pp.173-181).
Mansfield E [1989]: 'Intellectual Property Rights, Technological Change and Economic Growth', in C E Walker and M A Bloomfield (eds), Intellectual Property Rights and Capital Formation in the Next Decade, University Press of America, Lanham, MD, (pp.3-26).
Maskus K [2000]: Intellectual Property Rights in the Global Economy, Institute of International Economics, Washington DC.
63
Montgomery R E [1923]: 'The International Aspects of Patent Legislation', Journal of Political Economy, vol 31, no 1, February, (pp.90-113).
Okada Y [1992]: Tokkoyoseido no ho to Keizaigaku (The Law and Economics of the Patent System), Staff Paper, Shinshu University.
Organization of Economic Cooperation and Development (OECD) [1994]: The Measurement of Scientific and Technological Activities: Using Patent Data as Science and Technology Indicators [Patent Manual], OECD, Paris, [OECD/GD(94)114].
Organization of Economic Cooperation and Development (OECD) [1997]: Patents and Innovation in the International Context, OECD, Paris, [OECD/GD(97)210].
Pakes A [1986]: 'Patents as Options: Some Estimates of the Value of Holding European Patent Stocks', Econometrica, vol 54, no 4, July, (pp.755-784).
Pakes A and M Simpson [1989]: 'Patent Renewal Data', Brookings Papers on Economic Activity: Micro Economics, no 3, (pp.331-401).
Park W G and J C Ginarte [1997]: 'Intellectual Property Rights and Economic Growth', Contemporary Economic Policy, vol 15, no 3, July, (pp.51-61).
Pretnar S [1953]: 'The International Protection of Industrial Property and the Different Stages of Economic Development of the States', Industrial Property, vol 69, no 12, December, (pp.213-223), (translation supplied by WIPO of French original).
Rao C N [1989a]: 'Recent Developments in International Patent System', Economic and Political Weekly, vol 24, nos 51-52, December 23-30, (pp.2841-2848).
Rao C N [1989b]: 'Trade Related Aspects of Intellectual Property Rights: Question of Patents', Economic and Political Weekly, vol 24, no 19, May 13, (pp.1053-1059).
Rao C N [2002]: Patents and Technological Progress in Developing countries: A Case Study of India, Ph.D. Thesis, Jawaharlal Nehru University (forthcoming).
Schankerman M and A Pakes [1986]: 'Estimates of the Value of Patent Rights in European Countries During the post-1950 Period', Economic Journal, vol 96, no 384, December, (pp.1052-1076).
Scherer F M [1977]: The Economic Effects of Compulsory Patent Licensing, Monograph Series in Finance and Economics No.1977-2, New York University, New York, NY.
Schiffel D and C Kitti [1978]: 'Rates of Invention: International Patent Comparisons', Research Policy, vol 7, no 4, October, (pp.324-340).
Slama J [1983]: 'Gravity Model and its Estimations for International Flows of Engineering Products, Chemicals and Patent Applications', Acta Oeconomica, vol 30, no 2, (pp.241-253).
Soete L L G [1981]: 'A General Test of Technological Gap Trade Theory', Review of World Economics, vol 117, no 4, (pp.639-660).
Taylor C T and Z A Silberston [1973]: The Economic Impact of the Patent System: A Study of the British Experience, Cambridge University Press, Cambridge.
64
Thompson M A and F W Rushing [1996]: 'An Empirical Analysis of the Impact of Patent Protection on Economic Growth', Journal of Economic Development, vol 21, no 2, December, (pp.61-79).
Thompson M A and F W Rushing [1999]: 'An Empirical Analysis of the Impact of Patent Protection on Economic Growth: An Extension', Journal of Economic Development, vol 24, no 1, June, (pp.67-76).
United Nations (UN) [1964]: The Role of Patents in the Transfer of Technology to Developing Countries, UN, New York, NY, (E/3861/Rev.1).
United Nations Conference on Trade and Development (UNCTAD) [1975]: The Role of the Patent System in the Transfer of Technology to Developing Countries, UN, New York, NY, (TD/B/AC.11/19).
United Nations Conference on Trade and Development (UNCTAD) [1995]: The Least Developed Countries: Report, UNCTAD, Geneva, (TD/B/41(2)/4).
Vayrynen R [1976]: International Patent System, Transnational Corporations and Technological Dominance, Research Report No. 11, Tampere Peace Research Institute, Tampere.
Vayrynen R [1977]: The International Patent System and the Transfer of Technology to Africa, Occasional Paper No 9, Tampere Peace Research Institute, Tampere.
Vayrynen R [1978]: 'International Patenting as a Means of Technological Dominance', International Social Science Journal, vol 30, no 2, (pp.315-337).
Vernon R [1957]: The International Patent System and Foreign Policy, United States Senate Sub-committee on Patents, Trademarks and Copyrights Study No 5, United States Government Printing Office, Washington DC.
Watanabe S [1985]: 'The Patent System and Indigenous Technology Development in the Third World', in J James and S Watanabe (eds), Technology, Institutions, and Government Policies, Macmillan, London, (pp.217-257).
Wineberg A [1988]: 'The Japanese Patent System: A Non-Tariff Barrier to Foreign Businesses', Journal of World Trade Law, vol 22, no 1, February (pp.11-22).
World Bank [1993]: World Development Report, Oxford University Press, Oxford.
World Intellectual Property Organization (WIPO) [1977-2000]: Industrial Property Statistics: Patents, WIPO, Geneva, (Annual).
World Intellectual Property Organization (WIPO) [1978]: Situation of Industrial Property in the Arab States, World Intellectual Property Organization, Geneva (872 E).
World Intellectual Property Organization (WIPO) [1983]: 100 Years of Protection of Intellectual Property Rights: Synoptic Tables on Patents, Designs, Utility Models and Plant Varieties, 1883-1982, WIPO, Geneva, (876 E).
World Intellectual Property Organization (WIPO) [1984]: The Situation of Industrial Property in the Countries of Asia and the Pacific, WIPO, Geneva, (874 E).
65
World Intellectual Property Organization (WIPO) [1988]: Existence, Scope and Form of Generally Internationally Accepted and Applied Standards/Norms for the Protection of Intellectual Property, Multilateral Trade Negotiations: The Uruguay Round, GATT, Geneva, (MTN/GNG/NG11/W/24).
World Trade Organization (WTO) [2001]: WIPO and WTO Launch New Initiative to Help World's Poorest Countries, WTO, Geneva, (Press/231).