Embed Size (px)
Citation preview
Copyright q 2001, RAND 101
RAND Journal of EconomicsVol. 32, No. 1, Spring 2001pp. 101–128
The patent paradox revisited: an empiricalstudy of patenting in the U.S. semiconductorindustry, 1979–1995
Bronwyn H. Hall*
and
Rosemarie Ham Ziedonis**
We examine the patenting behavior of firms in an industry characterized by rapidtechnological change and cumulative innovation. Recent survey evidence suggests thatsemiconductor firms do not rely heavily on patents to appropriate returns to R&D. Yetthe propensity of semiconductor firms to patent has risen dramatically since the mid-1980s. We explore this apparent paradox by conducting interviews with industry rep-resentatives and analyzing the patenting behavior of 95 U.S. semiconductor firmsduring 1979–1995. The results suggest that the 1980s strengthening of U.S. patentrights spawned ‘‘patent portfolio races’’ among capital-intensive firms, but it also fa-cilitated entry by specialized design firms.
1. Introduction
n In the early 1980s, important changes in the U.S. legal environment ushered in anera characterized by strong patent rights. Most notable among these changes was the1982 formation of a centralized appellate court, the Court of Appeals for the FederalCircuit (CAFC). Although the CAFC is widely credited with unifying and strengthening
* University of California, Berkeley; Nuffield College, Oxford University; National Bureau of Eco-nomic Research; Institute for Fiscal Studies, London; [email protected].
** University of Pennsylvania; [email protected] earlier version of this article was prepared for the January 1999 NBER Conference on ‘‘The Patent
System and Innovation,’’ sponsored by the Alfred P. Sloan Foundation. The Alfred P. Sloan Foundation’sCompetitive Semiconductor Manufacturing Grant to UC Berkeley, the U.S. Air Force Office of ScientificResearch, and the Reginald H. Jones Center for Management Policy, Strategy, and Organization providedadditional support for this study through research grants to Ziedonis. We are especially grateful to themanagers and intellectual property attorneys who participated in our study and generously shared their timeand insights with us. We also thank Jerry Karls of Integrated Circuit Engineering, Inc. for sharing industrydata and Jeff Macher of UC Berkeley’s Haas School of Business for facilitating and participating in severalof our interviews. Finally, we gratefully acknowledge the helpful comments and suggestions we receivedfrom two anonymous reviewers. Melissa Appleyard, Clair Brown, Wes Cohen, David Hodges, Adam Jaffe,Jenny Lanjouw, Josh Lerner, Kristina Lybecker, Rob Merges, David Mowery, Robert Porter (Editor), CecilQuillen, Jim Rose, Frank Weiss, Dennis Yao, Arvids Ziedonis, seminar participants at Wharton and UCBerkeley, and participants in the 1999 NBER ‘‘Patent System and Innovation’’ Conference and February2000 STEP Board Conference on Intellectual Property Rights.
102 / THE RAND JOURNAL OF ECONOMICS
q RAND 2001.
the judicial treatment of patent rights in the United States, the effects of the ‘‘pro-patent’’ court on the innovative activities of firms remain unclear. For example, surveyevidence suggests that firms in most industries have not increased their reliance onpatents for appropriating the returns to R&D over the decade of the 1980s (Cohen,Nelson, and Walsh, 2000). Yet this period coincides with an unprecedented surge inpatenting in the United States unaccounted for by increases in R&D spending alone(Kortum and Lerner, 1998). If firms in most industries do not rely heavily on patentsto profit from innovation, then why are they patenting so aggressively?
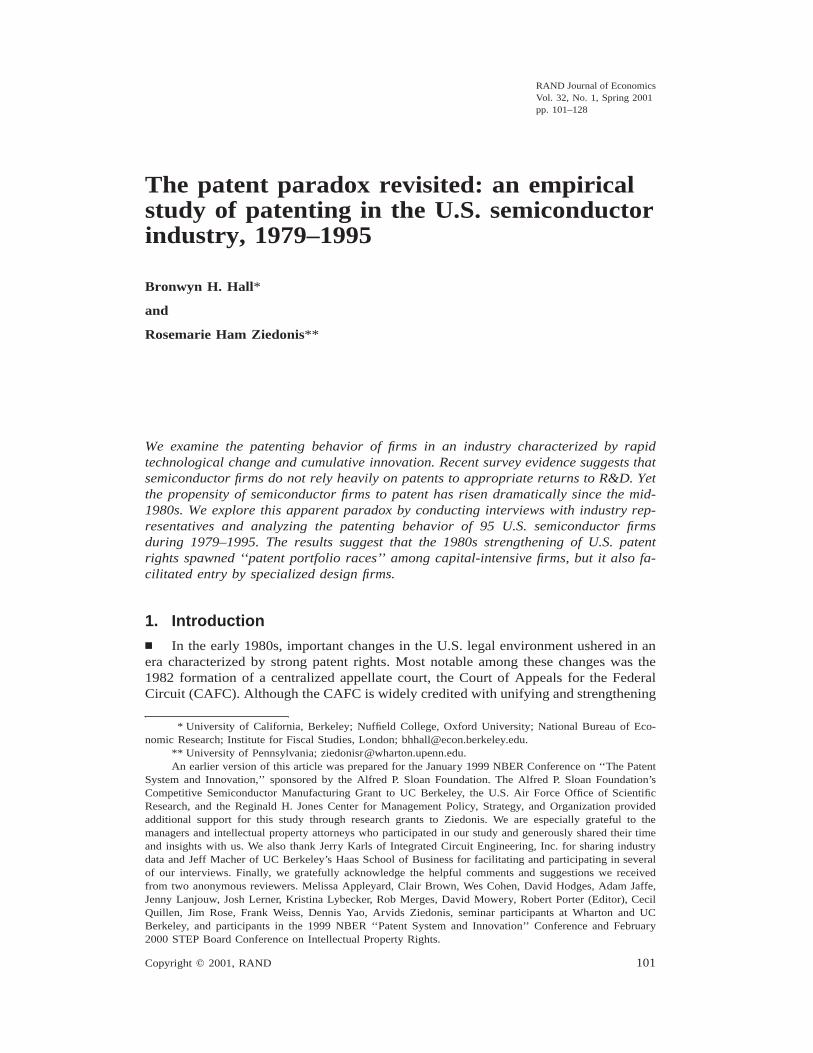
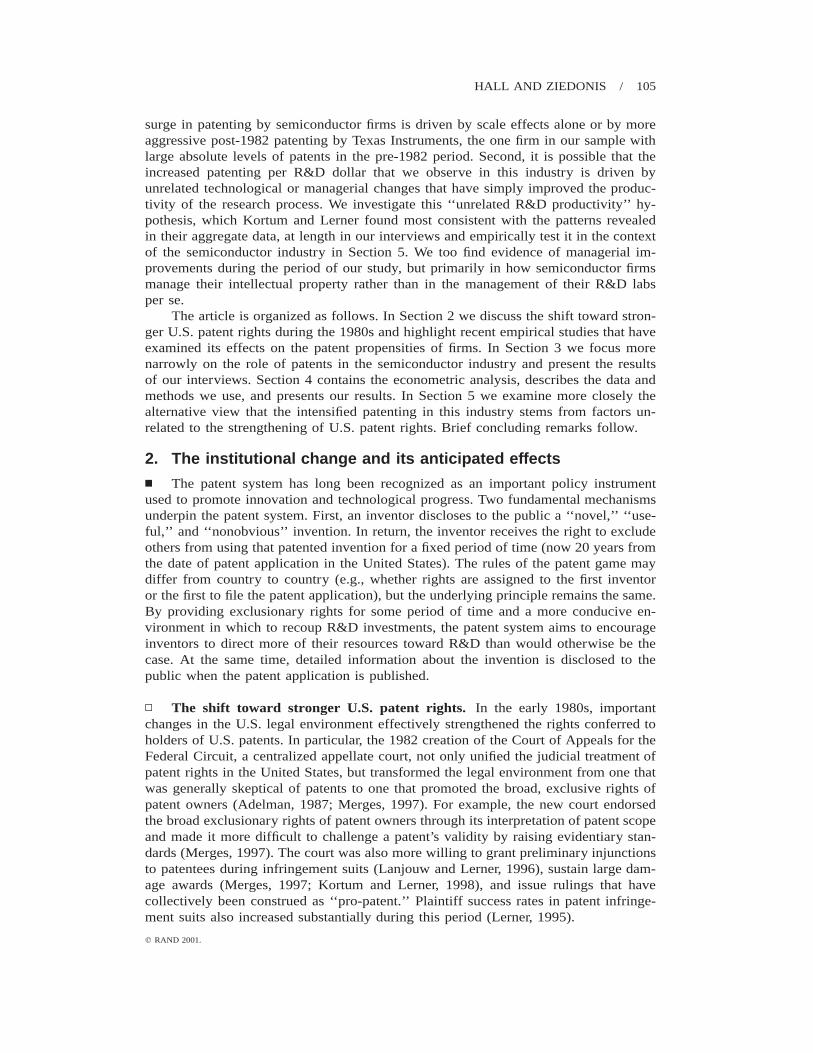
This article revisits this ‘‘patent paradox’’ in the semiconductor industry, wherethe gap between the relative ineffectiveness of patents (as reported in surveys) andtheir widespread use is particularly striking. In two surveys on appropriability con-ducted in 1983 and 1994 (the ‘‘Yale’’ and ‘‘Carnegie Mellon’’ surveys, respectively),R&D managers in semiconductors consistently reported that patents were among theleast effective mechanisms for appropriating returns to R&D investments (Levin et al.,1987; Cohen, Nelson, and Walsh, 2000). Driven by a rapid pace of technological changeand short product life cycles, semiconductor firms tend to rely more heavily on leadtime, secrecy, and manufacturing or design capabilities than patents to recoup invest-ments in R&D. Nonetheless, the number of semiconductor-related patents issued in theUnited States has risen sharply since the early 1980s, exceeding the overall increaseexamined by Kortum and Lerner (1998).1 Even more important, the propensity ofsemiconductor firms to patent has also risen during this period. As shown in Figure 1,we find that patenting per million real R&D dollars in the semiconductor industrydoubled between 1982 and 1992, from about .3 to .6.2 During the same period, thepatent yield for manufacturing as a whole was fairly stagnant and that for pharmaceu-ticals declined.3
The semiconductor industry also provides an excellent setting within which toexamine the effects of stronger patent rights on firms engaged in rapidly advancing,‘‘cumulative’’ technologies. Much like multimedia or computer firms, semiconductorfirms often require access to a ‘‘thicket’’ of intellectual property rights in order toadvance the technology or to legally produce or sell their products. Given the rapidpace of technological change in this industry, however, any new product or process islikely to overlap with technologies previously or simultaneously developed by externalparties (Grindley and Teece, 1997). Despite significant advancements in the theoreticalliterature on the importance of strong patent rights for inducing investments in R&Dwhen innovation is cumulative (e.g., Scotchmer, 1996; O’Donoghue, Scotchmer, andThisse, 1998), there remains little systematic evidence on how a shift toward strongerpatent rights affects the innovative activities of firms in the context of rapidly changing,cumulative technologies.4 Our article casts new empirical light on this issue by ex-amining the patenting behavior of semiconductor firms during a period that spans thepro-patent shift in the U.S. legal environment.
1 The number of U.S. patents issued in a narrowly defined set of semiconductor patent classes morethan doubled between 1981 and 1984, while the number of U.S. patents issued in all patent classes rose byonly 50% during this period (USPTO, 1995).
2 We define successful patent applications as applications that eventually result in an issued U.S. patent.To avoid noise introduced by outliers with small R&D programs, Figure 1 plots total patents per total R&Dspending in the sector, rather than the average of the patent-R&D ratios for each firm.
3 The patent yield for semiconductors is based on the universe of 110 publicly traded firms in SIC 3674(see Section 4). Trends are reported through 1993 to avoid an artificial truncation due to the lag betweenapplication and issuance dates.
4 The most extensive treatment of these issues (Merges and Nelson, 1990) relies on historical recordsto trace the effects of conferring broad patent rights to inventors engaged in so-called cumulative systemstechnologies, including electronics, aircraft, or automobiles. See Mazzoleni and Nelson (1998) for a thought-ful discussion of the findings.
HALL AND ZIEDONIS / 103
q RAND 2001.
FIGURE 1
PROPENSITY TO PATENT: U.S. MANUFACTURING INDUSTRIES
To illuminate the factors underpinning the surge in patenting in this industry andthe effects, if any, of stronger U.S. patent rights on the innovative activities of semi-conductor firms, we employ a combination of qualitative and quantitative researchmethods. First, we conducted interviews with intellectual property managers and ex-ecutives from several U.S. semiconductor firms—including manufacturers and special-ized design firms. Earlier studies have explored the motives for patenting in thisindustry (e.g., Tilton, 1971; Taylor and Silberston, 1973; Levin, 1982; von Hippel,1988). We sought additional insights on whether the increased patenting per R&D dollarwe find in this industry appears to be related to the strengthening of U.S. patent rightsin the 1980s or whether it seems to be driven by unrelated technological or managerialfactors (an important alternative hypothesis). These interviews also enable us to inves-tigate the use of patents by semiconductor design firms, which specialize in chip designand contract out the manufacture of their products to other firms. Many of these firmsentered the industry during the period associated with strong patent rights, but theimportance of patents to these firms was unclear.
Our quantitative analysis is based on a larger sample of approximately 100 publiclytraded U.S. firms whose principal line of business is semiconductors and related devices(SIC3674) and whose R&D expenditures are therefore primarily directed toward semi-conductor-related areas. After compiling a detailed database of these firms’ patent port-folios from 1975 to 1998, we match these data with financial variables from Compustat(e.g., R&D and sales) that are known determinants of patenting in general and thatcapture additional variables identified in our interviews. This methodology enables usto advance upon existing studies by constructing reliable estimates of the patent pro-pensities of individual firms during this twenty-year period while keeping the broadtechnological area constant across firms.5 Thus, we are able to determine whether theupsurge in patenting simply represents changes in the mix of firms in the industry overtime (i.e., the effects of entry and exit), changes in the economic behavior of firms, or
5 In contrast, Kortum and Lerner (1998) use aggregate R&D and patent data. Using a different approach,Cohen, Nelson, and Walsh (2000) construct a useful firm-level estimate of ‘‘patent propensity’’ using 1994survey data, but are unable to track changes in this important variable over time.
104 / THE RAND JOURNAL OF ECONOMICS
q RAND 2001.
both. An unfortunate weakness of this approach is the exclusion from our analysis oflarge U.S. ‘‘systems’’ manufacturers (e.g., IBM, AT&T, or Motorola) and non-U.S.firms (e.g., Toshiba, Samsung, or Siemens) that are important patent owners and usersof semiconductor technologies. Because corporate R&D spending is reported for theentire portfolio of a firm’s R&D activities, it is not possible to isolate the share of R&Dexpenditures directed toward semiconductor technologies for these diversified firms.
Our central hypothesis is that the surge in patenting by semiconductor firms iscausally related to the pro-patent shift in the U.S. legal environment in the 1980s. Wedistinguish, however, between two potentially divergent effects on firms within thissector. First, we examine whether firms most vulnerable to ‘‘holdup’’ in the new patentregime (i.e., firms with large sunk costs in complex manufacturing facilities) respondstrategically to the institutional shift by expanding their own portfolios of patents withwhich to trade. We label this our ‘‘strategic response’’ hypothesis, which we test byexamining the patenting behavior of large-scale manufacturers and whether it haschanged in the period of strong U.S. patent rights. We then examine whether thestrengthening of U.S. patent rights facilitated vertical specialization within the industryand led to the emergence of ‘‘technology specialists’’ (Merges, 1998; Arora, 1995).We test this ‘‘specialization’’ hypothesis by assessing whether the surge in patent pro-pensities in this industry under the new patent regime is explained by the emergenceof more patent-intensive design firms.
Several important findings emerge from our research. First, estimating firm-levelpatenting behavior during 1979–1995 reveals that the upsurge in patenting by U.S.semiconductor firms is indeed quite remarkable. Controlling for the changes in the mixof firms leaves the upward trend shown in Figure 1 essentially unchanged. Second, ourqualitative and quantitative evidence suggests that the pro-patent shift contributed tointensified patenting in this industry, but in ways not examined systematically in pre-vious studies. On the one hand, we find that large-scale manufacturers have investedfar more aggressively in patents during the period associated with strong U.S. patentrights, even controlling for other known determinants of patenting (consistent with ourstrategic response hypothesis). Instead of being driven by a desire to win strong legalrights to a standalone technological prize, these firms appear to be engaged in ‘‘patentportfolio races’’ aimed at reducing concerns about being held up by external patentowners and at negotiating access to external technologies on more favorable terms. Onthe other hand, we find that firms entering the industry since 1982 patent more inten-sively than pre-1982 entrants. This is especially true of specialized design firms foundedafter 1982; in fact, we see a considerable increase in entry by this type of firm (con-sistent with our specialization hypothesis). Our interviews suggest that stronger patentrights are especially critical to these firms in attracting venture capital funds and se-curing proprietary rights in niche product markets.
Although these results highlight the multifaceted role that patents can play amongfirms even within the same broad technological area, we find that the primary reasonfor intensified patenting among our sample of semiconductor firms is more aggressivepatenting by capital-intensive firms (strategic response). The results of our econometricanalysis corroborate views commonly expressed by industry representatives that the1980s pro-patent shift in the U.S. legal environment altered these firms’ incentives topatent. Nonetheless, we contrast these findings with those implied by two competingviews. First, the surge in U.S. patenting could be attributed to more aggressive patentingby firms with large patent portfolios in the period preceding the CAFC’s formation, asposed by Kortum and Lerner’s (1998) ‘‘regulatory capture’’ hypothesis in the contextof their cross-industry study. We too find little evidence that the even more dramatic
HALL AND ZIEDONIS / 105
q RAND 2001.
surge in patenting by semiconductor firms is driven by scale effects alone or by moreaggressive post-1982 patenting by Texas Instruments, the one firm in our sample withlarge absolute levels of patents in the pre-1982 period. Second, it is possible that theincreased patenting per R&D dollar that we observe in this industry is driven byunrelated technological or managerial changes that have simply improved the produc-tivity of the research process. We investigate this ‘‘unrelated R&D productivity’’ hy-pothesis, which Kortum and Lerner found most consistent with the patterns revealedin their aggregate data, at length in our interviews and empirically test it in the contextof the semiconductor industry in Section 5. We too find evidence of managerial im-provements during the period of our study, but primarily in how semiconductor firmsmanage their intellectual property rather than in the management of their R&D labsper se.
The article is organized as follows. In Section 2 we discuss the shift toward stron-ger U.S. patent rights during the 1980s and highlight recent empirical studies that haveexamined its effects on the patent propensities of firms. In Section 3 we focus morenarrowly on the role of patents in the semiconductor industry and present the resultsof our interviews. Section 4 contains the econometric analysis, describes the data andmethods we use, and presents our results. In Section 5 we examine more closely thealternative view that the intensified patenting in this industry stems from factors un-related to the strengthening of U.S. patent rights. Brief concluding remarks follow.
2. The institutional change and its anticipated effects
n The patent system has long been recognized as an important policy instrumentused to promote innovation and technological progress. Two fundamental mechanismsunderpin the patent system. First, an inventor discloses to the public a ‘‘novel,’’ ‘‘use-ful,’’ and ‘‘nonobvious’’ invention. In return, the inventor receives the right to excludeothers from using that patented invention for a fixed period of time (now 20 years fromthe date of patent application in the United States). The rules of the patent game maydiffer from country to country (e.g., whether rights are assigned to the first inventoror the first to file the patent application), but the underlying principle remains the same.By providing exclusionary rights for some period of time and a more conducive en-vironment in which to recoup R&D investments, the patent system aims to encourageinventors to direct more of their resources toward R&D than would otherwise be thecase. At the same time, detailed information about the invention is disclosed to thepublic when the patent application is published.
▫ The shift toward stronger U.S. patent rights. In the early 1980s, importantchanges in the U.S. legal environment effectively strengthened the rights conferred toholders of U.S. patents. In particular, the 1982 creation of the Court of Appeals for theFederal Circuit, a centralized appellate court, not only unified the judicial treatment ofpatent rights in the United States, but transformed the legal environment from one thatwas generally skeptical of patents to one that promoted the broad, exclusive rights ofpatent owners (Adelman, 1987; Merges, 1997). For example, the new court endorsedthe broad exclusionary rights of patent owners through its interpretation of patent scopeand made it more difficult to challenge a patent’s validity by raising evidentiary stan-dards (Merges, 1997). The court was also more willing to grant preliminary injunctionsto patentees during infringement suits (Lanjouw and Lerner, 1996), sustain large dam-age awards (Merges, 1997; Kortum and Lerner, 1998), and issue rulings that havecollectively been construed as ‘‘pro-patent.’’ Plaintiff success rates in patent infringe-ment suits also increased substantially during this period (Lerner, 1995).
106 / THE RAND JOURNAL OF ECONOMICS
q RAND 2001.
Although the importance of the CAFC in strengthening U.S. patent rights has beenwidely noted, the actual effects of the pro-patent shift on the innovative activities offirms remain unclear (see Jaffe, 2000). To the extent that stronger patent rights enablefirms to recoup more of their R&D dollars, stronger patent rights should increase in-centives to invest in R&D.6 But there is no a priori reason to expect that these increasedR&D dollars should yield proportionally more patents. Unless other changes in thecontent or management of R&D occurs (such as a shift toward more ‘‘applied,’’ pat-entable activities or improvements in research methods that speed or ease the inventiveprocess), stronger patent rights should not necessarily generate an increase in the num-bers of patents generated per R&D dollar.7
In light of the above discussion, it is interesting to note that previous empiricalstudies have failed to find evidence that the strengthening of U.S. patent rights duringthe 1980s stimulated industrial spending in R&D. Kortum and Lerner (1998) demon-strate that the upswing in U.S. industrial R&D spending predates 1982. Moreover, theyfind that the intensity of research effort leveled off in the late 1980s and early 1990s,whereas patenting rates continued to climb. In another study, Bessen and Maskin (2000)show that real R&D intensity in information technology related industries (includingsemiconductors, telecommunications, and computers) has fallen steadily since around1982, providing little evidence that the strengthening of patent rights stimulated R&Dspending by firms in these industries. Similar evidence exists for the firms in oursample: incumbent firms (those who entered the industry before 1983) show a slightdecline in their R&D intensity, whereas entrants (half of whom are design firms, whichspecialize in R&D) show some increasing R&D intensities at first and then a decline.Thus, the surprising first-order effect of the pro-patent shift in many industries seemsto be an increase in patenting rather than an increase in R&D spending per se. Due tothe omission of other factors that may have influenced firm-level R&D spending duringthis period, however, one should be cautious about drawing strong conclusions fromthese aggregate time series data alone.
▫ Exploring the link between the ‘‘pro-patent’’ shift and intensified U.S. pat-enting. The study by Kortum and Lerner (1998) previously cited examines these some-what puzzling empirical trends in more detail to determine whether, in fact, the 1980sstrengthening of U.S. patent rights led to the explosion in U.S. patenting or whetherthe two are simultaneous but unrelated events. Their central hypothesis, like ours, isthat the surge in patenting is related to this strengthening of U.S. patent rights associatedwith the 1982 formation of the CAFC (their ‘‘friendly court’’ hypothesis). The authorstest this hypothesis by examining evidence on worldwide patenting: if U.S. patentsbecome more valuable because of the pro-patent shift, then the United States shouldbecome a more important ‘‘destination’’ country for international patent filers followingthe CAFC’s formation. They find little support for this hypothesis in the aggregate dataand reject the view that the overall surge in U.S. patenting is linked to the strengtheningof U.S. patent rights in the early 1980s. Kortum and Lerner also find little evidencefor a variant of their friendly court hypothesis, which suggests that incumbents withlarge patent portfolios in the pre-CAFC period account for the subsequent increase in
6 A traditional issue in the patent-design literature is whether strong patents lead to socially wasteful‘‘patent races’’ and overinvestment in R&D. More recent studies suggest that the R&D incentives providedby strong patents are especially important when innovation is cumulative (e.g., Scotchmer, 1991, 1996; Greenand Scotchmer, 1995; O’Donoghue, 1998).
7 Appendix B of an earlier, expanded version of this article includes a simple model that shows this result.The article is available at the following Web site: http://jonescenter.wharton.upenn.edu/papers/2000.htm.
HALL AND ZIEDONIS / 107
q RAND 2001.
patenting (their ‘‘regulatory capture’’ hypothesis). Through a process of elimination,Kortum and Lerner conclude that the surge in U.S. patenting over the past two decadesappears to stem from a broad increase in R&D productivity. In this view, the historicallyunprecedented rise in U.S. patenting rates since the 1980s is in fact unrelated to thesimultaneous changes in the U.S. legal environment. Instead, it appears to be drivenby more general improvements in the management or automation of the innovationprocess.
Kortum and Lerner (1998) highlight an important phenomenon, but their use ofaggregate rather than firm-level data may have led them to dismiss too quickly thepotential effects of the pro-patent shift, at least in the context of the semiconductorindustry, where the surge in patenting (relative to firm-level R&D spending) is mostdramatic. In semiconductors, we would modify the analysis of Kortum and Lerner inseveral ways. First, it was clear from talking with industry representatives that regu-latory capture (implying a more aggressive use of intellectual property rights by largefirms with deep pockets) could induce other firms to patent more aggressively in orderto improve their negotiating position with these large owners of intellectual property.If this is true, regulatory capture does not necessarily imply that large patent ownerswill have a greater relative incentive to patent than firms most subject to ‘‘holdup’’(either by large patent owners or a more diverse set of entities) in the era of strongpatent rights. We examine this strategic response hypothesis below.
Second, we interpret changes in the ‘‘management of R&D’’ more broadly. Evenwith few changes in the strategy and goals of their R&D programs, it was clear fromour conversations that many manufacturers had decided to ‘‘harvest’’ more patents fromtheir R&D, both as a defensive strategy (e.g., ‘‘to ensure the freedom to design andmanufacture’’) and to assist them in winning favorable terms in cross-licensing nego-tiations with other firms in the industry. The results of the 1994 Carnegie MellonSurvey of Industrial R&D in the United States (Cohen, Nelson, and Walsh, 2000)highlight the importance of these broader motives for patenting among firms engagedin cumulative, ‘‘complex’’ technologies, including but not limited to semiconductors.8
This finding has important implications, not only on the broader use of patents by firmsin many high-technology industries, but on unravelling the potential effects of strength-ening patents rights in areas where the value of a single patent is inherently tied to thatof other patented and unpatented technologies. We explore the implications of theseissues at length in our interviews and empirically in Section 5.
Finally, the pro-patent policies put in place by the CAFC may have facilitatedentry by firms specializing in R&D-intensive inputs even within existing industries(Merges, 1998; Arora and Fosfuri, 1998). Indeed, the period associated with strongU.S. patent rights has witnessed significant entry into the semiconductor industry bydesign, or ‘‘fabless,’’ firms that specialize in innovative products but contract out themanufacture of their products to owners of wafer fabrication facilities. Division of laborin this industry was aided by the widespread adoption in the 1980s of the metal-oxidesilicon (MOS) manufacturing process, which provided a more standardized interfacebetween chip design and the wafer fabrication process (Macher, Mowery, and Hodges,1998). To the extent that product innovations are generally better suited to protectionwith patents (Levin et al., 1987), however, we might expect specialized design firmsto exhibit a relatively high propensity to patent based on their R&D spending. More-over, as ‘‘technology specialists,’’ these firms may rely more heavily on patents to
8 Other ‘‘complex’’ industrial settings included computers, electrical equipment, instruments, transpor-tation, and machinery (Cohen, Nelson, and Walsh, 2000).
108 / THE RAND JOURNAL OF ECONOMICS
q RAND 2001.
appropriate returns to innovation than firms owning complementary assets in manu-facturing (Teece, 1986). It is possible therefore that the increased propensity to patentwe observe in this industry is driven by the emergence of these patent-intensive firms.With this in mind, we explore the importance of patents to design firms in our inter-views and return to this specialization hypothesis in our econometric analysis.
3. Field interviews
n To illuminate the factors that have influenced patenting in the semiconductor in-dustry and the effects, if any, of the 1980s shift toward stronger U.S. patent rights onthe innovative activities of different types of firms, we met with intellectual propertymanagers and executives from seven semiconductor firms, including four manufacturersand three design firms. We conducted these interviews (which included structured ques-tions and a follow-up survey) between April 1998 and November 1998.
In each case, we asked to meet with someone with direct responsibility for for-mulating and implementing the firm’s patent strategy. Identifying relevant decisionmakers was straightforward for small firms: we typically met with someone with alegal/engineering background who was in charge of the firm’s patenting activities; inone case, we met with the firm’s CEO. For larger firms, we typically met with two ormore persons, including in-house patent or corporate attorneys, patent licensing exec-utives, or R&D lab managers. To gain additional views on whether the firms in oursample are representative of industrywide or cross-industry trends, we also met withattorneys actively involved in negotiating patent-related transactions on behalf of abroad set of firms, including ones in the semiconductor industry. The interview sampleincludes a range of firms in terms of size and patent intensity. Only one firm, TexasInstruments, held a large patent portfolio (both in absolute terms and relative to itsR&D spending) prior to the shift in U.S. patent policies. See Ziedonis (2000) for moreinformation on these interviews.
Without exception, interviewees emphasized that the stronger patent rights usheredin by the CAFC reshaped the incentives to obtain U.S. patents in this industry. But theimplications of the pro-patent shift appeared to differ among the types of firms in theinterview sample, depending on the size and strength of a firm’s patent portfolio in theearly 1980s and the extent to which other patent owners could credibly threaten toexclude the firm from using critical technologies. Despite the small number of firmsin the interview sample, questions about the perceived effects of the early-1980s shiftin U.S. patent policies generated a rich set of findings (see Ziedonis, 2000). Here, wefocus on differences between manufacturing firms and design firms that inform oureconometric analysis below.
▫ Large-scale manufacturers: the increased value of patents as bargaining chips.Several large-scale manufacturers in our sample were visibly ‘‘ramping up’’ their patentportfolios and ‘‘harvesting’’ latent inventions to add to their stock of patents. Forexample, one firm had shifted from owning a total of 30 patents (in 1990) to filingover 300 patent applications in one year—with an internal goal to ‘‘own 1,000 patentsby the year 2000.’’ Another manufacturer had instituted an even more ambitious ‘‘1,000by 2000’’ patent goal while maintaining a relatively stable R&D budget. In this case,the firm had embarked on an explicit campaign to file 1,000 patent applications in asingle year by the year 2000. In line with this goal, the number of annual patentapplications filed by the firm rose from around 100 in 1993 to over 650 by 1996. Theincreased volume of patent filings appeared to reflect a deeper reach into an existingpool of inventions rather than a shift in R&D activities per se. As one interviewee
HALL AND ZIEDONIS / 109
q RAND 2001.
noted, there were ‘‘a lot of patentable inventions sitting around,’’ but the firm hadsimply ‘‘not taken the time and incurred the cost’’ to patent, or ‘‘harvest,’’ these in-ventions in the past.
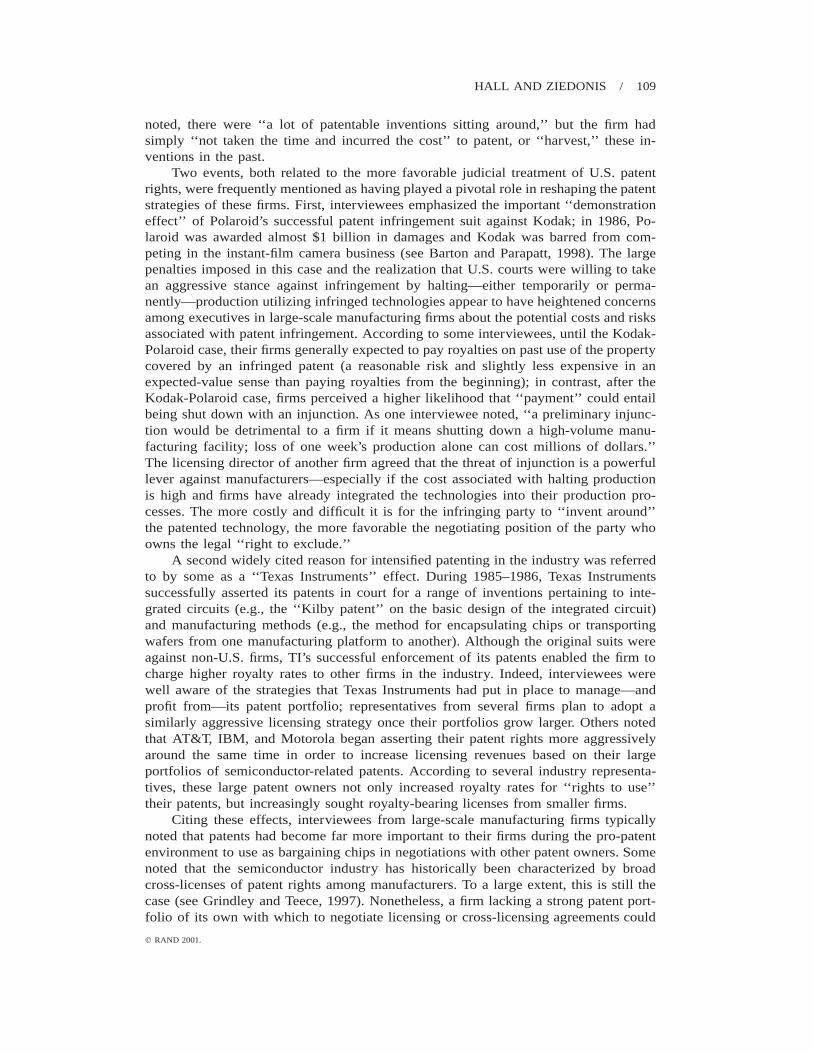
Two events, both related to the more favorable judicial treatment of U.S. patentrights, were frequently mentioned as having played a pivotal role in reshaping the patentstrategies of these firms. First, interviewees emphasized the important ‘‘demonstrationeffect’’ of Polaroid’s successful patent infringement suit against Kodak; in 1986, Po-laroid was awarded almost $1 billion in damages and Kodak was barred from com-peting in the instant-film camera business (see Barton and Parapatt, 1998). The largepenalties imposed in this case and the realization that U.S. courts were willing to takean aggressive stance against infringement by halting—either temporarily or perma-nently—production utilizing infringed technologies appear to have heightened concernsamong executives in large-scale manufacturing firms about the potential costs and risksassociated with patent infringement. According to some interviewees, until the Kodak-Polaroid case, their firms generally expected to pay royalties on past use of the propertycovered by an infringed patent (a reasonable risk and slightly less expensive in anexpected-value sense than paying royalties from the beginning); in contrast, after theKodak-Polaroid case, firms perceived a higher likelihood that ‘‘payment’’ could entailbeing shut down with an injunction. As one interviewee noted, ‘‘a preliminary injunc-tion would be detrimental to a firm if it means shutting down a high-volume manu-facturing facility; loss of one week’s production alone can cost millions of dollars.’’The licensing director of another firm agreed that the threat of injunction is a powerfullever against manufacturers—especially if the cost associated with halting productionis high and firms have already integrated the technologies into their production pro-cesses. The more costly and difficult it is for the infringing party to ‘‘invent around’’the patented technology, the more favorable the negotiating position of the party whoowns the legal ‘‘right to exclude.’’
A second widely cited reason for intensified patenting in the industry was referredto by some as a ‘‘Texas Instruments’’ effect. During 1985–1986, Texas Instrumentssuccessfully asserted its patents in court for a range of inventions pertaining to inte-grated circuits (e.g., the ‘‘Kilby patent’’ on the basic design of the integrated circuit)and manufacturing methods (e.g., the method for encapsulating chips or transportingwafers from one manufacturing platform to another). Although the original suits wereagainst non-U.S. firms, TI’s successful enforcement of its patents enabled the firm tocharge higher royalty rates to other firms in the industry. Indeed, interviewees werewell aware of the strategies that Texas Instruments had put in place to manage—andprofit from—its patent portfolio; representatives from several firms plan to adopt asimilarly aggressive licensing strategy once their portfolios grow larger. Others notedthat AT&T, IBM, and Motorola began asserting their patent rights more aggressivelyaround the same time in order to increase licensing revenues based on their largeportfolios of semiconductor-related patents. According to several industry representa-tives, these large patent owners not only increased royalty rates for ‘‘rights to use’’their patents, but increasingly sought royalty-bearing licenses from smaller firms.
Citing these effects, interviewees from large-scale manufacturing firms typicallynoted that patents had become far more important to their firms during the pro-patentenvironment to use as bargaining chips in negotiations with other patent owners. Somenoted that the semiconductor industry has historically been characterized by broadcross-licenses of patent rights among manufacturers. To a large extent, this is still thecase (see Grindley and Teece, 1997). Nonetheless, a firm lacking a strong patent port-folio of its own with which to negotiate licensing or cross-licensing agreements could
110 / THE RAND JOURNAL OF ECONOMICS
q RAND 2001.
face a more rapid erosion of profits in an era when the costs and risks associated withinfringement had increased. For example, one industry executive estimates that ‘‘a newmanufacturer would need to spend $100–$200 million of revenues to license what arenow considered basic manufacturing principles but which do not transfer any currentlyuseful technologies’’ (as quoted in Headley, 1998).
Two factors emerged from these interviews that may exacerbate these general‘‘holdup’’ concerns among large-scale manufacturers in the semiconductor industry.First, several firms were investing in more expensive facilities that were becomingobsolete more quickly. For example, in the early 1980s, a state-of-the-art wafer fabri-cation facility (fab) cost about $100 million and had an expected lifespan of 10 years.By the mid-1990s, however, the cost had risen to over $1 billion for a new fab, whilethe useful life of the capital investment had been reduced to little more than 5 years(ICE, 1995). Semiconductor manufacturing is also notoriously complex, integrating anarray of process and product technologies that cover aspects of the circuitry design,materials used to achieve a certain outcome, and methods used in the wafer fabricationprocess (see Ham, Linden and Appleyard, 1998; Grindley and Teece, 1997). As severalindustry representatives pointed out, a given semiconductor product (say, a new mem-ory or logic device) will often embody hundreds if not thousands of ‘‘potentially pat-entable’’ technologies that could be owned by suppliers, manufacturers in otherindustries, rivals, design firms, or independent inventors. With the strengthening ofU.S. patent rights, the expected benefits of amassing portfolios of ‘‘legal rights toexclude’’ (for offensive and defensive reasons) began to outweigh their costs.9
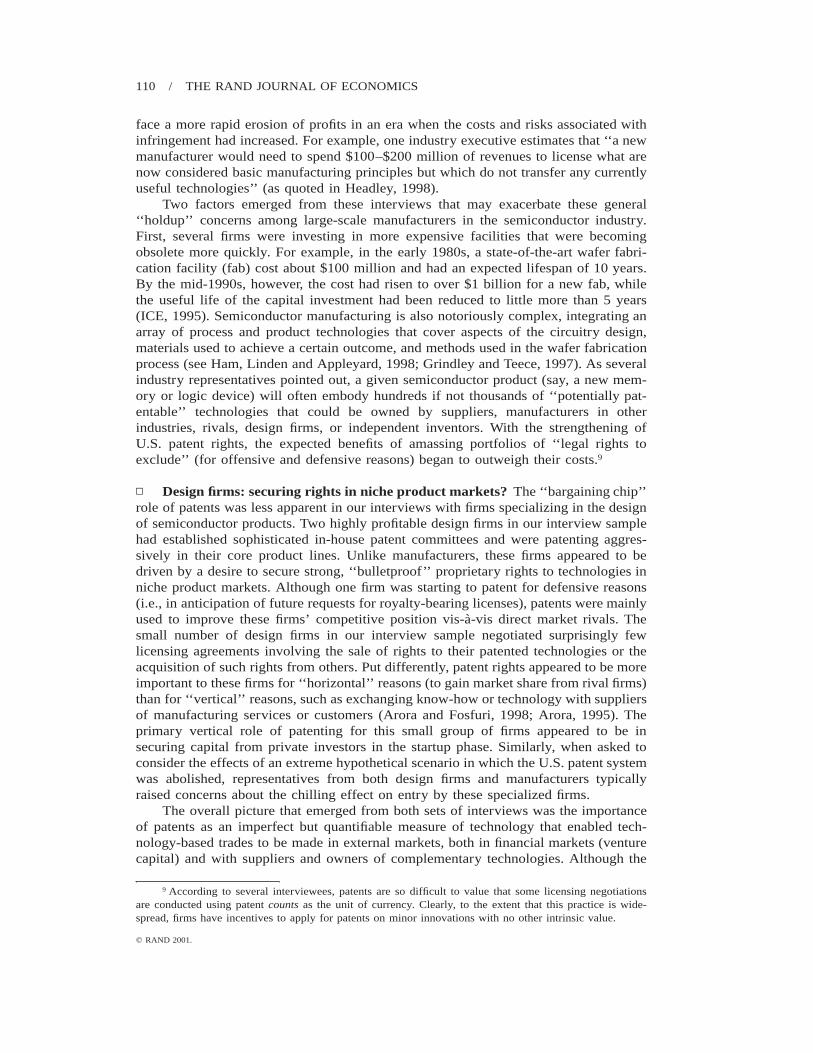
▫ Design firms: securing rights in niche product markets? The ‘‘bargaining chip’’role of patents was less apparent in our interviews with firms specializing in the designof semiconductor products. Two highly profitable design firms in our interview samplehad established sophisticated in-house patent committees and were patenting aggres-sively in their core product lines. Unlike manufacturers, these firms appeared to bedriven by a desire to secure strong, ‘‘bulletproof’’ proprietary rights to technologies inniche product markets. Although one firm was starting to patent for defensive reasons(i.e., in anticipation of future requests for royalty-bearing licenses), patents were mainlyused to improve these firms’ competitive position vis-a-vis direct market rivals. Thesmall number of design firms in our interview sample negotiated surprisingly fewlicensing agreements involving the sale of rights to their patented technologies or theacquisition of such rights from others. Put differently, patent rights appeared to be moreimportant to these firms for ‘‘horizontal’’ reasons (to gain market share from rival firms)than for ‘‘vertical’’ reasons, such as exchanging know-how or technology with suppliersof manufacturing services or customers (Arora and Fosfuri, 1998; Arora, 1995). Theprimary vertical role of patenting for this small group of firms appeared to be insecuring capital from private investors in the startup phase. Similarly, when asked toconsider the effects of an extreme hypothetical scenario in which the U.S. patent systemwas abolished, representatives from both design firms and manufacturers typicallyraised concerns about the chilling effect on entry by these specialized firms.
The overall picture that emerged from both sets of interviews was the importanceof patents as an imperfect but quantifiable measure of technology that enabled tech-nology-based trades to be made in external markets, both in financial markets (venturecapital) and with suppliers and owners of complementary technologies. Although the
9 According to several interviewees, patents are so difficult to value that some licensing negotiationsare conducted using patent counts as the unit of currency. Clearly, to the extent that this practice is wide-spread, firms have incentives to apply for patents on minor innovations with no other intrinsic value.
HALL AND ZIEDONIS / 111
q RAND 2001.
sample underpinning these interviews is not necessarily representative of the industryas a whole, the general insights suggest that the shift in patent policies in the early1980s increased the incentives of firms in this industry to patent (with notable excep-tions; see Ziedonis (2000)), albeit for reasons that differ among types of firms.
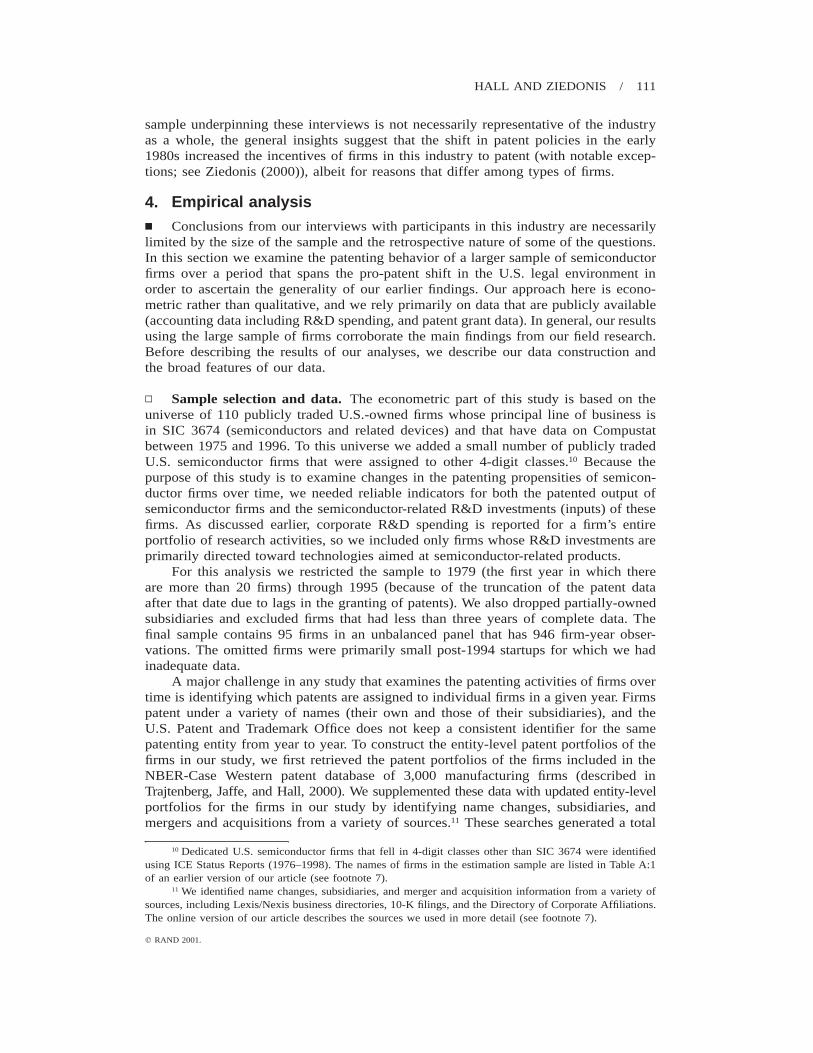
4. Empirical analysisn Conclusions from our interviews with participants in this industry are necessarilylimited by the size of the sample and the retrospective nature of some of the questions.In this section we examine the patenting behavior of a larger sample of semiconductorfirms over a period that spans the pro-patent shift in the U.S. legal environment inorder to ascertain the generality of our earlier findings. Our approach here is econo-metric rather than qualitative, and we rely primarily on data that are publicly available(accounting data including R&D spending, and patent grant data). In general, our resultsusing the large sample of firms corroborate the main findings from our field research.Before describing the results of our analyses, we describe our data construction andthe broad features of our data.
▫ Sample selection and data. The econometric part of this study is based on theuniverse of 110 publicly traded U.S.-owned firms whose principal line of business isin SIC 3674 (semiconductors and related devices) and that have data on Compustatbetween 1975 and 1996. To this universe we added a small number of publicly tradedU.S. semiconductor firms that were assigned to other 4-digit classes.10 Because thepurpose of this study is to examine changes in the patenting propensities of semicon-ductor firms over time, we needed reliable indicators for both the patented output ofsemiconductor firms and the semiconductor-related R&D investments (inputs) of thesefirms. As discussed earlier, corporate R&D spending is reported for a firm’s entireportfolio of research activities, so we included only firms whose R&D investments areprimarily directed toward technologies aimed at semiconductor-related products.
For this analysis we restricted the sample to 1979 (the first year in which thereare more than 20 firms) through 1995 (because of the truncation of the patent dataafter that date due to lags in the granting of patents). We also dropped partially-ownedsubsidiaries and excluded firms that had less than three years of complete data. Thefinal sample contains 95 firms in an unbalanced panel that has 946 firm-year obser-vations. The omitted firms were primarily small post-1994 startups for which we hadinadequate data.
A major challenge in any study that examines the patenting activities of firms overtime is identifying which patents are assigned to individual firms in a given year. Firmspatent under a variety of names (their own and those of their subsidiaries), and theU.S. Patent and Trademark Office does not keep a consistent identifier for the samepatenting entity from year to year. To construct the entity-level patent portfolios of thefirms in our study, we first retrieved the patent portfolios of the firms included in theNBER-Case Western patent database of 3,000 manufacturing firms (described inTrajtenberg, Jaffe, and Hall, 2000). We supplemented these data with updated entity-levelportfolios for the firms in our study by identifying name changes, subsidiaries, andmergers and acquisitions from a variety of sources.11 These searches generated a total
10 Dedicated U.S. semiconductor firms that fell in 4-digit classes other than SIC 3674 were identifiedusing ICE Status Reports (1976–1998). The names of firms in the estimation sample are listed in Table A:1of an earlier version of our article (see footnote 7).
11 We identified name changes, subsidiaries, and merger and acquisition information from a variety ofsources, including Lexis/Nexis business directories, 10-K filings, and the Directory of Corporate Affiliations.The online version of our article describes the sources we used in more detail (see footnote 7).
112 / THE RAND JOURNAL OF ECONOMICS
q RAND 2001.
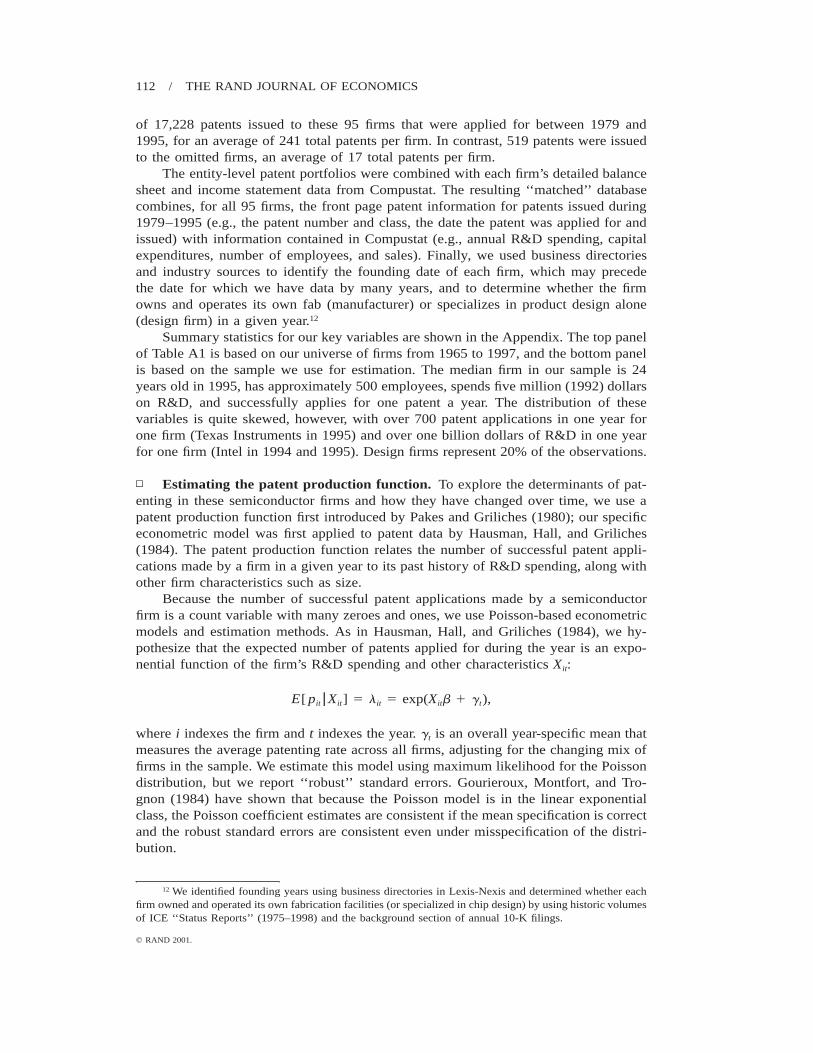
of 17,228 patents issued to these 95 firms that were applied for between 1979 and1995, for an average of 241 total patents per firm. In contrast, 519 patents were issuedto the omitted firms, an average of 17 total patents per firm.
The entity-level patent portfolios were combined with each firm’s detailed balancesheet and income statement data from Compustat. The resulting ‘‘matched’’ databasecombines, for all 95 firms, the front page patent information for patents issued during1979–1995 (e.g., the patent number and class, the date the patent was applied for andissued) with information contained in Compustat (e.g., annual R&D spending, capitalexpenditures, number of employees, and sales). Finally, we used business directoriesand industry sources to identify the founding date of each firm, which may precedethe date for which we have data by many years, and to determine whether the firmowns and operates its own fab (manufacturer) or specializes in product design alone(design firm) in a given year.12
Summary statistics for our key variables are shown in the Appendix. The top panelof Table A1 is based on our universe of firms from 1965 to 1997, and the bottom panelis based on the sample we use for estimation. The median firm in our sample is 24years old in 1995, has approximately 500 employees, spends five million (1992) dollarson R&D, and successfully applies for one patent a year. The distribution of thesevariables is quite skewed, however, with over 700 patent applications in one year forone firm (Texas Instruments in 1995) and over one billion dollars of R&D in one yearfor one firm (Intel in 1994 and 1995). Design firms represent 20% of the observations.
▫ Estimating the patent production function. To explore the determinants of pat-enting in these semiconductor firms and how they have changed over time, we use apatent production function first introduced by Pakes and Griliches (1980); our specificeconometric model was first applied to patent data by Hausman, Hall, and Griliches(1984). The patent production function relates the number of successful patent appli-cations made by a firm in a given year to its past history of R&D spending, along withother firm characteristics such as size.
Because the number of successful patent applications made by a semiconductorfirm is a count variable with many zeroes and ones, we use Poisson-based econometricmodels and estimation methods. As in Hausman, Hall, and Griliches (1984), we hy-pothesize that the expected number of patents applied for during the year is an expo-nential function of the firm’s R&D spending and other characteristics Xit:
E[ pit z Xit] 5 lit 5 exp(Xitb 1 gt),
where i indexes the firm and t indexes the year. gt is an overall year-specific mean thatmeasures the average patenting rate across all firms, adjusting for the changing mix offirms in the sample. We estimate this model using maximum likelihood for the Poissondistribution, but we report ‘‘robust’’ standard errors. Gourieroux, Montfort, and Tro-gnon (1984) have shown that because the Poisson model is in the linear exponentialclass, the Poisson coefficient estimates are consistent if the mean specification is correctand the robust standard errors are consistent even under misspecification of the distri-bution.
12 We identified founding years using business directories in Lexis-Nexis and determined whether eachfirm owned and operated its own fabrication facilities (or specialized in chip design) by using historic volumesof ICE ‘‘Status Reports’’ (1975–1998) and the background section of annual 10-K filings.
HALL AND ZIEDONIS / 113
q RAND 2001.
We also report the results of a Lagrange multiplier test due to Cameron and Trivedi(1998) for overdispersion of the negative binomial (2) type.13 Rejection can be inter-preted as a rejection of the pure Poisson model in favor of a model where the varianceis proportional to the mean. But because the negative binomial model estimates wouldbe inconsistent if the true distribution were not negative binomial, we prefer to interpretthe LM test as a diagnostic that indicates that we should report robust, heteroskedastic-consistent standard errors for the Poisson model (which will remain consistent) ratherthan implying that we should automatically switch to a negative binomial model (whichis potentially inconsistent).
The coefficients from the patent production function model presented above havean elasticity interpretation,
(1/lit)(dlit/dXit) 5 b,
and the changes in the gt’s measure the growth of the patenting propensities over timethat is not accounted for by changes in the firm’s characteristics:
D log lit 5 Xitb 1 gt 2 (Xit21b 1 gt21) 5 DXitb 1 gt 2 gt21.
Thus the growth of the expected number of patents can be decomposed into the growthdue to changes in firm characteristics and a residual growth rate gt 2 gt21, which weinterpret as being due to changes in the patenting environment faced by these firms.
Traditionally, the most important variable in the patent production function is R&Dspending by the firm. Much of the early work that estimated this model focused onthe question of whether one could measure the lag structure for the production ofpatents from past R&D spending (Pakes and Griliches, 1980; Hausman, Hall, andGriliches, 1984; Hall, Griliches, and Hausman, 1986; see also Montalvo, 1997 andBlundell, Griffith, and Windmeijer, 2000). This literature largely concludes that the lagstructure is very poorly identified because of the high within-firm correlation of R&Dspending over time. When many lags are included in the model, the estimate of thesum of the coefficients is roughly the same as the estimated coefficient of contempo-raneous R&D when no lags are included; in addition, most of the contribution comesfrom the oldest and the newest R&D lag included. Experimentation with lag structuresusing these data confirmed the results in the earlier literature. For this reason andbecause many of our firms have very short R&D histories, we use contemporaneouslevels of R&D spending in our specifications.
A second result in the previous literature on patent production is that when oneallows for permanent differences across firms in the propensity to patent, the sum ofthe R&D lag coefficients falls, mostly because the coefficient on the oldest lag becomesinsignificant. For some of our hypotheses, we are interested in the firm effects them-selves (for example, the difference between design and manufacturing firms, or thedifference between incumbents and entrants). With this in mind, we do not want tobegin with a model that sweeps them out. To determine whether the coefficients arebiased from the presence of unobserved firm characteristics, however, we ran separateanalyses using the conditional (fixed-effect) and random-effects Poisson models intro-duced by Hausman, Hall, and Griliches (1984). In contrast to earlier results using these
13 All the estimates in the article were obtained using the POISSON, NEGBIN, and ML procedures inTSP Version 4.5. See the TSP Reference Manual (1999) for details on the estimation strategy. The resultswere benchmarked against published results in Cameron and Trivedi (1998) and Hausman, Hall, and Griliches(1984).
114 / THE RAND JOURNAL OF ECONOMICS
q RAND 2001.
kinds of data that were based on a wide range of industries, we found that the impactof permanent differences across firms within this single industry was in fact quitemodest. For these reasons, we allow for observed permanent differences across firmtypes in the analyses reported in this article, but we do not include unobserved firmeffects.14
Our base specification of the patent production function therefore includes thefollowing variables:
R&D spending during the year in which the patent applications were filed, deflatedin 1992 dollars, in logarithms. When employment (size) is also included, we normalizeR&D spending by the number of employees to avoid confounding the R&D effect withthe size effect. For a small number of observations, R&D is missing or not reported;we include a dummy variable for these observations so that the R&D coefficient willnot be biased.
The size of the firm, measured as the logarithm of employment. As previous studieshave documented, there may be economies of scale in generating patents due to thefixed cost of maintaining a legal department that handles IP (Intellectual Property)-related questions and tasks (confirmed in our interviews; see also Lanjouw and Lerner(1996) and Lerner, (1995)).
Annual time dummies for 1979–1995.
After presenting the base specification and discussing the results, we estimate aseries of ‘‘patent production functions’’ that (i) illuminate whether a change in firm-level patenting behavior has taken place during the period associated with stronger U.S.patent rights, as suggested by the general trends shown earlier in Figure 1, and (ii)explore key differences among firms. Recall that we seek to test two main hypotheses.First, we examine whether firms most subject to ‘‘holdup’’ responded strategically tothe shift in the U.S. legal environment by patenting more aggressively during the periodof strong patent rights (our strategic response hypothesis). Based on our interviews,firms with large sunk costs in complex manufacturing facilities appear to have thelargest incentives to ‘‘ramp up’’ their patent portfolios to safeguard against the threatof costly litigation and to negotiate access to external technologies on more favorableterms. To test this hypothesis, we ask whether capital intensity (a stock measure, definedbelow) influences the patenting behavior of firms in this industry and whether it hasplayed a more prominent role in their patenting behavior in the period of strong U.S.patent rights.
To test our second main hypothesis—that patent rights facilitated entry by designfirms that rely more heavily on patents to appropriate returns to innovation (our spe-cialization hypothesis)—we will (1) examine the changing pattern of entry in thisindustry and (2) investigate whether post-1982 design firms (i.e., ones that entered theindustry during the pro-patent era) rely more heavily on patent protection, controllingfor other determinants of patenting. Finally, to address the alternative ‘‘regulatory cap-ture’’ hypothesis posed by Kortum and Lerner (1998), we control for the one firm inour sample, Texas Instruments, that held a large portfolio of patents in the pre-1982period (both in absolute numbers and relative to other firms in the sample). This hy-pothesis also implies more aggressive patenting by large incumbents, an issue that wealso explore. We return to the second alternative hypothesis raised by Kortum andLerner (that the patterns we observe are driven by improvements in the research processunrelated to stronger U.S. patents) in Section 5.
14 The results of our analyses of firm effects are available in Appendix C of an earlier version of ourarticle (see footnote 7).
HALL AND ZIEDONIS / 115
q RAND 2001.
In summary, to test our hypotheses, we augment the base specification outlinedabove with a series of variables that explore the differences in the patent equation forfirms of various types:
The capital intensity of the firm, measured as the logarithm of the ratio of deflated(1992$) property, plant, and equipment to employees (i.e., capital-labor ratio).
An entrant dummy, for firms that were founded after 1982 (the year that CAFCwas created). There are 35 such firms with 185 observations.
The type of firm (manufacturer or design firm). There are 28 design firms in thesample for a total of 192 observations.
A Texas Instruments dummy, to control for the fact that TI patents aggressivelyrelative to other firms in our sample, controlling for R&D spending and size.
The age of the firm (measured as the logarithm of the difference between thecurrent year and the founding year of the firm) to control for the possibility that olderfirms have more experience managing the patent application process and therefore maybe more efficient in their patenting activities for reasons that are not perfectly correlatedwith firm size (Sorensen and Stuart, 2000).
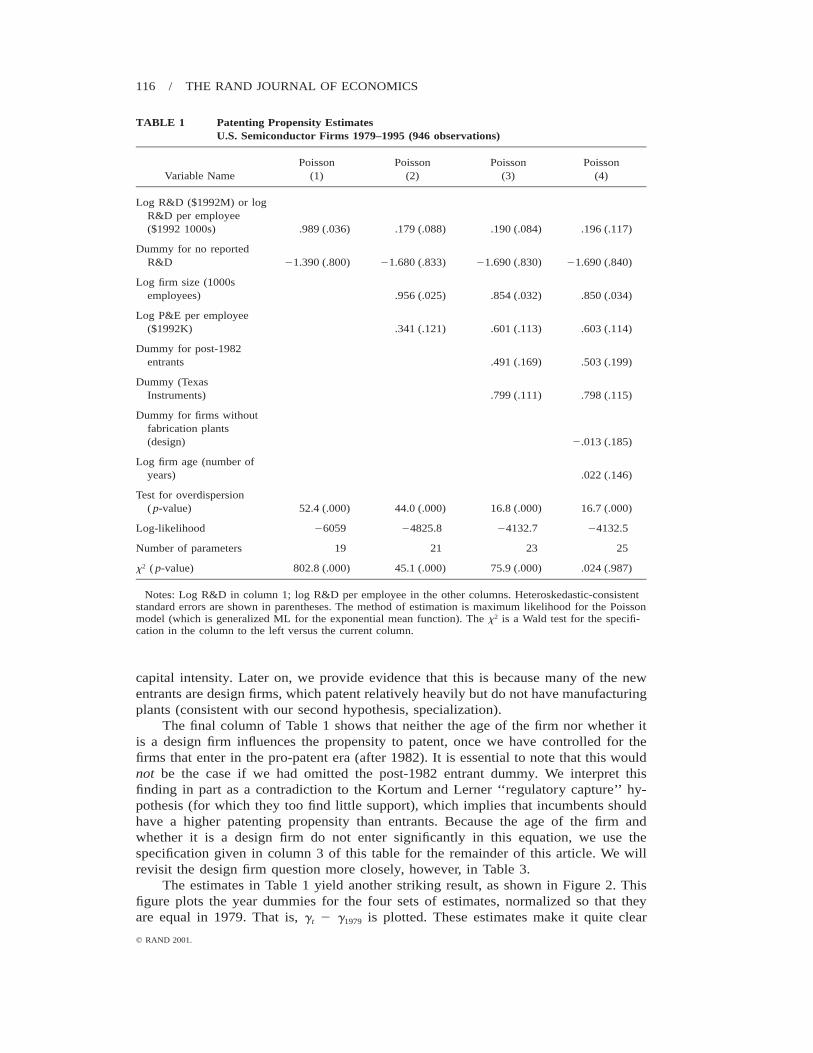
▫ Basic results. Table 1 presents a series of estimations of our basic model usingmaximum-likelihood methods and the Poisson density function. As should be clearfrom the above discussion, the dataset is a panel and the unit of analysis is a firm-year.Standard error estimates robust to heteroskedasticity and misspecification of the distri-bution are shown in parentheses. Column 1 shows that the estimated elasticity of pat-enting with respect to R&D spending in this industry is similar to estimates previouslyobtained using data for the whole manufacturing sector in the 1970s, although some-what higher. For example, Hausman, Hall, and Griliches (1984) obtained an R&Delasticity of .87 (.004) using the Poisson distribution and an elasticity of .75 (.02) andvariance parameter of .04 (.002) using the negative binomial distribution for 128 largefirms. Hall, Griliches, and Hausman (1986) obtained a somewhat lower elasticity of.52 for a larger sample of 642 firms. In the latter case, the log of capital stock wasalso included in the equation, and the total scale coefficient (the sum of the two co-efficients) was .66, somewhat closer to our estimate of .99 (.04).
When we add firm size and capital intensity to the model and replace R&D withthe R&D-employment ratio in column 2, the R&D coefficient falls sharply because thesize effect is now in the employment variable, but the scale coefficient is about thesame (equal to .96). That is, there is no evidence of increasing returns in the patentproduction function. The explanatory power of the model also improves, with a sub-stantial increase in the likelihood and a fall in the value of the overdispersion teststatistic. Capital intensity seems to have an important effect on the propensity to patent,one that is slightly larger and more significant than the influence of R&D spending.This is consistent with our first (strategic response) hypothesis.
In column 3 we add dummies for post-1982 entry and for Texas Instruments (TI).The estimate for TI reflects its well-known aggressive IP strategy and suggests that TIobtains an average of approximately 122% more patents (5 exp(.799) 2 1) than otherfirms in the sample, even controlling for its size, R&D, and capital intensity. In column3 and in the rest of our results, the patent equation is much closer to passing theoverdispersion test. Controlling for the unique nature of TI leaves us with a sample offirms whose patenting behavior is more consistent with the conditional Poisson model(that is, the variance conditional on firm characteristics is nearly equal to the conditionalmean). Interestingly, firms that entered this industry during the pro-patent era have a65% higher patenting propensity. Allowing for this fact also strengthens the impact of
116 / THE RAND JOURNAL OF ECONOMICS
q RAND 2001.
TABLE 1 Patenting Propensity EstimatesU.S. Semiconductor Firms 1979–1995 (946 observations)
Variable NamePoisson
(1)Poisson
(2)Poisson
(3)Poisson
(4)
Log R&D ($1992M) or logR&D per employee($1992 1000s) .989 (.036) .179 (.088) .190 (.084) .196 (.117)
Dummy for no reportedR&D 21.390 (.800) 21.680 (.833) 21.690 (.830) 21.690 (.840)
Log firm size (1000semployees) .956 (.025) .854 (.032) .850 (.034)
Log P&E per employee($1992K) .341 (.121) .601 (.113) .603 (.114)
Dummy for post-1982entrants .491 (.169) .503 (.199)
Dummy (TexasInstruments) .799 (.111) .798 (.115)
Dummy for firms withoutfabrication plants(design) 2.013 (.185)
Log firm age (number ofyears) .022 (.146)
Test for overdispersion( p-value) 52.4 (.000) 44.0 (.000) 16.8 (.000) 16.7 (.000)
Log-likelihood 26059 24825.8 24132.7 24132.5
Number of parameters 19 21 23 25
x2 ( p-value) 802.8 (.000) 45.1 (.000) 75.9 (.000) .024 (.987)
Notes: Log R&D in column 1; log R&D per employee in the other columns. Heteroskedastic-consistentstandard errors are shown in parentheses. The method of estimation is maximum likelihood for the Poissonmodel (which is generalized ML for the exponential mean function). The x2 is a Wald test for the specifi-cation in the column to the left versus the current column.
capital intensity. Later on, we provide evidence that this is because many of the newentrants are design firms, which patent relatively heavily but do not have manufacturingplants (consistent with our second hypothesis, specialization).
The final column of Table 1 shows that neither the age of the firm nor whether itis a design firm influences the propensity to patent, once we have controlled for thefirms that enter in the pro-patent era (after 1982). It is essential to note that this wouldnot be the case if we had omitted the post-1982 entrant dummy. We interpret thisfinding in part as a contradiction to the Kortum and Lerner ‘‘regulatory capture’’ hy-pothesis (for which they too find little support), which implies that incumbents shouldhave a higher patenting propensity than entrants. Because the age of the firm andwhether it is a design firm do not enter significantly in this equation, we use thespecification given in column 3 of this table for the remainder of this article. We willrevisit the design firm question more closely, however, in Table 3.
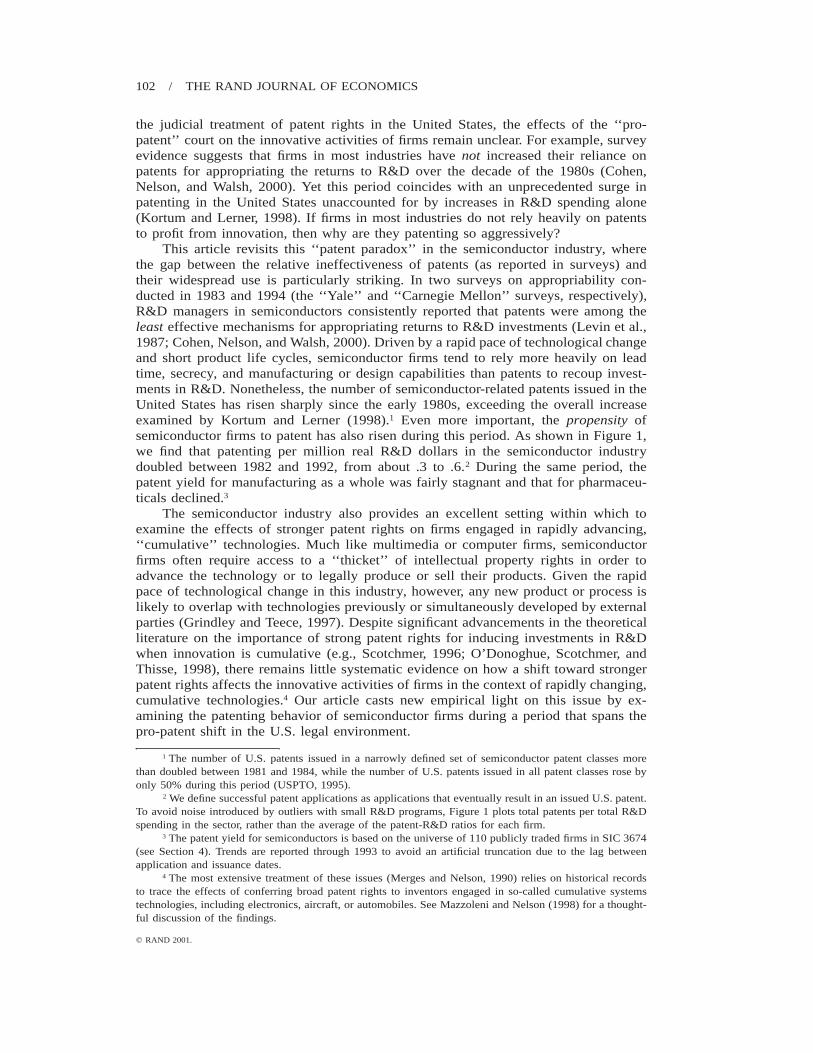
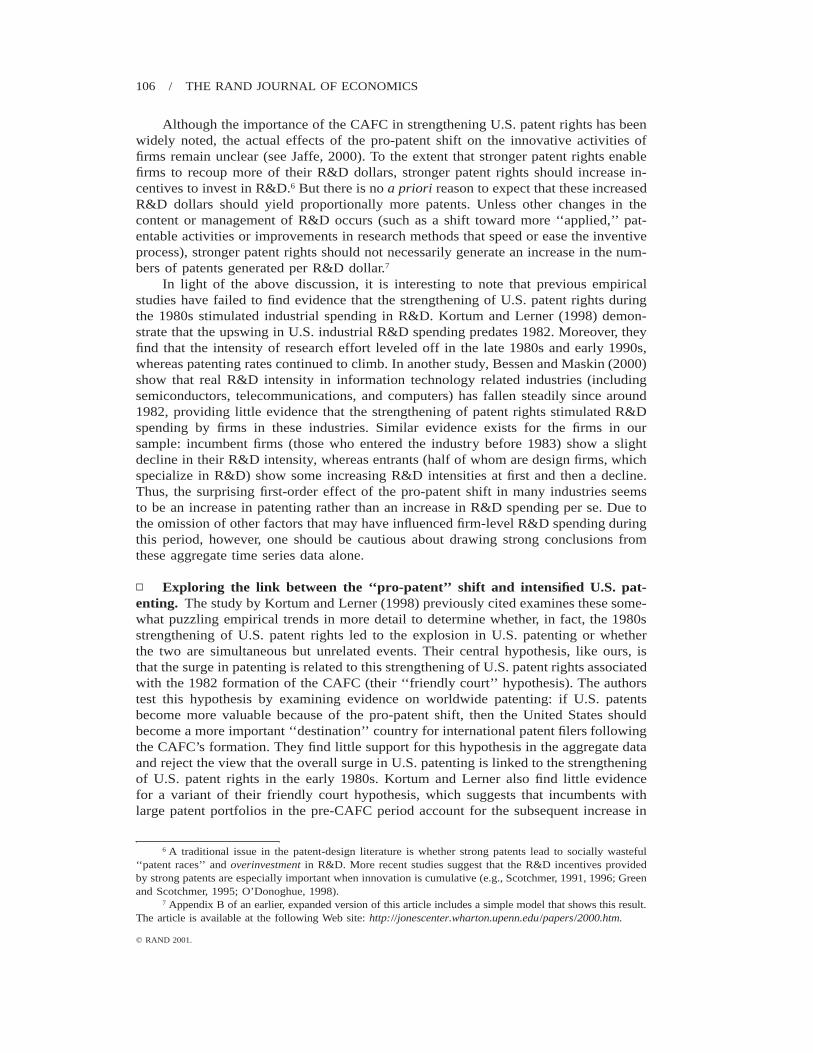
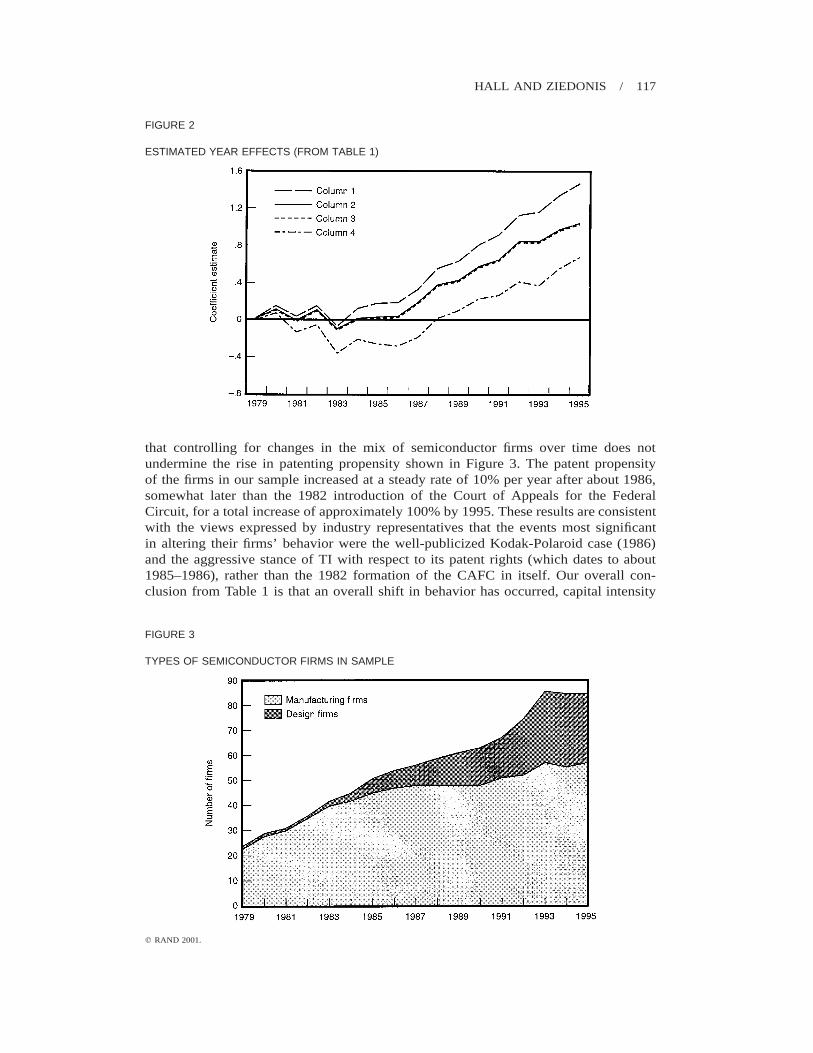
The estimates in Table 1 yield another striking result, as shown in Figure 2. Thisfigure plots the year dummies for the four sets of estimates, normalized so that theyare equal in 1979. That is, gt 2 g1979 is plotted. These estimates make it quite clear
HALL AND ZIEDONIS / 117
q RAND 2001.
FIGURE 2
ESTIMATED YEAR EFFECTS (FROM TABLE 1)
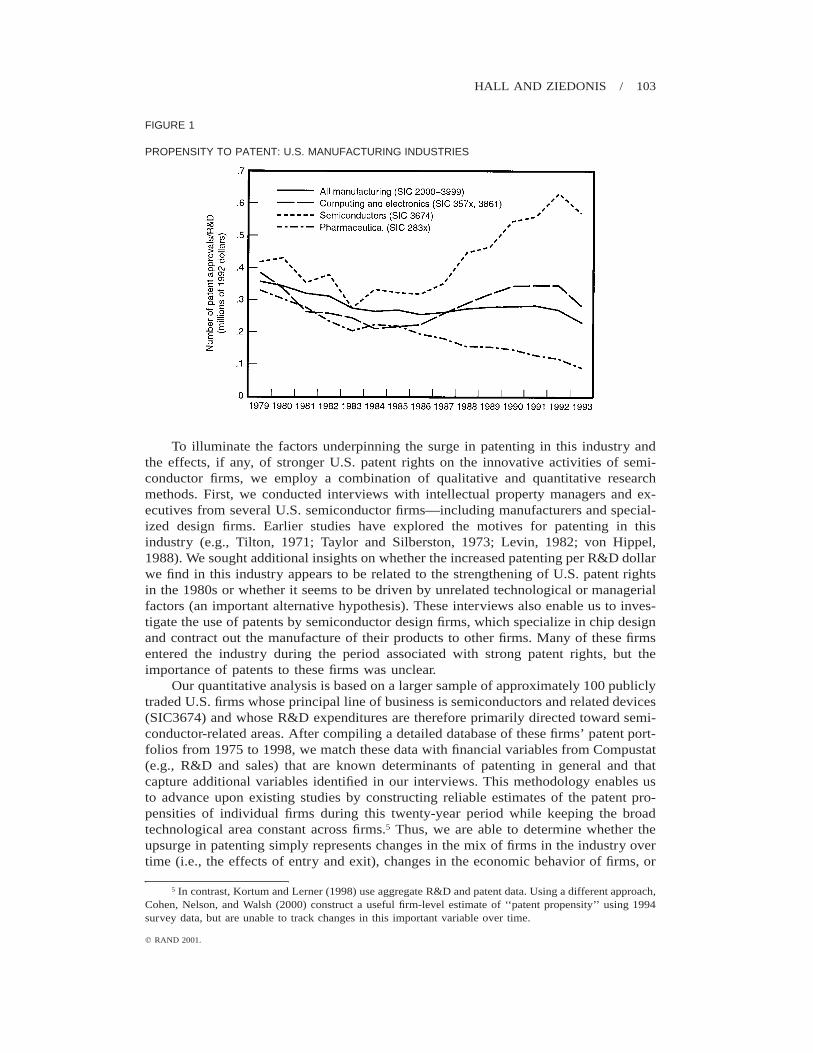
FIGURE 3
TYPES OF SEMICONDUCTOR FIRMS IN SAMPLE
that controlling for changes in the mix of semiconductor firms over time does notundermine the rise in patenting propensity shown in Figure 3. The patent propensityof the firms in our sample increased at a steady rate of 10% per year after about 1986,somewhat later than the 1982 introduction of the Court of Appeals for the FederalCircuit, for a total increase of approximately 100% by 1995. These results are consistentwith the views expressed by industry representatives that the events most significantin altering their firms’ behavior were the well-publicized Kodak-Polaroid case (1986)and the aggressive stance of TI with respect to its patent rights (which dates to about1985–1986), rather than the 1982 formation of the CAFC in itself. Our overall con-clusion from Table 1 is that an overall shift in behavior has occurred, capital intensity
118 / THE RAND JOURNAL OF ECONOMICS
q RAND 2001.
is an important predictor of patenting behavior and entrants patent more than incum-bents, other things equal.
▫ Changes in the determinants of patenting. To examine whether the pro-patentshift in the U.S. legal environment altered the determinants of patenting for firms inthis industry, we would like to estimate the behavior of these firms in periods bothbefore and after the ‘‘regime shift’’ took place. But the actual strengthening of U.S.patent rights involved a gradual process by which court rulings were disseminated andupheld. Although the CAFC was created in 1982 and issued a flurry of written opinionsduring 1983 (Adelman, 1987; Nies, 1993), the impact of the CAFC on the favorablelegal treatment of patent rights in U.S. courts was not widely publicized until the mid-1980s.15 Representatives from semiconductor firms also emphasized the important‘‘demonstration effects’’ associated with the successful patent infringement suits ofTexas Instruments and Polaroid during 1985–1986, as discussed in Section 3.
With this in mind, we selected three five-year intervals that allow for a moregradual ‘‘regime shift’’ toward stronger U.S. patent rights. The first period, 1979–1983,examines the patenting behavior of firms under the weaker patent regime. It implicitlyassumes that the response of firms to the 1982 creation of the CAFC would require atleast a one-year lag.16 The ‘‘during’’ period, 1984–1988, spans years in which the morefavorable judicial stance toward patents of the CAFC was widely heralded in the tradeand business press and verdicts in the TI and Polaroid cases were reached. The finalperiod, 1989–1993, examines the determinants of patenting under the pro-patent re-gime.
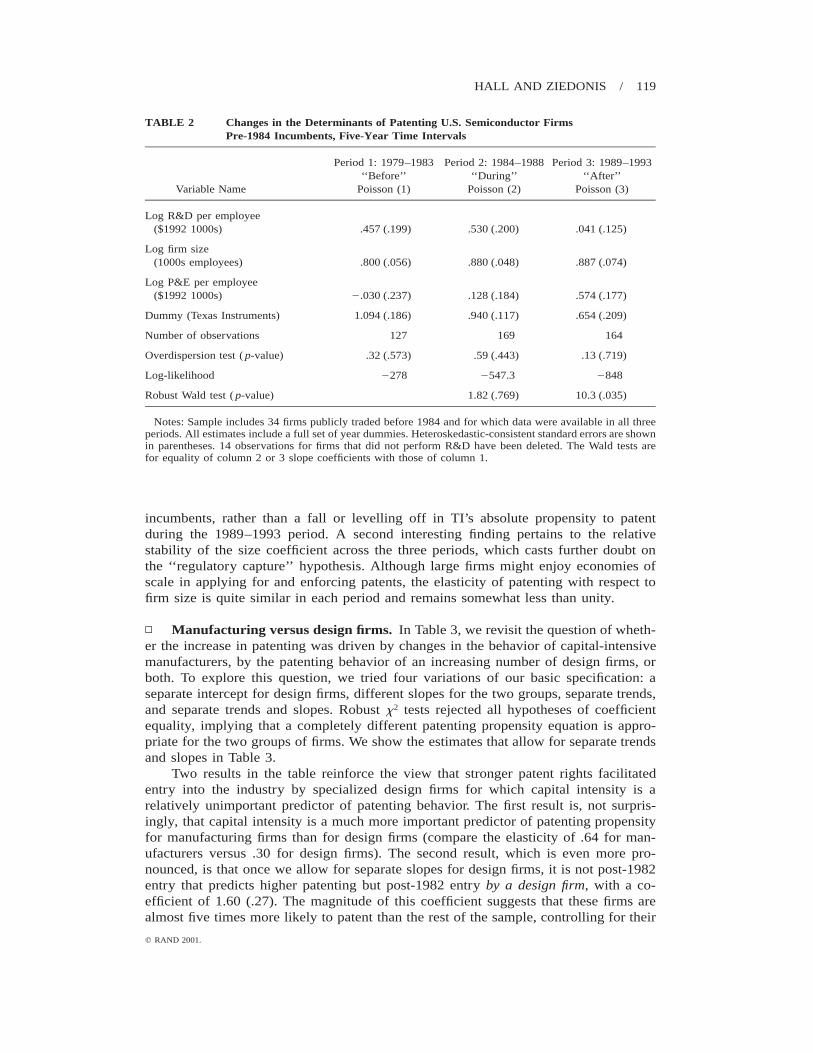
To examine changes in the determinants of patenting across the three periods, werestrict the sample to the subset of semiconductor firms that were publicly traded before1984 and for which data were available in each of the three periods. This selectioncriterion generated a sample of 34 incumbent firms. Table 2 presents the estimates ofthese incumbents’ patenting behavior in each of the three five-year intervals—againusing maximum-likelihood methods, a Poisson density function, and standard errorsthat are robust to heteroskedasticity and misspecification of the distribution. The resultswere insensitive to a more restrictive definition of ‘‘incumbents’’ that included firmspublicly traded before 1983 (instead of 1984) and the inclusion of eight incumbentsthat exited the sample during periods 2 and 3.
Overall, the results in Table 2 suggest that the strengthening of U.S. patent rightshas indeed altered the incentives of firms to patent, but for reasons that transcend thoseimplied by a narrow conception of patents as a mechanism by which to appropriatereturns to R&D. During the era of strong patent rights, these firms’ patenting behaviorbecame less, not more, responsive to their investments in R&D. Consistent with theview that capital-intensive firms altered their behavior under the new pro-patent regimeby patenting more aggressively, the coefficient of capital intensity changed from smalland insignificant in periods 1 and 2 to positive and highly significant in period 3.
Two other interesting results are contained in Table 3. First, Texas Instrumentsbecame less of an outlier in its patenting behavior over time. During 1979–1988, TIwas two to three times more likely to patent than other incumbents, all else equal.During 1989–1993, however, TI was only 92% more likely to patent that the otherfirms (all else equal). This result appears to reflect the relative ‘‘catching up’’ by other
15 A series of business press articles appeared around 1985–1986, announcing ‘‘A Change in the LegalClimate,’’ Forbes, October 7, 1985, p. 41; ‘‘A Weapon at Last [pro-patent decisions],’’ Forbes, March 10,1986, p. 46; and ‘‘The Surprising New Power of Patents,’’ Fortune, June 23, 1986, p. 57.
16 Excluding 1983 from this period did not substantively alter the results.
HALL AND ZIEDONIS / 119
q RAND 2001.
TABLE 2 Changes in the Determinants of Patenting U.S. Semiconductor FirmsPre-1984 Incumbents, Five-Year Time Intervals
Variable Name
Period 1: 1979–1983‘‘Before’’
Poisson (1)
Period 2: 1984–1988‘‘During’’
Poisson (2)
Period 3: 1989–1993‘‘After’’
Poisson (3)
Log R&D per employee($1992 1000s) .457 (.199) .530 (.200) .041 (.125)
Log firm size(1000s employees) .800 (.056) .880 (.048) .887 (.074)
Log P&E per employee($1992 1000s) 2.030 (.237) .128 (.184) .574 (.177)
Dummy (Texas Instruments) 1.094 (.186) .940 (.117) .654 (.209)
Number of observations 127 169 164
Overdispersion test ( p-value) .32 (.573) .59 (.443) .13 (.719)
Log-likelihood 2278 2547.3 2848
Robust Wald test ( p-value) 1.82 (.769) 10.3 (.035)
Notes: Sample includes 34 firms publicly traded before 1984 and for which data were available in all threeperiods. All estimates include a full set of year dummies. Heteroskedastic-consistent standard errors are shownin parentheses. 14 observations for firms that did not perform R&D have been deleted. The Wald tests arefor equality of column 2 or 3 slope coefficients with those of column 1.
incumbents, rather than a fall or levelling off in TI’s absolute propensity to patentduring the 1989–1993 period. A second interesting finding pertains to the relativestability of the size coefficient across the three periods, which casts further doubt onthe ‘‘regulatory capture’’ hypothesis. Although large firms might enjoy economies ofscale in applying for and enforcing patents, the elasticity of patenting with respect tofirm size is quite similar in each period and remains somewhat less than unity.
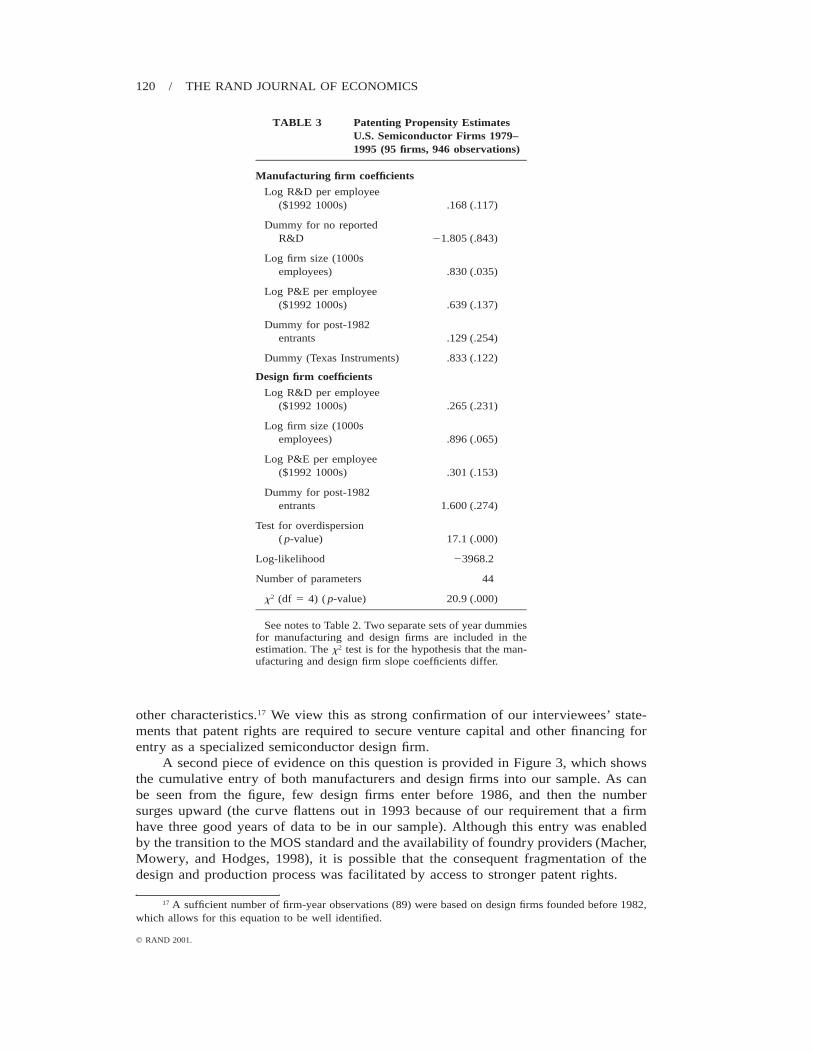
▫ Manufacturing versus design firms. In Table 3, we revisit the question of wheth-er the increase in patenting was driven by changes in the behavior of capital-intensivemanufacturers, by the patenting behavior of an increasing number of design firms, orboth. To explore this question, we tried four variations of our basic specification: aseparate intercept for design firms, different slopes for the two groups, separate trends,and separate trends and slopes. Robust x2 tests rejected all hypotheses of coefficientequality, implying that a completely different patenting propensity equation is appro-priate for the two groups of firms. We show the estimates that allow for separate trendsand slopes in Table 3.
Two results in the table reinforce the view that stronger patent rights facilitatedentry into the industry by specialized design firms for which capital intensity is arelatively unimportant predictor of patenting behavior. The first result is, not surpris-ingly, that capital intensity is a much more important predictor of patenting propensityfor manufacturing firms than for design firms (compare the elasticity of .64 for man-ufacturers versus .30 for design firms). The second result, which is even more pro-nounced, is that once we allow for separate slopes for design firms, it is not post-1982entry that predicts higher patenting but post-1982 entry by a design firm, with a co-efficient of 1.60 (.27). The magnitude of this coefficient suggests that these firms arealmost five times more likely to patent than the rest of the sample, controlling for their
120 / THE RAND JOURNAL OF ECONOMICS
q RAND 2001.
TABLE 3 Patenting Propensity EstimatesU.S. Semiconductor Firms 1979–1995 (95 firms, 946 observations)
Manufacturing firm coefficients
Log R&D per employee($1992 1000s) .168 (.117)
Dummy for no reportedR&D 21.805 (.843)
Log firm size (1000semployees) .830 (.035)
Log P&E per employee($1992 1000s) .639 (.137)
Dummy for post-1982entrants .129 (.254)
Dummy (Texas Instruments) .833 (.122)
Design firm coefficients
Log R&D per employee($1992 1000s) .265 (.231)
Log firm size (1000semployees) .896 (.065)
Log P&E per employee($1992 1000s) .301 (.153)
Dummy for post-1982entrants 1.600 (.274)
Test for overdispersion( p-value) 17.1 (.000)
Log-likelihood 23968.2
Number of parameters 44
x2 (df 5 4) ( p-value) 20.9 (.000)
See notes to Table 2. Two separate sets of year dummiesfor manufacturing and design firms are included in theestimation. The x2 test is for the hypothesis that the man-ufacturing and design firm slope coefficients differ.
other characteristics.17 We view this as strong confirmation of our interviewees’ state-ments that patent rights are required to secure venture capital and other financing forentry as a specialized semiconductor design firm.
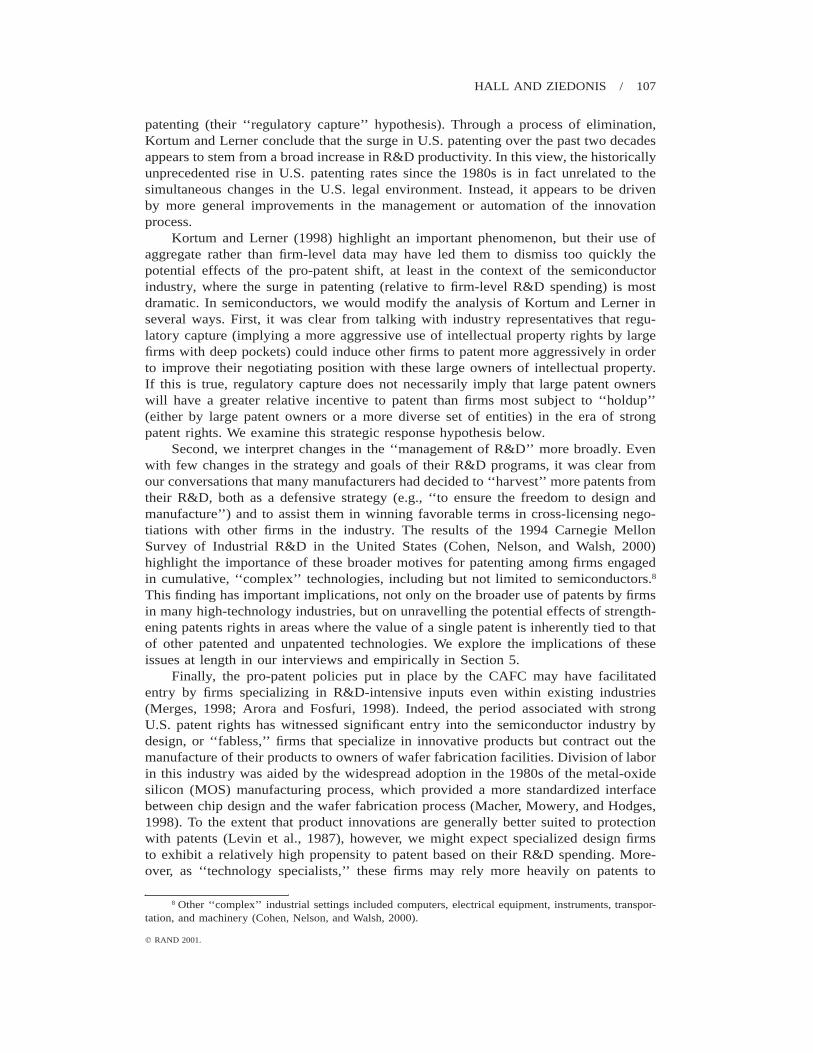
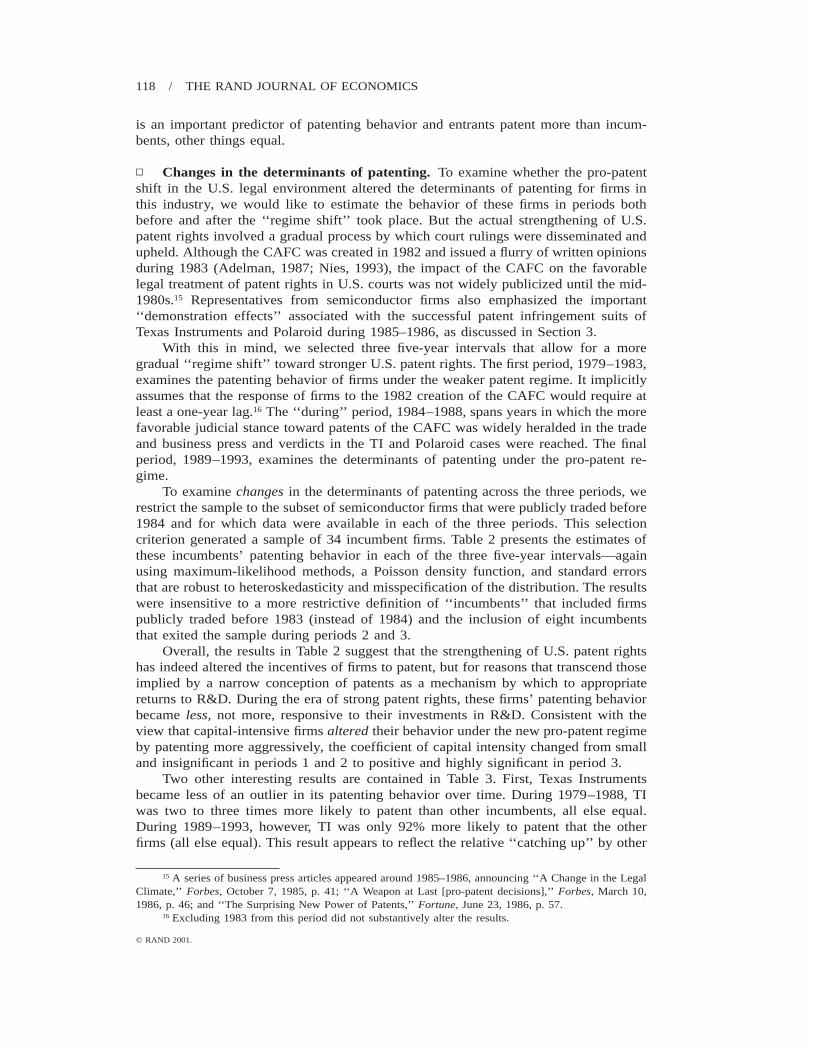
A second piece of evidence on this question is provided in Figure 3, which showsthe cumulative entry of both manufacturers and design firms into our sample. As canbe seen from the figure, few design firms enter before 1986, and then the numbersurges upward (the curve flattens out in 1993 because of our requirement that a firmhave three good years of data to be in our sample). Although this entry was enabledby the transition to the MOS standard and the availability of foundry providers (Macher,Mowery, and Hodges, 1998), it is possible that the consequent fragmentation of thedesign and production process was facilitated by access to stronger patent rights.
17 A sufficient number of firm-year observations (89) were based on design firms founded before 1982,which allows for this equation to be well identified.
HALL AND ZIEDONIS / 121
q RAND 2001.
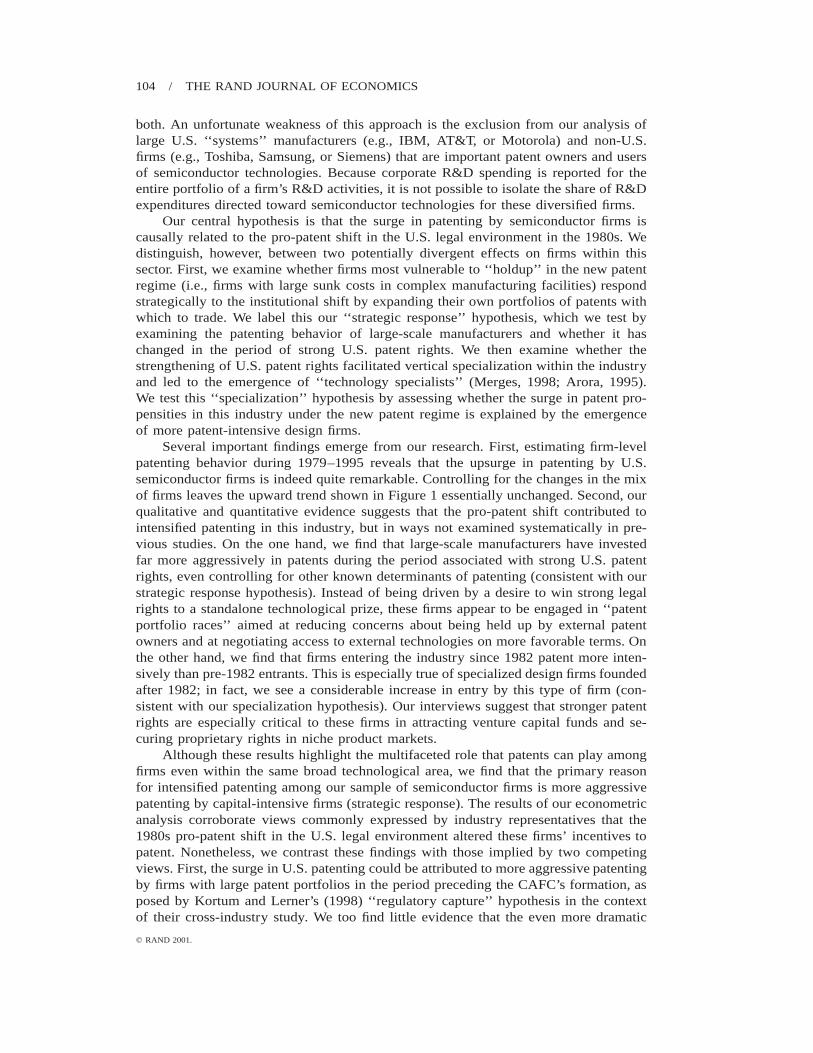
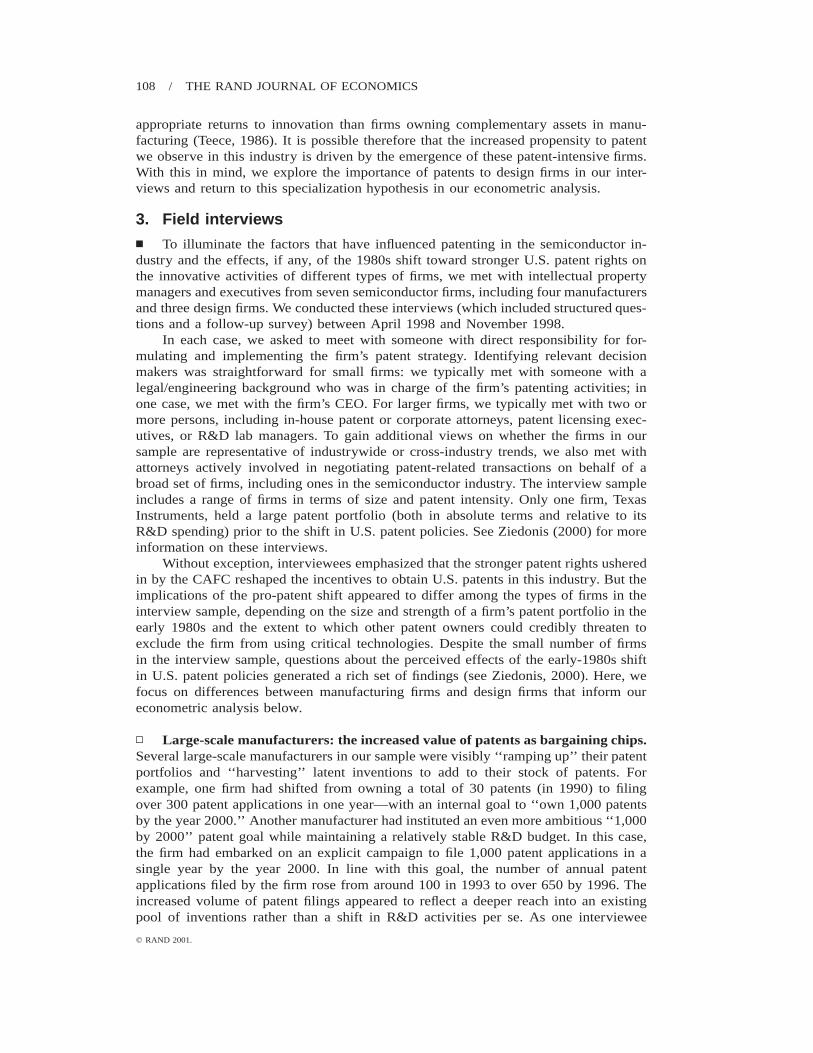
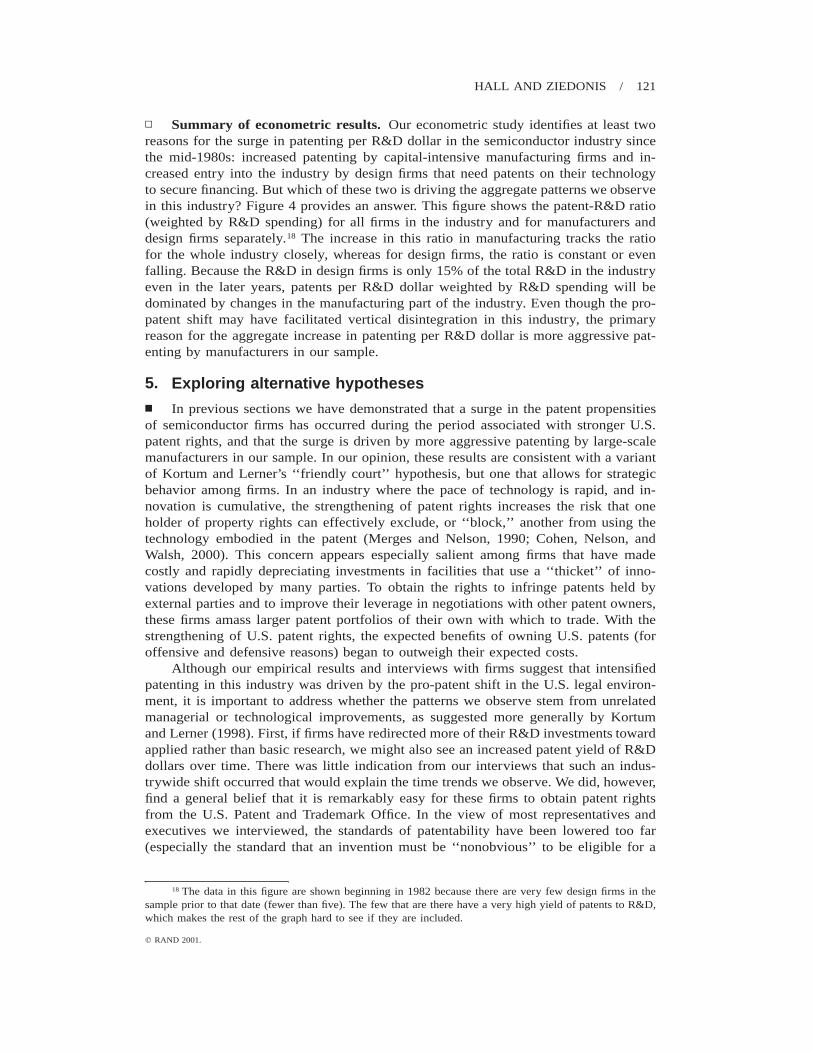
▫ Summary of econometric results. Our econometric study identifies at least tworeasons for the surge in patenting per R&D dollar in the semiconductor industry sincethe mid-1980s: increased patenting by capital-intensive manufacturing firms and in-creased entry into the industry by design firms that need patents on their technologyto secure financing. But which of these two is driving the aggregate patterns we observein this industry? Figure 4 provides an answer. This figure shows the patent-R&D ratio(weighted by R&D spending) for all firms in the industry and for manufacturers anddesign firms separately.18 The increase in this ratio in manufacturing tracks the ratiofor the whole industry closely, whereas for design firms, the ratio is constant or evenfalling. Because the R&D in design firms is only 15% of the total R&D in the industryeven in the later years, patents per R&D dollar weighted by R&D spending will bedominated by changes in the manufacturing part of the industry. Even though the pro-patent shift may have facilitated vertical disintegration in this industry, the primaryreason for the aggregate increase in patenting per R&D dollar is more aggressive pat-enting by manufacturers in our sample.
5. Exploring alternative hypotheses
n In previous sections we have demonstrated that a surge in the patent propensitiesof semiconductor firms has occurred during the period associated with stronger U.S.patent rights, and that the surge is driven by more aggressive patenting by large-scalemanufacturers in our sample. In our opinion, these results are consistent with a variantof Kortum and Lerner’s ‘‘friendly court’’ hypothesis, but one that allows for strategicbehavior among firms. In an industry where the pace of technology is rapid, and in-novation is cumulative, the strengthening of patent rights increases the risk that oneholder of property rights can effectively exclude, or ‘‘block,’’ another from using thetechnology embodied in the patent (Merges and Nelson, 1990; Cohen, Nelson, andWalsh, 2000). This concern appears especially salient among firms that have madecostly and rapidly depreciating investments in facilities that use a ‘‘thicket’’ of inno-vations developed by many parties. To obtain the rights to infringe patents held byexternal parties and to improve their leverage in negotiations with other patent owners,these firms amass larger patent portfolios of their own with which to trade. With thestrengthening of U.S. patent rights, the expected benefits of owning U.S. patents (foroffensive and defensive reasons) began to outweigh their expected costs.
Although our empirical results and interviews with firms suggest that intensifiedpatenting in this industry was driven by the pro-patent shift in the U.S. legal environ-ment, it is important to address whether the patterns we observe stem from unrelatedmanagerial or technological improvements, as suggested more generally by Kortumand Lerner (1998). First, if firms have redirected more of their R&D investments towardapplied rather than basic research, we might also see an increased patent yield of R&Ddollars over time. There was little indication from our interviews that such an indus-trywide shift occurred that would explain the time trends we observe. We did, however,find a general belief that it is remarkably easy for these firms to obtain patent rightsfrom the U.S. Patent and Trademark Office. In the view of most representatives andexecutives we interviewed, the standards of patentability have been lowered too far(especially the standard that an invention must be ‘‘nonobvious’’ to be eligible for a
18 The data in this figure are shown beginning in 1982 because there are very few design firms in thesample prior to that date (fewer than five). The few that are there have a very high yield of patents to R&D,which makes the rest of the graph hard to see if they are included.
122 / THE RAND JOURNAL OF ECONOMICS
q RAND 2001.
FIGURE 4
PATENTS PER MILLION R&D DOLLARS: SAMPLE FIRMS
patent award).19 Although the ease with which firms may obtain U.S. patents may haveincreased over time, there is little reason to believe that procedures at USPTO wouldfavor patenting in semiconductor-related technologies in ways that would explain thedisproportionate surge in patenting by firms in this industry.
A related explanation for the surge in patenting is that firms have improved theirability to manage the innovation process and that the ‘‘productivity of R&D’’ hastherefore improved. Put differently, R&D expenditures may have remained relativelystable while the patented ‘‘output’’ of that R&D has increased due to managerial ortechnological improvements in the innovation process that are unrelated to the changein U.S. patent policies. Through a process of elimination, Kortum and Lerner (1998)supported the view that these unrelated managerial improvements (not the ‘‘friendlycourt’’ or a shift toward applied research) underpinned the cross-industry increase inU.S. patenting.
Our interviews suggest a very different interpretation of this ‘‘unrelated R&Dproductivity’’ hypothesis, at least as it pertains to managerial improvements in thesemiconductor industry. The shift in patenting relative to R&D spending since the mid-1980s may indeed reflect important managerial changes, but primarily in how firmsmanage the R&D output, not necessarily the R&D input side of the innovation process.For example, several firms had overhauled their internal patent procedures during thepast 5–10 years by hiring more in-house patent attorneys, rewarding engineers withbonuses for patented inventions, expanding the involvement of patent attorneys in cor-poratewide activities (such as strategic alliances, licensing, and litigation decisions),and creating in-house ‘‘patent committees’’ to oversee and simplify the otherwise time-consuming process of writing, filing, and revising patent applications. As mentionedearlier, manufacturers appeared to be ‘‘harvesting’’ more of their latent inventions andexplicitly ‘‘ramping up’’ their patent filings in order to amass more sizeable patentportfolios. Although the increased sophistication of design tools may have aided many
19 Hunt (1999) examines this apparent lowering of ‘‘nonobviousness’’ standards in the United Statesduring the 1980s. The combined effect of (a) strengthening patent enforcement and (b) lowering patentabilityrequirements is an interesting topic for future research.
HALL AND ZIEDONIS / 123
q RAND 2001.
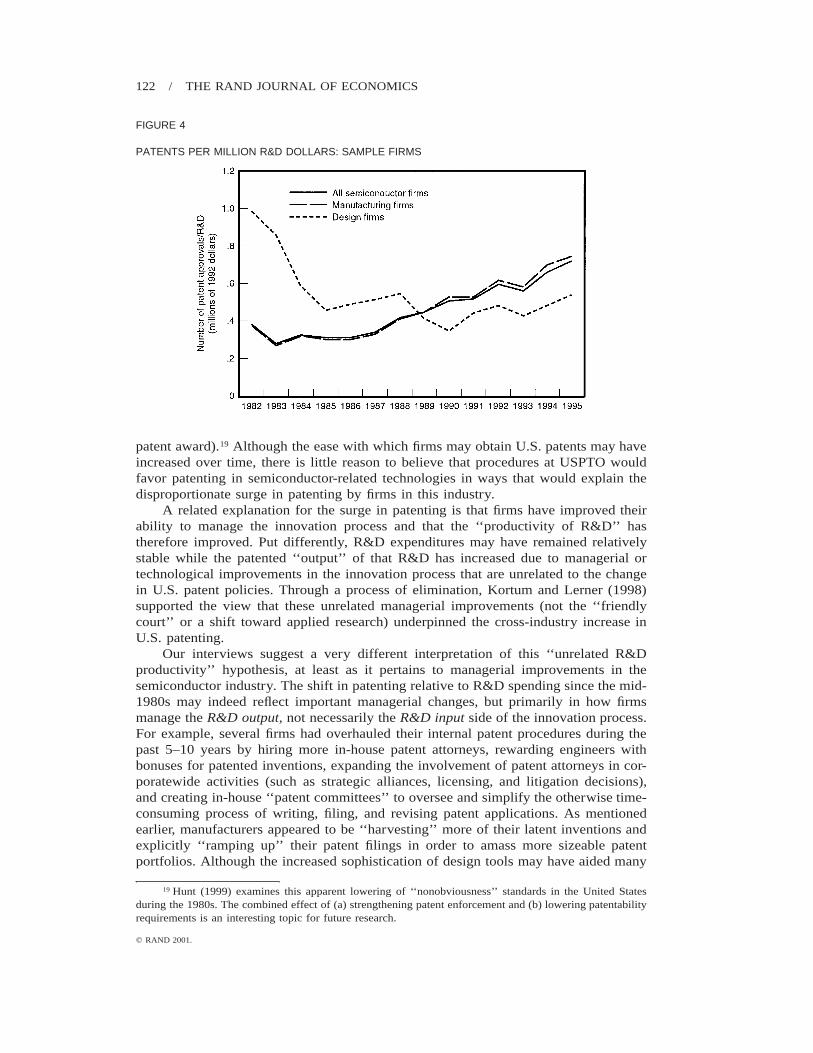
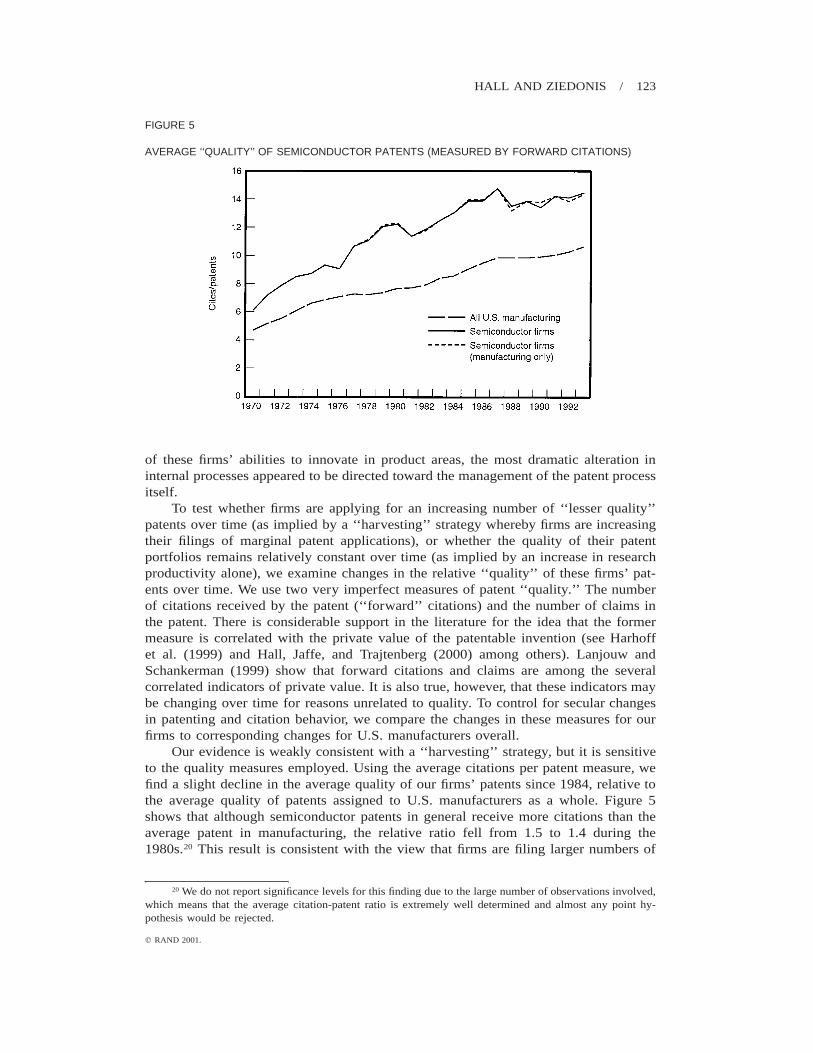
FIGURE 5
AVERAGE ‘‘QUALITY’’ OF SEMICONDUCTOR PATENTS (MEASURED BY FORWARD CITATIONS)
of these firms’ abilities to innovate in product areas, the most dramatic alteration ininternal processes appeared to be directed toward the management of the patent processitself.
To test whether firms are applying for an increasing number of ‘‘lesser quality’’patents over time (as implied by a ‘‘harvesting’’ strategy whereby firms are increasingtheir filings of marginal patent applications), or whether the quality of their patentportfolios remains relatively constant over time (as implied by an increase in researchproductivity alone), we examine changes in the relative ‘‘quality’’ of these firms’ pat-ents over time. We use two very imperfect measures of patent ‘‘quality.’’ The numberof citations received by the patent (‘‘forward’’ citations) and the number of claims inthe patent. There is considerable support in the literature for the idea that the formermeasure is correlated with the private value of the patentable invention (see Harhoffet al. (1999) and Hall, Jaffe, and Trajtenberg (2000) among others). Lanjouw andSchankerman (1999) show that forward citations and claims are among the severalcorrelated indicators of private value. It is also true, however, that these indicators maybe changing over time for reasons unrelated to quality. To control for secular changesin patenting and citation behavior, we compare the changes in these measures for ourfirms to corresponding changes for U.S. manufacturers overall.
Our evidence is weakly consistent with a ‘‘harvesting’’ strategy, but it is sensitiveto the quality measures employed. Using the average citations per patent measure, wefind a slight decline in the average quality of our firms’ patents since 1984, relative tothe average quality of patents assigned to U.S. manufacturers as a whole. Figure 5shows that although semiconductor patents in general receive more citations than theaverage patent in manufacturing, the relative ratio fell from 1.5 to 1.4 during the1980s.20 This result is consistent with the view that firms are filing larger numbers of
20 We do not report significance levels for this finding due to the large number of observations involved,which means that the average citation-patent ratio is extremely well determined and almost any point hy-pothesis would be rejected.
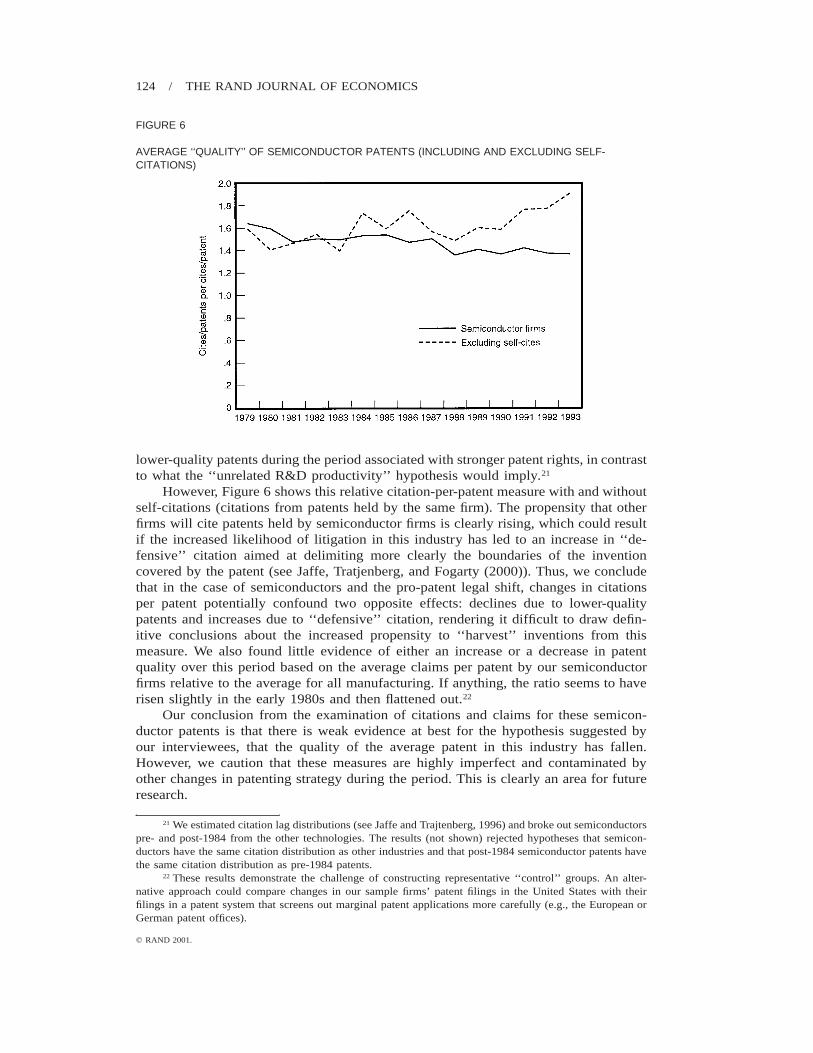
124 / THE RAND JOURNAL OF ECONOMICS
q RAND 2001.
FIGURE 6
AVERAGE ‘‘QUALITY’’ OF SEMICONDUCTOR PATENTS (INCLUDING AND EXCLUDING SELF-CITATIONS)
lower-quality patents during the period associated with stronger patent rights, in contrastto what the ‘‘unrelated R&D productivity’’ hypothesis would imply.21
However, Figure 6 shows this relative citation-per-patent measure with and withoutself-citations (citations from patents held by the same firm). The propensity that otherfirms will cite patents held by semiconductor firms is clearly rising, which could resultif the increased likelihood of litigation in this industry has led to an increase in ‘‘de-fensive’’ citation aimed at delimiting more clearly the boundaries of the inventioncovered by the patent (see Jaffe, Tratjenberg, and Fogarty (2000)). Thus, we concludethat in the case of semiconductors and the pro-patent legal shift, changes in citationsper patent potentially confound two opposite effects: declines due to lower-qualitypatents and increases due to ‘‘defensive’’ citation, rendering it difficult to draw defin-itive conclusions about the increased propensity to ‘‘harvest’’ inventions from thismeasure. We also found little evidence of either an increase or a decrease in patentquality over this period based on the average claims per patent by our semiconductorfirms relative to the average for all manufacturing. If anything, the ratio seems to haverisen slightly in the early 1980s and then flattened out.22
Our conclusion from the examination of citations and claims for these semicon-ductor patents is that there is weak evidence at best for the hypothesis suggested byour interviewees, that the quality of the average patent in this industry has fallen.However, we caution that these measures are highly imperfect and contaminated byother changes in patenting strategy during the period. This is clearly an area for futureresearch.
21 We estimated citation lag distributions (see Jaffe and Trajtenberg, 1996) and broke out semiconductorspre- and post-1984 from the other technologies. The results (not shown) rejected hypotheses that semicon-ductors have the same citation distribution as other industries and that post-1984 semiconductor patents havethe same citation distribution as pre-1984 patents.
22 These results demonstrate the challenge of constructing representative ‘‘control’’ groups. An alter-native approach could compare changes in our sample firms’ patent filings in the United States with theirfilings in a patent system that screens out marginal patent applications more carefully (e.g., the European orGerman patent offices).
HALL AND ZIEDONIS / 125
q RAND 2001.
6. Conclusion
n A patent is a legal right to exclude. In an industry where the pace of technologyis rapid and firms advance quickly (even simultaneously) upon innovations made byothers, firms may patent for strategic reasons even if they continue to rely on othermechanisms, such as lead time and superior manufacturing or design capabilities, torecoup investments in R&D. Especially for firms engaged in rapidly changing, cumu-lative technologies, building larger portfolios of their own ‘‘legal rights to exclude’’may reduce the holdup problem posed by external patent owners and enable firms tonegotiate access to external technologies on more favorable terms. But the importanceof patent rights and their use may vary among firms even within one industry overtime.
This article examined the patenting behavior of firms in one ‘‘cumulative inno-vation’’ setting, semiconductors, where the gap between the relative ineffectiveness ofpatents as a means to profit from innovation (as reported in surveys) and their increas-ing use is particularly striking. By combining insights from interviews with intellectualproperty managers and executives from semiconductor firms with quantitative analysesof the patenting behavior of 95 U.S. firms during 1979–1995, we identified two waysin which the pro-patent shift in the U.S. legal environment appears to be causally relatedto the otherwise perplexing surge in U.S. patenting rates, at least in the semiconductorindustry. First, stronger patent rights may have facilitated entry by specialized firmsand contributed to vertical disintegration in this industry (Merges, 1997; Arora andFosfuri, 1998). But these positive effects coincide with a process whereby firms amassvast patent portfolios simply as ‘‘bargaining chips,’’ leading to ‘‘patent portfolio races.’’In principle, such racing behavior is not an inevitable outcome of strengthening patentrights in cumulative technological areas. If patent rights were strictly awarded to in-ventors of ‘‘nonobvious,’’ ‘‘useful,’’ and ‘‘novel’’ inventions, then it should becomeincreasingly difficult to obtain a patent when a thicket of prior art exists, and the numberof successful patent applications should fall. This is not, however, what we observe inthis industry.
Our study highlights the multifaceted effects of strengthening patent rights on firmseven within one cumulative technological setting. It also leaves a number of importantquestions unresolved. What are the overall social welfare consequences associated withthe type of ‘‘patent portfolio races’’ that we observe in this industry? Does this behaviorsimply represent the outcome of a noncooperative strategic game and, therefore, animplicit ‘‘tax’’ on innovation? Or do these portfolios provide an important backdropfor exchanges of intellectual property and more tacit ‘‘know-how’’ that otherwise wouldnot take place? Under what conditions do the social costs associated with ‘‘patentportfolio races’’ begin to outweigh other associated benefits? The results of our studyunderscore the importance of continued theoretical and empirical research on the effectsof strong patent rights in technological settings where innovation is inherently cumu-lative but firms also rely on mechanisms other than patents to appropriate returns toR&D.
Appendix
n Table A1 provides summary statistics for the overall sample of 110 U.S. semiconductor firms and thesample of 95 firms used in the regressions.
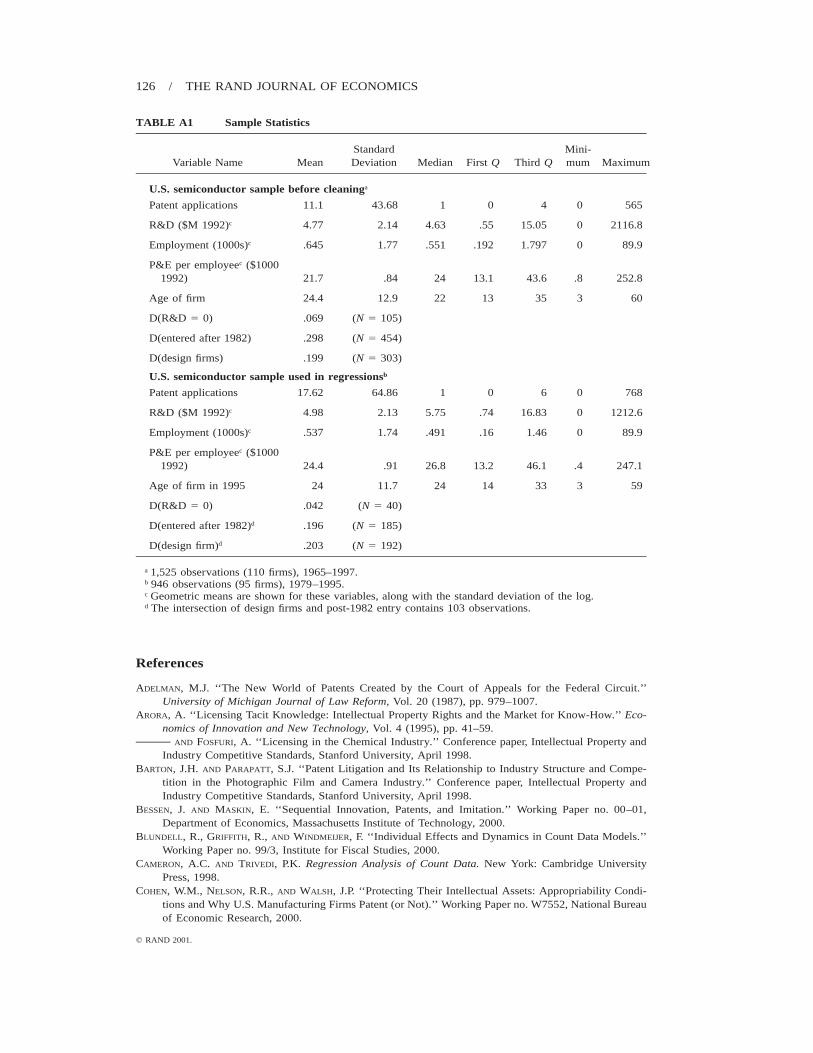
126 / THE RAND JOURNAL OF ECONOMICS
q RAND 2001.
TABLE A1 Sample Statistics
Variable Name MeanStandardDeviation Median First Q Third Q
Mini-mum Maximum
U.S. semiconductor sample before cleaninga
Patent applications 11.1 43.68 1 0 4 0 565
R&D ($M 1992)c 4.77 2.14 4.63 .55 15.05 0 2116.8
Employment (1000s)c .645 1.77 .551 .192 1.797 0 89.9
P&E per employeec ($10001992) 21.7 .84 24 13.1 43.6 .8 252.8
Age of firm 24.4 12.9 22 13 35 3 60
D(R&D 5 0) .069 (N 5 105)
D(entered after 1982) .298 (N 5 454)
D(design firms) .199 (N 5 303)
U.S. semiconductor sample used in regressionsb
Patent applications 17.62 64.86 1 0 6 0 768
R&D ($M 1992)c 4.98 2.13 5.75 .74 16.83 0 1212.6
Employment (1000s)c .537 1.74 .491 .16 1.46 0 89.9
P&E per employeec ($10001992) 24.4 .91 26.8 13.2 46.1 .4 247.1
Age of firm in 1995 24 11.7 24 14 33 3 59
D(R&D 5 0) .042 (N 5 40)
D(entered after 1982)d .196 (N 5 185)
D(design firm)d .203 (N 5 192)
a 1,525 observations (110 firms), 1965–1997.b 946 observations (95 firms), 1979–1995.c Geometric means are shown for these variables, along with the standard deviation of the log.d The intersection of design firms and post-1982 entry contains 103 observations.
References
ADELMAN, M.J. ‘‘The New World of Patents Created by the Court of Appeals for the Federal Circuit.’’University of Michigan Journal of Law Reform, Vol. 20 (1987), pp. 979–1007.
ARORA, A. ‘‘Licensing Tacit Knowledge: Intellectual Property Rights and the Market for Know-How.’’ Eco-nomics of Innovation and New Technology, Vol. 4 (1995), pp. 41–59.
AND FOSFURI, A. ‘‘Licensing in the Chemical Industry.’’ Conference paper, Intellectual Property andIndustry Competitive Standards, Stanford University, April 1998.
BARTON, J.H. AND PARAPATT, S.J. ‘‘Patent Litigation and Its Relationship to Industry Structure and Compe-tition in the Photographic Film and Camera Industry.’’ Conference paper, Intellectual Property andIndustry Competitive Standards, Stanford University, April 1998.
BESSEN, J. AND MASKIN, E. ‘‘Sequential Innovation, Patents, and Imitation.’’ Working Paper no. 00–01,Department of Economics, Massachusetts Institute of Technology, 2000.
BLUNDELL, R., GRIFFITH, R., AND WINDMEIJER, F. ‘‘Individual Effects and Dynamics in Count Data Models.’’Working Paper no. 99/3, Institute for Fiscal Studies, 2000.
CAMERON, A.C. AND TRIVEDI, P.K. Regression Analysis of Count Data. New York: Cambridge UniversityPress, 1998.
COHEN, W.M., NELSON, R.R., AND WALSH, J.P. ‘‘Protecting Their Intellectual Assets: Appropriability Condi-tions and Why U.S. Manufacturing Firms Patent (or Not).’’ Working Paper no. W7552, National Bureauof Economic Research, 2000.
HALL AND ZIEDONIS / 127
q RAND 2001.
GOURIEROUX, C., MONTFORT, A., AND TROGNON, A. ‘‘Pseudo Maximum Likelihood Methods: Applications toPoisson Models.’’ Econometrica, Vol. 52 (1984), pp. 701–720.
GREEN, J.R. AND SCOTCHMER, S. ‘‘On the Division of Profit in Sequential Innovation.’’ RAND Journal ofEconomics, Vol. 26 (1995), pp. 20–33.
GRINDLEY, P.C. AND TEECE, D.J. ‘‘Managing Intellectual Capital: Licensing and Cross-Licensing in Semicon-ductors and Electronics.’’ California Management Review, Vol. 39 (1997), pp. 1–34.
HALL, B.H. AND CUMMINS, C. TSP Reference Manual: Version 4.5. Palo Alto, Calif.: TSP International, 1999., GRILICHES, Z., AND HAUSMAN, J.A. ‘‘Patents and R and D: Is There a Lag?’’ International Economic
Review, Vol. 27 (1986), pp. 265–283., JAFFE, A.B., AND TRAJTENBERG, M.J. ‘‘Market Value and Patent Citations: A First Look.’’ Working
Paper no. W7741, National Bureau of Economic Research, 2000.HAM, R.M., LINDEN, G.L., AND APPLEYARD, M.M. ‘‘The Evolving Role of Semiconductor Consortia in the
United States and Japan.’’ California Management Review, Vol. 41 (1998), pp. 137–163.HARHOFF, D., NARIN, F., SCHERER, F.M., AND VOPEL, K. ‘‘Citation Frequency and the Value of Patented
Inventions.’’ Review of Economics and Statistics, Vol. 81 (1999), pp. 511–515.HAUSMAN, J.A., HALL, B.H., AND GRILICHES, Z. ‘‘Econometric Models for Count Data with an Application
to the Patents-R&D Relationship.’’ Econometrica, Vol. 52 (1984), pp. 909–938.HEADLEY, W. ‘‘Rapporteur’s Report: The Stanford Workshop on Intellectual Property and Industry Compet-
itive Standards.’’ Stanford Law and Technology Policy Center, Stanford University Law School, 1998.HUNT, R.M. ‘‘Nonobviousness and the Incentive to Innovate: An Economic Analysis of Intellectual Property
Reform.’’ Working Paper no. 99-3, Economic Research Division, Federal Reserve Bank of Philadelphia,1999.
INTEGRATED CIRCUIT ENGINEERING CORPORATION (ICE). Cost Effective IC Manufacturing 1995. Scottsdale.Ariz.: Integrated Circuit Engineering Corporation, 1995.
. Status: A Report on the Integrated Circuit Industry. Scottsdale, Ariz.: Integrated Circuit EngineeringCorporation, 1976–1998.
JAFFE, A.B. ‘‘The U.S. Patent System in Transition: Policy Innovation and the Innovation Process.’’ ResearchPolicy, Vol. 29 (2000), pp. 531–557.
AND TRAJTENBERG, M. ‘‘Flows of Knowledge from Universities and Federal Labs: Modeling the Flowof Patent Citations over Time and Across Institutional and Geographic Boundaries.’’ Proceedings ofthe National Academy of Sciences, Vol. 93 (1996), pp. 12671–12677.
, , AND FOGARTY, M.S. ‘‘The Meaning of Patent Citations: Report of the NBER/Case WesternReserve Survey of Patentees.’’ Working Paper no. W7631, National Bureau of Economic Research,2000.
KORTUM, S. AND LERNER, J. ‘‘Stronger Protection or Technological Revolution: What Is Behind the RecentSurge in Patenting?’’ Carnegie-Rochester Conference Series on Public Policy, Vol. 48 (1998), pp. 247–304.
LANJOUW, J.O. AND LERNER, J. ‘‘Preliminary Injunctive Relief: Theory and Evidence from Patent Litigation.’’Working Paper no. W5689, National Bureau of Economic Research, 1996.
AND SCHANKERMAN, M. ‘‘The Quality of Ideas: Measuring Innovation with Multiple Indicators.’’Working Paper no. W7345, National Bureau of Economic Research, 1999.
LERNER, J. ‘‘Patenting in the Shadow of Competitors.’’ Journal of Law and Economics, Vol. 38 (1995), pp.463–495.
LEVIN, R.C. ‘‘The Semiconductor Industry.’’ In R.R. Nelson, ed., Government and Technical Progress: ACross-Industry Analysis. New York: Pergamon Press, 1982.
, KLEVORICK, A.K., NELSON, R.R., AND WINTER, S.G. ‘‘Appropriating the Returns from IndustrialResearch and Development.’’ Brookings Papers on Economic Activity, Vol. 3 (1987), pp. 783–820.
MACHER, J., MOWERY, D.C., AND HODGES, D. ‘‘Reversal of Fortune? The Recovery of the U.S. SemiconductorIndustry.’’ California Management Review, Vol. 41 (1998), pp. 107–136.
MAZZOLENI, R. AND NELSON, R.R. ‘‘Economic Theories About the Benefits and Costs of Patents.’’ Journalof Economic Issues, Vol. 32 (1998), pp. 1031–1052.
MERGES, R.P. Patent Law and Policy: Cases and Materials, 2d ed. Charlottesville, Va.: The Michie Company,1997.
. ‘‘Property Rights, Transactions, and the Value of Intangible Assets.’’ Mimeo, Boalt School of Law,University of California, Berkeley, 1998.
AND NELSON, R.R. ‘‘On the Complex Economics of Patent Scope.’’ Columbia Law Review. Vol. 90(1990), pp. 839–916.
MONTALVO, J.G. ‘‘GMM Estimation of Count-Panel-Data Models with Fixed Effects and PredeterminedInstruments.’’ Journal of Business and Economic Statistics, Vol. 15 (1997), pp. 82–89.
128 / THE RAND JOURNAL OF ECONOMICS
q RAND 2001.
NIES, H.W. ‘‘Ten Years of Patent Law Development Under the U.S. Court of Appeals for the Federal Circuit.’’IIC, Vol. 24 (1993), pp. 797–803.
O’DONOGHUE, T. ‘‘A Patentability Requirement for Sequential Innovation.’’ RAND Journal of Economics,Vol. 29 (1998), pp. 654–679.
, SCOTCHMER, S., AND THISSE, J.-F. ‘‘Patent Breadth, Patent Life, and the Pace of Technological Pro-gress.’’ Journal of Economics and Management Strategy, Vol. 7 (1998), pp. 1–32.
PAKES, A. ‘‘Protecting Early Innovators: Should Second-Generation Products Be Patentable?’’ RAND Journalof Economics, Vol. 27 (1996), pp. 322–331.
AND GRILICHES, Z. ‘‘Patents and R&D at the Firm Level: A First Look.’’ Economics Letters, Vol. 5(1980), pp. 377–381.
AND SCOTCHMER, S. ‘‘Standing on the Shoulders of Giants: Cumulative Research and the PatentLaw.’’ Journal of Economic Perspectives, Vol. 5 (1991), pp. 29–41.
SORENSEN, J. AND STUART, T. ‘‘Aging, Obsolescence, and Organizational Innovation.’’ Administrative ScienceQuarterly, Vol. 45 (2000), pp. 81–112.
TAYLOR, C.T. AND SILBERTSON, Z.A. The Economic Impact of the Patent System: A Study of the BritishExperience. New York: Cambridge University Press, 1973.
TEECE, D.J. ‘‘Profiting from Technological Innovation.’’ Research Policy, Vol. 15 (1986), pp. 285–305.TILTON, J.E. International Diffusion of Technology: The Case of Semiconductors. Washington, D.C.: Brook-
ings Institution, 1971.TRAJTENBERG, M.J., JAFFE, A., AND HALL, B.H. The NBER/Case Western Patents Data File: A Guided Tour.
Cambridge, Mass.: National Bureau of Economic Research, 2000.U.S. PATENT AND TRADEMARK Office (USPTO). Technology Profile Report: Semiconductor Devices and
Manufacture, 1/1969–12/1994. Washington, D.C.: U.S. Department of Commerce, 1995.VON HIPPEL, E. The Sources of Innovation. Oxford: Oxford University Press, 1988.ZIEDONIS, R.H. ‘‘Patent Protection and Firm Strategy in the Semiconductor Industry.’’ Ph.D. dissertation,
Walter A. Haas School of Business, University of California, Berkeley, 2000.