Embed Size (px)
Citation preview
Int.J.Curr.Res.Aca.Rev.2015; 3(7):327-344
327
Introduction
Retinopathy is an eye disorder that is very
personally related to diabetes.DABETIC
retinopathy is a most important cause of
blindness affecting 95% of diabetics
surrounded by 15 years of onset of whom
2% may become blind and 10% suffer harsh
visual impairment. Annual screening is
suggested to identify progression allowing
untimely treatment, which may prevent up
to 90% of belongings of blindness.Grading
standards for screening include background
and sight threatening retinopathy, the latter
being predominantly important to detect
reliably. The full name is Diabetic
Retinopathy, and can guide to blindness
because it causes the retina to turn into
damaged. Retinopathy is an eye disorder
that is very closely correlated to diabetes.
The full name is Diabetic Retinopathy, and
can lead to blindness because it causes the
A B S T R A C T
This is the research paper, which is foundation on the Retinopathy.
Retinopathy is an eye disorder that is very familiarly related to diabetes. The occupied name is Diabetic Retinopathy, and can conduct to blindness because
it causes the retina to twist out to be damaged. When blood sugar is too
elevated damage can be throughout to the blood vessels, together with those in eyes. As rapidly this happens new blood vessels may assemble up over the
retina causing lesion. In this paper we used a different technique for the
appreciation of the blood vessel which is a Genetic algorithm thresholding.
It‘s a very unique method in the course of which we can easily become conscious of the blood vessel from the retina. The method is weigh up on the
publicly presented DRIVE,STARE and CHAISE_DBI. Initially apply Pre
Filtering method, afterwards we dig out green part from RGB image subsequently DCT Filtering be appropriate the Genetic thresholding with
block wise gridding at that moment the result will be compare with the
different parameter like SN (Sensitivity), SP (Specificity), Acc (Accuracy), PPV (Positive predictive value), FDR (False data recorder)
KEYWORDS
Genetic algorithm,
Vessel detection,
Segmentation, DCT, Optimization,
Morphological
operation, Fundus
Image
A Novel Approach for Retina vessel detection using Genetic Algorithm
Thresholding
Nimerbir Kaur* and Amandeep Kaur
Global institute of Management and Emerging Technology, India
*Corresponding author email id: [email protected]
International Journal of Current Research and Academic Review
ISSN: 2347-3215 Volume 3 Number 7 (July-2015) pp. 327-344
www.ijcrar.com
Int.J.Curr.Res.Aca.Rev.2015; 3(7):327-344
328
retina to be converted into damaged. When
your blood sugar is too soaring damage can
be done to the blood vessels, as well as those
in your eyes. Now days, diabetic retinopathy
is a key cause for the blindness in elder age
people. Patients who are suffering from
diabetes are more probable to have eye
disease but the main hazard to eye sight is
effect on retina. To detect the diabetic
retinopathy in diabetic patients, retinal
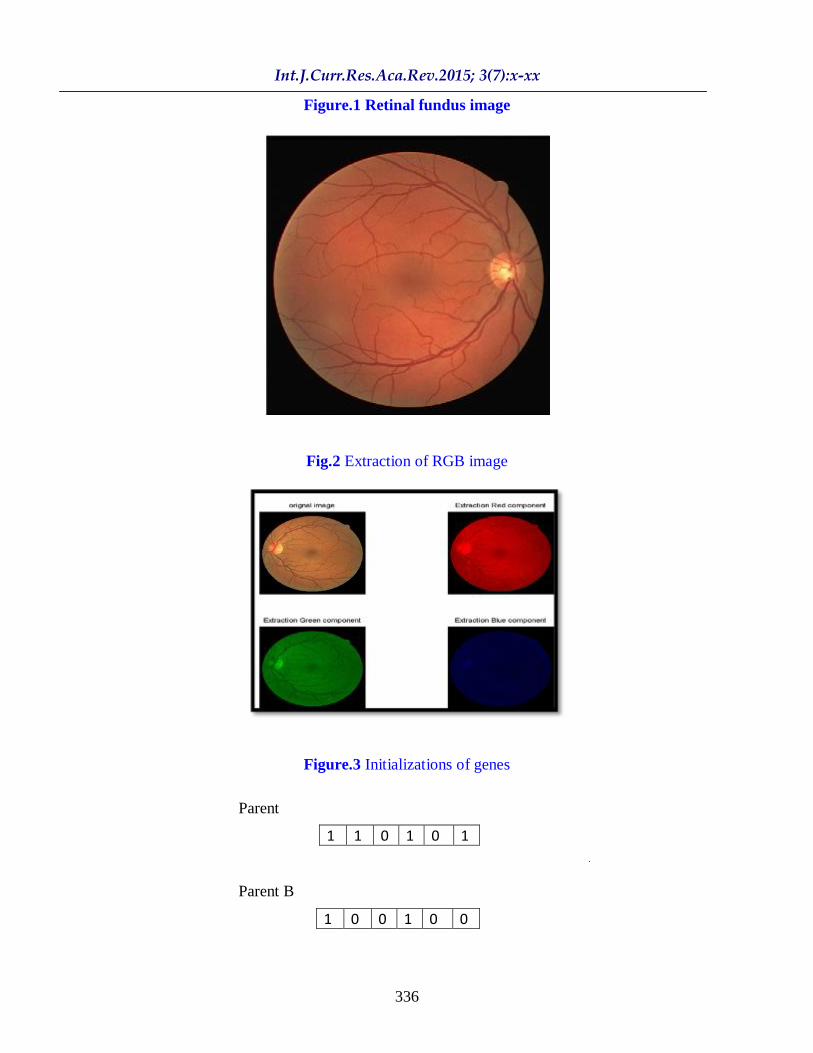
images have to be analyzed. The
representative Fundus Image looks like in
the Figure 1. The vivid optic disc and
vascular network can clearly seen in this
image initially we will remove the
background noise by from the retinal fundus
image by using pre filtering performance.
subsequent to using pre filtering technique
and extract the RGB image from the second
image, and we force work on the only green
image for the reason that we can easily
become aware of the vessel from the green
image.then after this one we will apply the
DCT filtering technique to remove the noise
and the light effect from the green image.
Then at the after everything else we will
apply the Genetic algorithm thresholding
and after compare it with the original image
we will distinguish the different parameter,
and shown it over the ROC curve with
plotting.In accumulation we will evaluate
this method with the other techniques and
analyses by applying them with more image
taken from DRIVE, STARE and CHAISE
database.
Related method
The eye is a window to the retinal vascular
system which is exclusively easily reached
for the non-invasive, in vivo study of a
incessant vascular in humans. The detection
and measurement of blood vessels can be
used to compute the harshness of disease, as
part of the process of automated judgment of
disease or in the evaluation of the effect of
therapy. Retinal blood vessels have been
shown to alter in diameter, branching angles
or tortuosity, as a result of a disease, such as
hypertension (6), diabetes mellitus or
retinopathy of prematurity (ROP) (7). in
addition, retinal arteriolar or venular
changes expect development of hypertension
(6,8), new inception diabetes (6), sequence
to diabetic retinopathy (9) and development
of diabetic renal disease (10). Thus a
dependable method of vessel segmentation
would be valuable for the early discovery
and characterization of morphological
changes.
A first approximation to the segmentation of
retinal blood vessel by means of this
approach was previously presented (11),
where segmentation method was tested on a
small image section without any
corroboration. An extension of this work is
presented here and the method is now
knowledgeable on two local databases and
two public databases of absolute manually
labelled images (12,13). We evaluate our
segmentation using the public databases that
contain also used by other authors for the
same reason (13,14). confirmation of
segmented vessel diameters and branching
angles capacity are also made: between red-
free against shine in images and between our
algorithm and one of the public databases.
Proposed method
More vessels are nearby in the green part of
RGB image of retina so we too obtainable to
implement our algorithm with green
extraction of RGB image. We are obtainable
to implement Genetic Algorithm with
multiple thresholding with block wise
gridding to get enhanced vessels output.
Results will be taken with the comparison of
ground truth of the image with output of the
algorithm and evaluate the parameter. It‘s a
very unique method through which we can
Int.J.Curr.Res.Aca.Rev.2015; 3(7):327-344
329
effortlessly detect the blood vessel from the
retina.The method is evaluate on the
publicly accessible DRIVE,STARE and
CHAISE_DBI
Materials and Methods
Pre Filtering Technique
Pre filtering is a technique which is used for
removing the background noise from the
original image. first of all we will remove
the background noise by from the retinal
fundus image by using pre filtering
technique.
Extraction of RGB Image
We all well know that is every images have
primary colour i.e. Red, Blue and Green.
Extraction is way to extract these all colour
from the image. Extraction is the foremost
part of Retinal images. The major work of
the Retinopathy which is absolutely based
upon blood vessel detection, the detection of
blood vessel mostly done on the green part
from the RGB colour. If we pull out the
green part from the original image the vessel
shown very obviously than the other part of
the RGB colour. It‘s clearly we can see in
the Fig 2 readily available is mining of
RGB images but vessel easily seen in the
green part,So we always do work of
Retinopathy on the green part of the retinal
image(10)
Apply DCT Filtering on the image
at the outset we have know about DCT
Filtering, it‘s a course of action through
which we can remove the Noise and the
lighting effect from the image Digital
images are often dishonoured by noise, due
to the deficiency of the purchase system or
the conditions during the purchase. Noise
decreases the perceptual quality by masking
considerable information, and also degrades
performance of any dealing out applied over
the acquired image. Hence, image
profiteering is a common process used in
order to improve analysis and interpretation
of remote sensing, broadcast transmission,
optical scanning, and other visualization
data. Till now a huge number of different
image filtering techniques have been
designed including nonlinear non adaptive
and adaptive filters, transform-based
methods techniques based on self-
determining component analysis, and
primary component analysis (PCA),and so
forth. These techniques have dissimilar
compensation and drawbacks thoroughly
discussed in,and other references. The
request areas and conditions for which the
use of these filters can be the most helpful
and expedient depend on the filter
properties, noise statistical quality, and the
priority of requirements. For effective
filtering, it is attractive to considerably
suppress noise in homogeneous (smooth)
regions and to preserve edges, details, and
texture at the similar time. Acceptable
computational cost is the most important
condition that can put a ceiling on a practical
applicability of some denoising techniques.
From the position of noise control,
protection of edges, details and texture, and
time competence requirements, quite good
usefulness has been established by nearby
adaptive methods.The latest modifications
of locally adaptive filters take account of
both typical nonlinear scanning window
filters (employing order statistics) and
transform-based filters, in particular, filters
based on discrete cosine transform (DCT).
Genetic Algorithm
GA is one of the helpful techniques in
Artificial Intelligence which is based on the
natural evolution to resolve look for and
optimization difficulty. GA is a
Int.J.Curr.Res.Aca.Rev.2015; 3(7):327-344
330
straightforward method yet valuable in
finding a sensible solution to a complex
setback. GA is selected based on its
computational effectiveness with less
mathematical calculation and the capabilities
of management large search space. An
important characteristic of genetic algorithm
is the coding of variables that describes the
trouble. The most common coding technique
is to transform the variables to a binary
string or vector. This initial population
formulation development is critical. This
action is also recognized as encoding
process. Genetic Algorithms (GA) are
stochastic search algorithms that have access
to some concepts from nature. GA maintains
a population pool of candidate solutions
called strings otherwise chromosomes.
related with each chromosome is a fitness
value which is resolute by a user denied
function, called the fitness function. The
function proceeds a magnitude that is
proportional to the candidate solution's
properly and/or optimality. At the start of
the algorithm, an initial population is
generate. Initial members of the population
may be randomly generated, or generated
according to a little rules. The reproduction
operator selects chromosomes from the
population to be parents for a innovative
chromosome and enters them into the
mating pool. Selection of a chromosome for
parenthood can series from a totally random
method to one that is base by the
chromosome's Fitness. The cross-over
operative oversees the mating practice of
two chromosomes. Two parent
chromosomes are certain from the mating
pool randomly and the cross-over rate,
which is a real quantity between zero and
one, determines the probability of produce a
new chromosome from the parents. If the
mating was perform, a child chromosome is
formed which inherits complementing
genetic material from its parents. The cross-
over operative decides. Genetic algorithms
form an effective solution for optimization
problems (19) and they can be well thought-
out as probabilistic search algorithms (20).
A GA will classically have five parts: (1) a
representation of a guess called a
chromosome, (2) a fitness function, (3) a
selection function and (4) a crossover
operator and a mutation operator. A
chromosome can be a binary string or a
more complicated data structure. The early
pool of chromosomes can be randomly
produced or manually shaped. The fitness
function measures the suitability of a
chromosome to meet a particular
Objective: The selection function decides
which chromosomes will participate in the
evolution stage of the genetic algorithm
complete up by the crossover and mutation
operators. The crossover operator exchanges
genes from two chromosomes and create
two novel chromosomes. The mutation
operator changes a gene in a chromosome
and creates one new chromosome. Pseudo
Code For Genetic algorithm
For i=1 to r
For j=1 to C
Cij =I (i: i+2, j: j+2)
OV = GA (Cij) j
1, if OV1 >Cij<OV2
I Logical = 0, Otherwise
End for
Where r & c are the dimension of image.
OV represent the optimal value for GA.
I Logical is logical image of mask.
Cij is the ith
row & jth column of mask.
Int.J.Curr.Res.Aca.Rev.2015; 3(7):327-344
331
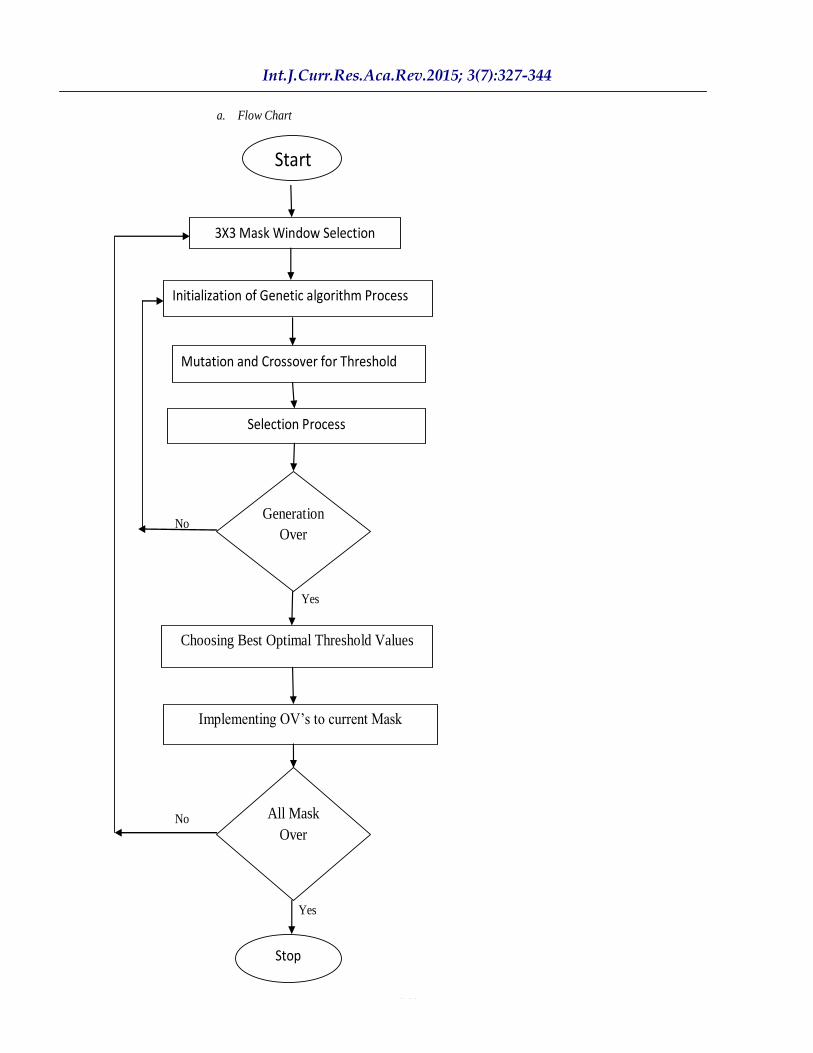
a. Flow Chart
No
Yes
No
Yes
Yes
Start
3X3 Mask Window Selection
Initialization of Genetic algorithm Process
Selection Process
Generation
Over
Choosing Best Optimal Threshold Values
Implementing OV‘s to current Mask
All Mask
Over
Stop
Mutation and Crossover for Threshold
Int.J.Curr.Res.Aca.Rev.2015; 3(7):x-xx
332
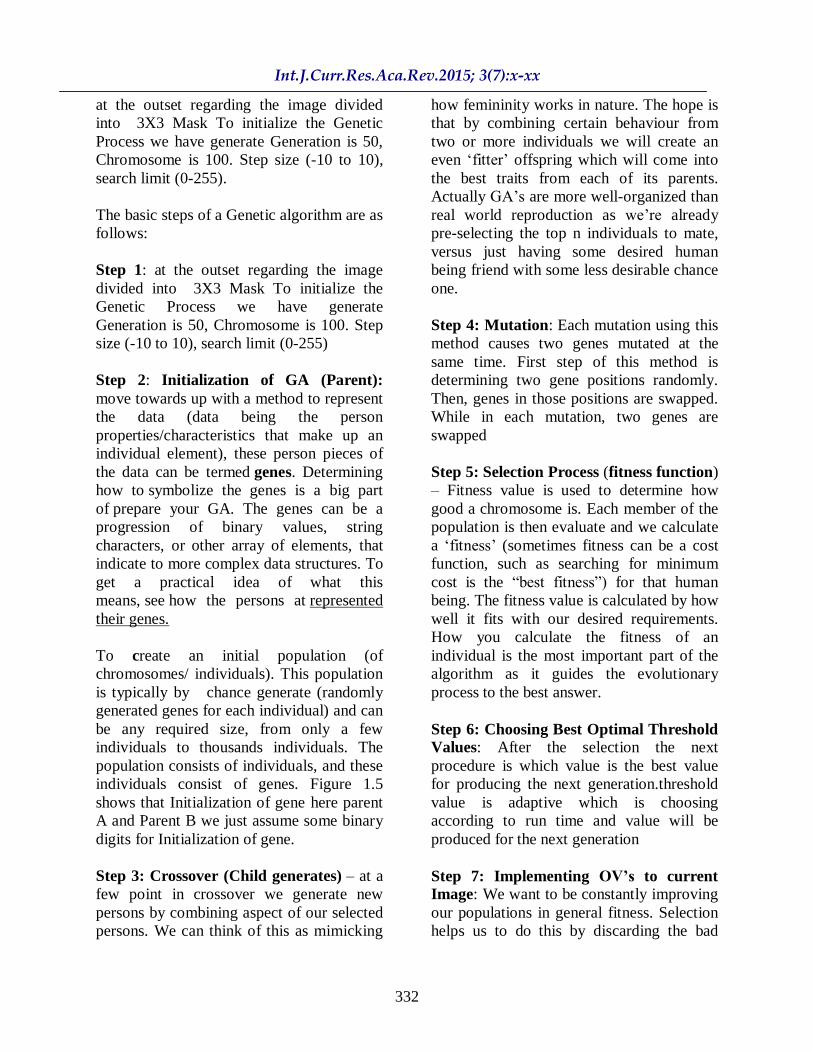
at the outset regarding the image divided
into 3X3 Mask To initialize the Genetic
Process we have generate Generation is 50,
Chromosome is 100. Step size (-10 to 10),
search limit (0-255).
The basic steps of a Genetic algorithm are as
follows:
Step 1: at the outset regarding the image
divided into 3X3 Mask To initialize the
Genetic Process we have generate
Generation is 50, Chromosome is 100. Step
size (-10 to 10), search limit (0-255)
Step 2: Initialization of GA (Parent):
move towards up with a method to represent
the data (data being the person
properties/characteristics that make up an
individual element), these person pieces of
the data can be termed genes. Determining
how to symbolize the genes is a big part
of prepare your GA. The genes can be a
progression of binary values, string
characters, or other array of elements, that
indicate to more complex data structures. To
get a practical idea of what this
means, see how the persons at represented
their genes.
To create an initial population (of
chromosomes/ individuals). This population
is typically by chance generate (randomly
generated genes for each individual) and can
be any required size, from only a few
individuals to thousands individuals. The
population consists of individuals, and these
individuals consist of genes. Figure 1.5
shows that Initialization of gene here parent
A and Parent B we just assume some binary
digits for Initialization of gene.
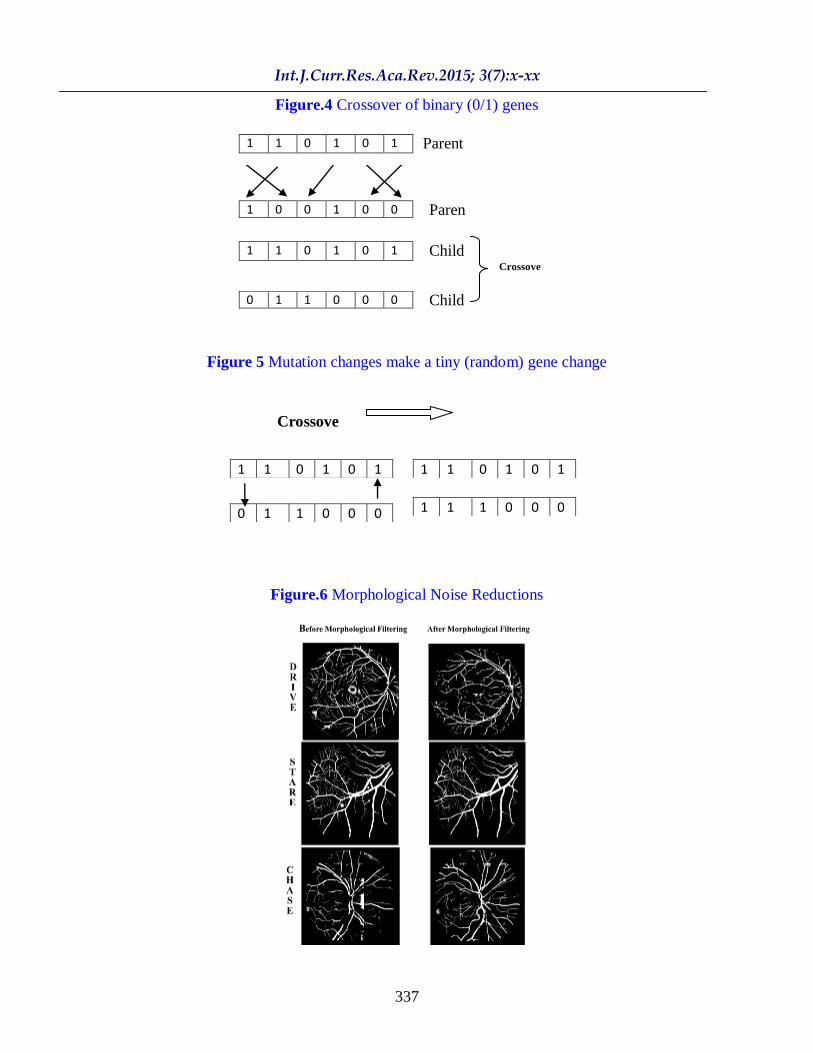
Step 3: Crossover (Child generates) – at a
few point in crossover we generate new
persons by combining aspect of our selected
persons. We can think of this as mimicking
how femininity works in nature. The hope is
that by combining certain behaviour from
two or more individuals we will create an
even ‗fitter‘ offspring which will come into
the best traits from each of its parents.
Actually GA‘s are more well-organized than
real world reproduction as we‘re already
pre-selecting the top n individuals to mate,
versus just having some desired human
being friend with some less desirable chance
one.
Step 4: Mutation: Each mutation using this
method causes two genes mutated at the
same time. First step of this method is
determining two gene positions randomly.
Then, genes in those positions are swapped.
While in each mutation, two genes are
swapped
Step 5: Selection Process (fitness function)
– Fitness value is used to determine how
good a chromosome is. Each member of the
population is then evaluate and we calculate
a ‗fitness‘ (sometimes fitness can be a cost
function, such as searching for minimum
cost is the ―best fitness‖) for that human
being. The fitness value is calculated by how
well it fits with our desired requirements.
How you calculate the fitness of an
individual is the most important part of the
algorithm as it guides the evolutionary
process to the best answer.
Step 6: Choosing Best Optimal Threshold
Values: After the selection the next
procedure is which value is the best value
for producing the next generation.threshold
value is adaptive which is choosing
according to run time and value will be
produced for the next generation
Step 7: Implementing OV’s to current
Image: We want to be constantly improving
our populations in general fitness. Selection
helps us to do this by discarding the bad
Int.J.Curr.Res.Aca.Rev.2015; 3(7):x-xx
333
designs and only maintenance the best
individuals in the population. There are a
few dissimilar selection methods but the
basic idea is the same, make it more
probable that fitter individuals will be
selected for our next generation and this
implementation will be going away for
whole images i.e. mask and will find the
accuracy which wills the best one.
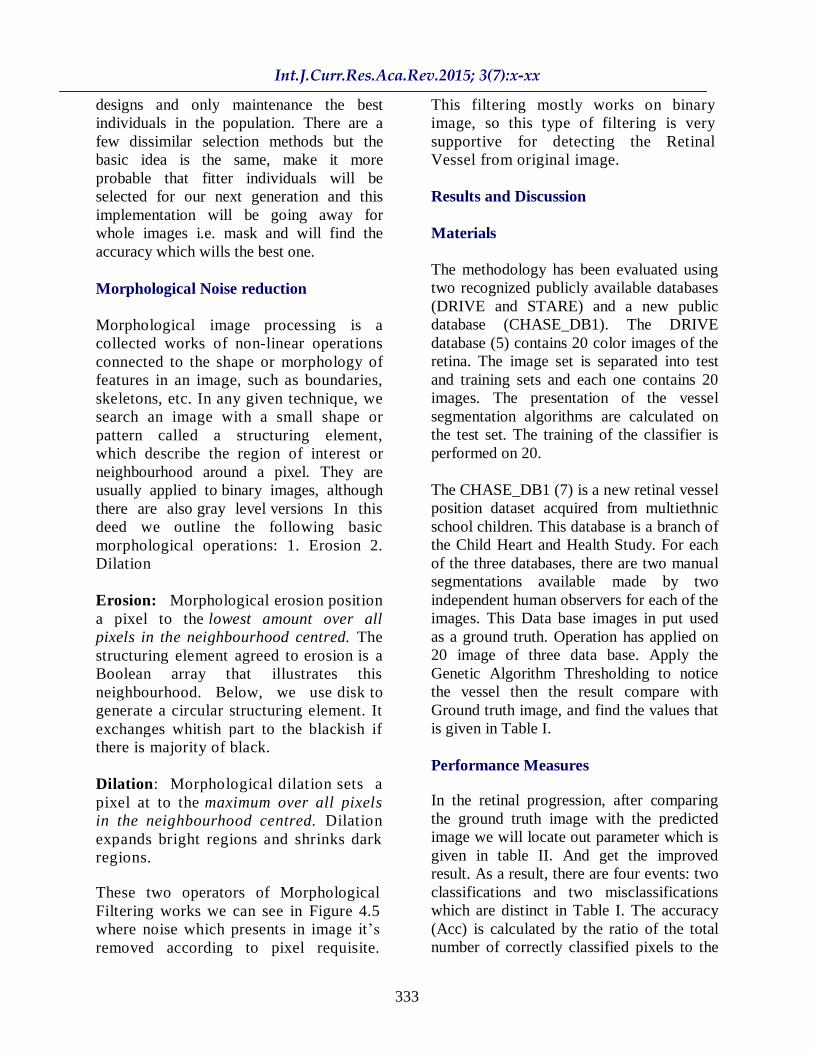
Morphological Noise reduction
Morphological image processing is a
collected works of non-linear operations
connected to the shape or morphology of
features in an image, such as boundaries,
skeletons, etc. In any given technique, we
search an image with a small shape or
pattern called a structuring element,
which describe the region of interest or
neighbourhood around a pixel. They are
usually applied to binary images, although
there are also gray level versions In this
deed we outline the following basic
morphological operations: 1. Erosion 2.
Dilation
Erosion: Morphological erosion position
a pixel to the lowest amount over all
pixels in the neighbourhood centred. The
structuring element agreed to erosion is a
Boolean array that illustrates this
neighbourhood. Below, we use disk to
generate a circular structuring element. It
exchanges whitish part to the blackish if
there is majority of black.
Dilation: Morphological dilation sets a
pixel at to the maximum over all pixels
in the neighbourhood centred. Dilation
expands bright regions and shrinks dark
regions.
These two operators of Morphological
Filtering works we can see in Figure 4.5
where noise which presents in image it‘s
removed according to pixel requisite.
This filtering mostly works on binary
image, so this type of filtering is very
supportive for detecting the Retinal
Vessel from original image.
Results and Discussion
Materials
The methodology has been evaluated using
two recognized publicly available databases
(DRIVE and STARE) and a new public
database (CHASE_DB1). The DRIVE
database (5) contains 20 color images of the
retina. The image set is separated into test
and training sets and each one contains 20
images. The presentation of the vessel
segmentation algorithms are calculated on
the test set. The training of the classifier is
performed on 20.
The CHASE_DB1 (7) is a new retinal vessel
position dataset acquired from multiethnic
school children. This database is a branch of
the Child Heart and Health Study. For each
of the three databases, there are two manual
segmentations available made by two
independent human observers for each of the
images. This Data base images in put used
as a ground truth. Operation has applied on
20 image of three data base. Apply the
Genetic Algorithm Thresholding to notice
the vessel then the result compare with
Ground truth image, and find the values that
is given in Table I.
Performance Measures
In the retinal progression, after comparing
the ground truth image with the predicted
image we will locate out parameter which is
given in table II. And get the improved
result. As a result, there are four events: two
classifications and two misclassifications
which are distinct in Table I. The accuracy
(Acc) is calculated by the ratio of the total
number of correctly classified pixels to the
Int.J.Curr.Res.Aca.Rev.2015; 3(7):x-xx
334
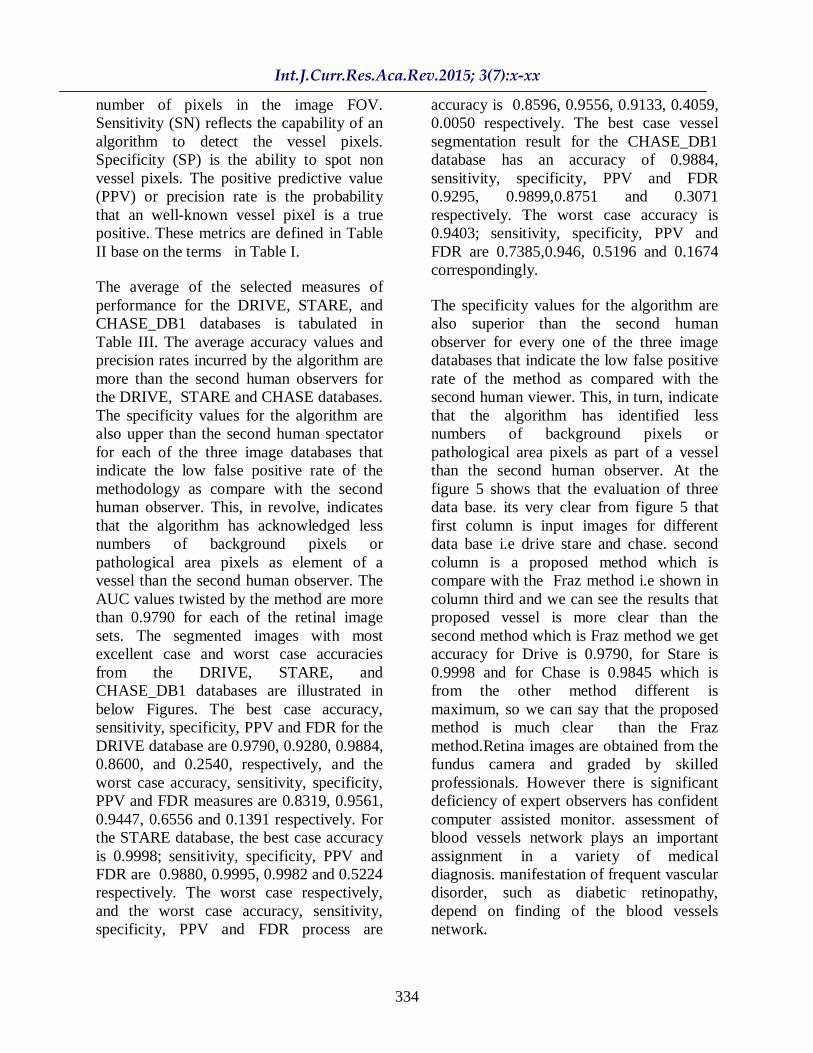
number of pixels in the image FOV.
Sensitivity (SN) reflects the capability of an
algorithm to detect the vessel pixels.
Specificity (SP) is the ability to spot non
vessel pixels. The positive predictive value
(PPV) or precision rate is the probability
that an well-known vessel pixel is a true
positive. These metrics are defined in Table
II base on the terms in Table I.
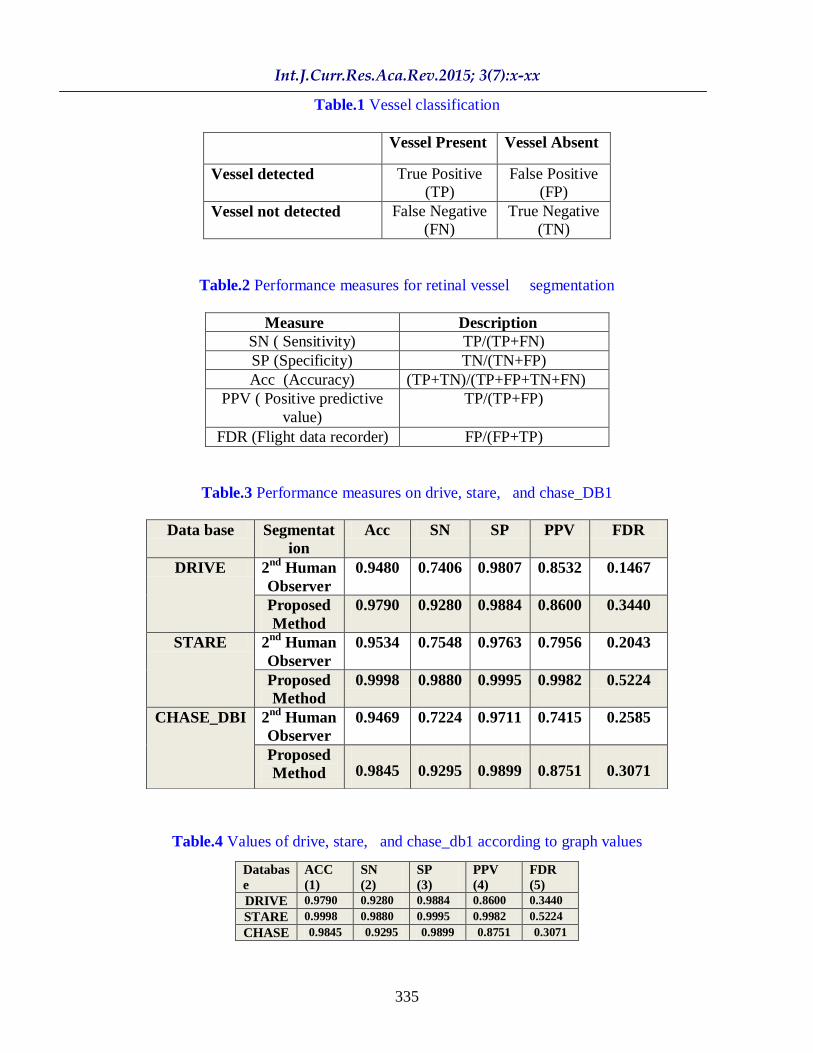
The average of the selected measures of
performance for the DRIVE, STARE, and
CHASE_DB1 databases is tabulated in
Table III. The average accuracy values and
precision rates incurred by the algorithm are
more than the second human observers for
the DRIVE, STARE and CHASE databases.
The specificity values for the algorithm are
also upper than the second human spectator
for each of the three image databases that
indicate the low false positive rate of the
methodology as compare with the second
human observer. This, in revolve, indicates
that the algorithm has acknowledged less
numbers of background pixels or
pathological area pixels as element of a
vessel than the second human observer. The
AUC values twisted by the method are more
than 0.9790 for each of the retinal image
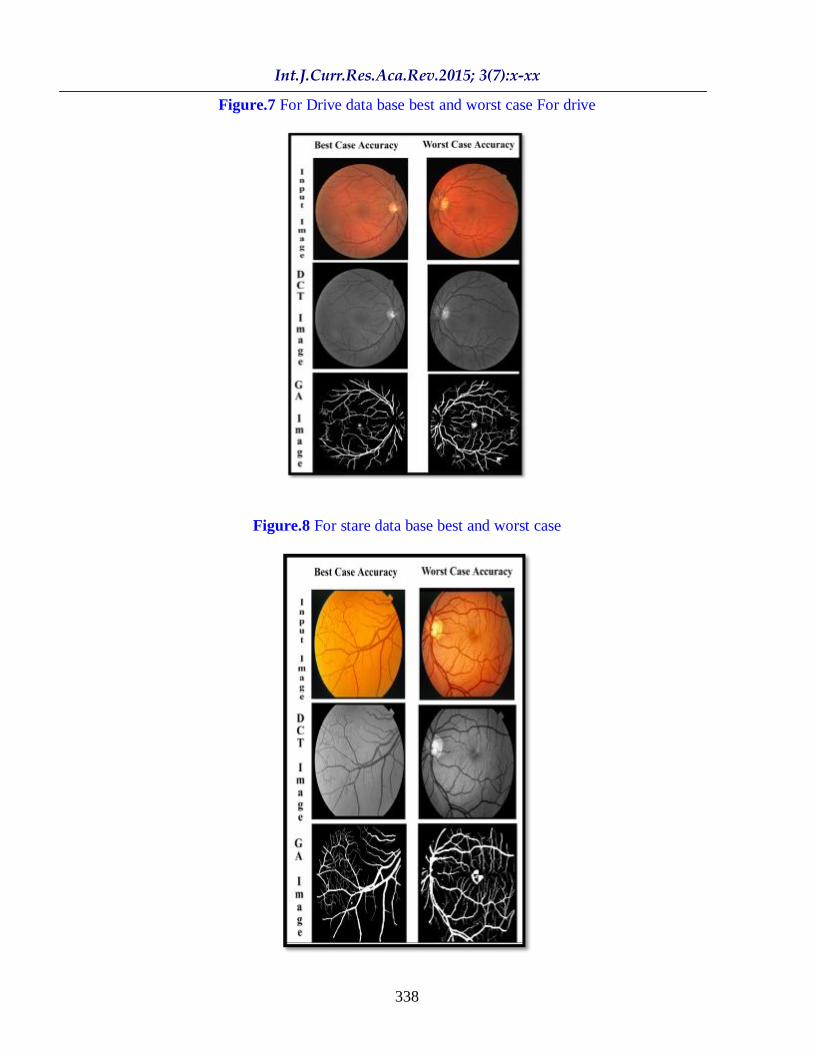
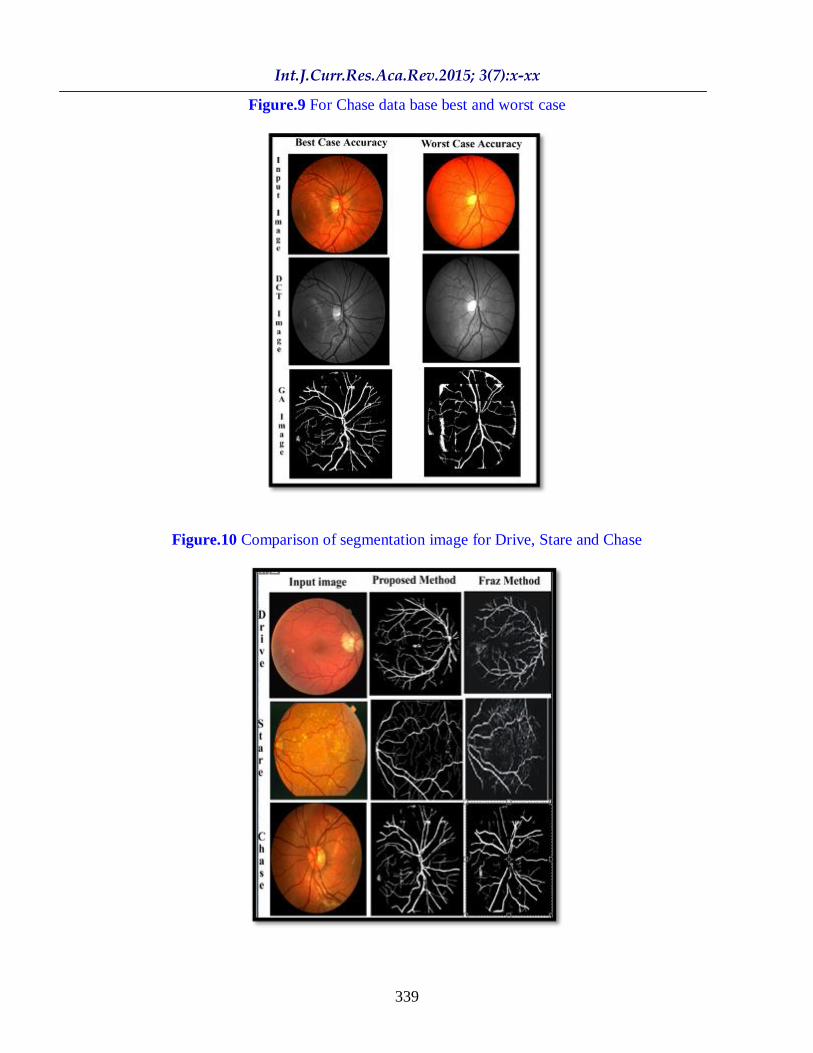
sets. The segmented images with most
excellent case and worst case accuracies
from the DRIVE, STARE, and
CHASE_DB1 databases are illustrated in
below Figures. The best case accuracy,
sensitivity, specificity, PPV and FDR for the
DRIVE database are 0.9790, 0.9280, 0.9884,
0.8600, and 0.2540, respectively, and the
worst case accuracy, sensitivity, specificity,
PPV and FDR measures are 0.8319, 0.9561,
0.9447, 0.6556 and 0.1391 respectively. For
the STARE database, the best case accuracy
is 0.9998; sensitivity, specificity, PPV and
FDR are 0.9880, 0.9995, 0.9982 and 0.5224
respectively. The worst case respectively,
and the worst case accuracy, sensitivity,
specificity, PPV and FDR process are
accuracy is 0.8596, 0.9556, 0.9133, 0.4059,
0.0050 respectively. The best case vessel
segmentation result for the CHASE_DB1
database has an accuracy of 0.9884,
sensitivity, specificity, PPV and FDR
0.9295, 0.9899,0.8751 and 0.3071
respectively. The worst case accuracy is
0.9403; sensitivity, specificity, PPV and
FDR are 0.7385,0.946, 0.5196 and 0.1674
correspondingly.
The specificity values for the algorithm are
also superior than the second human
observer for every one of the three image
databases that indicate the low false positive
rate of the method as compared with the
second human viewer. This, in turn, indicate
that the algorithm has identified less
numbers of background pixels or
pathological area pixels as part of a vessel
than the second human observer. At the
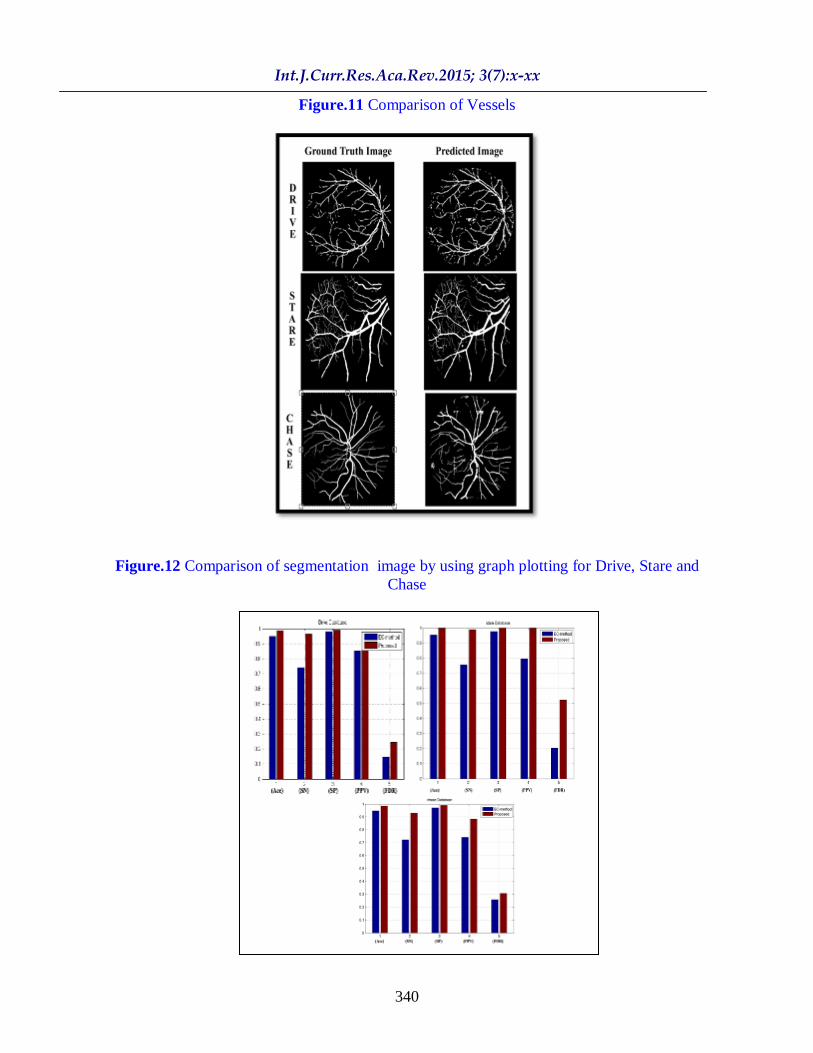
figure 5 shows that the evaluation of three
data base. its very clear from figure 5 that
first column is input images for different
data base i.e drive stare and chase. second
column is a proposed method which is
compare with the Fraz method i.e shown in
column third and we can see the results that
proposed vessel is more clear than the
second method which is Fraz method we get
accuracy for Drive is 0.9790, for Stare is
0.9998 and for Chase is 0.9845 which is
from the other method different is
maximum, so we can say that the proposed
method is much clear than the Fraz
method.Retina images are obtained from the
fundus camera and graded by skilled
professionals. However there is significant
deficiency of expert observers has confident
computer assisted monitor. assessment of
blood vessels network plays an important
assignment in a variety of medical
diagnosis. manifestation of frequent vascular
disorder, such as diabetic retinopathy,
depend on finding of the blood vessels
network.
Int.J.Curr.Res.Aca.Rev.2015; 3(7):x-xx
335
Table.1 Vessel classification
Vessel Present Vessel Absent
Vessel detected True Positive
(TP)
False Positive
(FP)
Vessel not detected False Negative
(FN)
True Negative
(TN)
Table.2 Performance measures for retinal vessel segmentation
Measure Description
SN ( Sensitivity) TP/(TP+FN)
SP (Specificity) TN/(TN+FP)
Acc (Accuracy) (TP+TN)/(TP+FP+TN+FN)
PPV ( Positive predictive
value)
TP/(TP+FP)
FDR (Flight data recorder) FP/(FP+TP)
Table.3 Performance measures on drive, stare, and chase_DB1
Table.4 Values of drive, stare, and chase_db1 according to graph values
Data base Segmentat
ion
Acc SN SP PPV FDR
DRIVE 2nd
Human
Observer
0.9480 0.7406 0.9807 0.8532 0.1467
Proposed
Method
0.9790 0.9280 0.9884 0.8600 0.3440
STARE 2nd
Human
Observer
0.9534 0.7548 0.9763 0.7956 0.2043
Proposed
Method
0.9998 0.9880 0.9995 0.9982 0.5224
CHASE_DBI 2nd
Human
Observer
0.9469 0.7224 0.9711 0.7415 0.2585
Proposed
Method 0.9845 0.9295 0.9899 0.8751 0.3071
Databas
e
ACC
(1)
SN
(2)
SP
(3)
PPV
(4)
FDR
(5)
DRIVE 0.9790 0.9280 0.9884 0.8600 0.3440
STARE 0.9998 0.9880 0.9995 0.9982 0.5224
CHASE 0.9845 0.9295 0.9899 0.8751 0.3071
Int.J.Curr.Res.Aca.Rev.2015; 3(7):x-xx
336
Figure.1 Retinal fundus image
Fig.2 Extraction of RGB image
Figure.3 Initializations of genes
1 1 0 1 0 1
Parent
A
Parent B
1 0 0 1 0 0
Int.J.Curr.Res.Aca.Rev.2015; 3(7):x-xx
337
Figure.4 Crossover of binary (0/1) genes
Figure 5 Mutation changes make a tiny (random) gene change
Figure.6 Morphological Noise Reductions
Crossove
r
Mutation
1 1 0 1 0 1
1 1 0 1 0 1
0 1 1 0 0 0
1 1 1 0 0 0
Parent
A
Paren
t B
1 0 0 1 0 0
1 1 0 1 0 1
0 1 1 0 0 0
Child
A
Child
B
Crossove
r
1 1 0 1 0 1
Int.J.Curr.Res.Aca.Rev.2015; 3(7):x-xx
338
Figure.7 For Drive data base best and worst case For drive
Figure.8 For stare data base best and worst case
Int.J.Curr.Res.Aca.Rev.2015; 3(7):x-xx
339
Figure.9 For Chase data base best and worst case
Figure.10 Comparison of segmentation image for Drive, Stare and Chase
Int.J.Curr.Res.Aca.Rev.2015; 3(7):x-xx
340
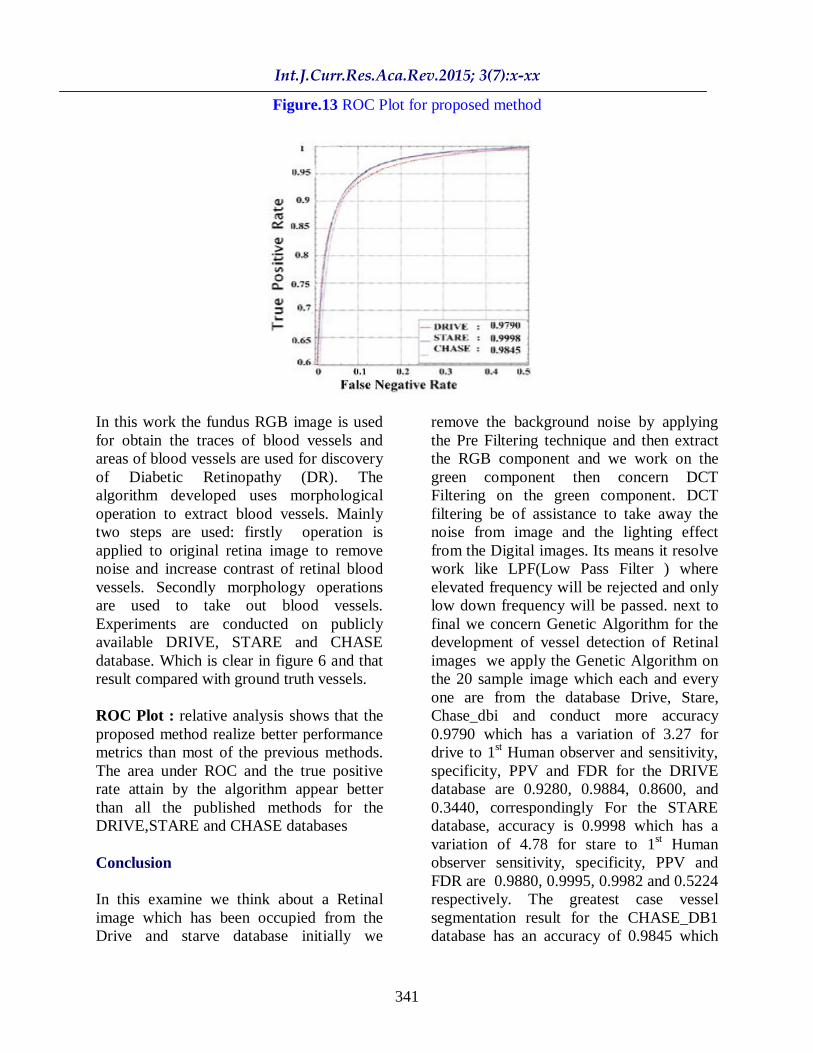
Figure.11 Comparison of Vessels
Figure.12 Comparison of segmentation image by using graph plotting for Drive, Stare and
Chase
Int.J.Curr.Res.Aca.Rev.2015; 3(7):x-xx
341
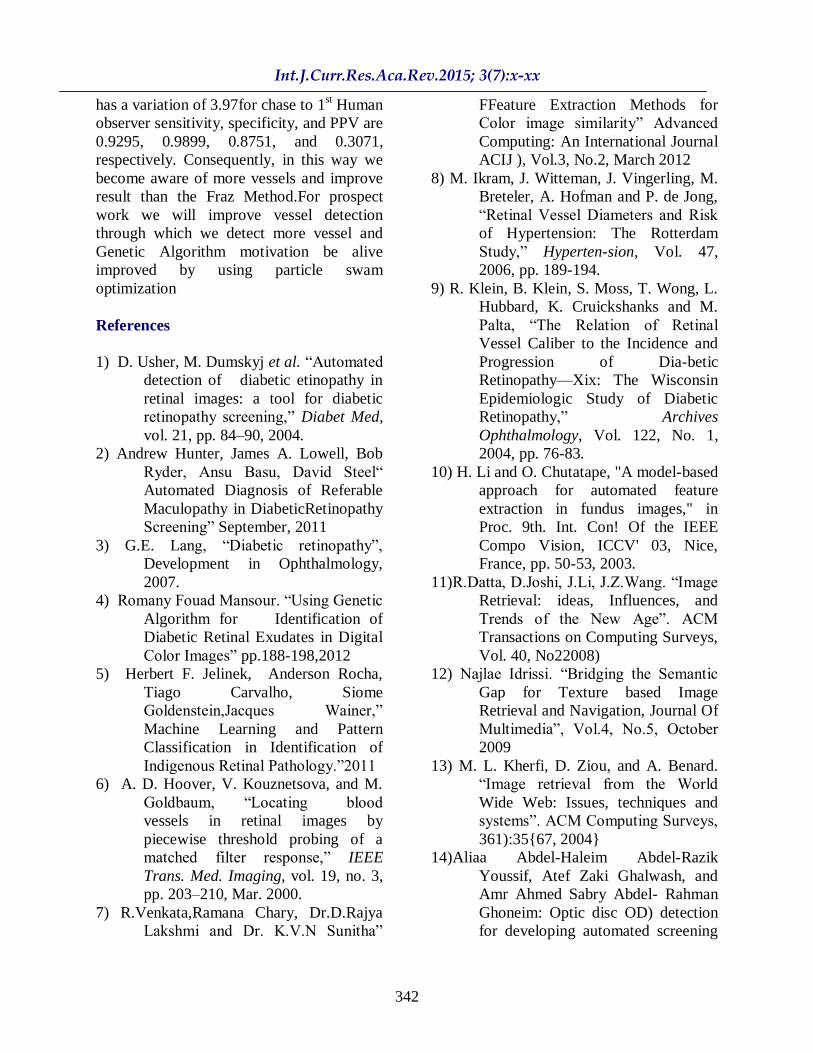
Figure.13 ROC Plot for proposed method
In this work the fundus RGB image is used
for obtain the traces of blood vessels and
areas of blood vessels are used for discovery
of Diabetic Retinopathy (DR). The
algorithm developed uses morphological
operation to extract blood vessels. Mainly
two steps are used: firstly operation is
applied to original retina image to remove
noise and increase contrast of retinal blood
vessels. Secondly morphology operations
are used to take out blood vessels.
Experiments are conducted on publicly
available DRIVE, STARE and CHASE
database. Which is clear in figure 6 and that
result compared with ground truth vessels.
ROC Plot : relative analysis shows that the
proposed method realize better performance
metrics than most of the previous methods.
The area under ROC and the true positive
rate attain by the algorithm appear better
than all the published methods for the
DRIVE,STARE and CHASE databases
Conclusion
In this examine we think about a Retinal
image which has been occupied from the
Drive and starve database initially we
remove the background noise by applying
the Pre Filtering technique and then extract
the RGB component and we work on the
green component then concern DCT
Filtering on the green component. DCT
filtering be of assistance to take away the
noise from image and the lighting effect
from the Digital images. Its means it resolve
work like LPF(Low Pass Filter ) where
elevated frequency will be rejected and only
low down frequency will be passed. next to
final we concern Genetic Algorithm for the
development of vessel detection of Retinal
images we apply the Genetic Algorithm on
the 20 sample image which each and every
one are from the database Drive, Stare,
Chase_dbi and conduct more accuracy
0.9790 which has a variation of 3.27 for
drive to 1st Human observer and sensitivity,
specificity, PPV and FDR for the DRIVE
database are 0.9280, 0.9884, 0.8600, and
0.3440, correspondingly For the STARE
database, accuracy is 0.9998 which has a
variation of 4.78 for stare to 1st Human
observer sensitivity, specificity, PPV and
FDR are 0.9880, 0.9995, 0.9982 and 0.5224
respectively. The greatest case vessel
segmentation result for the CHASE_DB1
database has an accuracy of 0.9845 which
Int.J.Curr.Res.Aca.Rev.2015; 3(7):x-xx
342
has a variation of 3.97for chase to 1st Human
observer sensitivity, specificity, and PPV are
0.9295, 0.9899, 0.8751, and 0.3071,
respectively. Consequently, in this way we
become aware of more vessels and improve
result than the Fraz Method.For prospect
work we will improve vessel detection
through which we detect more vessel and
Genetic Algorithm motivation be alive
improved by using particle swam
optimization
References
1) D. Usher, M. Dumskyj et al. ―Automated
detection of diabetic etinopathy in
retinal images: a tool for diabetic
retinopathy screening,‖ Diabet Med,
vol. 21, pp. 84–90, 2004.
2) Andrew Hunter, James A. Lowell, Bob
Ryder, Ansu Basu, David Steel―
Automated Diagnosis of Referable
Maculopathy in DiabeticRetinopathy
Screening‖ September, 2011
3) G.E. Lang, ―Diabetic retinopathy‖,
Development in Ophthalmology,
2007.
4) Romany Fouad Mansour. ―Using Genetic
Algorithm for Identification of
Diabetic Retinal Exudates in Digital
Color Images‖ pp.188-198,2012
5) Herbert F. Jelinek, Anderson Rocha,
Tiago Carvalho, Siome
Goldenstein,Jacques Wainer,‖
Machine Learning and Pattern
Classification in Identification of
Indigenous Retinal Pathology.‖2011
6) A. D. Hoover, V. Kouznetsova, and M.
Goldbaum, ―Locating blood
vessels in retinal images by
piecewise threshold probing of a
matched filter response,‖ IEEE
Trans. Med. Imaging, vol. 19, no. 3,
pp. 203–210, Mar. 2000.
7) R.Venkata,Ramana Chary, Dr.D.Rajya
Lakshmi and Dr. K.V.N Sunitha‖
FFeature Extraction Methods for
Color image similarity‖ Advanced
Computing: An International Journal
ACIJ ), Vol.3, No.2, March 2012
8) M. Ikram, J. Witteman, J. Vingerling, M.
Breteler, A. Hofman and P. de Jong,
―Retinal Vessel Diameters and Risk
of Hypertension: The Rotterdam
Study,‖ Hyperten-sion, Vol. 47,
2006, pp. 189-194.
9) R. Klein, B. Klein, S. Moss, T. Wong, L.
Hubbard, K. Cruickshanks and M.
Palta, ―The Relation of Retinal
Vessel Caliber to the Incidence and
Progression of Dia-betic
Retinopathy—Xix: The Wisconsin
Epidemiologic Study of Diabetic
Retinopathy,‖ Archives
Ophthalmology, Vol. 122, No. 1,
2004, pp. 76-83.
10) H. Li and O. Chutatape, "A model-based
approach for automated feature
extraction in fundus images," in
Proc. 9th. Int. Con! Of the IEEE
Compo Vision, ICCV' 03, Nice,
France, pp. 50-53, 2003.
11)R.Datta, D.Joshi, J.Li, J.Z.Wang. ―Image
Retrieval: ideas, Influences, and
Trends of the New Age‖. ACM
Transactions on Computing Surveys,
Vol. 40, No22008)
12) Najlae Idrissi. ―Bridging the Semantic
Gap for Texture based Image
Retrieval and Navigation, Journal Of
Multimedia‖, Vol.4, No.5, October
2009
13) M. L. Kherfi, D. Ziou, and A. Benard.
―Image retrieval from the World
Wide Web: Issues, techniques and
systems‖. ACM Computing Surveys,
361):35{67, 2004}
14)Aliaa Abdel-Haleim Abdel-Razik
Youssif, Atef Zaki Ghalwash, and
Amr Ahmed Sabry Abdel- Rahman
Ghoneim: Optic disc OD) detection
for developing automated screening
Int.J.Curr.Res.Aca.Rev.2015; 3(7):x-xx
343
systems for diabetic retinopathy.
2008
15) Xu, L and S.Luo: A novel method for
blood vessel detection from retinal
images. Biomed.Eng.,9:14-
14.DOI:10.1186/1475-925x-9-14,
2010.
16)Oliver Faust, Rajendra Acharya
U.E.Y.K.Ng.kwan-Hoong Ng. Jasjit
S. Suri: Algorithms for the
automated detection of diabetic
retinopathy using Digital Fundus
images. A review,‖ Springer science
and business media LLC, Journal of
medical system., 2010.
17)Oliver Faust, Rajendra Acharya
U.E.Y.K.Ng.kwan-Hoong Ng. Jasjit
S. Suri: ―Algorithms for the
automated detection of diabetic
retinopathy using Digital Fundus
images‖ 2010.
18) Praveen Ranjan,Srivastava1 and Tai-
hoon Kim―Application of Genetic
Algorithm in Software Testing‖ Vol.
3, No.4, October 2009.
19) Keerthi Ram ―Detection of diabetic
retinopathy lesions in color retinal
images‖ Hyderabad, India,
December 2009.
20) Osareh and Shadgar ―Automatic Blood
Vessel Segmentation in Colour
Image Of Retina Vol. 33, Iran,
2009.
21) Yong Yang, Shuying Huang and Nini
Rao ―An Automatic Hybrid Method
For Retinal Blood Vessel
Extraction‖Vol. 18, No. 3, 2008.
22) Jian Chena, Jie Tiana,b,, Zichun Tanga,
Jian Xuea, Yakang Daia and Jian
Zhenga ―Retinal vessel enhancement
and extraction based on directional
field‖ June 2008.
23) Manal Bouhaimed, Robbie Gibbins and
David Owens ―Automated Detection
of Diabetic Retinopathy: Results of a
Screening Study‖ Volume 10, No 2,
2008.
24)Aliaa Abdel-Haleim Abdel-Razik
Youssif, Atef Zaki Ghalwash, and
Amr Ahmed Sabry Abdel- Rahman
Ghoneim: ―Optic disc OD) detection
for developing automated screening
systems for diabetic retinopathy‖
2008.
25)Manal Bouhaimed and David Owens
―Detection of Diabetic
Retinopathy‖Results of a Screening
Study‖ Volume 10, Number 2, 2008
26)Rus¸en O ktem,Karen Egiazarian,
Vladimir V. Lukin, Nikolay N.
Ponomarenko,and Oleg V.
Tsymbal‖Locally Adaptive DCT
Filtering for Signal-Dependent Noise
Removal‖ EURASIP Journal on
Advances in Signal Processing
Volume 2007.
27) Saeid Fazli and Sevin Samadi ―A Novel
Retinal Vessel Segmentation Based
On Histogram Transformation Using
2-D Morlet Wavelet and Supervised
Classification‖ 2007
28) A.M Aibinu, M.I Iqbal2, M. Nilsson and
M.J.E Salami ―Automatic
Diagnosis of Diabetic Retinopathy
from Fundus Images Using Digital
Signal and Image Processing
Techniques‖ 2007.
29)Al-Rawi M, Karajeh H: ―Genetic
algorithm matched filter
optimization for automated detection
of blood vessels from digital retinal
images. Computer Methods
Programs Boomed‖., 2007.
30) Enrico Grisam, Marco Foracchia and
Alfred Ruggeri, ―A novel method for
automatic grading of retinal vessel
tortuosity,‖ IEEE Transactions on
Medical image,2007.
31) V. B. Soares, J. G. Leandro,M. Cesar-
Jr., F. Jelinek, and Michael J. Cree
―Retinal Vessel Segmentation Using
Int.J.Curr.Res.Aca.Rev.2015; 3(7):x-xx
344
the 2-D Morlet Wavelet and
Supervised Classification‖ May
2006.
32)Lassada Sukkaew, Bunyarit
Uyyanonvara, Sarah A Barman, and
Jaruwat Jareanjit ―Automated
Vessels Detection on Infant Retinal
Images‖ Bangkok, 2004.
33)Joes Staal, Michael, Meindert Niemeijer,
Max A. and Bram ―Ridge-Based
Vessel Segmentation in Color
Images of the Retina‖ Vol. 23, No. 4,
2004.
34) Xiayu Xu, Meindert Niemeijer, Qi Song,
Milan Sonka, Mona K. Garvin,
Joseph M. Reinhard and Michael D.
Abràmoff ―Vessel Boundary
Delineation on Fundus Images Using
Graph-Based Approach‖ 2011 IEEE
35)Hasan Mir,Hasan Al-Nashash, U. R.
Acharya ―Assessment of
Retinopathy Severity Using Digital
Fundus‖ 2011 IEEE
36)Zafer Yavuz, Cemal Köse ―Retinal
Blood Vessel Segmentation Using
Gabor Filter And Tophat Transform‖
2011 IEEE.
37)Danu Onkaew, Rashmi Turior, Nishihara
Akinori, Chanjira Sinthanayothin
―Automatic Retinal Vessel
Tortuosity Measurement using
Curvature of Improved Chain Code‖
2011 IEEE.
38)Maryam Mubbashar, Anam Usman, M.
Usman Akram ―Automated System
for Macula Detection in Digital
Retinal Images‖ 2011.
39)Diego Fiorin and Alfredo Ruggeri
―Computerized Analysis of Narrow-
field ROP Images for the
Assessment of Vessel Caliber and
Tortuosity‖ 2011 IEEE
40)Herbert F. Jelinek, Anderson Rocha,
Tiago Carvalho, Siome Goldenstein,
Jacques Wainer ―Machine Learning
and Pattern Classification in
Identification of Indigenous Retinal
Pathology‖ 2011 IEEE.


![The Guide - Diabetic Retinopathy - Vision Lossvisionloss.org.au/wp-content/uploads/2016/05/The... · the guide [diabetic retinopathy] What is Diabetic Retinopathy? Diabetic Retinopathy](https://img.pdfslide.us/doc/110x75/5e3ed00bf9c32e41ea6578a8/the-guide-diabetic-retinopathy-vision-the-guide-diabetic-retinopathy-what.jpg)