Embed Size (px)
Citation preview

IOWA GAMING MARKET ANALYSIS
Winter/Spring 2009
GVA File #08050 Prepared for: Iowa Racing and Gaming Commission
717 East Court, Suite B Des Moines, IA 50309 Prepared by:
International Hospitality and Gaming Consultants
Minneapolis Office: 333 South 7th Street, Suite 2300, Minneapolis, MN 55402 Phone: 612-335-8888; Fax: 612-334-3022
Seattle Office: 22525 Southeast 64th Place, Suite 180, Issaquah, WA 98027
Phone: 425-392-7482; Fax: 425-392-7330
Las Vegas Office: 3960 Howard Hughes Parkway, Suite 500, Las Vegas, NV 89169 Phone: 702-990-3588; Fax: 702-990-3501

International Hospitality and Gaming Consultants
Minneapolis Office: 333 South 7th Street, Suite 2300, Minneapolis, MN 55402 Phone: 612-335-8888; Fax: 612-334-3022
Seattle Office: 22525 Southeast 64th Place, Suite 180, Issaquah, WA 98027 Phone: 425-392-7482; Fax: 425-392-7330
Las Vegas Office: 3960 Howard Hughes Parkway, Suite 500, Las Vegas, NV 89169 Phone: 702-990-3588; Fax: 702-990-3501
May 1, 2009
Mr. Jack Ketterer Administrator Iowa Racing and Gaming Commission 717 East Court, Suite B Des Moines, IA 50309 Dear Mr. Ketterer: GVA Marquette Advisors is pleased to present the accompanying report entitled: "Iowa Gaming Market Analysis." This report presents an analysis of the existing gaming market in Iowa, as of the Winter/Spring 2009 period, together with an overview of the current and projected economic climate of the region, an assessment of the potential market support for expanded gaming, and estimated Iowa casino utilization and financial projections under varied development scenarios. Our conclusions are based on information developed from research of the market, knowledge of the industry and meetings with representatives of the project team during which we were provided with significant information. The sources of information and the basis of the estimates and assumptions are stated in the body of this report. This information and supporting documentation was assumed to be accurate and no attempt at independent verification was made. We have no responsibility to update this report for events and circumstances occurring after the conclusion of our fieldwork, which is concurrent with the report date. The casino utilization and financial projections presented in this report are based on estimates and assumptions developed in connection with our market study and assume that the facilities offers gaming, lodging, support and amenity components as described in this document. However, some assumptions inevitably will not materialize and unanticipated events and circumstances may occur; therefore, actual results achieved during the period covered by our analysis will vary from our projections and the variations may be material. Further, we are not responsible for future marketing efforts and other management actions upon which actual casino results will depend.

Mr. Jack Ketterer, Administrator Iowa Racing and Gaming Commission Page ii We appreciate the opportunity to be of service and remain available to answer any questions which may arise regarding our work, or if additional analysis and/or advisory services are required. Best Regards, GVA MARQUETTE ADVISORS
IOWA GAMING MARKET ANALYSIS
Letter of Transmittal i-ii
TABLE OF CONTENTS PAGE INTRODUCTION
BACKGROUND ................................................................................................... 1 SCOPE OF SERVICES ......................................................................................... 1 METHODOLOGY ................................................................................................ 2
IOWA GAMING MARKET: HISTORICAL PERSPECTIVE
IOWA GAMING DEVELOPMENT & SUPPLY TRENDS ................................ 4 INDIVIDUAL CASINO PERFORMANCE ....................................................... 10 IOWA COMPARISON WITH OTHER U.S. GAMING MARKETS ................ 17
REGIONAL DEMOGRAPHY & ECONOMICS
GAMING DEMAND INDICATORS ................................................................. 22 POPULATION & INCOME GROWTH TRENDS ............................................. 24 THE IOWA ECONOMY ..................................................................................... 34 KEY CONCLUSIONS: DEMOGRAPHY & ECONOMICS ............................ 35
IOWA GAMING MARKET FORECAST
IOWA GAMING MARKET PROJECTIONS -- FY 2009 ................................. 36 IOWA GAMING MARKET PROJECTIONS -- FY 2013 ................................. 40 SCENARIO 1: LYON COUNTY GAMING DEVELOPMENT ....................... 46 SCENARIO 2: WAPELLO COUNTY GAMING DEVELOPMENT ............... 49 SCENARIO 3: WEBSTER COUNTY GAMING DEVELOPMENT ............... 52 SCENARIO 4: FRANKLIN COUNTY GAMING DEVELOPMENT .............. 55 SCENARIO 5: TAMA COUNTY GAMING DEVELOPMENT ...................... 58 SUMMARY OF CONCLUSIONS ...................................................................... 61
ADDENDA Iowa Casino Photographs and Property Data ................................................................. 1 Profile of GVA Marquette Advisors ................................................................................... 2
Iowa Gaming Market Analysis May 2009 Page 1
GVA Marquette Advisors - International Hospitality & Gaming Consultants
BACKGROUND In November of 2004, the Iowa Racing and Gaming Commission (IRGC) solicited applications for licensed casinos throughout the state. In May of 2005, IRGC granted licenses to four applicants, bringing the total number of casinos in Iowa to 14. In addition, Iowa has a total of three racinos and three tribal casinos. Following the granting of the four new licenses in 2004, the IRGC planned to evaluate the issue of additional licenses after a period of several months. In 2008, the IRGC noted flat to negative growth among Iowa gaming facilities. As such, the IRGC determined that it should go forward with a comprehensive analysis of the Iowa gaming market in order to determine the potential for gaming expansion in Iowa and the expected impact of additional casino development upon current facilities. As such, IRGC retained GVA Marquette Advisors to provide a comprehensive analysis of the Iowa gaming market. The scope of services provided under this engagement is summarized below. SCOPE OF SERVICES1 Conduct a study on the casino markets in the State of Iowa. The study will focus on identifying underserved and currently served, but underperforming markets. The study will include the counties of Webster, Wapello, Franklin, Lyon and Tama, whether or not they are deemed to be underserved markets, as these counties have expressed interest in a casino having passed referenda approving casino gambling. The study shall include, but not be limited to the following:
• Projected admission and adjusted gross revenue of: o Potential casinos in Wapello, Webster, Franklin, Lyon and Tama counties o Potential casinos in other markets identified as underserved or underperforming
locations • Distinguish among markets that will support a minimum capital investment of $40M;
$70M and $100M2 • Projected impact on existing licensees of a $40M; $70M and $100M facility, subscribing
to the theory that the more amenities in addition to the casino, the more attractive the facility will be to a broader geographic market
• Projected impact of multiple new licenses on existing licenses • Projected percentage of out of state patronage in identified markets and whether or not
the casino will be beneficial to tourism • An economic forecast for Iowa casinos for the next 3 years – include admissions and
revenues
1 Scope of services as per contractual agreement between GVA Marquette Advisors and Iowa Racing and Gaming Commission. 2 Capital investment levels adjusted by GVA Marquette Advisors to reflect current construction costs

Iowa Gaming Market Analysis May 2009 Page 2
GVA Marquette Advisors - International Hospitality & Gaming Consultants
• Provide personal income and discretionary income in identified markets – compare to other markets in Iowa and cite the effect on admissions and revenue
• Projected impact on tourism and creation of new economic development METHODOLOGY Our analysis has focused on identifying the overall gaming potential for Iowa casinos, collectively, and for each of the various sub-markets surrounding Iowa’s existing casinos. We then worked to understand how each casino competes within its competitive submarket area. The varied submarkets surrounding each of Iowa’s casinos include a mix of competitive facilities within Iowa and also neighboring states. Casino performance models were developed that fit these competitive patterns in the current year. Those models were then altered to reflect changes in the market in terms of population and income growth, as well as changes in the number of gaming devices and the number of competitive casinos within the various markets. In order to construct an accurate model, we have evaluated the historic performance for each of Iowa’s existing gaming facilities, together with all relevant demographic and economic data, as well as tourism information and statistics. Our general approach to this assignment is outlined as follows: Analysis of Competitive Market Conditions
• Evaluate the scope of the existing facilities within Iowa and information regarding any planned casino or amenity additions.
• Review information regarding performance levels, revenue trends, seasonality, hotel performance and source of patrons for the Iowa market as a whole and for each casino (as available from each of Iowa’s casino operators).
• Analyze the Iowa gaming market was also reviewed in comparison with other U.S. gaming markets, including a group of developing and mature markets.
• Evaluate each casino’s location in terms of their proximity to population centers, accessibility and visibility, supporting development and tourism activity.
• Identify relevant submarkets markets (draw area and competitors) for each of the existing Iowa casinos.
• Identify likely draw area/submarkets surrounding each of the five counties being considered for gaming development (Lyon, Wapello, Webster, Franklin and Tama), in addition to other markets current deemed to be underserved, thus offering potential for gaming development.

Iowa Gaming Market Analysis May 2009 Page 3
GVA Marquette Advisors - International Hospitality & Gaming Consultants
Analyze relevant market areas for each Iowa casino
• Demographics: Population, income, household and personal income data, population age distribution, growth trends
• Economic: Employment, labor market information, business expansion and job growth • Tourism: Transportation (airports & highways), convention activity, regional and local
attractions, annual tourist counts as available • Segment key population and income statistics by county and for each of the relevant gaming
submarkets throughout Iowa. This includes an extensive analysis and comparison of personal and discretionary income by county and submarket and the effect of these indicators on overall gaming potential.
Iowa Gaming Market Forecast
• Develop a base model that predicts the current (2008) performance levels (annual admission and gaming revenues) for each of Iowa’s existing casinos considering the relative proximity to population, appropriate participation rates and frequency rates, the impact of “outside” demand components (tourism, etc), average spend estimates, and the respective competitive advantages and disadvantages of each casino due to location and facilities.
• Gaming Market Projections – Base Scenario. Prepare statewide and facility-specific
performance projections (admissions and gaming revenue) for each of Iowa’s existing gaming facilities. Projections will be developed for three and five-year timeframe. Base scenario would assume no increase in gaming licenses within the State of Iowa. This scenario would, however factor in planned new casinos in neighboring states, as relevant.
• Gaming Market Projections – Alternative Scenarios. Prepare statewide and facility-specific performance projections (admissions and gaming revenue) for each of Iowa’s existing gaming facilities. Wapello, Webster, Franklin and Tama Counties were evaluated for potential gaming development, as well as other Iowa submarkets determined to be underperforming or currently underserved by gaming. Several models were developed in order to assess the potential impact of gaming investment at various levels ($50M, $75M, and $100M) at the identified new locations.
• Next, we assess the impact of various levels of new gaming development upon the market as a whole and individual casinos in Iowa, specifically.
• We have assessed the various development scenarios above in terms of tourism and the potential to attract additional gamer visits from out-of-state residents, and to generate additional economic development in Iowa.
Iowa Gaming Market Analysis May 2009 Page 4
GVA Marquette Advisors - International Hospitality & Gaming Consultants
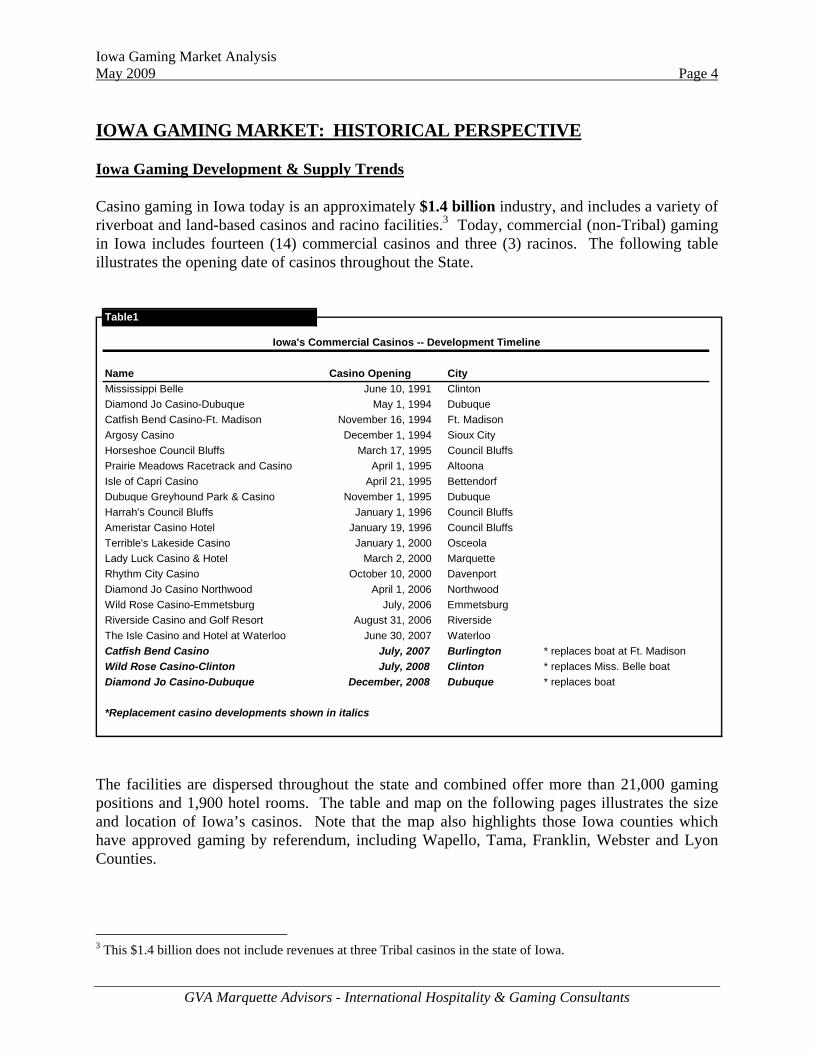
IOWA GAMING MARKET: HISTORICAL PERSPECTIVE Iowa Gaming Development & Supply Trends Casino gaming in Iowa today is an approximately $1.4 billion industry, and includes a variety of riverboat and land-based casinos and racino facilities.3 Today, commercial (non-Tribal) gaming in Iowa includes fourteen (14) commercial casinos and three (3) racinos. The following table illustrates the opening date of casinos throughout the State.
Name Casino Opening CityMississippi Belle June 10, 1991 ClintonDiamond Jo Casino-Dubuque May 1, 1994 DubuqueCatfish Bend Casino-Ft. Madison November 16, 1994 Ft. MadisonArgosy Casino December 1, 1994 Sioux CityHorseshoe Council Bluffs March 17, 1995 Council BluffsPrairie Meadows Racetrack and Casino April 1, 1995 AltoonaIsle of Capri Casino April 21, 1995 BettendorfDubuque Greyhound Park & Casino November 1, 1995 DubuqueHarrah's Council Bluffs January 1, 1996 Council BluffsAmeristar Casino Hotel January 19, 1996 Council BluffsTerrible's Lakeside Casino January 1, 2000 OsceolaLady Luck Casino & Hotel March 2, 2000 MarquetteRhythm City Casino October 10, 2000 DavenportDiamond Jo Casino Northwood April 1, 2006 NorthwoodWild Rose Casino-Emmetsburg July, 2006 EmmetsburgRiverside Casino and Golf Resort August 31, 2006 RiversideThe Isle Casino and Hotel at Waterloo June 30, 2007 WaterlooCatfish Bend Casino July, 2007 Burlington * replaces boat at Ft. MadisonWild Rose Casino-Clinton July, 2008 Clinton * replaces Miss. Belle boatDiamond Jo Casino-Dubuque December, 2008 Dubuque * replaces boat
*Replacement casino developments shown in italics
Iowa's Commercial Casinos -- Development Timeline
Table1
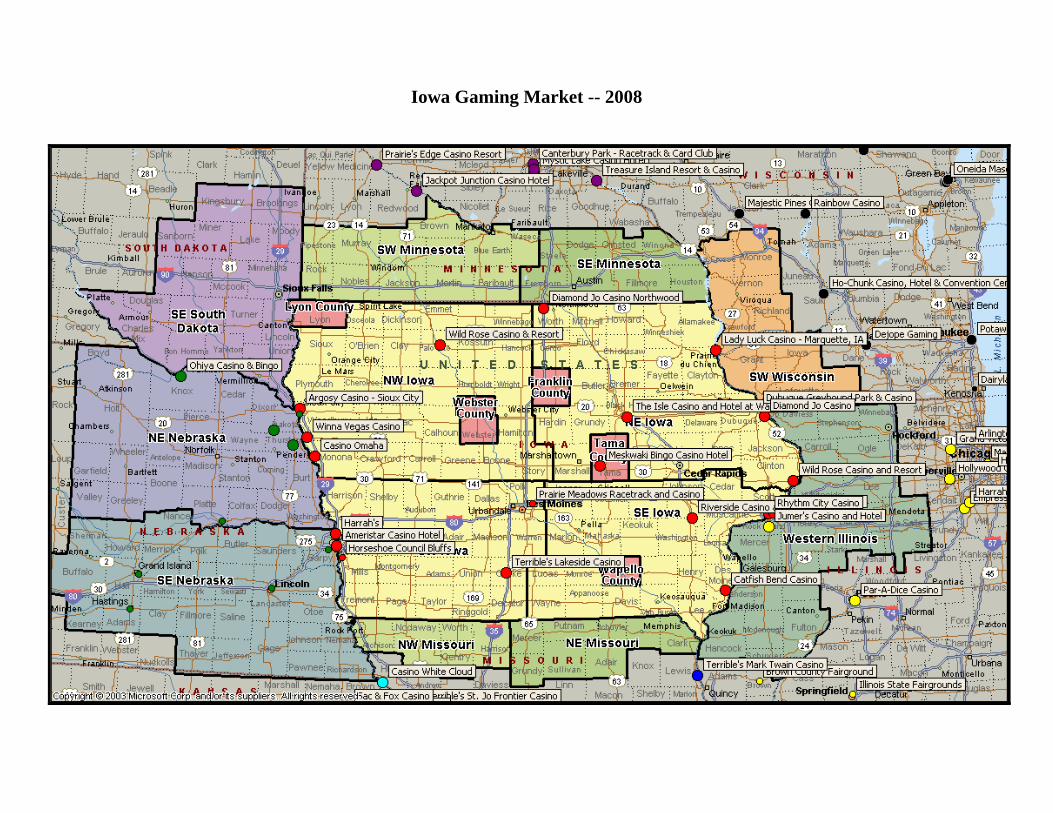
The facilities are dispersed throughout the state and combined offer more than 21,000 gaming positions and 1,900 hotel rooms. The table and map on the following pages illustrates the size and location of Iowa’s casinos. Note that the map also highlights those Iowa counties which have approved gaming by referendum, including Wapello, Tama, Franklin, Webster and Lyon Counties.
3 This $1.4 billion does not include revenues at three Tribal casinos in the state of Iowa.

Table 2
Casinos Location State Type Map #Gaming
Machines
Table Games
(non-poker)
Poker Tables
Total Positions*
Hotel Rooms
Isle of Capri Casino Bettendorf IA Casino 1 1,034 26 8 1,288 504Catfish Bend Casino Burlington IA Casino 2 680 18 5 851 180Wild Rose Casino and Resort Clinton IA Casino 3 600 17 2 737 40Ameristar Casino Hotel Council Bluffs IA Casino 4 1,650 39 0 1,923 160Harrah's Council Bluffs Council Bluffs IA Casino 5 1,000 21 0 1,147 251Rhythm City Casino Davenport IA Casino 6 975 23 9 1,217 -Diamond Jo Casino Dubuque IA Casino 7 924 17 0 1,043 -Wild Rose Casino Emmetsburg IA Casino 8 530 17 4 685 70Lady Luck Casino & Hotel Marquette IA Casino 9 650 13 2 759 24Diamond Jo Casino Northwood Northwood IA Casino 10 902 26 7 1,147 102Casino Omaha Onawa IA Casino 11 464 8 2 538 -Terrible's Lakeside Casino Osceola IA Casino 12 1,084 18 6 1,264 60Riverside Casino and Golf Resort Riverside IA Casino 13 1,222 40 14 1,628 201Argosy Casino Sioux City IA Casino 14 703 21 4 886 -Winna Vegas Casino Sloan IA Casino 15 668 13 7 822 -Meskwaki Bingo Casino Hotel Tama IA Casino 16 1,407 30 15 1,752 402The Isle Casino and Hotel at Waterloo Waterloo IA Casino 17 1,000 29 6 1,257 195Horseshoe Council Bluffs Council Bluffs IA Racino 18 1,900 44 18 2,370 -Dubuque Greyhound Park & Casino Dubuque IA Racino 19 1,000 16 4 1,148 120Prairie Meadows Racetrack and Casino Altoona IA Racino 20 1,900 34 6 2,192 -Iowa Casinos 20,293 470 119 24,654 2,309
Tribal Casinos shown in italics.
* Note that poker tables represent 9 gaming positions and non-poker tables account for 7 gaming positions per table.
State of IowaCompetitive Gaming Facilities
Iowa Casinos

Iowa Casino Locations (Counties which have approved gaming via referendum are highlighted)
(Nearby casinos in neighboring states also shown on the map)

Iowa Gaming Market Analysis May 2009 Page 7
GVA Marquette Advisors - International Hospitality & Gaming Consultants
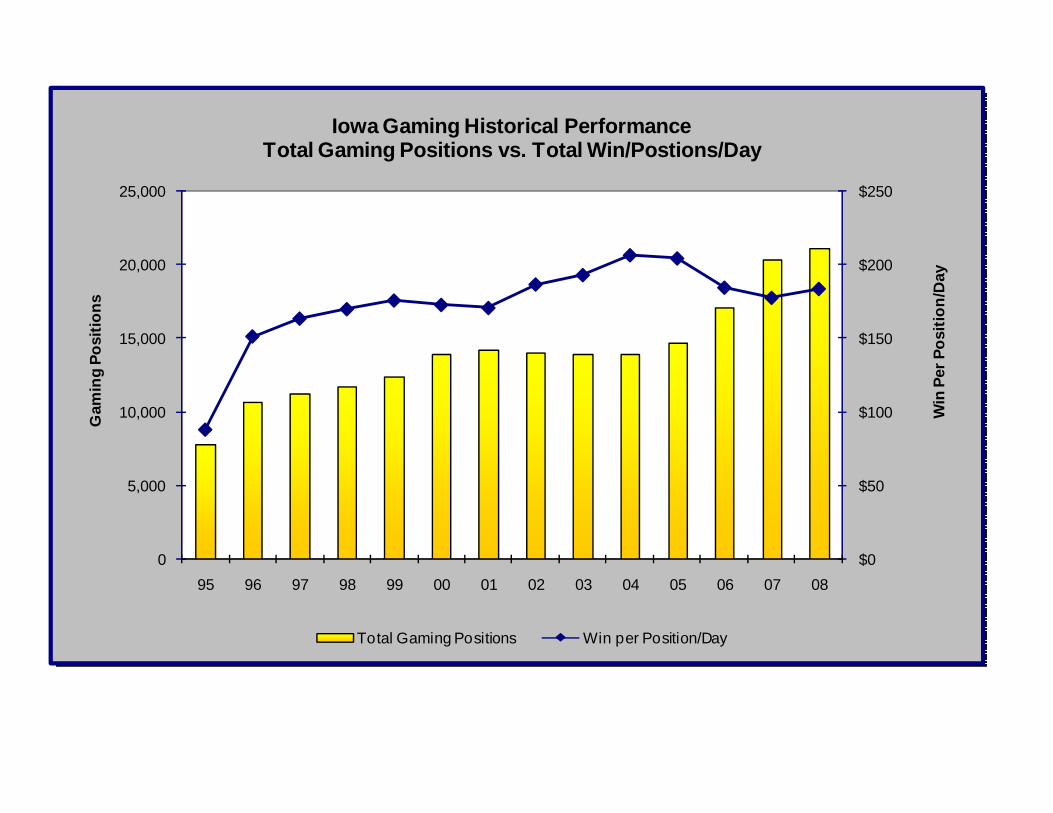
A significant development wave in Iowa gaming occurred during the mid-1990s, with the opening of casinos at three racetracks in Altoona (Prairie Meadows), Dubuque (Greyhound Park), and Council Bluffs (Horseshoe), along with the addition of boats at Dubuque (Ft. Madison), Sioux City (Argosy), Bettendorf (Isle of Capri), and Council Bluffs (Ameristar and Harrah’s). Between 1995 and 2000, Iowa gaming revenues grew from $250,000,000 ($88 per gaming position/day) to nearly $880,000,000 ($173 per position/day). The year 2000 brought the addition of boats at Osceola (Terribles), Marquette (Lady Luck/Isle of Capri), and Davenport (Rhythm City). In spite of the expansion, the win per unit continued to increase, reflecting the increasing popularity of gaming and increasing draw of Iowa casinos due to their proximity to key population centers (within Iowa and adjacent states). By 2005, the win per position/day had increased to $205 and the State’s commercial casinos generated combined revenues of nearly $1,100,000. In 2006 and 2007, Iowa saw the addition of new licenses and land-based casino resorts at Northwood (Diamond Jo), Emmetsburg (Wild Rose) and Waterloo (Isle). Also in 2007, a new land-based casino was constructed at Burlington (Catfish Bend), thereafter replacing the former riverboat at Ft. Madison. In 2008, two major land-based casinos were completed, also replacing former riverboats. This included the new casino and hotel at Clinton (Wild Rose), replacing the Mississippi Belle and an urban casino in Dubuque (Diamond Jo), replacing the former riverboat there also. Between 2006 and 2008, Iowa gaming revenues increased from $1.15 billion to $1.41 billion. During this same timeframe, the number of gamine positions increased by nearly 24%. The average daily win per position dipped slightly from $184 in 2006 to $178 in 2007, before rebounding to $184 in 2008.
Iowa Gaming MarketSummary of Annual Gaming Supply and Revenue Growth, 1995-2008
Total Gaming Annual Gaming Annual Total Annual Win per Win per Fiscal Year* Positions Growth Revenue Growth Admissions Growth Admission Position/Day95 7,813 $251,055,049 7,254,846 $35 $8896 10,685 36.8% $590,222,695 135.1% 16,936,472 133.5% $35 $15197 11,285 5.6% $673,196,215 14.1% 20,272,160 19.7% $33 $16398 11,750 4.1% $728,406,272 8.2% 20,840,994 2.8% $35 $17099 12,393 5.5% $794,885,038 9.1% 20,694,940 -0.7% $38 $17600 13,942 12.5% $878,967,316 10.6% 21,495,758 3.9% $41 $17301 14,241 2.1% $886,995,718 0.9% 19,801,497 -7.9% $45 $17102 14,094 -1.0% $959,958,783 8.2% 20,028,083 1.1% $48 $18703 13,914 -1.3% $979,990,103 2.1% 19,233,711 -4.0% $51 $19304 13,954 0.3% $1,051,515,709 7.3% 19,509,166 1.4% $54 $20605 14,705 5.4% $1,096,436,947 4.3% 19,793,161 1.5% $55 $20406 17,068 16.1% $1,149,059,504 4.8% 20,315,854 2.6% $57 $18407 20,367 19.3% $1,319,964,125 14.9% 22,519,786 10.8% $59 $17808 21,122 3.7% $1,415,377,851 7.2% 23,735,176 5.4% $60 $184 * The IRGC fiscal year is Jul.-Jun.
Source: Iowa Racing and Gaming Commission
Table 3

$0
$500,000,000
$1,000,000,000
$1,500,000,000
$2,000,000,000
$2,500,000,000
0
5,000
10,000
15,000
20,000
25,000
95 96 97 98 99 00 01 02 03 04 05 06 07 08
Gam
ing
Rev
enue
Gam
ing
Posi
tions
Iowa Gaming Historical PerformanceTotal Gaming Positions vs. Total Gaming Revenue
Total Gaming Positions Gaming Revenue
$0
$50
$100
$150
$200
$250
0
5,000
10,000
15,000
20,000
25,000
95 96 97 98 99 00 01 02 03 04 05 06 07 08
Win
Per
Pos
ition
/Day
Gam
ing
Posi
tions
Iowa Gaming Historical PerformanceTotal Gaming Positions vs. Total Win/Postions/Day
Total Gaming Positions Win per Position/Day

Iowa Gaming Market Analysis May 2009 Page 10
GVA Marquette Advisors - International Hospitality & Gaming Consultants
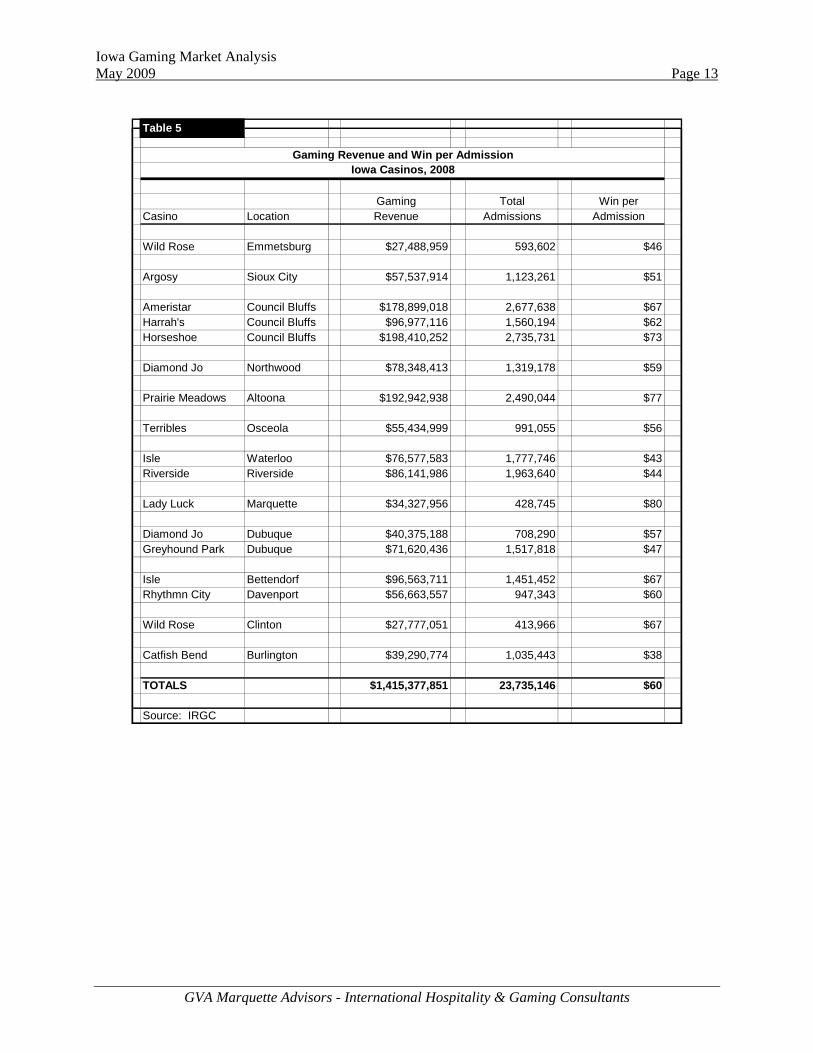
Individual Casino Performance GVA Marquette Advisors toured and analyzed each of Iowa’s casinos, in addition to reviewing historical and recent performance data for all facilities. This included published statistics through IRGC and casino visitation and net win reporting by zip code as provided by the casinos themselves through their player tracking programs. Property data sheets and photographs are provided in the Addenda. Tables 4 and 5 on the following pages summarize individual casino performance statistics for the IRGC fiscal years 2000, 2005 and 2008. The accompanying map illustrates the location of all Iowa casinos, along with competitors in adjacent states. For our analysis purposes, we have segmented the Iowa population by county and into four quadrants, along with portions of adjacent states. Our analysis of relevant demography and economic statistics for these areas is presented later in the report. The following are key points from our analysis of Iowa gaming and the revenue performance of individual casinos.
• Revenues averaged $184 per position/day at Iowa casinos in FY 2008. This is down from $204 per position/day in 2005. However, the decline in per-unit revenues reflects significant expansion within the market over the past three years, as Iowa has seen the addition of more than 6,500 gaming devices during this time. Nonetheless, per-unit performance improved from $178 in 2007 to $184 in 2008.
• There is significant variance in per-unit gaming revenues among Iowa’s casinos. Major
urban properties such as those at Council Bluffs and Des Moines sustain a steady flow of local business throughout the week, which results in a higher win per unit ($200+) compared to more remote casinos which rely more heavily upon weekend drive-in business, such as Emmetsburg, Marquette, Osceola and Clinton, where the win per unit is around $120.
• Given its size and location, and surrounding competition, we would expect Isle-Waterloo to generate a win-per unit in the $200 range. This facility is currently tracking at $80,000,000 per year, equating to about $175 per position/day. This is a new, high quality casino and resort complex which has not yet fully established itself within the Iowa market. As this facility begins to solidify its market position we would expect it to generate a win per unit of around $200.
• The Riverside Casino Resort, located just south of Iowa City, is slightly underperforming based on our review of its win-per unit statistics and hotel performance to date. However, this too is a new facility which will require more time to establish itself within the local and regional markets. Thus far, the facility seems to be generating substantial patronage from within the local Iowa City market, but must successfully penetrate more distant markets such as Cedar Rapids, Des Moines and smaller communities throughout eastern Iowa.

Casino Location 2000 2005 2008 2000 2005 2008 2000 2005 2008
Wild Rose Emmetsburg N/A N/A $27,488,959 N/A N/A 657 N/A N/A $115 Argosy Sioux City $33,488,180 $54,837,518 $57,537,914 573 734 886 $160 $205 $178
Ameristar Council Bluffs $109,565,075 $180,112,287 $178,899,018 1,646 1,835 1,842 $182 $269 $266Harrah's Council Bluffs $114,894,611 $118,923,710 $96,977,116 1,522 1,480 1,218 $207 $220 $218Horseshoe Council Bluffs $118,748,736 $132,085,471 $198,410,252 1,282 1,612 2,329 $254 $224 $233
Diamond Jo Northwood N/A N/A $78,348,413 N/A N/A 1,147 N/A N/A $187
Prairie Meadows Altoona $147,005,895 $174,357,215 $192,942,938 1,244 1,776 2,192 $324 $269 $241
Terribles Osceola $25,339,793 $56,315,383 $55,434,999 1,130 1,138 1,264 $61 $136 $120
Isle Waterloo N/A N/A $76,577,583 N/A N/A 1,257 N/A N/A $167Riverside Riverside N/A N/A $86,141,986 N/A N/A 1,628 N/A N/A $145
Lady Luck Marquette $34,134,876 $43,092,259 $34,327,956 950 877 759 $98 $135 $124
Diamond Jo 1 Dubuque $45,254,839 $52,594,861 $40,375,188 916 869 896 $135 $166 $123Greyhound Park Dubuque $35,271,560 $43,996,260 $71,620,436 600 637 1,148 $161 $189 $171
Isle Bettendorf $89,389,210 $103,900,655 $96,563,711 1,511 1,320 1,288 $162 $216 $205Rhythmn City Davenport $68,474,132 $78,210,268 $56,663,557 1,221 1,147 1,217 $154 $187 $128
Wild Rose 2 Clinton $26,578,351 $26,711,775 $27,777,051 604 604 657 $121 $121 $116
Catfish Bend 3 Burlington $30,807,058 $31,299,346 $39,290,774 743 671 851 $114 $128 $126
TOTALS $878,952,316 $1,096,437,008 $1,415,377,851 13,942 14,700 21,236 $173 $204 $184
1 Diamond Jo land based casino opens Dec. 2008, replacing boat.2 Wild Rose Casino-Clinton opens Jul. 2008, replacing Miss. Belle boat.3 Catfish Bend land based casino opens Jul. 2007, replacing boat at Ft. Madison.
Source: IRGC
Gaming Revenue (net win) by Year Win per Position/DayTotal Gaming Positions
Individual Casino Revenue PerformanceIowa Casinos, 2000, 2005, 2008
Table 4
Iowa Gaming Market -- 2008
Iowa Gaming Market Analysis May 2009 Page 13
GVA Marquette Advisors - International Hospitality & Gaming Consultants
Gaming Total Win per
Casino Location Revenue Admissions Admission
Wild Rose Emmetsburg $27,488,959 593,602 $46 Argosy Sioux City $57,537,914 1,123,261 $51
Ameristar Council Bluffs $178,899,018 2,677,638 $67Harrah's Council Bluffs $96,977,116 1,560,194 $62Horseshoe Council Bluffs $198,410,252 2,735,731 $73
Diamond Jo Northwood $78,348,413 1,319,178 $59
Prairie Meadows Altoona $192,942,938 2,490,044 $77
Terribles Osceola $55,434,999 991,055 $56
Isle Waterloo $76,577,583 1,777,746 $43Riverside Riverside $86,141,986 1,963,640 $44
Lady Luck Marquette $34,327,956 428,745 $80
Diamond Jo Dubuque $40,375,188 708,290 $57Greyhound Park Dubuque $71,620,436 1,517,818 $47
Isle Bettendorf $96,563,711 1,451,452 $67Rhythmn City Davenport $56,663,557 947,343 $60
Wild Rose Clinton $27,777,051 413,966 $67
Catfish Bend Burlington $39,290,774 1,035,443 $38
TOTALS $1,415,377,851 23,735,146 $60
Source: IRGC
Table 5
Gaming Revenue and Win per AdmissionIowa Casinos, 2008

Iowa Gaming Market Analysis May 2009 Page 14
GVA Marquette Advisors - International Hospitality & Gaming Consultants
• We believe the Riverside Casino Resort facilities are well designed, although the complex receives strong competition from Isle-Waterloo and Meskwaki, limiting its draw to the north. Further, Prairie Meadows in Altoona inhibits Riverside from gaining substantial penetration into the Des Moines market, while Isle, Rhythm City and Jumers prevent Riverside from attracting regular visitation from the Quad Cities market. Considering the competitive market, we expect that Riverside will continue to attract regular patronage from the local market, especially Iowa City, although it may struggle in its attempt to capture destination gamers with its resort facilities.
• Northeast Iowa casinos such as Lady Luck Casino in Marquette and Meskwaki have clearly experienced a loss of market share as a result of the Riverside and Isle-Waterloo developments. Meskwaki will continue to attract gamers from Des Moines, although Isle and Riverside have taken significant Waterloo, Cedar Rapids and Iowa City market share from Meskwaki. Meanwhile, Lady Luck will continue to rely upon a primarily rural, blue-collar customer base emanating from northeastern Iowa, southeastern Minnesota and southern Wisconsin.
• Isle-Waterloo and Riverside have had a less significant impact on the Dubuque facilities (Diamond Jo and Greyhound Park), since these casinos relied more upon a local customer base and markets in southwestern Wisconsin and northwest Illinois. The new Wild Rose Resort seems to have had a modest impact upon Dubuque. In December 2008, Diamond Jo opened a new high quality urban casino in Dubuque, replacing its former riverboat. Since its opening, Diamond Jo monthly revenues are up more than 35%. The development of a new replacement casino with superior amenities and atmosphere has seemingly resulted in increased gaming participation within the Dubuque market, rather than simple cannibalization, as Dubuque Greyhound Park’s casino revenues have remained fairly stable during this time.
• Terribles-Osceola gaming revenues totaled $55.4 million last year, down from $56.3 million in 2005. The addition of table games at Prairie Meadows-Altoona is partly responsible for this decline. More recently, in 2009 Terribles revenues are off approximately 8%, while Prairie Meadows revenues have held approximately steady. This trend is largely attributable to the economic recession, as Des Moines-area residents are making fewer trips to this more distant facility.
• Within the Quad Cities market, a new Jumers Casino and Resort on the Illinois side of the River had resulted in an initial redistribution of gamer visits and revenues. However the impact thus far has been modest with respect to Isle-Bettendorf and Rhythm City-Davenport. Isle’s revenues for FY-2009 are off about 6.5% compared to the prior year, while Rhythm City revenues are up about 2%.
• The 2006-built Wild Rose Casino-Emmetsburg captured net win of approximately $27.5 million in FY 2008, up from $26.4 million the prior year. The facility is located in the small town of Emmetsburg in northern Iowa. The casino attracts frequent patronage
Iowa Gaming Market Analysis May 2009 Page 15
GVA Marquette Advisors - International Hospitality & Gaming Consultants
from the local area, which is sparsely populated. Weekend drive-in business in the form of day-trippers and hotel guests comes from throughout northern Iowa and southern Minnesota. Fort Dodge to the south and Clear Lake/Mason City to the east are key feeder markets. However, the casino receives strong competition from Diamond Jo-Northwood to the east and larger resort casinos in southern Minnesota. Its distance from major cities and the location of larger casino facilities in all directions will prohibit Wild Rose-Emmetsburg from significantly expanding its customer base.
• Comparatively, the Diamond Jo Casino at Northwood, IA is strategically located on I-35 within an easy 30 to 60-minute driving distance from southern Minnesota cities including Albert Lea, Austin and Owatonna. Casino revenues totaled $78.3 million last year and have been stable in 2009. Key feeder cities within about 30 minutes also include Clear Lake and Mason City.
• The Wild Rose Casino in Clinton was completed in July of 2008. The casino draws from a local community of about 50,000 in Clinton County, and also attracts patrons from southern Wisconsin and western Illinois. The casino is projected to generate revenues of approximately $42.0 million in FY 2009. This represents a substantial increase over the $27.0 which the former riverboat facility generated within this market in recent years. It is apparent that the new superior facility, with a better atmosphere, amenity base and attached lodging, has stronger appeal within both the local and regional markets.
• The Catfish Bend Casino, located in far southeastern Iowa in the city of Burlington, was completed in July of 2007, replacing the former boat at Fort Madison. Casino revenues totaled $39.3 million in FY 2008. The economic recession appears to be impacting Catfish Bend, as FY 2009 revenues are off about 3.3%. The casino attracts regular patronage from the local Burlington (Des Moines County) market, with a population of approximately 40,000. Other feeder markets within about a 90-minute drive include Quincy and Galesburg, IL. Catfish Bend is unable to gain significant entry in nearby markets such as Iowa City and the Quad Cities due to the presence of major casinos there, and its draw into western Illinois is limited in comparison with gaming options such as Jumers in Rock Island, Pair-a-Dice Casino at Peoria and several Chicagoland gaming options.
• The Council Bluffs market is one of the top twenty gaming markets in the United States in terms of casino revenue. Three major casinos here include Ameristar, Harrah’s and Horseshoe Casino at Bluff’s Run (also owned by Harrah’s). Ameristar and Harrah’s offer large riverboat casinos with adjacent lodging and related facilities. The casinos attract strong local patronage from throughout the Omaha-Council Bluffs metro area (pop. 750,000). Lincoln, NE is also a key feeder market. As well, with extensive resort facilities the Council Bluffs casinos attract regular patronage from gamers residing throughout much of Iowa, Nebraska and northern Missouri.

Iowa Gaming Market Analysis May 2009 Page 16
GVA Marquette Advisors - International Hospitality & Gaming Consultants
• Following a major renovation and expansion in 2006, Horseshoe Casino became Iowa’s largest casino and the only land-based casino in the Omaha/Council Bluffs area, with more than 100,000 sf of gaming space on one level. Lodging is available at nearby hotels and through nearby Harrah’s. The three facilities generated combined gaming revenues of $474 million in FY 2008, up from $432 million in 2005. During this time, Horseshoe has increased its share of the Council Bluffs market from around 31% to 42%. The Council Bluffs market expanded by about $43 million between 2005 and 2008. Horseshoe revenues actually increased by more than $66 million during this timeframe, with Ameristar revenues down about $1.2 million and Harrah’s Casino Resort gaming down about $22 million. It is apparent that the Horseshoe development/expansion resulted in an increase in regional gaming participation and a redistribution of gaming trips within the market. The economic recession has impacted Council Bluffs in FY 2009, however, as market gaming revenues are off approximately 3.9%.
To summarize, the Iowa gaming market has shown substantial growth over a period of several years. Newer casinos such as Isle-Waterloo, Riverside, and the Wild Rose facilities should see a ramp-up in market share and gaming revenues over the next couple of years, although we believe the Iowa market as a whole will generally stabilize in the coming two to three years, assuming the gaming supply remains unchanged. The effect of the current recession has been modest, generally, as Iowa gaming revenues overall have held steady. Declines of 3.5% to 4.0% in Council Bluffs and Bettendorf/Davenport have been offset by gains in markets such as Dubuque, where the new land-based Diamond Jo facility has stimulated an increase in casino visitation, and Clinton, where a new land-based resort casino has resulted in a 50% increase in gaming compared to the former riverboat facility. Older casinos in the eastern and central portion of the state such as Lady Luck-Marquette, Isle-Bettendorf, Rhythm City-Bettendorf, and the Tribe-owned Meskwaki complex could see a slight decline in market share in the coming months as a result of new facilities such as Isle-Waterloo, Riverside and a new land-based Jumers Casino at Rock Island, IL.

Iowa Gaming Market Analysis May 2009 Page 17
GVA Marquette Advisors - International Hospitality & Gaming Consultants
Iowa Comparison with other U.S. Gaming Markets GVA Marquette Advisors analyzed Iowa casino revenue trends in comparison with several other U.S. gaming markets, as depicted on the table on the following page. Growth in gaming was compared with key variables including adult population and increases in the gaming supply (number of gaming positions). Data is shown for 1995, 2000, 2005, 2006, 2007, and 2008. We have also included an analysis of 2009 YTD statistics for markets where such data was available. Key points from our analysis are summarized below.
• The Iowa gaming market has seen significant growth in gaming revenues corresponding with casino development phases in the mid 1990s and 2000, and again in 2006/2007. More recently, between 2005 and 2008 Iowa gaming revenues increased from approximately $1.096 billion to $1.415 billion. This reflects an average annual growth rate of 5.8%.
• As of the end of FY 2008, the Iowa gaming supply consisted of approximately 21,000
gaming positions. There were about 111 adult residents of Iowa for each gaming position. Among the comparative markets, Indiana and Missouri most closely resemble Iowa in this regard, with 194 and 191 residents per gaming position, respectively. Destination-oriented markets such as Las Vegas and Atlantic City, along with Louisiana and Mississippi, import gamers from a broader region and nationally and thus the ratio of adult residents per gaming position is not a relevant unit of comparison. Illinois casinos benefit from a dense population base and a comparatively limited gaming supply, thereby showing a ratio of 866 adult residents per gaming position and a much higher win-per-gaming position.
• The U.S. has experienced an economic recession which has impacted gaming markets in 2008 and 2009. The Iowa gaming industry has outperformed the U.S. as a whole and many gaming submarkets, with revenue increases of 7.2% in 2008 and 0.7% in 2009. Some of the increase in 2008 is attributable to the expansion of gaming, with new facilities developed in 2006-2008. However, we have found that gaming revenues at most of Iowa’s casinos have held up well overall in spite of the economic downturn and increases in casino competition.
• Comparatively, destination markets have seen major declines in gaming revenue, most notably Las Vegas and Atlantic City. Due to the economic recessions, gamers are traveling less to such destinations and are reducing their spending while there. Meanwhile, some regional gaming markets have actually benefited, as gamers are substituting more local and regional gaming trips for destinations such as Las Vegas. We believe that Iowa has benefited as such to some degree, and from an overall state economy which has outperformed many U.S. markets.
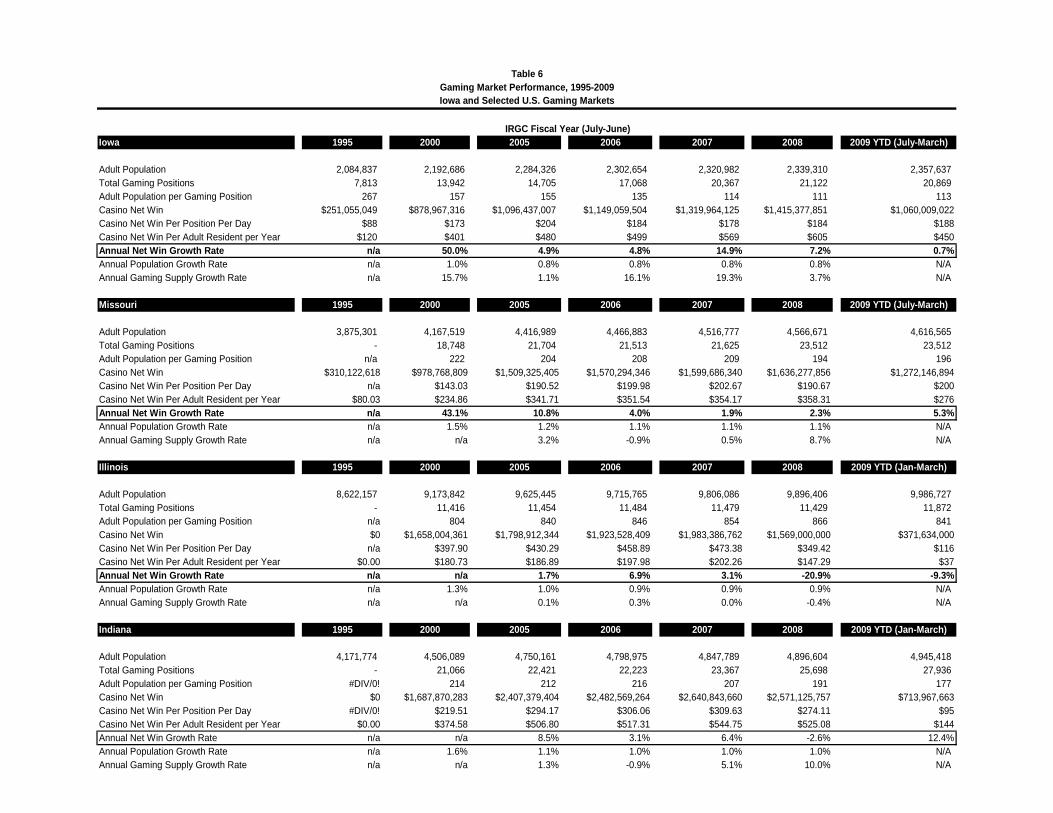
Iowa 1995 2000 2005 2006 2007 2008 2009 YTD (July-March)
Adult Population 2,084,837 2,192,686 2,284,326 2,302,654 2,320,982 2,339,310 2,357,637 Total Gaming Positions 7,813 13,942 14,705 17,068 20,367 21,122 20,869 Adult Population per Gaming Position 267 157 155 135 114 111 113 Casino Net Win $251,055,049 $878,967,316 $1,096,437,007 $1,149,059,504 $1,319,964,125 $1,415,377,851 $1,060,009,022Casino Net Win Per Position Per Day $88 $173 $204 $184 $178 $184 $188Casino Net Win Per Adult Resident per Year $120 $401 $480 $499 $569 $605 $450Annual Net Win Growth Rate n/a 50.0% 4.9% 4.8% 14.9% 7.2% 0.7%Annual Population Growth Rate n/a 1.0% 0.8% 0.8% 0.8% 0.8% N/AAnnual Gaming Supply Growth Rate n/a 15.7% 1.1% 16.1% 19.3% 3.7% N/A
Missouri 1995 2000 2005 2006 2007 2008 2009 YTD (July-March)
Adult Population 3,875,301 4,167,519 4,416,989 4,466,883 4,516,777 4,566,671 4,616,565 Total Gaming Positions - 18,748 21,704 21,513 21,625 23,512 23,512 Adult Population per Gaming Position n/a 222 204 208 209 194 196 Casino Net Win $310,122,618 $978,768,809 $1,509,325,405 $1,570,294,346 $1,599,686,340 $1,636,277,856 $1,272,146,894Casino Net Win Per Position Per Day n/a $143.03 $190.52 $199.98 $202.67 $190.67 $200Casino Net Win Per Adult Resident per Year $80.03 $234.86 $341.71 $351.54 $354.17 $358.31 $276Annual Net Win Growth Rate n/a 43.1% 10.8% 4.0% 1.9% 2.3% 5.3%Annual Population Growth Rate n/a 1.5% 1.2% 1.1% 1.1% 1.1% N/AAnnual Gaming Supply Growth Rate n/a n/a 3.2% -0.9% 0.5% 8.7% N/A
Illinois 1995 2000 2005 2006 2007 2008 2009 YTD (Jan-March)
Adult Population 8,622,157 9,173,842 9,625,445 9,715,765 9,806,086 9,896,406 9,986,727 Total Gaming Positions - 11,416 11,454 11,484 11,479 11,429 11,872 Adult Population per Gaming Position n/a 804 840 846 854 866 841 Casino Net Win $0 $1,658,004,361 $1,798,912,344 $1,923,528,409 $1,983,386,762 $1,569,000,000 $371,634,000Casino Net Win Per Position Per Day n/a $397.90 $430.29 $458.89 $473.38 $349.42 $116Casino Net Win Per Adult Resident per Year $0.00 $180.73 $186.89 $197.98 $202.26 $147.29 $37Annual Net Win Growth Rate n/a n/a 1.7% 6.9% 3.1% -20.9% -9.3%Annual Population Growth Rate n/a 1.3% 1.0% 0.9% 0.9% 0.9% N/AAnnual Gaming Supply Growth Rate n/a n/a 0.1% 0.3% 0.0% -0.4% N/A
Indiana 1995 2000 2005 2006 2007 2008 2009 YTD (Jan-March)
Adult Population 4,171,774 4,506,089 4,750,161 4,798,975 4,847,789 4,896,604 4,945,418 Total Gaming Positions - 21,066 22,421 22,223 23,367 25,698 27,936 Adult Population per Gaming Position #DIV/0! 214 212 216 207 191 177 Casino Net Win $0 $1,687,870,283 $2,407,379,404 $2,482,569,264 $2,640,843,660 $2,571,125,757 $713,967,663Casino Net Win Per Position Per Day #DIV/0! $219.51 $294.17 $306.06 $309.63 $274.11 $95Casino Net Win Per Adult Resident per Year $0.00 $374.58 $506.80 $517.31 $544.75 $525.08 $144Annual Net Win Growth Rate n/a n/a 8.5% 3.1% 6.4% -2.6% 12.4%Annual Population Growth Rate n/a 1.6% 1.1% 1.0% 1.0% 1.0% N/AAnnual Gaming Supply Growth Rate n/a n/a 1.3% -0.9% 5.1% 10.0% N/A
IRGC Fiscal Year (July-June)
Table 6Gaming Market Performance, 1995-2009Iowa and Selected U.S. Gaming Markets
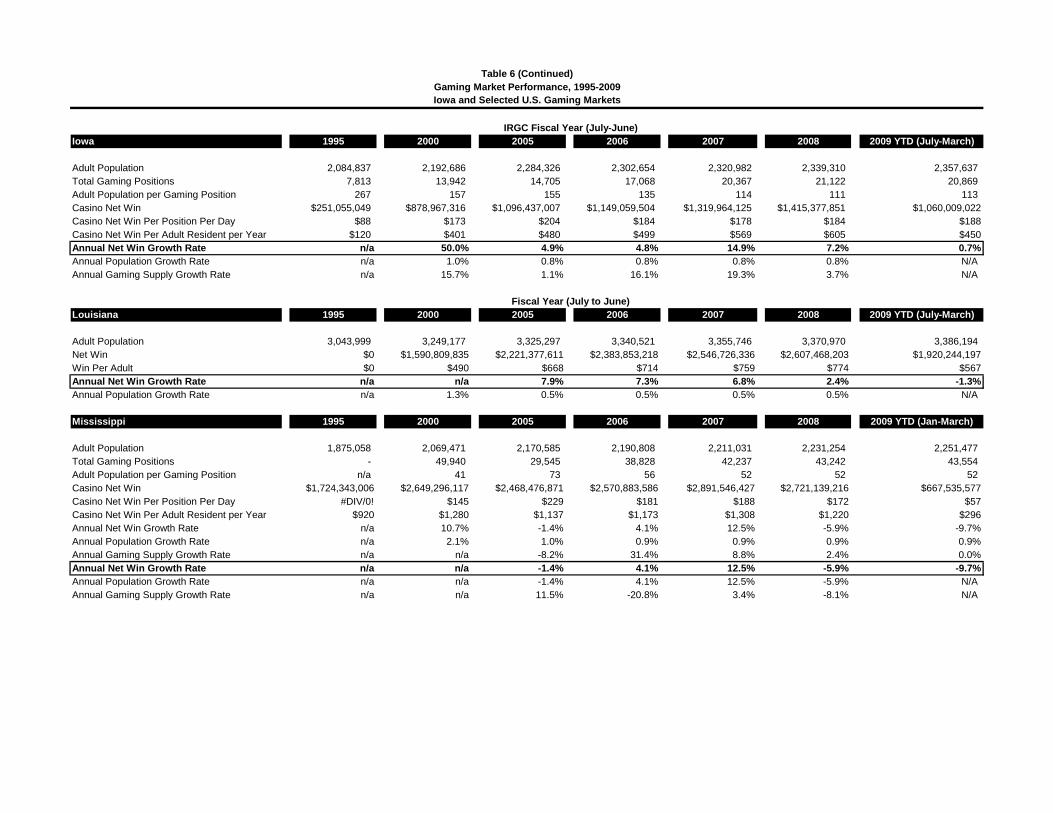
Iowa 1995 2000 2005 2006 2007 2008 2009 YTD (July-March)
Adult Population 2,084,837 2,192,686 2,284,326 2,302,654 2,320,982 2,339,310 2,357,637 Total Gaming Positions 7,813 13,942 14,705 17,068 20,367 21,122 20,869 Adult Population per Gaming Position 267 157 155 135 114 111 113 Casino Net Win $251,055,049 $878,967,316 $1,096,437,007 $1,149,059,504 $1,319,964,125 $1,415,377,851 $1,060,009,022Casino Net Win Per Position Per Day $88 $173 $204 $184 $178 $184 $188Casino Net Win Per Adult Resident per Year $120 $401 $480 $499 $569 $605 $450Annual Net Win Growth Rate n/a 50.0% 4.9% 4.8% 14.9% 7.2% 0.7%Annual Population Growth Rate n/a 1.0% 0.8% 0.8% 0.8% 0.8% N/AAnnual Gaming Supply Growth Rate n/a 15.7% 1.1% 16.1% 19.3% 3.7% N/A
Louisiana 1995 2000 2005 2006 2007 2008 2009 YTD (July-March)
Adult Population 3,043,999 3,249,177 3,325,297 3,340,521 3,355,746 3,370,970 3,386,194 Net Win $0 $1,590,809,835 $2,221,377,611 $2,383,853,218 $2,546,726,336 $2,607,468,203 $1,920,244,197Win Per Adult $0 $490 $668 $714 $759 $774 $567Annual Net Win Growth Rate n/a n/a 7.9% 7.3% 6.8% 2.4% -1.3%Annual Population Growth Rate n/a 1.3% 0.5% 0.5% 0.5% 0.5% N/A
Mississippi 1995 2000 2005 2006 2007 2008 2009 YTD (Jan-March)
Adult Population 1,875,058 2,069,471 2,170,585 2,190,808 2,211,031 2,231,254 2,251,477 Total Gaming Positions - 49,940 29,545 38,828 42,237 43,242 43,554 Adult Population per Gaming Position n/a 41 73 56 52 52 52 Casino Net Win $1,724,343,006 $2,649,296,117 $2,468,476,871 $2,570,883,586 $2,891,546,427 $2,721,139,216 $667,535,577Casino Net Win Per Position Per Day #DIV/0! $145 $229 $181 $188 $172 $57Casino Net Win Per Adult Resident per Year $920 $1,280 $1,137 $1,173 $1,308 $1,220 $296Annual Net Win Growth Rate n/a 10.7% -1.4% 4.1% 12.5% -5.9% -9.7%Annual Population Growth Rate n/a 2.1% 1.0% 0.9% 0.9% 0.9% 0.9%Annual Gaming Supply Growth Rate n/a n/a -8.2% 31.4% 8.8% 2.4% 0.0%Annual Net Win Growth Rate n/a n/a -1.4% 4.1% 12.5% -5.9% -9.7%Annual Population Growth Rate n/a n/a -1.4% 4.1% 12.5% -5.9% N/AAnnual Gaming Supply Growth Rate n/a n/a 11.5% -20.8% 3.4% -8.1% N/A
IRGC Fiscal Year (July-June)
Fiscal Year (July to June)
Table 6 (Continued)Gaming Market Performance, 1995-2009Iowa and Selected U.S. Gaming Markets
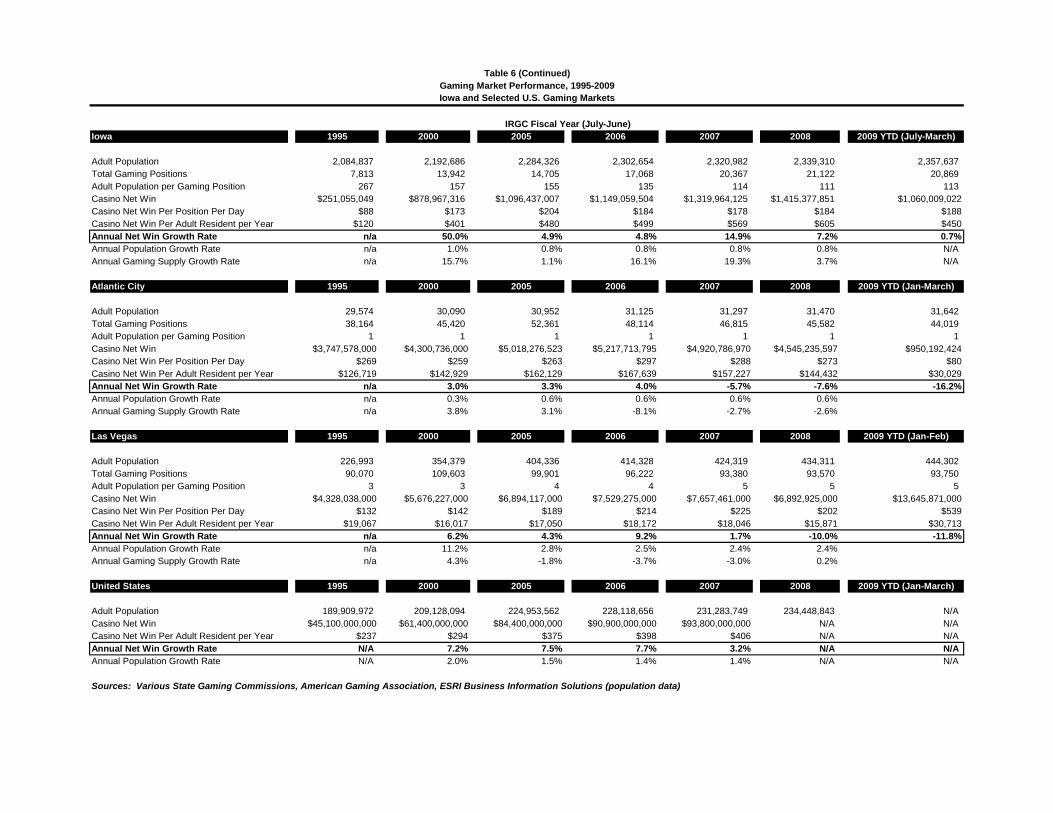
Iowa 1995 2000 2005 2006 2007 2008 2009 YTD (July-March)
Adult Population 2,084,837 2,192,686 2,284,326 2,302,654 2,320,982 2,339,310 2,357,637 Total Gaming Positions 7,813 13,942 14,705 17,068 20,367 21,122 20,869 Adult Population per Gaming Position 267 157 155 135 114 111 113 Casino Net Win $251,055,049 $878,967,316 $1,096,437,007 $1,149,059,504 $1,319,964,125 $1,415,377,851 $1,060,009,022Casino Net Win Per Position Per Day $88 $173 $204 $184 $178 $184 $188Casino Net Win Per Adult Resident per Year $120 $401 $480 $499 $569 $605 $450Annual Net Win Growth Rate n/a 50.0% 4.9% 4.8% 14.9% 7.2% 0.7%Annual Population Growth Rate n/a 1.0% 0.8% 0.8% 0.8% 0.8% N/AAnnual Gaming Supply Growth Rate n/a 15.7% 1.1% 16.1% 19.3% 3.7% N/A
Atlantic City 1995 2000 2005 2006 2007 2008 2009 YTD (Jan-March)
Adult Population 29,574 30,090 30,952 31,125 31,297 31,470 31,642 Total Gaming Positions 38,164 45,420 52,361 48,114 46,815 45,582 44,019 Adult Population per Gaming Position 1 1 1 1 1 1 1 Casino Net Win $3,747,578,000 $4,300,736,000 $5,018,276,523 $5,217,713,795 $4,920,786,970 $4,545,235,597 $950,192,424Casino Net Win Per Position Per Day $269 $259 $263 $297 $288 $273 $80Casino Net Win Per Adult Resident per Year $126,719 $142,929 $162,129 $167,639 $157,227 $144,432 $30,029Annual Net Win Growth Rate n/a 3.0% 3.3% 4.0% -5.7% -7.6% -16.2%Annual Population Growth Rate n/a 0.3% 0.6% 0.6% 0.6% 0.6%Annual Gaming Supply Growth Rate n/a 3.8% 3.1% -8.1% -2.7% -2.6%
Las Vegas 1995 2000 2005 2006 2007 2008 2009 YTD (Jan-Feb)
Adult Population 226,993 354,379 404,336 414,328 424,319 434,311 444,302 Total Gaming Positions 90,070 109,603 99,901 96,222 93,380 93,570 93,750 Adult Population per Gaming Position 3 3 4 4 5 5 5 Casino Net Win $4,328,038,000 $5,676,227,000 $6,894,117,000 $7,529,275,000 $7,657,461,000 $6,892,925,000 $13,645,871,000Casino Net Win Per Position Per Day $132 $142 $189 $214 $225 $202 $539Casino Net Win Per Adult Resident per Year $19,067 $16,017 $17,050 $18,172 $18,046 $15,871 $30,713Annual Net Win Growth Rate n/a 6.2% 4.3% 9.2% 1.7% -10.0% -11.8%Annual Population Growth Rate n/a 11.2% 2.8% 2.5% 2.4% 2.4%Annual Gaming Supply Growth Rate n/a 4.3% -1.8% -3.7% -3.0% 0.2%
United States 1995 2000 2005 2006 2007 2008 2009 YTD (Jan-March)
Adult Population 189,909,972 209,128,094 224,953,562 228,118,656 231,283,749 234,448,843 N/ACasino Net Win $45,100,000,000 $61,400,000,000 $84,400,000,000 $90,900,000,000 $93,800,000,000 N/A N/ACasino Net Win Per Adult Resident per Year $237 $294 $375 $398 $406 N/A N/AAnnual Net Win Growth Rate N/A 7.2% 7.5% 7.7% 3.2% N/A N/AAnnual Population Growth Rate N/A 2.0% 1.5% 1.4% 1.4% N/A N/A
Sources: Various State Gaming Commissions, American Gaming Association, ESRI Business Information Solutions (population data)
IRGC Fiscal Year (July-June)
Table 6 (Continued)Gaming Market Performance, 1995-2009Iowa and Selected U.S. Gaming Markets

Iowa Gaming Market Analysis May 2009 Page 21
GVA Marquette Advisors - International Hospitality & Gaming Consultants
Overall, from our analysis of Iowa gaming revenues and various related indicators, most importantly the gaming supply relative to the state and regional population base, the location of casinos related to key population centers, and household incomes and consumer spending patterns throughout the state, we believe that the Iowa gaming market, while not “saturated” is approaching maximum penetration with respect to the regional population base. An exception may be in the far northeastern portion of the state, in proximity to nearby Sioux Falls, SD. This issue is discussed in detail in forthcoming sections. In conclusion, while newer casinos in Iowa will likely see continued “ramp-up” in revenues over the next couple of years, we believe that the market overall is more likely to see growth rates corresponding with overall adult population and income growth rates for the region.

Iowa Gaming Market Analysis May 2009 Page 22
GVA Marquette Advisors - International Hospitality & Gaming Consultants
REGIONAL DEMOGRAPHY & ECONOMICS Gaming Demand Indicators The amount of gaming demand that exists in a market is a function of the following major factors:
• Population • Income • Quantity of gaming facilities • Quality and amenities of gaming facilities • Proximity and convenience of gaming facilities • Variety and quality of entertainment alternatives
In evaluating the potential gaming market available for a gaming market as a whole, or a particular new casino, each of these factors must be weighed in relation to the particular characteristics of the market. These factors are discussed in greater detail below.
Quantity of gaming facilities: The number of gaming devices and tables present in a market in relation to the population base available is a major determinant of the performance of those gaming devices and tables. To a certain extent, the gaming dollars available in a market are spread over the number of devices in that market. However this relationship is not constant. In most markets where multiple casinos exist, the local population has a tendency to participate more frequently, due to the convenience and variety of gaming facilities available, thereby expanding the pool of gaming dollars. For example, if a second casino of similar size were added to a market, the first casino would not be expected to lose one-half its volume. Instead, the total gaming volume available to the two casinos would be expected to increase somewhat, for both casinos to share, although some dilution of the first casino’s business would occur. As a market begins to approach equilibrium between the supply of gaming positions and the gaming demand available within that market, however, each additional expansion has an increasingly larger dilutive effect on the overall market. We believe that Iowa is in fact approaching an equilibrium situation, perhaps with the exception of the northwestern portion of the state which could potentially capture additional revenues from the Sioux Falls, SD area. This issue is obviously discussed in great detail in forthcoming sections. Depending upon the facilities and infrastructure of the casino itself and the surrounding area, a casino’s market need not be entirely limited by the local or even regional population base present. To the extent the population base in the region is low, significant demand can be imported from elsewhere, particularly from places where gaming is not available. Hotels and bussing programs can import demand. Las Vegas is an extreme example of a market that has developed such a large concentration of gaming facilities and amenities that they attract patrons from around the world.
Iowa Gaming Market Analysis May 2009 Page 23
GVA Marquette Advisors - International Hospitality & Gaming Consultants
Proximity and convenience of gaming facilities: Related to the quantity of gaming facilities is the proximity and convenience factor in influencing gaming demand. People are more likely to visit a casino that is close to their home and/or is easily accessed. This is especially true during an economic recession (such as the current situation within the U.S.) and in periods of rising fuel and travel costs. During these periods, people are much more likely to visit those casinos which are closest to their residence most frequently, making fewer visits to more distant gaming facilities. Quality and amenities of gaming facilities: A casino that features onsite lodging and other complimentary amenities, in addition to an overall high quality gaming environment will entice the area population to visit more frequently and will encourage people to travel a greater distance, thereby increasing the casino’s market share and possibly increasing the size of the area’s gaming pool. Hotels have the single most direct impact on a casino’s ability to attract gamers from a greater distance. Meanwhile, restaurants often assist a casino in attracting more frequent visits among a local or regional population base, especially since many casino customers combine a meal with their casino visit. A casino with high quality, appropriately priced dining options can gain a significant advantage over another nearby with more limited dining options and/or poor quality food and beverage. Variety and quality of entertainment alternatives: A population’s propensity to participate in gaming activities is also influenced by the variety and quality of entertainment alternatives available to them. In general, urban populations that have movies, shopping, sporting events, restaurants and other entertainment alternatives readily available tend to participate in gaming activities less frequently than do rural populations that do not have these activities conveniently available. For example, persons residing in the Des Moines area have a more diverse variety of recreational and entertainment options as compared to persons residing in a smaller community in rural Iowa. Therefore, gaming participation rates are often higher in rural areas within conveniently located gaming facilities in the area, since there are fewer alternative leisure activities. Gaming participation rates can increase also in urban areas where multiple casinos exist.
As discussed in the previous section, GVA Marquette analyzed the Iowa casino supply in detail, including a review of their gaming and amenity components. In this section of the report we focus on the following key underlying demand-side factors which drive casino performance, those being population and income growth, as well as the overall health of the regional economy, best indicated by the employment situation.
Population: The most fundamental economic factor affecting casino performance is the number of people in the market, specifically the number of adults of gaming age. Although the correlation is not necessarily direct, the population base in the surrounding region is a major determinant of the number of gaming devices and tables an area can support.
Iowa Gaming Market Analysis May 2009 Page 24
GVA Marquette Advisors - International Hospitality & Gaming Consultants
Income: Income also plays an important role in affecting the performance potential of a casino market. However, the exact role played is not as obvious as it might seem. The gaming industry has long known that its reputation as being attractive primarily to under-educated, lower income classes was completely false. Rather the propensity to gamble tends to increase with income. Certainly casino executives spend a great deal of effort and money to attract and cater to high-income patrons.
Nevertheless, it also does not follow that the higher the average income in a particular market, the larger the gaming pool and the higher the average expenditure per person will be at the casino. The average win per person is far more directly influenced by the regulatory environment within which the casino operates and the overall level of competition present within the market. Markets in which casino play is inhibited by such regulations as table game limits, restricted games, and loss limits generally experience lower win per person characteristics than do less regulated markets. Similarly, casinos in markets where there is little competition generally experience higher levels of play that result in higher win per person. Rather, the importance of income comes as a supplement to the population base and tourism potential by determining the total pool of dollars available to be spent on discretionary activities such as casino gaming. Another way of examining that pool of dollars is to look at existing expenditures on entertainment and recreation. Based upon statistics from ESRI Business Information Solutions, a nationally recognized econometric forecasting firm, entertainment and recreation expenditures and restaurant spending by Iowa residents were estimated at more than $7.6 billion in 2008. Clearly, the pool of available dollars for spending on entertainment and recreation within the State of Iowa, including casino gaming, is enormous. Obviously, Iowa casino revenues also attract substantial additional revenues from persons residing in neighboring states, especially those casinos located near Iowa’s borders.
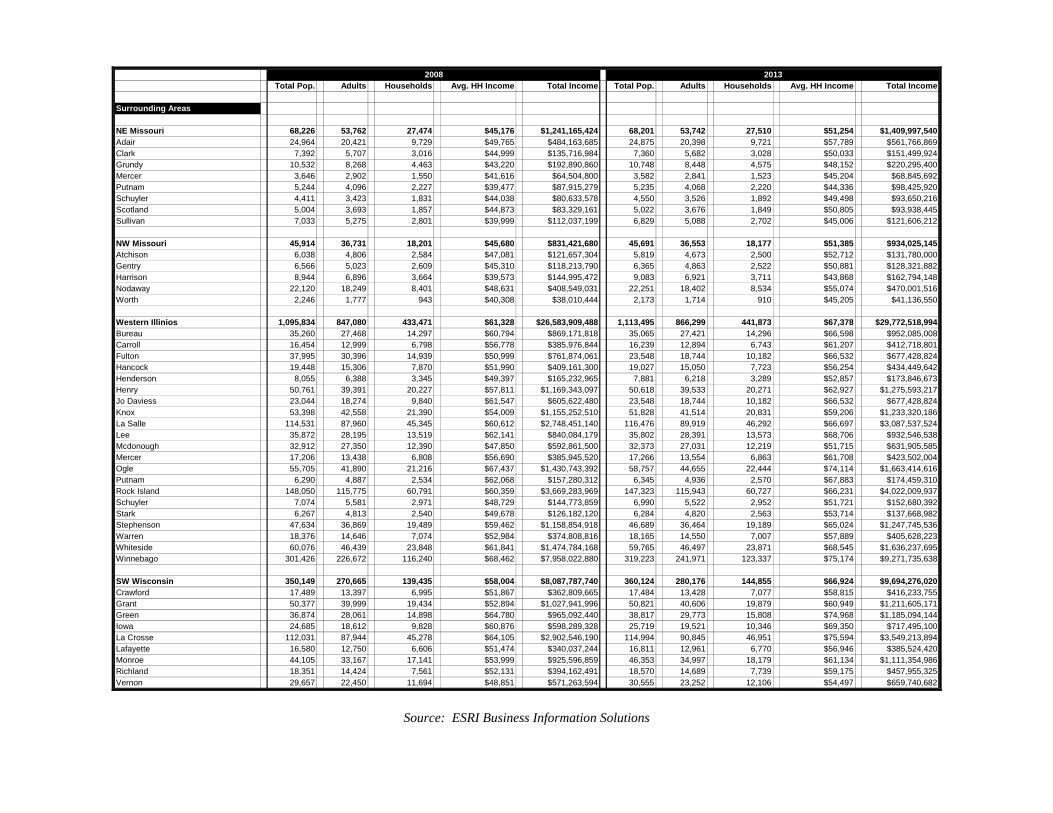
Population & Income Growth Trends: Iowa Gaming Market Area For our analysis purposes, GVA Marquette Advisors divided the state of Iowa into four quadrants, including northwest, southwest, northeast and southeast. We reviewed population and household income data by county, and for each quadrant. As well, we analyzed growth trends for counties within portions of each neighboring state. The map on the following page illustrates our market segmentation. Based on our review of player tracking data as provided by Iowa casino operators, this area as a whole provides the vast majority of customer visits to Iowa casinos. The map on the following page is followed by Table 7, which summarizes population and income growth by county for all of Iowa and relevant portions of adjacent states.
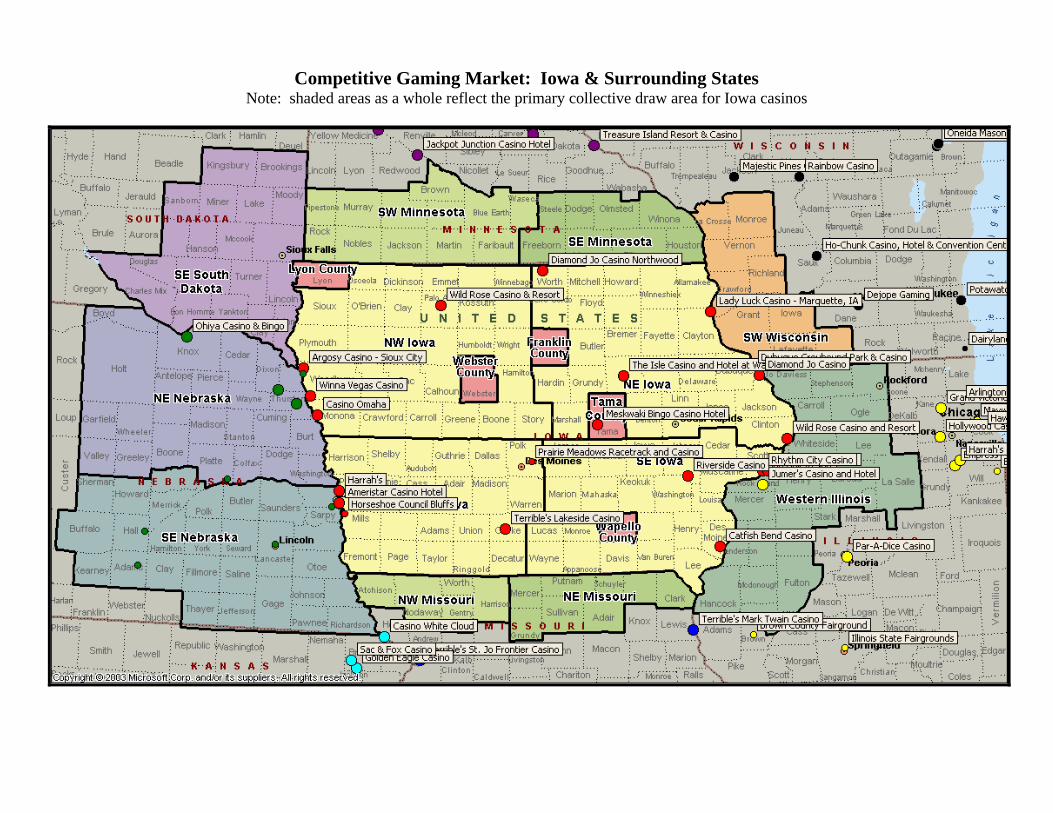
Competitive Gaming Market: Iowa & Surrounding States Note: shaded areas as a whole reflect the primary collective draw area for Iowa casinos
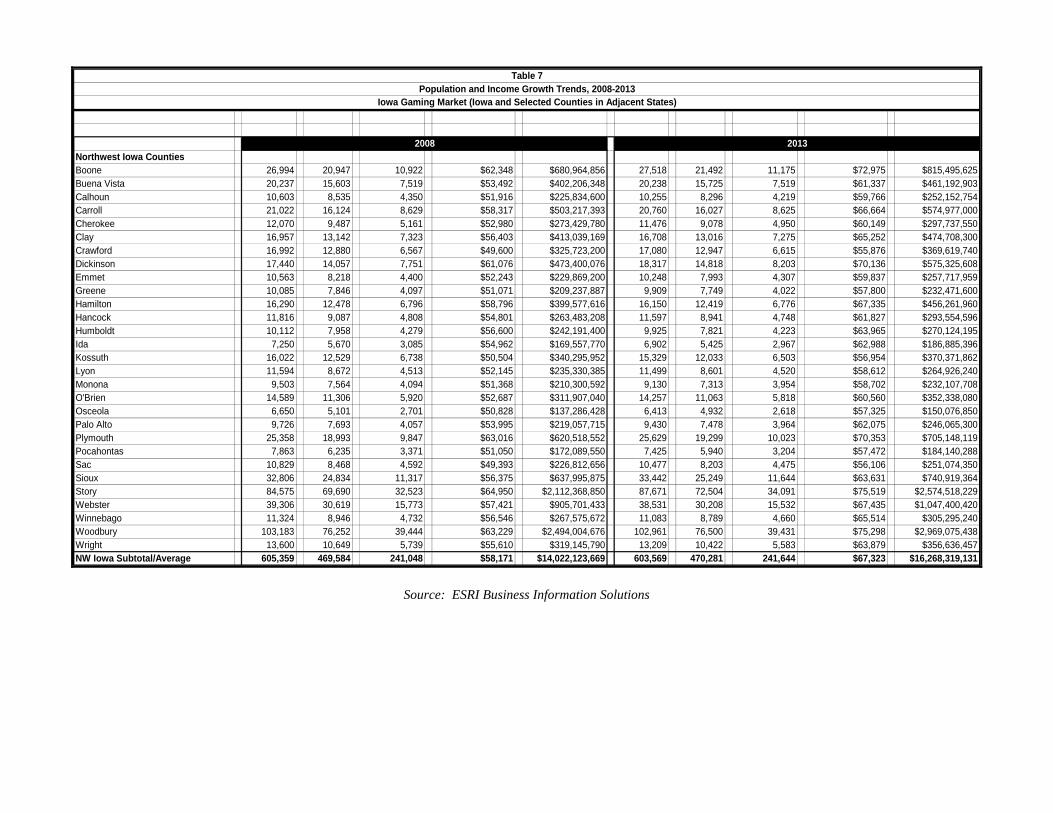
Northwest Iowa CountiesBoone 26,994 20,947 10,922 $62,348 $680,964,856 27,518 21,492 11,175 $72,975 $815,495,625Buena Vista 20,237 15,603 7,519 $53,492 $402,206,348 20,238 15,725 7,519 $61,337 $461,192,903Calhoun 10,603 8,535 4,350 $51,916 $225,834,600 10,255 8,296 4,219 $59,766 $252,152,754Carroll 21,022 16,124 8,629 $58,317 $503,217,393 20,760 16,027 8,625 $66,664 $574,977,000Cherokee 12,070 9,487 5,161 $52,980 $273,429,780 11,476 9,078 4,950 $60,149 $297,737,550Clay 16,957 13,142 7,323 $56,403 $413,039,169 16,708 13,016 7,275 $65,252 $474,708,300Crawford 16,992 12,880 6,567 $49,600 $325,723,200 17,080 12,947 6,615 $55,876 $369,619,740Dickinson 17,440 14,057 7,751 $61,076 $473,400,076 18,317 14,818 8,203 $70,136 $575,325,608Emmet 10,563 8,218 4,400 $52,243 $229,869,200 10,248 7,993 4,307 $59,837 $257,717,959Greene 10,085 7,846 4,097 $51,071 $209,237,887 9,909 7,749 4,022 $57,800 $232,471,600Hamilton 16,290 12,478 6,796 $58,796 $399,577,616 16,150 12,419 6,776 $67,335 $456,261,960Hancock 11,816 9,087 4,808 $54,801 $263,483,208 11,597 8,941 4,748 $61,827 $293,554,596Humboldt 10,112 7,958 4,279 $56,600 $242,191,400 9,925 7,821 4,223 $63,965 $270,124,195Ida 7,250 5,670 3,085 $54,962 $169,557,770 6,902 5,425 2,967 $62,988 $186,885,396Kossuth 16,022 12,529 6,738 $50,504 $340,295,952 15,329 12,033 6,503 $56,954 $370,371,862Lyon 11,594 8,672 4,513 $52,145 $235,330,385 11,499 8,601 4,520 $58,612 $264,926,240Monona 9,503 7,564 4,094 $51,368 $210,300,592 9,130 7,313 3,954 $58,702 $232,107,708O'Brien 14,589 11,306 5,920 $52,687 $311,907,040 14,257 11,063 5,818 $60,560 $352,338,080Osceola 6,650 5,101 2,701 $50,828 $137,286,428 6,413 4,932 2,618 $57,325 $150,076,850Palo Alto 9,726 7,693 4,057 $53,995 $219,057,715 9,430 7,478 3,964 $62,075 $246,065,300Plymouth 25,358 18,993 9,847 $63,016 $620,518,552 25,629 19,299 10,023 $70,353 $705,148,119Pocahontas 7,863 6,235 3,371 $51,050 $172,089,550 7,425 5,940 3,204 $57,472 $184,140,288Sac 10,829 8,468 4,592 $49,393 $226,812,656 10,477 8,203 4,475 $56,106 $251,074,350Sioux 32,806 24,834 11,317 $56,375 $637,995,875 33,442 25,249 11,644 $63,631 $740,919,364Story 84,575 69,690 32,523 $64,950 $2,112,368,850 87,671 72,504 34,091 $75,519 $2,574,518,229Webster 39,306 30,619 15,773 $57,421 $905,701,433 38,531 30,208 15,532 $67,435 $1,047,400,420Winnebago 11,324 8,946 4,732 $56,546 $267,575,672 11,083 8,789 4,660 $65,514 $305,295,240Woodbury 103,183 76,252 39,444 $63,229 $2,494,004,676 102,961 76,500 39,431 $75,298 $2,969,075,438Wright 13,600 10,649 5,739 $55,610 $319,145,790 13,209 10,422 5,583 $63,879 $356,636,457NW Iowa Subtotal/Average 605,359 469,584 241,048 $58,171 $14,022,123,669 603,569 470,281 241,644 $67,323 $16,268,319,131
2008 2013
Population and Income Growth Trends, 2008-2013Iowa Gaming Market (Iowa and Selected Counties in Adjacent States)
Table 7
Source: ESRI Business Information Solutions
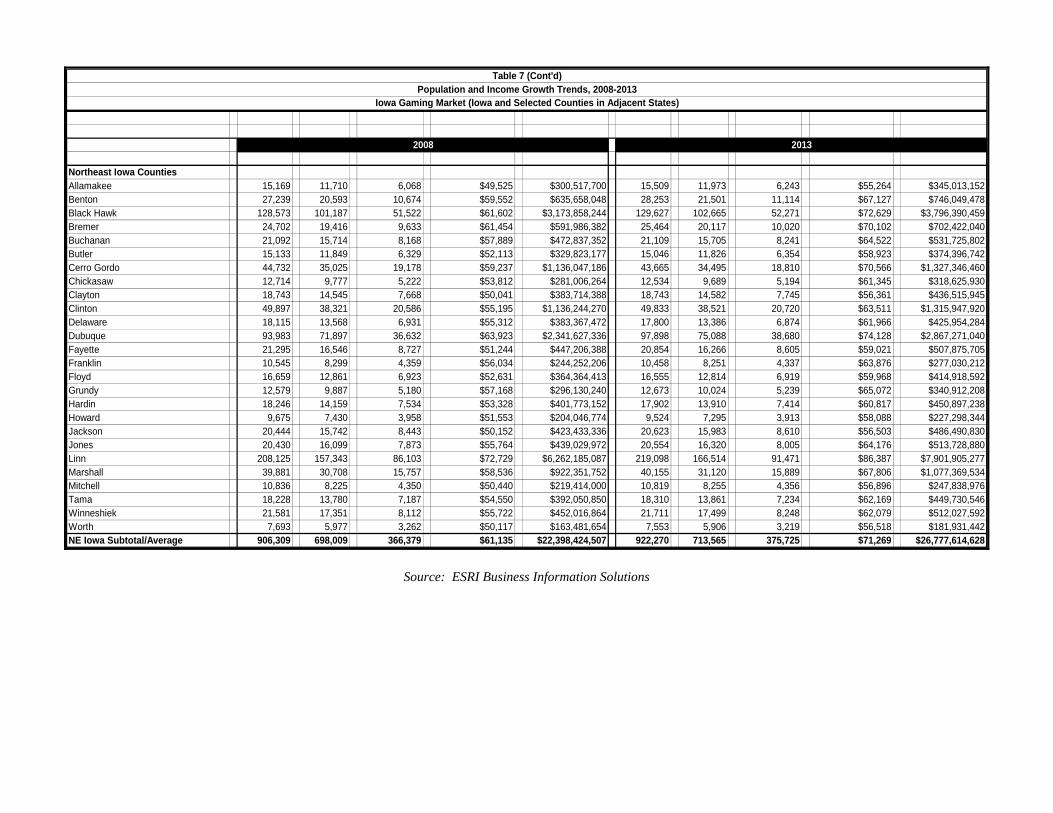
Northeast Iowa CountiesAllamakee 15,169 11,710 6,068 $49,525 $300,517,700 15,509 11,973 6,243 $55,264 $345,013,152Benton 27,239 20,593 10,674 $59,552 $635,658,048 28,253 21,501 11,114 $67,127 $746,049,478Black Hawk 128,573 101,187 51,522 $61,602 $3,173,858,244 129,627 102,665 52,271 $72,629 $3,796,390,459Bremer 24,702 19,416 9,633 $61,454 $591,986,382 25,464 20,117 10,020 $70,102 $702,422,040Buchanan 21,092 15,714 8,168 $57,889 $472,837,352 21,109 15,705 8,241 $64,522 $531,725,802Butler 15,133 11,849 6,329 $52,113 $329,823,177 15,046 11,826 6,354 $58,923 $374,396,742Cerro Gordo 44,732 35,025 19,178 $59,237 $1,136,047,186 43,665 34,495 18,810 $70,566 $1,327,346,460Chickasaw 12,714 9,777 5,222 $53,812 $281,006,264 12,534 9,689 5,194 $61,345 $318,625,930Clayton 18,743 14,545 7,668 $50,041 $383,714,388 18,743 14,582 7,745 $56,361 $436,515,945Clinton 49,897 38,321 20,586 $55,195 $1,136,244,270 49,833 38,521 20,720 $63,511 $1,315,947,920Delaware 18,115 13,568 6,931 $55,312 $383,367,472 17,800 13,386 6,874 $61,966 $425,954,284Dubuque 93,983 71,897 36,632 $63,923 $2,341,627,336 97,898 75,088 38,680 $74,128 $2,867,271,040Fayette 21,295 16,546 8,727 $51,244 $447,206,388 20,854 16,266 8,605 $59,021 $507,875,705Franklin 10,545 8,299 4,359 $56,034 $244,252,206 10,458 8,251 4,337 $63,876 $277,030,212Floyd 16,659 12,861 6,923 $52,631 $364,364,413 16,555 12,814 6,919 $59,968 $414,918,592Grundy 12,579 9,887 5,180 $57,168 $296,130,240 12,673 10,024 5,239 $65,072 $340,912,208Hardin 18,246 14,159 7,534 $53,328 $401,773,152 17,902 13,910 7,414 $60,817 $450,897,238Howard 9,675 7,430 3,958 $51,553 $204,046,774 9,524 7,295 3,913 $58,088 $227,298,344Jackson 20,444 15,742 8,443 $50,152 $423,433,336 20,623 15,983 8,610 $56,503 $486,490,830Jones 20,430 16,099 7,873 $55,764 $439,029,972 20,554 16,320 8,005 $64,176 $513,728,880Linn 208,125 157,343 86,103 $72,729 $6,262,185,087 219,098 166,514 91,471 $86,387 $7,901,905,277Marshall 39,881 30,708 15,757 $58,536 $922,351,752 40,155 31,120 15,889 $67,806 $1,077,369,534Mitchell 10,836 8,225 4,350 $50,440 $219,414,000 10,819 8,255 4,356 $56,896 $247,838,976Tama 18,228 13,780 7,187 $54,550 $392,050,850 18,310 13,861 7,234 $62,169 $449,730,546Winneshiek 21,581 17,351 8,112 $55,722 $452,016,864 21,711 17,499 8,248 $62,079 $512,027,592Worth 7,693 5,977 3,262 $50,117 $163,481,654 7,553 5,906 3,219 $56,518 $181,931,442NE Iowa Subtotal/Average 906,309 698,009 366,379 $61,135 $22,398,424,507 922,270 713,565 375,725 $71,269 $26,777,614,628
2008 2013
Population and Income Growth Trends, 2008-2013Iowa Gaming Market (Iowa and Selected Counties in Adjacent States)
Table 7 (Cont'd)
Source: ESRI Business Information Solutions

Total Pop. Adults Households Avg. HH Income Total Income Total Pop. Adults Households Avg. HH Income Total IncomeSouthwest Iowa CountiesAdair 7,892 6,227 3,326 $50,807 $168,984,082 7,612 6,021 3,219 $57,335 $184,561,365Adams 4,190 3,285 1,781 $45,288 $80,657,928 4,006 3,153 1,708 $50,827 $86,812,516Audubon 6,621 5,131 2,739 $52,096 $142,690,944 6,495 5,047 2,695 $59,607 $160,640,865Cass 14,397 11,417 6,156 $49,447 $304,395,732 14,181 11,302 6,097 $56,128 $342,212,416Clarke 9,293 7,128 3,661 $50,943 $186,502,323 9,361 7,208 3,686 $57,360 $211,428,960Dallas 59,960 43,111 23,434 $77,387 $1,813,486,958 77,512 55,809 30,432 $90,766 $2,762,190,912Decatur 8,575 6,774 3,325 $44,686 $148,580,950 8,496 6,720 3,298 $50,887 $167,825,326Fremont 7,841 6,147 3,209 $54,316 $174,300,044 7,739 6,091 3,183 $61,199 $194,796,417Guthrie 11,662 9,143 4,896 $57,875 $283,356,000 11,846 9,335 4,995 $66,427 $331,802,865Harrison 15,982 12,274 6,377 $54,771 $349,274,667 16,155 12,504 6,475 $62,011 $401,521,225Madison 15,930 11,932 6,203 $61,078 $378,866,834 17,414 13,095 6,806 $69,356 $472,036,936Mills 15,508 11,895 5,841 $62,391 $364,425,831 16,389 12,685 6,217 $71,184 $442,550,928Montgomery 11,230 8,692 4,740 $48,776 $231,198,240 10,923 8,531 4,620 $55,300 $255,486,000Page 16,302 12,813 6,556 $53,225 $348,943,100 15,836 12,510 6,401 $61,126 $391,267,526Polk 421,934 315,607 172,266 $77,032 $13,269,994,512 459,195 345,315 188,457 $92,829 $17,494,274,853Pottawattamie 92,123 70,290 36,407 $63,826 $2,323,713,182 94,389 72,585 37,540 $75,526 $2,835,246,040Ringgold 5,372 4,206 2,244 $43,723 $98,114,412 5,299 4,128 2,218 $49,260 $109,258,680Shelby 12,661 9,749 5,157 $53,703 $276,946,371 12,309 9,539 5,048 $60,338 $304,586,224Taylor 6,604 5,131 2,736 $46,517 $127,270,512 6,411 4,981 2,663 $52,810 $140,633,030Union 11,996 9,465 5,282 $49,650 $262,251,300 11,810 9,342 5,252 $56,715 $297,867,180Warren 45,284 34,235 16,894 $70,201 $1,185,975,694 48,584 36,827 18,317 $80,034 $1,465,982,778SW Iowa Subtotal/Average 801,357 604,652 323,230 $69,672 $22,519,929,616 861,962 652,727 349,327 $83,168 $29,052,983,042
Southeast Iowa CountiesAppanoose 13,402 10,547 5,803 $43,666 $253,393,798 13,208 10,448 5,757 $49,714 $286,203,498Cedar 18,728 14,477 7,545 $57,383 $432,954,735 19,073 14,801 7,730 $64,487 $498,484,510Davis 8,689 6,508 3,324 $47,048 $156,387,552 8,787 6,538 3,372 $52,459 $176,891,748Des Moines 40,990 31,890 17,131 $59,260 $1,015,183,060 40,121 31,375 16,881 $69,177 $1,167,776,937Henry 20,491 15,942 7,807 $55,683 $434,717,181 20,478 16,014 7,840 $63,666 $499,141,440Iowa 16,367 12,488 6,544 $56,271 $368,237,424 16,772 12,931 6,727 $63,086 $424,379,522Jasper 37,281 28,855 15,104 $60,763 $917,764,352 37,266 28,993 15,208 $69,418 $1,055,708,944Jefferson 15,869 12,679 6,683 $57,935 $387,179,605 15,668 12,628 6,641 $65,896 $437,615,336Johnson 124,015 100,080 51,700 $71,759 $3,709,940,300 131,885 106,959 55,686 $85,449 $4,758,313,014Keokuk 11,115 8,536 4,587 $50,778 $232,918,686 10,930 8,427 4,534 $57,522 $260,804,748Lee 36,491 28,791 14,896 $56,962 $848,505,952 35,522 28,204 14,591 $65,867 $961,065,397Louisa 11,949 8,794 4,486 $56,013 $251,274,318 11,784 8,697 4,428 $64,129 $283,963,212Lucas 9,452 7,316 3,837 $46,376 $177,944,712 9,465 7,373 3,837 $52,406 $201,081,822Mahaska 22,346 17,139 9,091 $56,051 $509,559,641 22,511 17,311 9,210 $64,561 $594,606,810Marion 33,834 26,424 12,988 $60,542 $786,319,496 34,852 27,324 13,468 $68,515 $922,760,020Monroe 7,794 5,978 3,214 $50,939 $163,717,946 7,662 5,877 3,174 $57,435 $182,298,690Muscatine 43,787 32,972 17,102 $64,730 $1,107,012,460 45,342 34,460 17,820 $75,703 $1,349,027,460Poweshiek 19,332 15,485 7,831 $56,721 $444,182,151 19,574 15,777 8,024 $64,454 $517,178,896Scott 164,686 124,503 66,165 $68,092 $4,505,307,180 169,158 128,898 68,464 $80,641 $5,521,005,424Van Buren 7,974 6,252 3,325 $44,898 $149,285,850 8,179 6,437 3,431 $50,255 $172,424,905Wapello 36,395 28,643 15,237 $50,560 $770,382,720 36,765 29,155 15,459 $58,472 $903,918,648Washington 21,564 16,367 8,621 $54,979 $473,973,959 22,093 16,835 8,879 $62,452 $554,511,308Wayne 6,439 5,100 2,756 $46,005 $126,789,780 6,280 4,986 2,694 $52,418 $141,214,092SE Iowa Subtotal/Average 728,990 565,768 295,777 $61,610 $18,222,932,858 743,375 580,446 303,855 $71,976 $21,870,376,381
Iowa Total 3,042,015 2,338,012 1,226,434 $62,917 $77,163,410,650 3,131,176 2,417,020 1,270,551 $73,959 $93,969,293,182
2008 2013
Source: ESRI Business Information Solutions
Total Pop. Adults Households Avg. HH Income Total Income Total Pop. Adults Households Avg. HH Income Total Income
Surrounding Areas
NE Missouri 68,226 53,762 27,474 $45,176 $1,241,165,424 68,201 53,742 27,510 $51,254 $1,409,997,540Adair 24,964 20,421 9,729 $49,765 $484,163,685 24,875 20,398 9,721 $57,789 $561,766,869Clark 7,392 5,707 3,016 $44,999 $135,716,984 7,360 5,682 3,028 $50,033 $151,499,924Grundy 10,532 8,268 4,463 $43,220 $192,890,860 10,748 8,448 4,575 $48,152 $220,295,400Mercer 3,646 2,902 1,550 $41,616 $64,504,800 3,582 2,841 1,523 $45,204 $68,845,692Putnam 5,244 4,096 2,227 $39,477 $87,915,279 5,235 4,068 2,220 $44,336 $98,425,920Schuyler 4,411 3,423 1,831 $44,038 $80,633,578 4,550 3,526 1,892 $49,498 $93,650,216Scotland 5,004 3,693 1,857 $44,873 $83,329,161 5,022 3,676 1,849 $50,805 $93,938,445Sullivan 7,033 5,275 2,801 $39,999 $112,037,199 6,829 5,088 2,702 $45,006 $121,606,212
NW Missouri 45,914 36,731 18,201 $45,680 $831,421,680 45,691 36,553 18,177 $51,385 $934,025,145Atchison 6,038 4,806 2,584 $47,081 $121,657,304 5,819 4,673 2,500 $52,712 $131,780,000Gentry 6,566 5,023 2,609 $45,310 $118,213,790 6,365 4,863 2,522 $50,881 $128,321,882Harrison 8,944 6,896 3,664 $39,573 $144,995,472 9,083 6,921 3,711 $43,868 $162,794,148Nodaway 22,120 18,249 8,401 $48,631 $408,549,031 22,251 18,402 8,534 $55,074 $470,001,516Worth 2,246 1,777 943 $40,308 $38,010,444 2,173 1,714 910 $45,205 $41,136,550
Western Illinios 1,095,834 847,080 433,471 $61,328 $26,583,909,488 1,113,495 866,299 441,873 $67,378 $29,772,518,994Bureau 35,260 27,468 14,297 $60,794 $869,171,818 35,065 27,421 14,296 $66,598 $952,085,008Carroll 16,454 12,999 6,798 $56,778 $385,976,844 16,239 12,894 6,743 $61,207 $412,718,801Fulton 37,995 30,396 14,939 $50,999 $761,874,061 23,548 18,744 10,182 $66,532 $677,428,824Hancock 19,448 15,306 7,870 $51,990 $409,161,300 19,027 15,050 7,723 $56,254 $434,449,642Henderson 8,055 6,388 3,345 $49,397 $165,232,965 7,881 6,218 3,289 $52,857 $173,846,673Henry 50,761 39,391 20,227 $57,811 $1,169,343,097 50,618 39,533 20,271 $62,927 $1,275,593,217Jo Daviess 23,044 18,274 9,840 $61,547 $605,622,480 23,548 18,744 10,182 $66,532 $677,428,824Knox 53,398 42,558 21,390 $54,009 $1,155,252,510 51,828 41,514 20,831 $59,206 $1,233,320,186La Salle 114,531 87,960 45,345 $60,612 $2,748,451,140 116,476 89,919 46,292 $66,697 $3,087,537,524Lee 35,872 28,195 13,519 $62,141 $840,084,179 35,802 28,391 13,573 $68,706 $932,546,538Mcdonough 32,912 27,350 12,390 $47,850 $592,861,500 32,373 27,031 12,219 $51,715 $631,905,585Mercer 17,206 13,438 6,808 $56,690 $385,945,520 17,266 13,554 6,863 $61,708 $423,502,004Ogle 55,705 41,890 21,216 $67,437 $1,430,743,392 58,757 44,655 22,444 $74,114 $1,663,414,616Putnam 6,290 4,887 2,534 $62,068 $157,280,312 6,345 4,936 2,570 $67,883 $174,459,310Rock Island 148,050 115,775 60,791 $60,359 $3,669,283,969 147,323 115,943 60,727 $66,231 $4,022,009,937Schuyler 7,074 5,581 2,971 $48,729 $144,773,859 6,990 5,522 2,952 $51,721 $152,680,392Stark 6,267 4,813 2,540 $49,678 $126,182,120 6,284 4,820 2,563 $53,714 $137,668,982Stephenson 47,634 36,869 19,489 $59,462 $1,158,854,918 46,689 36,464 19,189 $65,024 $1,247,745,536Warren 18,376 14,646 7,074 $52,984 $374,808,816 18,165 14,550 7,007 $57,889 $405,628,223Whiteside 60,076 46,439 23,848 $61,841 $1,474,784,168 59,765 46,497 23,871 $68,545 $1,636,237,695Winnebago 301,426 226,672 116,240 $68,462 $7,958,022,880 319,223 241,971 123,337 $75,174 $9,271,735,638
SW Wisconsin 350,149 270,665 139,435 $58,004 $8,087,787,740 360,124 280,176 144,855 $66,924 $9,694,276,020Crawford 17,489 13,397 6,995 $51,867 $362,809,665 17,484 13,428 7,077 $58,815 $416,233,755Grant 50,377 39,999 19,434 $52,894 $1,027,941,996 50,821 40,606 19,879 $60,949 $1,211,605,171Green 36,874 28,061 14,898 $64,780 $965,092,440 38,817 29,773 15,808 $74,968 $1,185,094,144Iowa 24,685 18,612 9,828 $60,876 $598,289,328 25,719 19,521 10,346 $69,350 $717,495,100La Crosse 112,031 87,944 45,278 $64,105 $2,902,546,190 114,994 90,845 46,951 $75,594 $3,549,213,894Lafayette 16,580 12,750 6,606 $51,474 $340,037,244 16,811 12,961 6,770 $56,946 $385,524,420Monroe 44,105 33,167 17,141 $53,999 $925,596,859 46,353 34,997 18,179 $61,134 $1,111,354,986Richland 18,351 14,424 7,561 $52,131 $394,162,491 18,570 14,689 7,739 $59,175 $457,955,325Vernon 29,657 22,450 11,694 $48,851 $571,263,594 30,555 23,252 12,106 $54,497 $659,740,682
2008 2013
Source: ESRI Business Information Solutions

Total Pop. Adults Households Avg. HH Income Total Income Total Pop. Adults Households Avg. HH Income Total Income
Surrounding Areas
SE Minnesota 365,665 278,271 143,886 $72,314 $10,404,972,204 382,957 292,962 151,581 $83,770 $12,697,940,370Dodge 20,588 14,926 7,595 $67,228 $510,596,660 22,487 16,371 8,347 $75,592 $630,966,424Fillmore 21,852 16,870 8,703 $54,635 $475,488,405 22,131 17,152 8,875 $61,098 $542,244,750Freeborn 31,759 24,899 13,312 $55,593 $740,054,016 31,143 24,447 13,144 $62,911 $826,902,184Houston 19,987 15,350 7,919 $60,684 $480,556,596 20,085 15,626 8,025 $68,284 $547,979,100Mower 39,082 30,132 15,963 $60,171 $960,509,673 39,344 30,492 16,108 $68,484 $1,103,140,272Olmsted 144,355 107,689 56,458 $90,415 $5,104,650,070 157,440 118,395 61,967 $105,819 $6,557,285,973Steele 37,471 28,028 14,568 $67,054 $976,842,672 39,999 30,119 15,651 $75,130 $1,175,859,630Winona 50,571 40,356 19,368 $59,702 $1,156,308,336 50,328 40,313 19,464 $67,489 $1,313,605,896
SW Minnesota 225,799 176,801 90,381 $56,272 $5,085,919,632 225,684 177,388 90,960 $63,524 $5,778,143,040Blue Earth 61,096 49,182 23,855 $61,662 $1,470,947,010 64,015 51,660 25,313 $70,148 $1,775,656,324Brown 26,394 20,693 10,712 $60,589 $649,029,368 26,117 20,606 10,684 $68,609 $733,018,556Cottonwood 11,802 9,194 4,846 $49,029 $237,594,534 11,516 9,006 4,746 $54,246 $257,451,516Faribault 15,249 12,062 6,390 $49,382 $315,550,980 14,655 11,636 6,174 $54,659 $337,464,666Jackson 11,052 8,742 4,570 $51,096 $233,508,720 10,921 8,682 4,551 $57,751 $262,824,801Martin 20,939 16,521 8,928 $53,864 $480,897,792 20,326 16,159 8,735 $60,132 $525,253,020Murray 8,743 6,872 3,648 $50,726 $185,048,448 8,477 6,697 3,566 $56,193 $200,384,238Nobles 20,567 15,528 7,883 $55,634 $438,562,822 20,345 15,381 7,794 $62,986 $490,912,884Pipestone 9,390 7,305 3,970 $47,812 $189,813,640 9,090 7,099 3,879 $53,540 $207,681,660Rock 9,479 7,289 3,836 $54,949 $210,784,364 9,319 7,176 3,799 $61,769 $234,660,431Waseca 19,821 15,104 7,308 $60,079 $439,057,332 20,001 15,201 7,422 $66,906 $496,576,332Watonwan 11,267 8,338 4,435 $53,010 $235,099,350 10,902 8,046 4,297 $59,633 $256,243,001
SE South Dakota 385,297 294,752 152,434 64,013 $9,757,757,642 415,350 318,989 165,413 76,307 $12,622,169,791Bon Homme 7,365 5,907 2,607 $42,835 $111,670,845 7,177 5,763 2,543 $47,685 $121,262,955Brookings 29,581 24,079 11,483 58,132 $667,529,756 30,066 24,504 11,805 65,820 $777,005,100Charles Mix 9,343 6,643 3,411 $38,378 $130,907,358 9,327 6,697 3,415 $42,702 $145,827,330Clay 13,149 10,848 4,868 48,880 $237,947,840 12,875 10,673 4,786 56,545 $270,624,370Davison 19,360 14,830 8,062 58,082 $468,257,084 19,805 15,250 8,307 66,751 $554,500,557Douglas 3,214 2,452 1,279 $42,645 $54,542,955 3,044 2,326 1,224 $47,399 $58,016,376Hanson 3,605 2,599 1,302 50,259 $65,437,218 3,906 2,820 1,412 55,238 $77,996,056Hutchinson 7,806 6,050 3,162 45,648 $144,338,976 7,806 6,050 3,162 45,648 $144,338,976Kingsbury 5,726 4,524 2,453 47,698 $117,003,194 7,554 5,854 3,071 50,947 $156,458,237Lake 11,391 8,953 4,605 53,528 $246,496,440 11,616 9,165 4,740 60,781 $288,101,940Lincoln 38,655 29,069 14,513 82,936 $1,203,650,168 51,253 38,850 19,385 103,704 $2,010,302,040Mccook 6,138 4,542 2,366 50,421 $119,296,086 6,273 4,661 2,424 56,060 $135,889,440Minnehaha 172,459 130,379 69,434 69,499 $4,825,593,566 188,053 142,920 76,288 82,271 $6,276,290,048Miner 2,676 2,114 1,176 42,956 $50,516,256 2,562 2,027 1,140 47,959 $54,673,260Moody 6,703 5,014 2,658 54,871 $145,847,118 6,830 5,150 2,732 61,909 $169,135,388Sanborn 2,568 2,018 1,036 54,298 $56,252,728 2,489 1,949 1,013 60,873 $61,664,349Turner 9,010 6,956 3,675 52,769 $193,926,075 9,125 7,072 3,744 58,921 $220,600,224Union 14,468 10,894 5,857 75,229 $440,616,253 15,693 11,848 6,405 88,968 $569,840,040Yankton 22,080 16,980 8,487 56,309 $477,894,483 22,056 17,071 8,539 63,864 $545,334,696
2008 2013
Source: ESRI Business Information Solutions

Total Pop. Adults Households Avg. HH Income Total Income Total Pop. Adults Households Avg. HH Income Total Income
Surrounding Areas
NE Nebraska 264,387 199,083 101,917 $52,291 $5,329,341,847 263,898 199,243 102,024 $59,640 $6,084,711,360Antelope 7,022 5,351 2,847 $41,442 $117,985,374 6,733 5,097 2,748 $45,467 $124,943,316Boone 5,835 4,382 2,324 46,300 $107,601,200 5,590 4,220 2,235 51,200 $114,432,000Boyd 2,254 1,790 953 $37,865 $36,085,345 2,130 1,685 904 $41,908 $37,884,832Burt 7,348 5,724 3,004 47,549 $142,837,196 7,046 5,496 2,883 52,767 $152,127,261Cedar 9,020 6,747 3,479 $46,813 $162,862,427 8,590 6,451 3,336 $51,425 $171,553,800Colfax 10,800 7,895 3,669 $49,947 $183,255,543 10,971 8,042 3,698 $55,902 $206,725,596Cuming 9,784 7,397 3,834 $48,606 $186,355,404 9,466 7,118 3,718 $54,502 $202,638,436Dakota 20,865 14,835 7,284 $59,982 $436,908,888 21,151 15,123 7,364 $70,476 $518,985,264Dixon 6,266 4,775 2,404 $46,266 $111,223,464 6,249 4,749 2,400 $51,187 $122,848,800Dodge 36,698 28,404 14,932 $55,379 $826,919,228 37,033 28,775 15,144 $63,945 $968,383,080Garfield 1,762 1,415 774 $37,577 $29,084,598 1,681 1,363 745 $41,775 $31,122,375Greeley 2,542 1,937 1,035 39,215 $40,587,525 2,413 1,834 991 43,187 $42,798,317Holt 10,769 8,281 4,432 $44,315 $196,404,080 10,322 7,938 4,292 $48,489 $208,114,788Knox 9,006 6,989 3,714 $39,116 $145,276,824 8,719 6,749 3,606 $42,878 $154,618,068Madison 35,351 26,761 13,698 $53,075 $727,021,350 35,312 26,837 13,739 $61,107 $839,549,073Pierce 7,701 5,737 2,958 $49,595 $146,702,010 7,557 5,653 2,910 $54,717 $159,226,470Platte 32,027 23,636 12,500 $57,734 $721,675,000 32,660 24,201 12,841 $66,507 $854,016,387Stanton 6,670 4,922 2,426 $50,270 $121,955,020 6,811 5,040 2,494 $55,519 $138,464,386Thurston 7,427 4,872 2,308 $41,601 $96,015,108 7,582 4,959 2,342 $47,141 $110,404,222Valley 4,477 3,501 1,924 $40,852 $78,599,248 4,356 3,393 1,879 $44,832 $84,239,328Washington 20,462 15,531 7,693 $68,848 $529,647,664 21,447 16,386 8,108 $78,396 $635,634,768Wayne 9,494 7,633 3,392 $50,351 $170,790,592 9,299 7,504 3,321 $57,692 $191,595,132Wheeler 807 586 333 $40,601 $13,520,133 780 553 326 $44,256 $14,427,456
2008 2013
Source: ESRI Business Information Solutions

Total Pop. Adults Households Avg. HH Income Total Income Total Pop. Adults Households Avg. HH Income Total Income
Surrounding Areas
SE Nebraska 1,305,728 984,519 513,871 $68,844 $35,376,935,124 1,376,309 1,043,242 544,222 $81,859 $44,549,468,698Adams 32,978 25,657 12,930 $57,585 $744,574,050 34,295 26,887 13,471 $68,114 $917,563,694Buffalo 45,604 35,024 17,564 $55,916 $982,108,624 47,517 36,588 18,433 $64,624 $1,191,214,192Butler 8,702 6,561 3,464 $48,882 $169,327,248 8,594 6,428 3,439 $53,707 $184,698,373Cass 26,649 20,013 10,232 $66,355 $678,944,360 28,023 21,157 10,821 $75,905 $821,368,005Clay 7,062 5,388 2,800 $48,728 $136,438,400 7,093 5,398 2,821 $53,333 $150,452,393Douglas 506,013 375,968 200,166 $75,480 $15,108,529,680 534,527 399,292 212,239 $90,763 $19,263,448,357Fillmore 6,327 4,828 2,604 $48,309 $125,796,636 6,115 4,660 2,524 $54,100 $136,548,400Gage 23,512 18,339 9,694 $50,984 $494,238,896 23,794 18,607 9,858 $58,444 $576,140,952Hall 55,920 41,549 21,428 $57,465 $1,231,360,020 57,798 43,117 22,169 $66,997 $1,485,256,493Hamilton 9,634 7,168 3,638 $56,817 $206,700,246 9,754 7,306 3,694 $64,357 $237,734,758Howard 6,939 5,315 2,726 $47,547 $129,613,122 7,145 5,480 2,815 $53,380 $150,264,700Jefferson 7,866 6,285 3,388 $47,710 $161,641,480 7,592 6,058 3,284 $53,104 $174,393,536Johnson 4,792 3,858 1,889 $45,467 $85,887,163 4,738 3,819 1,870 $50,053 $93,599,110Kearney 6,708 5,145 2,609 $53,116 $138,579,644 6,585 5,051 2,567 $58,502 $150,174,634Lancaster 275,223 213,848 111,454 $69,135 $7,705,372,290 289,409 225,739 117,980 $81,913 $9,664,095,740Merrick 8,068 6,107 3,208 $48,019 $154,044,952 7,995 6,084 3,193 $54,023 $172,495,439Nance 3,752 2,878 1,495 $46,631 $69,713,345 3,581 2,761 1,435 $51,912 $74,493,720Nemaha 7,336 5,957 3,014 $50,935 $153,518,090 7,205 5,915 2,978 $57,426 $171,014,628Otoe 16,134 12,343 6,390 $54,535 $348,478,650 16,578 12,715 6,568 $61,657 $404,963,176Pawnee 2,887 2,292 1,272 $42,880 $54,543,360 2,765 2,190 1,222 $47,415 $57,941,130Polk 5,594 4,369 2,280 $50,750 $115,710,000 5,555 4,338 2,275 $56,522 $128,587,550Richardson 8,870 6,919 3,752 $42,555 $159,666,360 8,480 6,674 3,591 $47,377 $170,130,807Saline 14,247 10,970 5,384 $52,174 $280,904,816 14,522 11,196 5,488 $58,658 $321,915,104Sarpy 153,332 110,246 56,431 $81,606 $4,605,108,186 174,529 126,708 65,077 $96,931 $6,307,978,687Saunders 21,231 16,051 8,153 $58,216 $474,635,048 21,928 16,709 8,454 $65,914 $557,236,956Seward 17,204 13,591 6,396 $60,935 $389,740,260 17,505 13,899 6,569 $69,866 $458,949,754Sherman 3,196 2,531 1,399 $39,490 $55,246,510 3,131 2,477 1,388 $43,586 $60,497,368Thayer 5,511 4,321 2,359 $44,366 $104,659,394 5,150 4,022 2,215 $49,181 $108,935,915York 14,437 11,261 5,752 $54,199 $311,752,648 14,406 11,309 5,784 $61,778 $357,323,952
Surrounding Area Subtotal/Average 4,106,999 3,141,664 1,621,070 $63,353 102,699,210,781 4,251,709 3,268,595 1,686,615 $73,249 123,543,250,958
Total Market Area 7,149,014 5,479,677 2,847,504 $63,165 $179,862,621,431 7,382,885 5,685,614 2,957,166 $73,554 $217,512,544,140
2008 2013
Source: ESRI Business Information Solutions
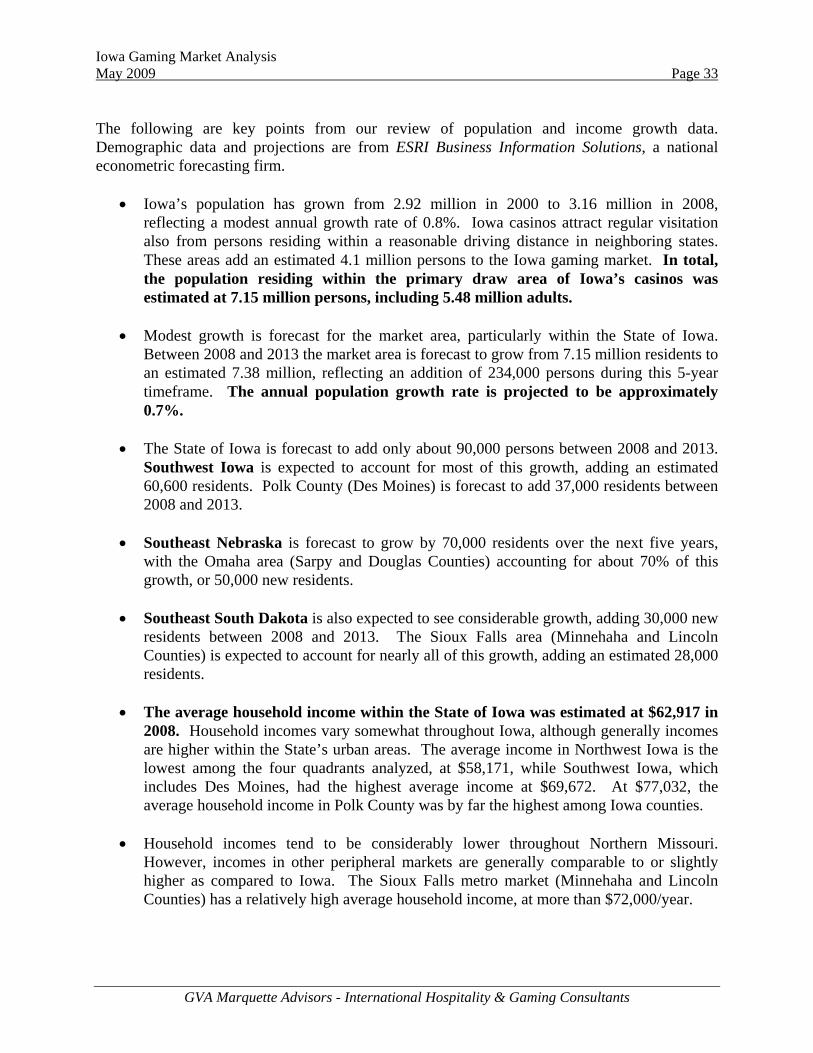
Iowa Gaming Market Analysis May 2009 Page 33
GVA Marquette Advisors - International Hospitality & Gaming Consultants
The following are key points from our review of population and income growth data. Demographic data and projections are from ESRI Business Information Solutions, a national econometric forecasting firm.
• Iowa’s population has grown from 2.92 million in 2000 to 3.16 million in 2008, reflecting a modest annual growth rate of 0.8%. Iowa casinos attract regular visitation also from persons residing within a reasonable driving distance in neighboring states. These areas add an estimated 4.1 million persons to the Iowa gaming market. In total, the population residing within the primary draw area of Iowa’s casinos was estimated at 7.15 million persons, including 5.48 million adults.
• Modest growth is forecast for the market area, particularly within the State of Iowa.
Between 2008 and 2013 the market area is forecast to grow from 7.15 million residents to an estimated 7.38 million, reflecting an addition of 234,000 persons during this 5-year timeframe. The annual population growth rate is projected to be approximately 0.7%.
• The State of Iowa is forecast to add only about 90,000 persons between 2008 and 2013. Southwest Iowa is expected to account for most of this growth, adding an estimated 60,600 residents. Polk County (Des Moines) is forecast to add 37,000 residents between 2008 and 2013.
• Southeast Nebraska is forecast to grow by 70,000 residents over the next five years, with the Omaha area (Sarpy and Douglas Counties) accounting for about 70% of this growth, or 50,000 new residents.
• Southeast South Dakota is also expected to see considerable growth, adding 30,000 new residents between 2008 and 2013. The Sioux Falls area (Minnehaha and Lincoln Counties) is expected to account for nearly all of this growth, adding an estimated 28,000 residents.
• The average household income within the State of Iowa was estimated at $62,917 in 2008. Household incomes vary somewhat throughout Iowa, although generally incomes are higher within the State’s urban areas. The average income in Northwest Iowa is the lowest among the four quadrants analyzed, at $58,171, while Southwest Iowa, which includes Des Moines, had the highest average income at $69,672. At $77,032, the average household income in Polk County was by far the highest among Iowa counties.
• Household incomes tend to be considerably lower throughout Northern Missouri. However, incomes in other peripheral markets are generally comparable to or slightly higher as compared to Iowa. The Sioux Falls metro market (Minnehaha and Lincoln Counties) has a relatively high average household income, at more than $72,000/year.
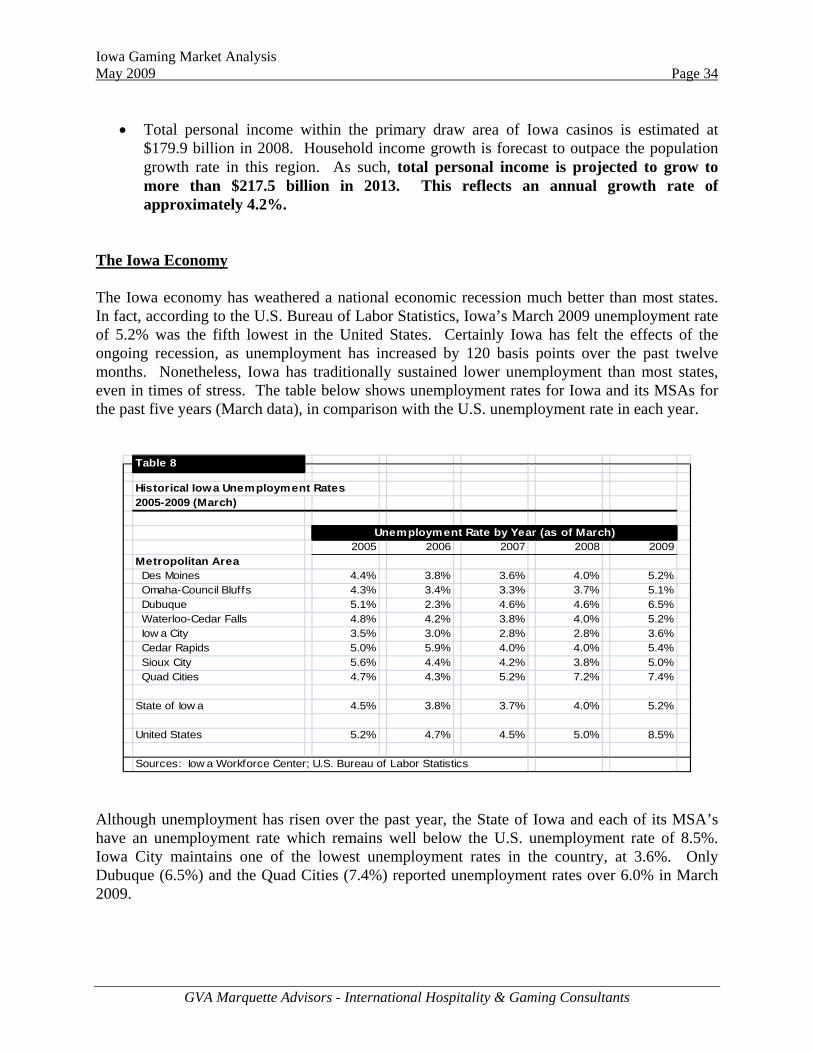
Iowa Gaming Market Analysis May 2009 Page 34
GVA Marquette Advisors - International Hospitality & Gaming Consultants
• Total personal income within the primary draw area of Iowa casinos is estimated at $179.9 billion in 2008. Household income growth is forecast to outpace the population growth rate in this region. As such, total personal income is projected to grow to more than $217.5 billion in 2013. This reflects an annual growth rate of approximately 4.2%.
The Iowa Economy
The Iowa economy has weathered a national economic recession much better than most states. In fact, according to the U.S. Bureau of Labor Statistics, Iowa’s March 2009 unemployment rate of 5.2% was the fifth lowest in the United States. Certainly Iowa has felt the effects of the ongoing recession, as unemployment has increased by 120 basis points over the past twelve months. Nonetheless, Iowa has traditionally sustained lower unemployment than most states, even in times of stress. The table below shows unemployment rates for Iowa and its MSAs for the past five years (March data), in comparison with the U.S. unemployment rate in each year.
Historical Iowa Unemployment Rates2005-2009 (March)
2005 2006 2007 2008 2009Metropolitan Area Des Moines 4.4% 3.8% 3.6% 4.0% 5.2% Omaha-Council Bluffs 4.3% 3.4% 3.3% 3.7% 5.1% Dubuque 5.1% 2.3% 4.6% 4.6% 6.5% Waterloo-Cedar Falls 4.8% 4.2% 3.8% 4.0% 5.2% Iow a City 3.5% 3.0% 2.8% 2.8% 3.6% Cedar Rapids 5.0% 5.9% 4.0% 4.0% 5.4% Sioux City 5.6% 4.4% 4.2% 3.8% 5.0% Quad Cities 4.7% 4.3% 5.2% 7.2% 7.4%
State of Iow a 4.5% 3.8% 3.7% 4.0% 5.2%
United States 5.2% 4.7% 4.5% 5.0% 8.5%
Sources: Iow a Workforce Center; U.S. Bureau of Labor Statistics
Unemployment Rate by Year (as of March)
Table 8
Although unemployment has risen over the past year, the State of Iowa and each of its MSA’s have an unemployment rate which remains well below the U.S. unemployment rate of 8.5%. Iowa City maintains one of the lowest unemployment rates in the country, at 3.6%. Only Dubuque (6.5%) and the Quad Cities (7.4%) reported unemployment rates over 6.0% in March 2009.

Iowa Gaming Market Analysis May 2009 Page 35
GVA Marquette Advisors - International Hospitality & Gaming Consultants
Regional and national economists have noted that Iowa historically has sustained a fairly stable economy, not experiencing periods of rapid growth or declines. Iowa’s housing market wasn’t overbuilt in recent years, and its banks didn’t have significant exposure to real estate and bad mortgages. Manufacturing has held up relatively well in Iowa, although some have suffered. Losses in some areas have been offset partly by gains in other sub-sectors. The current ongoing U.S. recession has led to major job losses throughout the country. In Iowa, non-farm employment has dropped by only 1.5% over the past year (about 22,000 jobs). The professional and business services sector has shed more than 9,000 jobs. There have also been considerable losses within the manufacturing sector, generally in manufacturing of durable goods. Nonetheless, while makers of machinery have suffered, Iowa’s food processors have fared quite well for the past several months. Meanwhile, corn has hovered around $4 a bushel, more than 75% higher than the 20-year average. Our review of regional and statewide economic data and reports by various economists suggest that Iowa will likely see modest job losses and a rise in its unemployment rate during 2009. However, as in past recessions, Iowa is well positioned for recovery, which is forecast to begin in 2010, with sustained moderate expansion thereafter. Key Conclusions: Demography & Economics Iowa’s gaming market has fared relatively well in comparison with many markets around the United States, mirroring the Iowa economy as a whole, which continues to weather the ongoing recession much better than most states. From our analysis of growth trends and key economic indicators we would expect Iowa gaming revenues to remain relatively flat over the next 12 to 18 months, with a period of modest expansion following, generally tied to population and income growth rates (assuming no new casino development during this time). Our gaming market forecast is detailed in the following section, which includes an “as is” scenario along with varied development scenarios featuring the addition of gaming facilities throughout the State.
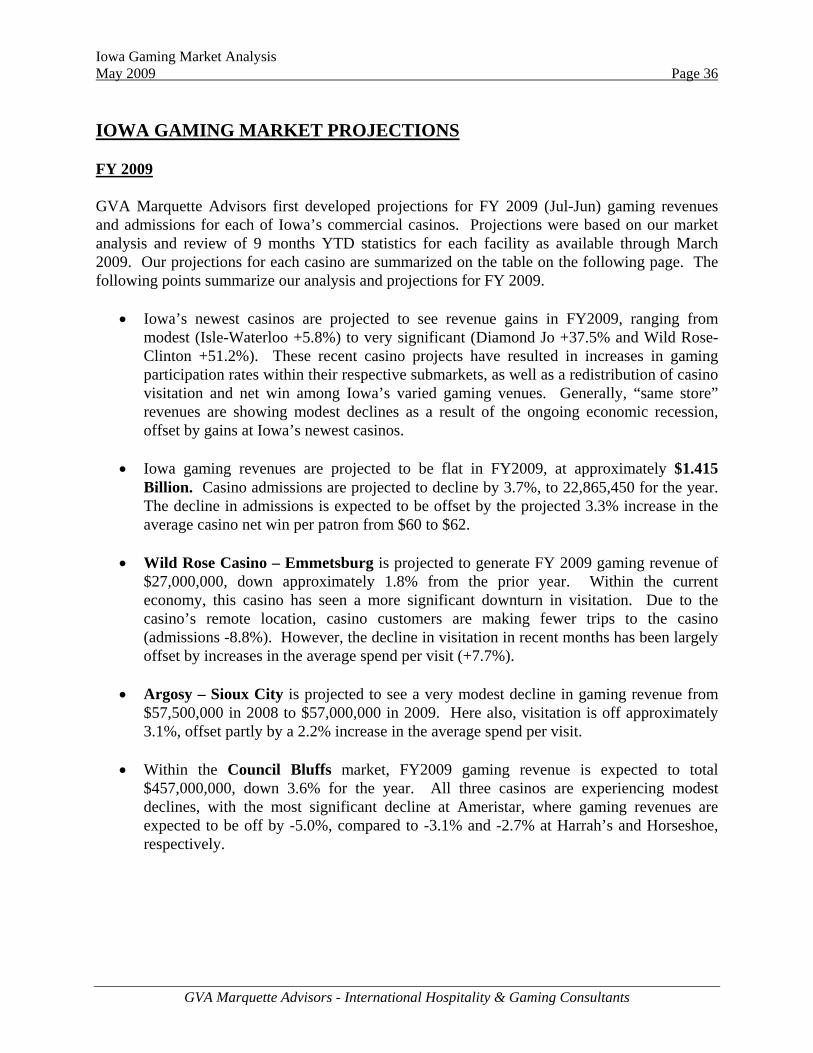
Iowa Gaming Market Analysis May 2009 Page 36
GVA Marquette Advisors - International Hospitality & Gaming Consultants
IOWA GAMING MARKET PROJECTIONS FY 2009 GVA Marquette Advisors first developed projections for FY 2009 (Jul-Jun) gaming revenues and admissions for each of Iowa’s commercial casinos. Projections were based on our market analysis and review of 9 months YTD statistics for each facility as available through March 2009. Our projections for each casino are summarized on the table on the following page. The following points summarize our analysis and projections for FY 2009.
• Iowa’s newest casinos are projected to see revenue gains in FY2009, ranging from modest (Isle-Waterloo +5.8%) to very significant (Diamond Jo +37.5% and Wild Rose-Clinton +51.2%). These recent casino projects have resulted in increases in gaming participation rates within their respective submarkets, as well as a redistribution of casino visitation and net win among Iowa’s varied gaming venues. Generally, “same store” revenues are showing modest declines as a result of the ongoing economic recession, offset by gains at Iowa’s newest casinos.
• Iowa gaming revenues are projected to be flat in FY2009, at approximately $1.415
Billion. Casino admissions are projected to decline by 3.7%, to 22,865,450 for the year. The decline in admissions is expected to be offset by the projected 3.3% increase in the average casino net win per patron from $60 to $62.
• Wild Rose Casino – Emmetsburg is projected to generate FY 2009 gaming revenue of
$27,000,000, down approximately 1.8% from the prior year. Within the current economy, this casino has seen a more significant downturn in visitation. Due to the casino’s remote location, casino customers are making fewer trips to the casino (admissions -8.8%). However, the decline in visitation in recent months has been largely offset by increases in the average spend per visit (+7.7%).
• Argosy – Sioux City is projected to see a very modest decline in gaming revenue from $57,500,000 in 2008 to $57,000,000 in 2009. Here also, visitation is off approximately 3.1%, offset partly by a 2.2% increase in the average spend per visit.
• Within the Council Bluffs market, FY2009 gaming revenue is expected to total $457,000,000, down 3.6% for the year. All three casinos are experiencing modest declines, with the most significant decline at Ameristar, where gaming revenues are expected to be off by -5.0%, compared to -3.1% and -2.7% at Harrah’s and Horseshoe, respectively.
Casino Location FY2008 FY2009* % Change FY2008 FY2009* % Change FY2008 FY2009* % Change
Wild Rose Emmetsburg $27,488,959 $27,000,000 -1.8% 593,602 541,196 -8.8% $46 $50 7.7% Argosy Sioux City $57,537,914 $57,000,000 -0.9% 1,123,261 1,088,991 -3.1% $51 $52 2.2%
Ameristar Council Bluffs $178,899,018 $170,000,000 -5.0% 2,677,638 2,397,163 -10.5% $67 $71 6.1%Harrah's Council Bluffs $96,977,116 $94,000,000 -3.1% 1,560,194 1,460,469 -6.4% $62 $64 3.5%Horseshoe Council Bluffs $198,410,252 $193,000,000 -2.7% 2,735,731 2,608,747 -4.6% $73 $74 2.0%
Diamond Jo Northwood $78,348,413 $78,000,000 -0.4% 1,319,178 1,239,079 -6.1% $59 $63 6.0%
Prairie Meadows Altoona $192,942,938 $192,000,000 -0.5% 2,490,044 2,432,413 -2.3% $77 $79 1.9%
Terribles Osceola $55,434,999 $51,000,000 -8.0% 991,055 841,656 -15.1% $56 $61 8.3%
Isle Waterloo $76,577,583 $81,000,000 5.8% 1,777,746 1,543,687 -13.2% $43 $52 21.8%Riverside Riverside $86,141,986 $86,000,000 -0.2% 1,963,640 2,025,004 3.1% $44 $42 -3.2%
Lady Luck Marquette $34,327,956 $32,000,000 -6.8% 428,745 390,401 -8.9% $80 $82 2.4%
Diamond Jo Dubuque $40,375,188 $55,500,000 37.5% 708,290 986,651 39.3% $57 $56 -1.3%Greyhound Park Dubuque $71,620,436 $69,500,000 -3.0% 1,517,818 1,458,853 -3.9% $47 $48 1.0%
Isle Bettendorf $96,563,711 $90,000,000 -6.8% 1,451,452 1,270,145 -12.5% $67 $71 6.5%Rhythmn City Davenport $56,663,557 $58,500,000 3.2% 947,343 953,567 0.7% $60 $61 2.6%
Wild Rose Clinton $27,777,051 $42,000,000 51.2% 413,966 857,399 107.1% $67 $49 -27.0%
Catfish Bend Burlington $39,290,774 $39,000,000 -0.7% 1,035,443 770,031 -25.6% $38 $51 33.5%
TOTALS $1,415,377,851 $1,415,500,000 0.0% 23,735,146 22,865,451 -3.7% $60 $62 3.8%
* FY 2009 projections by GVA Marquette Advisors based on market analysis and review of YTD (9 months) casino performance statistics
Sources: IRGC; GVA Marquette Advisors
Gaming Revenue Total Admissions Casino Net Win per Admission
Gaming Revenue and Win per AdmissionIowa Casinos, 2008 and 2009 (projected)
Table 9
Iowa Gaming Market Analysis May 2009 Page 38
GVA Marquette Advisors - International Hospitality & Gaming Consultants
• Diamond Jo-Northwood is projected to see a 0.5% decline in gaming revenues to $78,000,000 in FY2009. Admissions are off about 6.0%, offset almost entirely by gains in the average spend per admission.
• Prairie Meadows-Altoona is expected to see a similar modest 0.5% decline in revenues,
to $192,000,000 for FY2009. Admissions are off 2.3%, while the average win per admission is up 1.9%.
• Terribles Lakeside Casino – Osceola has seen a more significant decline, largely attributable to the economic recession and its distance from its key feeder market, that being Des Moines. Gamers are making fewer visits to this more distant casino. Visitation is off 15.1%, and FY2009 gaming revenue at Terribles is projected to decline 8.0% to $51,000,000 for the year.
• Isle-Waterloo is projected to generate FY2009 gaming revenue of $81,000,000, up 5.8% for the year. Interestingly, admissions at Waterloo are projected to be down by 13.2%, while the average casino win per admission is projected to increase by 21.8% from $43 to $52. From our analysis we believe this is attributable to an initial spike in casino visitation by locals during the casino’s first months of operations. Initial visitation is often higher among locals who want to check out a new casino, then falling off slightly thereafter. The fact that the casino is generating a higher win per visit ($52 vs. $43 last year) is indicative that the casino’s marketing efforts are beginning to take effect with respect to more distant markets.
• Riverside Casino and Resort is in its third year of operations and is projected to see relatively flat gaming revenues, at $86,000,000 for FY 2009. The casino continues to attract significant local play from the Iowa City area, as admissions are projected to increase by 3.1% for the year. The average win per visit remains relatively low, at $42. Although it offers a high quality gaming experience, with an appealing hotel, food and beverage and amenity package, the resort complex continues to lag in its efforts to attract gamers from more distant markets. The presence of well established casinos within the Quad Cities market is a barrier to Riverside there, and the new Jumers facility in Rock Island has also had some impact on Riverside’s ability to draw from the east. Meanwhile, Isle-Waterloo provides strong competition to the north with respect to major markets such as Cedar Rapids, Cedar Falls and Waterloo.
• Lady Luck Casino in Marquette is projected to see a 6.8% decline in gaming revenues, to $32,000,000 for the year. The average spend per visit remains relatively high, at $82, although admissions are off nearly 9.0%. The Marquette facility has clearly been impacted by the economy and by developments such as Isle-Waterloo and the new Diamond Jo facility in Dubuque. Lady Luck offers an inferior facility compared to these newer venues, as well as a remote location related to key population centers.
Iowa Gaming Market Analysis May 2009 Page 39
GVA Marquette Advisors - International Hospitality & Gaming Consultants
• The Dubuque market has shown a strong response to the recently developed Diamond Jo casino in downtown, replacing the former riverboat facility. Here, the development of a high quality land based facility with an array of food and beverage options and regular entertainment has boosted overall gaming participation and casino visitation. Diamond Jo’s revenues are projected to increase to more than $55,000,000 for FY2009, a 37.5% growth rate for the year. Meanwhile, the impact of this development upon Dubuque Greyhound Park has been modest. There, gaming revenue is projected to decline by just 3.0% to $69,500,000 for the year.
• The Quad Cities market has seen increasing competition resulting from a new land based Jumers facility at Rock Island, IL. This high quality resort facility has resulted in its further penetration of varied population centers in Illinois, and some other markets, along with a modest redistribution of casino patronage among locals. Isle-Bettendorf has seen a more significant impact from the Jumers development, as gaming revenues are projected to decline by 6.8% for the year. Meanwhile, Rhythm City, which depends more heavily on local play, is actually expected to see a 3.2% increase in gaming revenues for FY 2009.
• The Wild Rose-Clinton facility has been very well received in the eastern-Iowa market, also capturing significant play from neighboring Illinois. This land-based casino and hotel complex replaced the former Mississippi Belle riverboat in July of 2008. The former riverboat generated revenues of $27,800,000 in FY 2008, while the new resort casino is projected to capture $42,000,000 in gaming during its first year of operations. This represents a 51.2% increase for the year. Interestingly, the new casino has generated more than double the number of visits compared to the riverboat in its last year of operations, but a significantly lower average spend at $49 vs. $67 at the riverboat. It appears that the new casino has resulted in a significant increase in “local” gaming participation, with area residents making frequent visits to the casino but spending somewhat less than they may have per visit at the riverboat. This data also suggests that Wild Rose-Clinton will have to increase the utilization of its hotel to capture more significant patronage from more distant markets, notably Cedar Rapids to the west and Rockford and the Chicago area to the east.
• The Catfish Bend Casino and Hotel in Burlington is forecast to see fairly stable gaming
revenues in FY 2009, at approximately $39,000,000. There, visitation is down significantly, from 1,035,000 in FY 2008 to a projected 770,000 in FY 2009. However, while casino patrons are making fewer trips to the casino, they are spending an average of 33% more per visit.
Iowa Gaming Market Analysis May 2009 Page 40
GVA Marquette Advisors - International Hospitality & Gaming Consultants
Iowa Casino Gaming Market Projections (2008-2013) In order to facilitate the development of five-year casino gaming projections for each facility, we have first developed a model which effectively predicts the current (2008) level of admissions and net win for each casino in Iowa, including commercial and tribal casinos. Our base year model predicts current (2008) performance levels (annual admission and gaming revenues) for each of Iowa’s existing casinos considering the relative proximity to population, appropriate participation rates and frequency rates, the impact of “outside” demand components (tourism, etc), average spend estimates, and the respective competitive advantages and disadvantages of each casino due to location and facilities. Key to the development of the base model was our market analysis and review of player tracking information provided by Iowa’s casino operators. Player tracking information is the basis for determining for each casino, where its casino customers are originating from. We analyzed zip code visitation and net win information for each casino, and then also aggregated this information at the county level for each complex. To summarize, the base casino utilization and financial performance model is rooted in the base procedure as summarized below:
County Adult Population 4 x Participation Rate 5 = Total Casino Admissions These casino visits were then distributed on a percentage basis among the various Iowa gaming venues, as well as competitive casinos available within adjacent states. Our market share allocations here too were based upon our review of actual casino visitation data as provided by Iowa’s casino operators, and our separate knowledge and review of adjacent competitive facilities.
Total casino admissions from each county x Avg. Win per Admission 6 = Total Gaming Revenue Our analysis of current market conditions and player tracking information shows that casino gaming participation rates (i.e. the avg. number of annual casino visits per adult resident) vary significantly throughout the Iowa gaming market, ranging from 2.0 or lower in areas which are distant from casino facilities to 6.0 to 10.0 in communities where one or more casinos are accessible within a short driving distance. Overall, the participation rate for the market area as a whole is estimated at 5.6 casino visits per adult per year, or about 30.7 million annual (2008) casino visits from the market area’s adult population base.
4 Adult population estimates were obtained from ESRI Business Information Solutions, a national provider of demographic and economic data services and forecasting. 5 Casino gaming participation rates were determined by our market analysis and casino visitation statistics by zip code and county as provided by Iowa casino operators. 6 Average spend per visit was modeled based upon actual expenditure patterns by registered player club members at Iowa’s casinos, in accordance with data provided by the casino operators. Average spend typically varies by county depending on the frequency of casino visits, the distance of that county from the casino being analyzed, and income levels within each county.
Iowa Gaming Market Analysis May 2009 Page 41
GVA Marquette Advisors - International Hospitality & Gaming Consultants
The overall average spend per casino visit (i.e. net win by the casino) was estimated at $61 in 2008, with total net win emanating from the market are population base of approximately $1.88 billion. This total figure includes all of Iowa’s commercial and tribal casinos, as well as that part of net win at casinos in adjacent states which originates from the Iowa market area population. Iowa’s commercial casinos captured approximately 75% of casino revenues emanating from the market area population, or $1.415 billion, with the remaining 25% going to Iowa’s tribal casinos and other casinos in neighboring states. Our calculations indicate that an estimated $670 million of this net win, or 47%, comes from persons residing outside the State of Iowa. Iowa Gaming Projections – 2013 “As Is” Next, our 2008 base model was recalibrated to reflect adjusted population data and growth in personal incomes and average casino spending assumptions over the next five years. Between 2008 and 2013, the market area (Iowa and portions of adjacent states) is projected to see modest population growth from 5,480,000 adults to 5,675,000 adults. This reflects an annual growth rate of just 0.7%. In developing our “As-Is” 2013 casino admission projections we have assumed no increase in the number of gaming licenses within the of Iowa. Assumed expansions include the construction of a hotel with approximately 200 rooms and a new structured parking facility at Prairie Meadows in Altoona. Other casinos are assumed to expand their gaming base as warranted by market growth during this timeframe. From our analysis of historical and current casino visitation data, for our 2013 “as is” model we have not increased gaming participation rates within the vast majority of the market area, with the exception of slight increases in gaming participation in central Iowa for counties within about a 90-minute to two-hour drive surrounding Altoona. These slight increases are warranted due to the addition of lodging at Prairie Meadows. As well, a slight increase in gaming participation was applied for Polk County (Des Moines area) from 6.0 avg. casino visits/year per adult to about 6.25 in 2013. The addition of more convenient covered parking at Prairie Meadows is likely to result in local residents visiting the facility with slightly more frequency during inclement weather. Altogether, our adjustments reflecting the 2013 projected adult population base and minor adjustments to casino gaming participation rates result in a projected 32.5 million casino admissions in 2013, up from 30.7 million in 2008. Market share adjustments were also made to reflect modest redistribution of casino visits in the market area due to the above described developments and the further penetration of the market by resort casinos completed over the past several months. The next adjustments to the model include increases in the assumed average spend per visit. These inputs also vary and were developed by county for all of the casinos that the market area population is assumed to visit. As noted above, the average spend per casino visit was estimated at $61 in 2008. We have adjusted the 2013 average spend figures by county to reflect our review

Iowa Gaming Market Analysis May 2009 Page 42
GVA Marquette Advisors - International Hospitality & Gaming Consultants
of historical average spend per admission growth, paired with an analysis of growth in personal income throughout the market area. While very modest population growth is expected in the market area, income growth is forecast to outpace adult population growth over the next five years. Total personal income in the market area is projected to increase from $179.9 billion in 2008 to $217.4 billion in 2013. This represents an annual growth rate of approximately 4.2%. Historically, the average spend per visit at Iowa casinos has increased at an annual rate of between 3.0% and 4.0% for the past several years, including a 3.3% projected annual increase from FY 2008 to FY 2009. County-specific adjustments were made to the assumed average spend per casino visit, also varying by casino depending on the distance of the population base from each casino. Our adjustments result in an increase in the overall average spend per casino visit from $62 in 2009 to an estimated $67 in 2013. Next, we multiply projected casino visits by the estimated average spend by county and by casino, resulting in total projected casino revenues of $2.186 billion in 2013. This again includes all casino visits originating from within Iowa and relevant counties in adjacent states. This net win is distributed among Iowa commercial and tribal casinos, as well as competitive casinos in neighboring states. Based on our market share analysis, we estimate that Iowa commercial casinos will capture an estimated $1.640 billion in net win in FY 2013. We expect another year of relatively stable gaming revenues in 2010, followed by modest expansion beginning in FY 2011. Our “as is” market projections are summarized as follows. Individual casino projections are summarized on the following page. FY 2011 FY 2013 Iowa Commercial Casino Admissions 23,000,000 24,500,000 Iowa Commercial Casino Net Win $1,472,000,000 $1,640,000,000 Avg. Win per Admission $64 $67 Net Win from non-Iowa residents $690,000,000 $770,000,000

Casino Location FY 2009* FY 2013* % Change FY 2009* FY 2013* % Change FY 2009* FY 2013* % Change
Wild Rose Emmetsburg $27,000,000 $33,000,000 22.2% 541,196 605,000 11.8% $50 $55 9.3% Argosy Sioux City $57,000,000 $69,000,000 21.1% 1,088,991 1,113,000 2.2% $52 $62 18.4%
Ameristar Council Bluffs $170,000,000 $206,000,000 21.2% 2,397,163 2,800,000 16.8% $71 $74 3.7%Harrah's Council Bluffs $94,000,000 $110,000,000 17.0% 1,460,469 1,650,000 13.0% $64 $67 3.6%Horseshoe Council Bluffs $193,000,000 $235,000,000 21.8% 2,608,747 3,100,000 18.8% $74 $76 2.5%
Diamond Jo Northwood $78,000,000 $82,400,000 5.6% 1,239,079 1,136,000 -8.3% $63 $73 15.2%
Prairie Meadows Altoona $192,000,000 $250,000,000 30.2% 2,432,413 2,992,000 23.0% $79 $84 5.9%
Terribles Osceola $51,000,000 $59,000,000 15.7% 841,656 930,000 10.5% $61 $63 4.7%
Isle Waterloo $81,000,000 $94,000,000 16.0% 1,543,687 1,664,000 7.8% $52 $56 7.7%Riverside Riverside $86,000,000 $89,000,000 3.5% 2,025,004 1,700,000 -16.0% $42 $52 23.3%
Lady Luck Marquette $32,000,000 $30,000,000 -6.3% 390,401 426,000 9.1% $82 $70 -14.1%
Diamond Jo Dubuque $55,500,000 $64,000,000 15.3% 986,651 984,000 -0.3% $56 $65 15.6%Greyhound Park Dubuque $69,500,000 $72,000,000 3.6% 1,458,853 1,239,000 -15.1% $48 $58 22.0%
Isle Bettendorf $90,000,000 $98,500,000 9.4% 1,270,145 1,354,000 6.6% $71 $73 2.7%Rhythmn City Davenport $58,500,000 $60,500,000 3.4% 953,567 960,000 0.7% $61 $63 2.7%
Wild Rose Clinton $42,000,000 $46,500,000 10.7% 857,399 878,000 2.4% $49 $53 8.1%
Catfish Bend Burlington $39,000,000 $38,000,000 -2.6% 770,031 839,000 9.0% $51 $45 -10.6%
TOTALS $1,415,500,000 $1,640,000,000 15.9% 22,865,451 24,500,000 7.1% $62 $67 8.1%
* FY 2009 projections by GVA Marquette Advisors based on market analysis and review of YTD (9 months) casino performance statistics
* FY 2013 projections by GVA Marquette Advisors based on market analysis.
Sources: IRGC; GVA Marquette Advisors
Table 10
Projected Gaming Revenue and Win per Admission, Base "As Is" ScenarioIowa Casinos, 2009-2013
Gaming Revenue Total Admissions Casino Net Win per Admission

Iowa Gaming Market Analysis May 2009 Page 44
GVA Marquette Advisors - International Hospitality & Gaming Consultants
The projection model shows significant revenue growth within the Council Bluffs area. The three casinos there are projected to generate combined revenues of approximately $550 million by 2013. This represents an approximate increase of 20% over current levels. This significant increase is partly attributable to further market penetration by Horseshoe as a result of its redevelopment and expansion. However, much of the growth is due to projected population growth in this area. Southeast Nebraska is projected to add approximately 70,000 people between 2008 and 2013, including about 50,000 new residents in the Omaha area (including Sarpy and Douglas Counties). Another notable trend is the projected growth in revenues at Prairie Meadows, from $192,000,000 to $250,000,000, resulting from planned facility improvements, a hotel addition, and more substantial population and income growth within the greater Des Moines area. We also note that Lady Luck-Marquette and Catfish Bend-Burlington are projected to see modest declines in gaming revenues through 2013. This relates to recent increases in competition from newer more appealing resort casino complexes. As such, we expect that both facilities will attract fewer visits from more distant markets, as more of those gamers will opt for newer casinos such as Jumers (Rock Island), Wild Rose (Clinton), Riverside and Isle-Waterloo. The average spend per patron is also projected to decline significantly at both Marquette and Burlington. This is due to more localized play. Local players tend to visit more frequently, but spend considerably less per visit compared to gamers residing farther from the casino. Underperforming Facilities GVA Marquette Advisors was asked to identify potentially “underperforming” submarkets and facilities. Our analysis indicates that the above-noted Marquette and Burlington facilities are likely to underperform in the coming five years, specifically with respect to their regional markets. They will likely continue to capture regular local play, although their destination business is likely to suffer due to increasing competition. Meanwhile, we also note that Riverside to date has had success in attracting regular patronage from its local market, that comprised mainly of Iowa City. This is evident in admissions and win per admission data. However, in analyzing hotel statistics provided by the property, together with gaming admissions and revenue data, it is evident that the property has been unsuccessful in gaining significant penetration in more distant markets. Though the property is of high quality and offers an attractive array of amenities, it suffers from a locational disadvantage related to key urban markets such as Waterloo/Cedar Falls and Des Moines. Urban casinos within the Quad Cities also prohibit Riverside from penetrating that market. Meanwhile, we expect that Isle-Waterloo will see a continued ramp up in its capture of gamer visits emanating from throughout eastern Iowa over the coming months, also impacting Riverside, along with the tribal facility in Tama County (Meskwaki). Therefore, to conclude we believe that Riverside will continue to struggle in capturing destination gamers, although it should continue to dominate the local Iowa City market. The casino should work to attract higher-income gamers from within this local market in order to boost the average win per admission.

Iowa Gaming Market Analysis May 2009 Page 45
GVA Marquette Advisors - International Hospitality & Gaming Consultants
Underserved Markets GVA Marquette Advisors was also asked to identify potentially “underserved” submarkets within Iowa, based on the supply of gaming facilities related to various population centers throughout the state. As noted previously, from our work here, and based on our knowledge and experience in evaluating similar and comparable gaming markets throughout the United States, we are of the opinion that the Iowa gaming market is approaching an “equilibrium” situation, whereby the supply and performance of its casinos has fully tapped the available surrounding market. This means that further addition of gaming facilities in future years would likely have an increasingly dilutive impact upon existing casinos, rather than generating “new” demand by tapping underserved markets. However, we believe that an exception may exist within the far northwestern corner of Iowa. From our analysis we believe that Lyon County presents an opportunity for a new Iowa casino to penetrate the sizable Sioux Falls market just to the northwest, as well as neighboring southwestern Minnesota to a degree. Such a development would likely have some dilutive impact upon the Argosy-Sioux City and Wild Rose-Emmetsburg, however we would expect that impact to be modest, since only a small percentage of casino patrons at those facilities reside in the Sioux Falls area. A Lyon County development scenario is analyzed in detail below, along with other scenarios which assume gaming facilities of varying sizes are built in Wapello, Webster, Franklin, and Tama Counties. Iowa Gaming Projections (2013) – Alternative Scenarios The following paragraphs outline our analysis and the results of varied scenarios which assume casinos are developed in Lyon, Wapello, Webster, Franklin and Tama Counties. Casinos of varying size and cost levels were considered for each county. For each scenario, the 2013 base model was recalibrated to reflect the development of a new casino complex. Again, casino visitation and net win estimates were developed for each county and distributed to various casinos throughout the market, including new casinos as per each scenario. Gaming participation rates were adjusted where appropriate to reflect the development of a new gaming venue within an easy driving distance. Meanwhile, key adjustments were made to reflect changes in capture rates among Iowa casinos resulting from new competition. Market share allocations were adjusted by GVA Marquette Advisors based on our review of actual casino performance statistics in recent years, paired with our site visits and detailed review of each assumed new casino and existing casinos in terms of the following key variables:
• Proximity to various population segments • Ease of access and highway network • Casino size and quality • Lodging and amenity components – size and quality • Casino branding and player club
Scenario 1: Lyon County Gaming Development
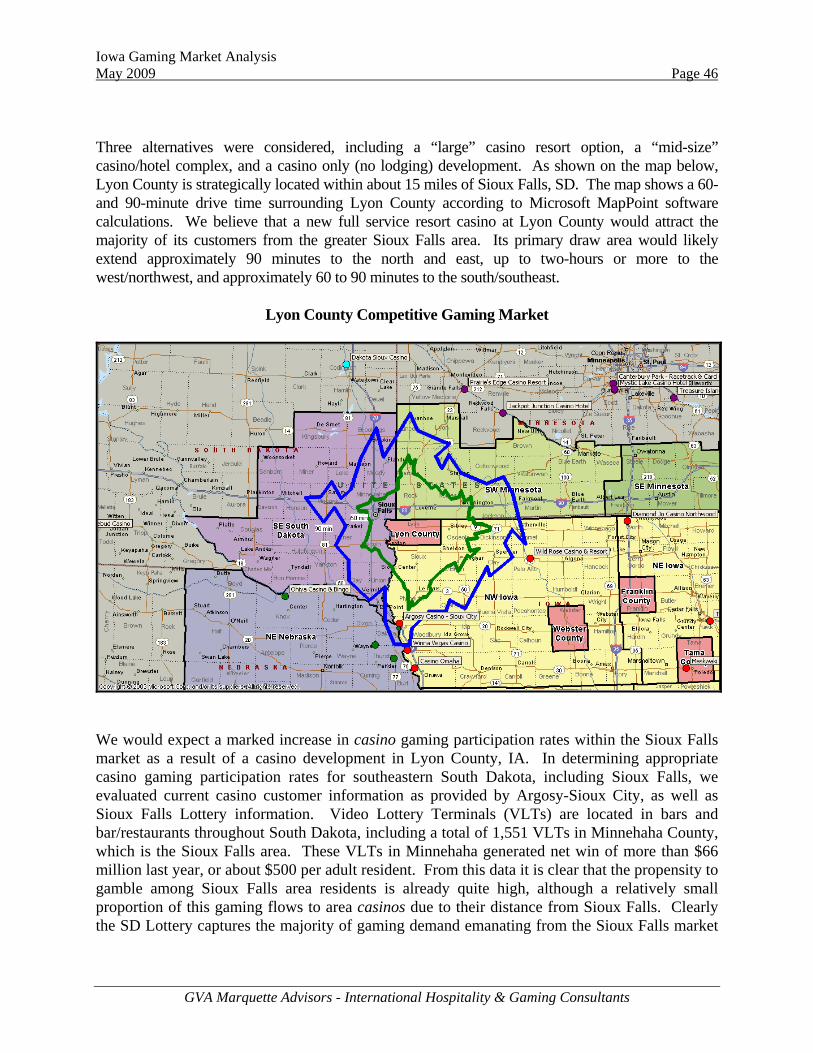
Iowa Gaming Market Analysis May 2009 Page 46
GVA Marquette Advisors - International Hospitality & Gaming Consultants
Three alternatives were considered, including a “large” casino resort option, a “mid-size” casino/hotel complex, and a casino only (no lodging) development. As shown on the map below, Lyon County is strategically located within about 15 miles of Sioux Falls, SD. The map shows a 60- and 90-minute drive time surrounding Lyon County according to Microsoft MapPoint software calculations. We believe that a new full service resort casino at Lyon County would attract the majority of its customers from the greater Sioux Falls area. Its primary draw area would likely extend approximately 90 minutes to the north and east, up to two-hours or more to the west/northwest, and approximately 60 to 90 minutes to the south/southeast.
Lyon County Competitive Gaming Market
We would expect a marked increase in casino gaming participation rates within the Sioux Falls market as a result of a casino development in Lyon County, IA. In determining appropriate casino gaming participation rates for southeastern South Dakota, including Sioux Falls, we evaluated current casino customer information as provided by Argosy-Sioux City, as well as Sioux Falls Lottery information. Video Lottery Terminals (VLTs) are located in bars and bar/restaurants throughout South Dakota, including a total of 1,551 VLTs in Minnehaha County, which is the Sioux Falls area. These VLTs in Minnehaha generated net win of more than $66 million last year, or about $500 per adult resident. From this data it is clear that the propensity to gamble among Sioux Falls area residents is already quite high, although a relatively small proportion of this gaming flows to area casinos due to their distance from Sioux Falls. Clearly the SD Lottery captures the majority of gaming demand emanating from the Sioux Falls market

Iowa Gaming Market Analysis May 2009 Page 47
GVA Marquette Advisors - International Hospitality & Gaming Consultants
presently, with a small amount of demand leaking out to facilities such as Prairies Edge and Jackpot Junction in southwestern MN, and Argosy-Sioux City. From our review of player tracking data provided by Argosy, reflecting about 50% of net win at that facility last year as distributed by zip code, we estimate that Argosy-Sioux City captured less than $4,000,000 in net win last year from the Sioux Falls market. From our analysis, we would expect a new casino at Lyon County would have a significant impact upon VLT revenues in southwestern SD, particularly in the Sioux Falls area, as more of those gaming dollars would be spent at the casino, which would offer a much more appealing facility and overall gaming experience. Thus SD VLT revenues would likely be effected more so than Iowa gaming revenues. Argosy-Sioux City would see a modest impact, as would Wild Rose-Emmetsburg and Diamond Jo-Northwood related to the primarily rural population residing in far northwestern Iowa and southwestern Minnesota. The table on the following page summarizes our projections for three casino alternatives in Lyon County, varying in size and scope, as well as the financial viability of each project and its expected market impact. Overall, assuming the development of a “large” resort-style casino at Lyon County, we have estimated that casino gaming participation rates (excluding VLT gaming) would range from about 5.0 to 7.0 annual visits per adult within 30 to 60 minutes of the casino, and from 1.0 to 4.0 within 60 to 120 minutes surrounding the complex. Average expenditures per patron were estimated based on our review of spending patterns at other casinos in the region, and vary by county by distance traveled. After recalibrating the 2013 gaming model to reflect these changes, we estimate that a large resort casino at Lyon County would generate revenues of approximately $75,000,000, with annual admissions of 1,300,000 patrons. This facility would likely include around 1,200 to 1,400 gaming positions, a hotel with at least 120 to 150 rooms, a full range of food and beverage options ranging from quick service to fine dining, as well as conference and events facilities. Based on our review of recent casino construction costs, we estimate that such a facility would require a total investment of approximately $120,000,000. A “mid-size” casino resort option was also considered. Such a facility would likely include a smaller hotel of around 60 to 80 rooms, somewhat fewer dining options and minimal entertainment facilities & events. We assume such a facility would have around 1,000 gaming positions. Such a facility would have a slightly reduced draw area as compared to the larger resort, with the frequency of visits from nearby Sioux Falls seeing a modest impact. We estimate that such a facility would generate annual gaming revenues of approximately $60,000,000 per year, with annual admissions of approximately 1,100,000 patrons. The cost of such a facility would likely approximate $80,000,000. Lastly, we estimate that a “small” stand alone casino with around 700-900 gaming positions, no on-site lodging and a reduced food and beverage offering would generate gaming revenues of approximately $48,000,000, with approximately 1,000,000 admissions. Under this scenario, the draw area would be reduced, with the vast majority of revenues coming from the Sioux Falls market. This scenario generates the most attractive rate of return among the three considered,

Iowa Gaming Market Analysis May 2009 Page 48
GVA Marquette Advisors - International Hospitality & Gaming Consultants
from a developer/operator’s perspective. This is due to the fact that while a larger resort complex would extend the casino’s geographic reach, there are no major population centers within a reasonable driving distance.
Large Resort Mid-Size Casino onlyCasino Resort Casino (no lodging)
Projected Subject Casino PerformanceAnnual Revenues $75,000,000 $60,000,000 $48,000,000Admissions 1,300,000 1,100,000 1,000,000Win per Visit $58 $55 $48
Estimated Construction Cost $120,000,000 $80,000,000 $50,000,000
Analysis of Financial Return on InvestmentGaming Revenues $75,000,000 $60,000,000 $48,000,000Hotel $3,500,000 $2,000,000 $0F&B and Other $12,000,000 $9,000,000 $4,000,000Total Revneues $90,500,000 $71,000,000 $52,000,000Less: Expenses $67,000,000 $51,000,000 $35,000,000Projected EBITDA $23,500,000 $20,000,000 $17,000,000
% Return on Total Construction Cost 19.6% 25.0% 34.0%
Market Impact
Projected Negative Impact on Existing Iowa Casinos (lost revenue) $20,000,000 $15,000,000 $8,000,000
Projected Iowa Gaming Revenues - this scenario $1,695,000,000 $1,685,000,000 $1,680,000,000Projected Iowa Gaming Revenues - "As Is" scenario $1,640,000,000 $1,640,000,000 $1,640,000,000Change $55,000,000 $45,000,000 $40,000,000
Projected Iowa Gaming Revenues from Out of State - this scenario $820,000,000 $815,000,000 $810,000,000Projected Iowa Gaming Revenues from Out of State - "As Is" scenario $770,000,000 $770,000,000 $770,000,000Change $50,000,000 $45,000,000 $40,000,000
Economic ImpactEstimated Employment Impact 550 450 420Estimated Payroll & Employee Benefits $15,385,000 $12,070,000 $8,840,000Expenditures on Supplies and Services $22,625,000 $17,750,000 $13,000,000IA Gaming Tax $16,500,000 $13,200,000 $10,560,000
Source: GVA Marquette Advisors
Summary of Market ImpactAssumed Casino Development - Lyon County, IA
Table 11
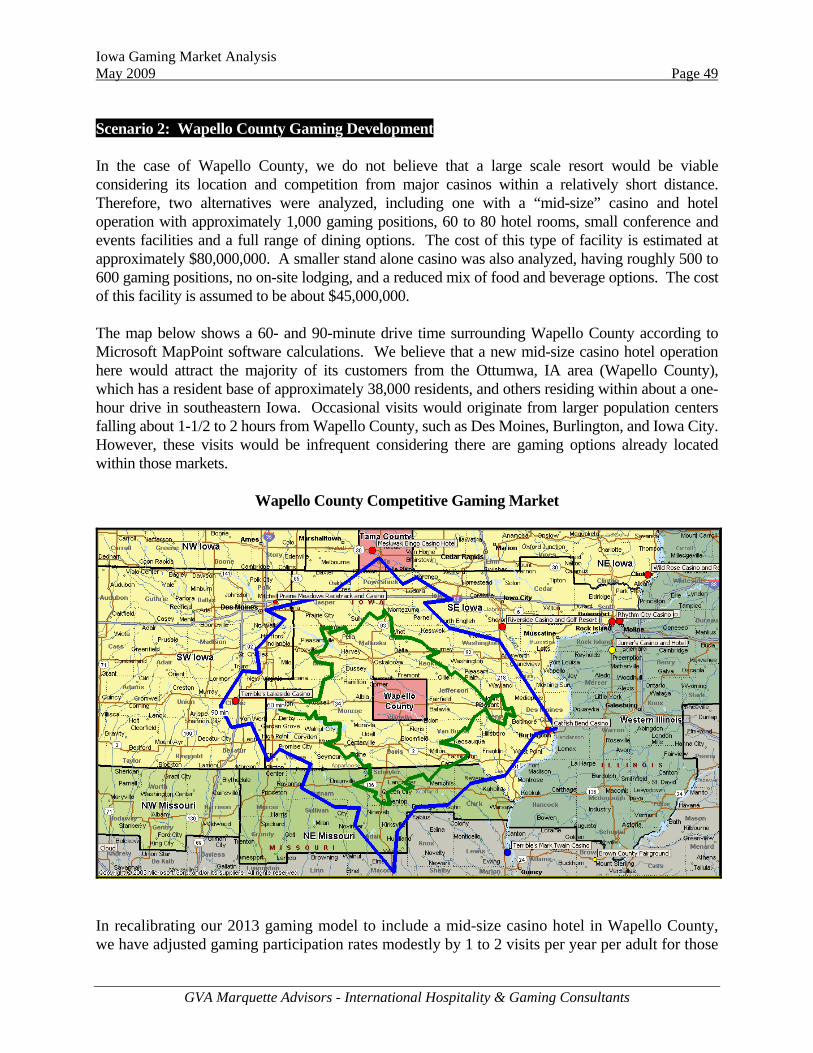
Iowa Gaming Market Analysis May 2009 Page 49
GVA Marquette Advisors - International Hospitality & Gaming Consultants
Scenario 2: Wapello County Gaming Development In the case of Wapello County, we do not believe that a large scale resort would be viable considering its location and competition from major casinos within a relatively short distance. Therefore, two alternatives were analyzed, including one with a “mid-size” casino and hotel operation with approximately 1,000 gaming positions, 60 to 80 hotel rooms, small conference and events facilities and a full range of dining options. The cost of this type of facility is estimated at approximately $80,000,000. A smaller stand alone casino was also analyzed, having roughly 500 to 600 gaming positions, no on-site lodging, and a reduced mix of food and beverage options. The cost of this facility is assumed to be about $45,000,000. The map below shows a 60- and 90-minute drive time surrounding Wapello County according to Microsoft MapPoint software calculations. We believe that a new mid-size casino hotel operation here would attract the majority of its customers from the Ottumwa, IA area (Wapello County), which has a resident base of approximately 38,000 residents, and others residing within about a one-hour drive in southeastern Iowa. Occasional visits would originate from larger population centers falling about 1-1/2 to 2 hours from Wapello County, such as Des Moines, Burlington, and Iowa City. However, these visits would be infrequent considering there are gaming options already located within those markets.
Wapello County Competitive Gaming Market
In recalibrating our 2013 gaming model to include a mid-size casino hotel in Wapello County, we have adjusted gaming participation rates modestly by 1 to 2 visits per year per adult for those

Iowa Gaming Market Analysis May 2009 Page 50
GVA Marquette Advisors - International Hospitality & Gaming Consultants
residing within about 60 miles of the property, varying by county. Market share adjustments were also made to reflect the Wapello County casino’s impact upon other Iowa casinos. Here again we allocated regional gaming visits to Wapello and other facilities based upon locational factors and our personal inspection of Iowa’s casinos. From our calculations and analysis, we estimate that a mid-size casino hotel in Wapello County would capture gaming revenue of approximately $54,000,000, with annual admissions of about 870,000 patrons. Such a casino would have a dilutive impact upon gaming revenues at Iowa’s existing casinos. In fact, we estimate that approximately 70% of the revenues at a new Wapello County casino would come in the form of business presently being captured by other casinos in the region, most notably Terribles-Lakeside, Prairie Meadows, Riverside, Catfish Bend, Isle of Capri-Bettendorf, as well as Meskwaki. A smaller stand-alone casino with approximately 500 to 600 gaming positions was also considered. Here also we have adjusted gaming participation rates upward slightly within approximately a 30 to 60 minute drive time. The size of the facility and lack of on-site hotel rooms will limit this casino’s draw area to a smaller range. We project that such a casino would capture gaming revenues of approximately $32,000,000, with about 570,000 admissions. As well, while such a casino would have an impact upon existing Iowa facilities, that impact would be less severe since the Wapello casino’s draw area would be more confined as compared to a casino hotel operation. Still, we estimate that more than 85% of the projected $32,000,000 in revenue will come directly out of other existing Iowa casinos, with very little “new” gaming demand created as a result of this development. A summary of both development scenarios is presented on the following page.
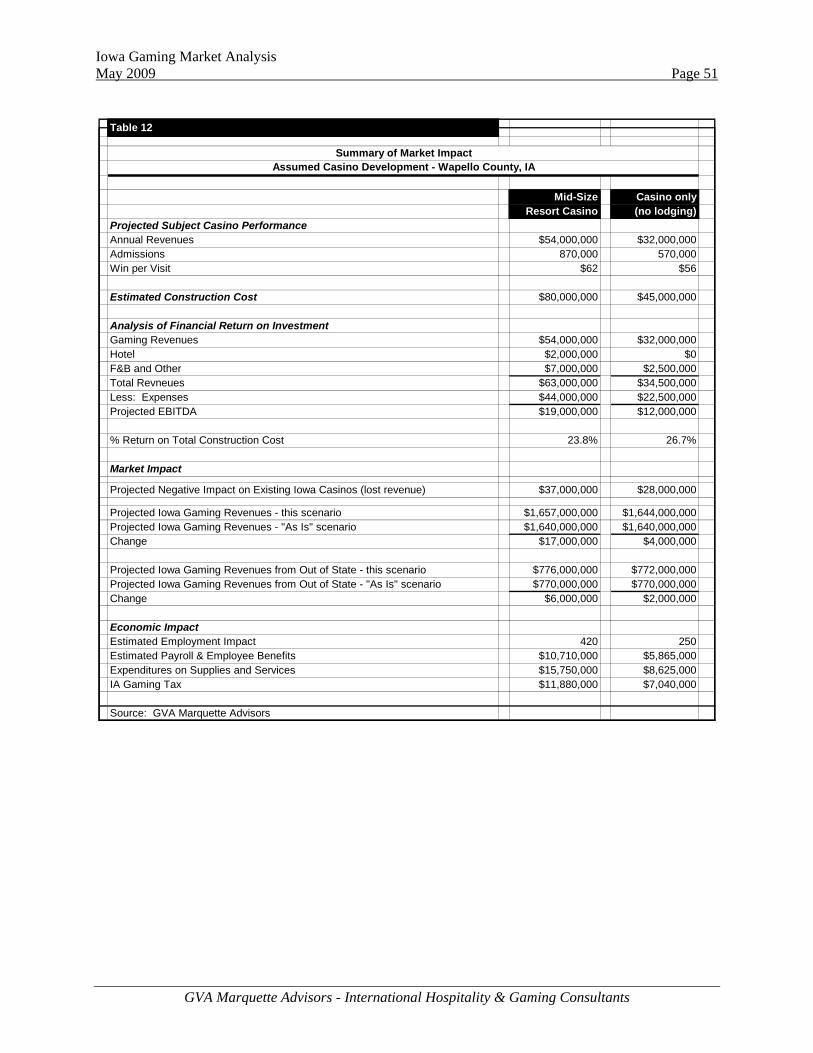
Iowa Gaming Market Analysis May 2009 Page 51
GVA Marquette Advisors - International Hospitality & Gaming Consultants
Mid-Size Casino onlyResort Casino (no lodging)
Projected Subject Casino PerformanceAnnual Revenues $54,000,000 $32,000,000Admissions 870,000 570,000Win per Visit $62 $56
Estimated Construction Cost $80,000,000 $45,000,000
Analysis of Financial Return on InvestmentGaming Revenues $54,000,000 $32,000,000Hotel $2,000,000 $0F&B and Other $7,000,000 $2,500,000Total Revneues $63,000,000 $34,500,000Less: Expenses $44,000,000 $22,500,000Projected EBITDA $19,000,000 $12,000,000
% Return on Total Construction Cost 23.8% 26.7%
Market Impact
Projected Negative Impact on Existing Iowa Casinos (lost revenue) $37,000,000 $28,000,000
Projected Iowa Gaming Revenues - this scenario $1,657,000,000 $1,644,000,000Projected Iowa Gaming Revenues - "As Is" scenario $1,640,000,000 $1,640,000,000Change $17,000,000 $4,000,000
Projected Iowa Gaming Revenues from Out of State - this scenario $776,000,000 $772,000,000Projected Iowa Gaming Revenues from Out of State - "As Is" scenario $770,000,000 $770,000,000Change $6,000,000 $2,000,000
Economic ImpactEstimated Employment Impact 420 250Estimated Payroll & Employee Benefits $10,710,000 $5,865,000Expenditures on Supplies and Services $15,750,000 $8,625,000IA Gaming Tax $11,880,000 $7,040,000
Source: GVA Marquette Advisors
Table 12
Summary of Market ImpactAssumed Casino Development - Wapello County, IA

Iowa Gaming Market Analysis May 2009 Page 52
GVA Marquette Advisors - International Hospitality & Gaming Consultants
Scenario 3: Webster County Gaming Development As with Wapello County, we do not believe that a large scale resort would be viable in Webster County considering its location and competition from other casino hotels within a relatively short distance. Therefore, two alternatives were analyzed, including one with a “mid-size” casino and hotel operation with approximately 1,000 gaming positions, 60 to 80 hotel rooms, small conference and events facilities and a full range of dining options. The cost of this type of facility is estimated at approximately $80,000,000. A smaller stand alone casino was also analyzed, having roughly 500 gaming positions, no on-site lodging, and a reduced mix of food and beverage options. The cost of this facility is assumed to be about $40,000,000. The map below shows a 60- and 90-minute drive time surrounding Webster County according to Microsoft MapPoint software calculations. We would expect a mid-size casino hotel operation here would attract regular patronage from the local Fort Dodge, IA area (Webster County), which has a resident base of approximately 38,000 residents. Our model adjustments under this scenario include an increase in gaming participation rates of 1 to 2 casino visits per year per adult for those residing within 60 minutes of Webster County. Most casino visits would likely originate within 30 to 60 minutes of the property. Due to its size and amenity base, notably on-site lodging, the casino would likely attract occasional visits from persons residing between 90 and 120 minutes from the facility, with most such business focused on weekends. However, these visits would be infrequent considering there are gaming options already located within those markets.
Webster County Competitive Gaming Market
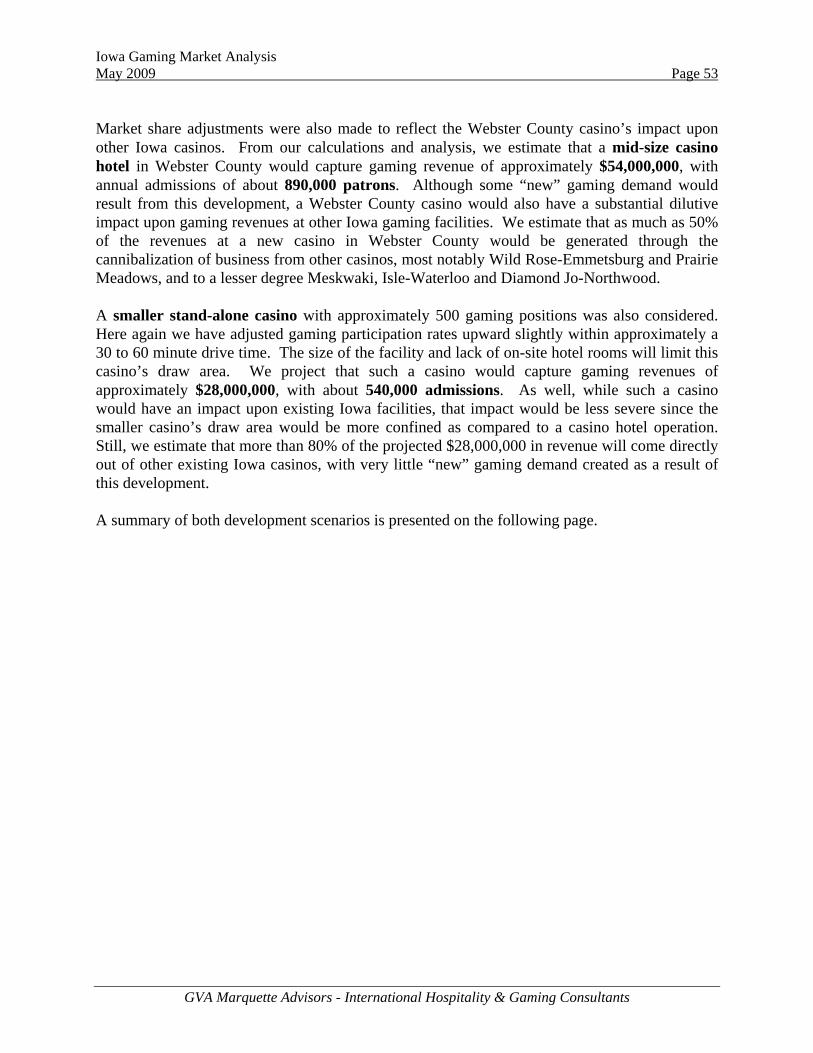
Iowa Gaming Market Analysis May 2009 Page 53
GVA Marquette Advisors - International Hospitality & Gaming Consultants
Market share adjustments were also made to reflect the Webster County casino’s impact upon other Iowa casinos. From our calculations and analysis, we estimate that a mid-size casino hotel in Webster County would capture gaming revenue of approximately $54,000,000, with annual admissions of about 890,000 patrons. Although some “new” gaming demand would result from this development, a Webster County casino would also have a substantial dilutive impact upon gaming revenues at other Iowa gaming facilities. We estimate that as much as 50% of the revenues at a new casino in Webster County would be generated through the cannibalization of business from other casinos, most notably Wild Rose-Emmetsburg and Prairie Meadows, and to a lesser degree Meskwaki, Isle-Waterloo and Diamond Jo-Northwood. A smaller stand-alone casino with approximately 500 gaming positions was also considered. Here again we have adjusted gaming participation rates upward slightly within approximately a 30 to 60 minute drive time. The size of the facility and lack of on-site hotel rooms will limit this casino’s draw area. We project that such a casino would capture gaming revenues of approximately $28,000,000, with about 540,000 admissions. As well, while such a casino would have an impact upon existing Iowa facilities, that impact would be less severe since the smaller casino’s draw area would be more confined as compared to a casino hotel operation. Still, we estimate that more than 80% of the projected $28,000,000 in revenue will come directly out of other existing Iowa casinos, with very little “new” gaming demand created as a result of this development. A summary of both development scenarios is presented on the following page.
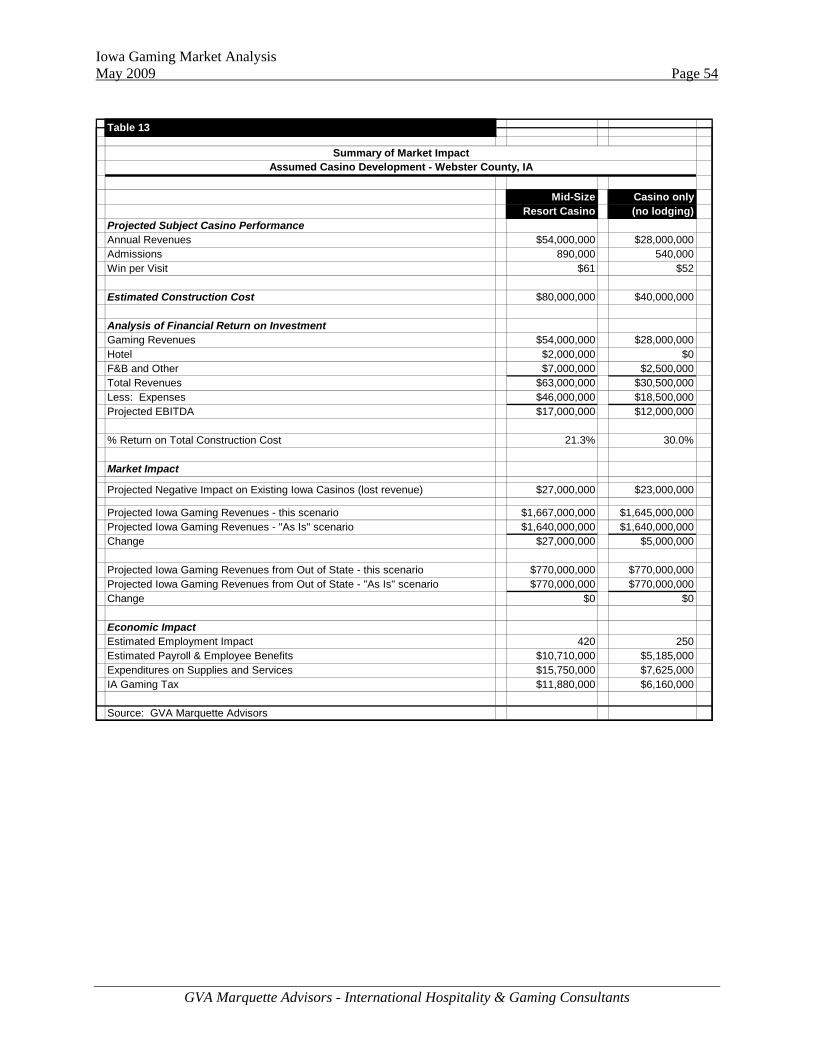
Iowa Gaming Market Analysis May 2009 Page 54
GVA Marquette Advisors - International Hospitality & Gaming Consultants
Mid-Size Casino onlyResort Casino (no lodging)
Projected Subject Casino PerformanceAnnual Revenues $54,000,000 $28,000,000Admissions 890,000 540,000Win per Visit $61 $52
Estimated Construction Cost $80,000,000 $40,000,000
Analysis of Financial Return on InvestmentGaming Revenues $54,000,000 $28,000,000Hotel $2,000,000 $0F&B and Other $7,000,000 $2,500,000Total Revenues $63,000,000 $30,500,000Less: Expenses $46,000,000 $18,500,000Projected EBITDA $17,000,000 $12,000,000
% Return on Total Construction Cost 21.3% 30.0%
Market Impact
Projected Negative Impact on Existing Iowa Casinos (lost revenue) $27,000,000 $23,000,000
Projected Iowa Gaming Revenues - this scenario $1,667,000,000 $1,645,000,000Projected Iowa Gaming Revenues - "As Is" scenario $1,640,000,000 $1,640,000,000Change $27,000,000 $5,000,000
Projected Iowa Gaming Revenues from Out of State - this scenario $770,000,000 $770,000,000Projected Iowa Gaming Revenues from Out of State - "As Is" scenario $770,000,000 $770,000,000Change $0 $0
Economic ImpactEstimated Employment Impact 420 250Estimated Payroll & Employee Benefits $10,710,000 $5,185,000Expenditures on Supplies and Services $15,750,000 $7,625,000IA Gaming Tax $11,880,000 $6,160,000
Source: GVA Marquette Advisors
Table 13
Summary of Market ImpactAssumed Casino Development - Webster County, IA

Iowa Gaming Market Analysis May 2009 Page 55
GVA Marquette Advisors - International Hospitality & Gaming Consultants
Scenario 4: Franklin County Gaming Development We have analyzed two development alternatives for Franklin County, the first of which is a “mid-size” casino and hotel operation with approximately 1,000 gaming positions, 60 to 80 hotel rooms, small conference and events facilities and a full range of dining options. The cost of this type of facility is estimated at approximately $80,000,000. A smaller stand alone casino was also analyzed, having roughly 500 gaming positions, no on-site lodging, and a reduced mix of food and beverage options. The cost of this facility is assumed to be about $40,000,000. The map below shows a 60- and 90-minute drive time surrounding Franklin County according to Microsoft MapPoint software calculations. We would expect a mid-size casino hotel operation here would attract regular patronage from a “local” market extending approximately 30 minutes from the property. Key local feeder markets would include Mason City and Clear Lake to the north. These markets would be shared with the Diamond Jo Casino at Northwood, as well as Wild rose-Emmetsburg. Important population centers within about a one-hour drive to the south include Fort Dodge and Ames. Major markets within 90 minutes include Des Moines to the south and Waterloo and Cedar Falls to the east. However, a Franklin County casino would probably attract a very small percentage of casino visits emanating from those markets due to the presence of very large casino facilities within both Des Moines and Waterloo.
Franklin County Competitive Gaming Market

Iowa Gaming Market Analysis May 2009 Page 56
GVA Marquette Advisors - International Hospitality & Gaming Consultants
Casino gaming participation rates are already fairly high within the subject market due to the presence of multiple gaming venues within a reasonable driving distance and relatively few alternative leisure and recreational facilities. Nonetheless, our gaming model adjustments under this scenario include modest increases in participation rates within about 30 to 60 minutes of Franklin County, again varying by county. Participation rates throughout the broader market were mostly held constant. Market share adjustments were also made to reflect a Franklin County casino’s impact upon other casinos. From our calculations and analysis, we estimate that a mid-size casino hotel in Franklin County would capture gaming revenue of approximately $49,000,000, with annual admissions of about 765,000 patrons. As with the other central-Iowa casino development scenarios, such a project would likely result in a modest increase in overall casino gaming in Iowa. Rather, we estimate that about 70% of the revenues at a new Franklin County casino would be generated through the cannibalization of business from other casinos, most notably Diamond Jo-Northwood and Wild Rose-Emmetsburg, as well as Prairie Meadows, Isle-Waterloo and Meskwaki to a lesser degree. A smaller stand-alone casino with approximately 500 gaming positions was also considered. Here again we have adjusted gaming participation rates upward slightly within approximately a 30 to 60 minute drive time. The size of the facility and lack of on-site hotel rooms will limit this casino’s draw area. We project that such a casino would capture gaming revenues of approximately $28,000,000, with about 480,000 admissions. As well, while such a casino would have an impact upon existing Iowa facilities, that impact would be less severe since the smaller casino’s draw area would be more confined as compared to a casino hotel operation. Still, we estimate that about 80% of the projected $28,000,000 in revenue will come directly out of other existing Iowa casinos, with very little “new” gaming demand created as a result of this development. A summary of both development scenarios is presented on the following page.
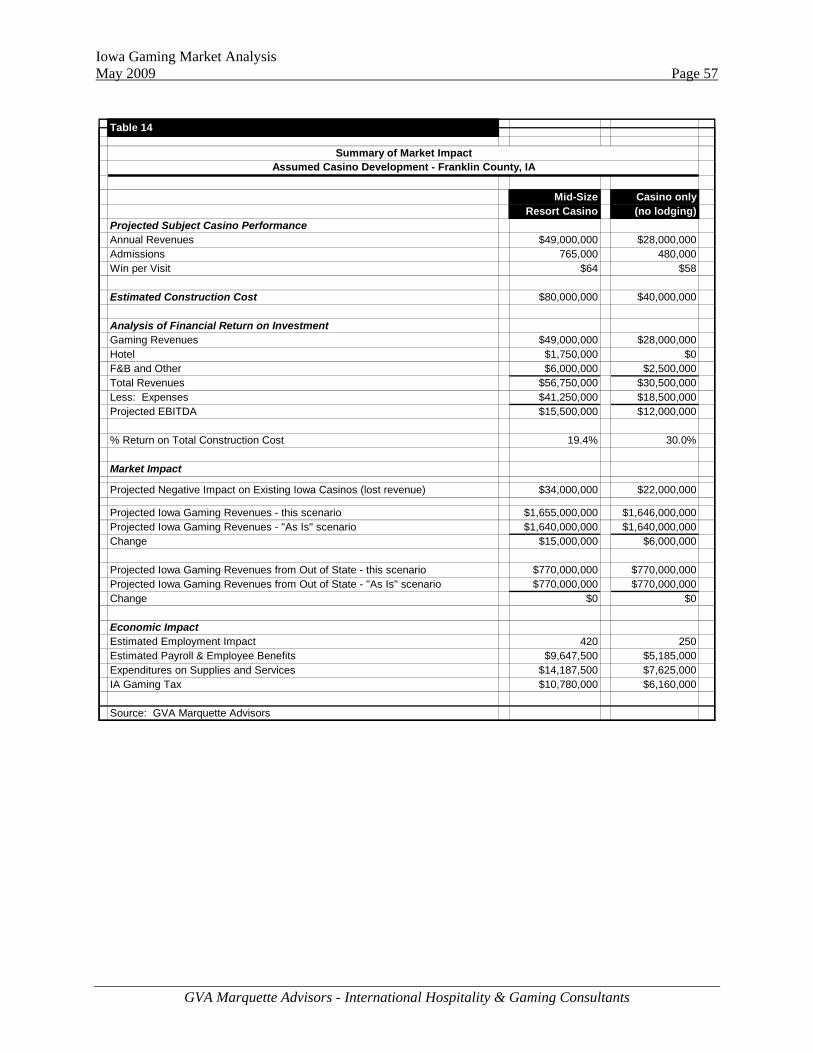
Iowa Gaming Market Analysis May 2009 Page 57
GVA Marquette Advisors - International Hospitality & Gaming Consultants
Mid-Size Casino onlyResort Casino (no lodging)
Projected Subject Casino PerformanceAnnual Revenues $49,000,000 $28,000,000Admissions 765,000 480,000Win per Visit $64 $58
Estimated Construction Cost $80,000,000 $40,000,000
Analysis of Financial Return on InvestmentGaming Revenues $49,000,000 $28,000,000Hotel $1,750,000 $0F&B and Other $6,000,000 $2,500,000Total Revenues $56,750,000 $30,500,000Less: Expenses $41,250,000 $18,500,000Projected EBITDA $15,500,000 $12,000,000
% Return on Total Construction Cost 19.4% 30.0%
Market Impact
Projected Negative Impact on Existing Iowa Casinos (lost revenue) $34,000,000 $22,000,000
Projected Iowa Gaming Revenues - this scenario $1,655,000,000 $1,646,000,000Projected Iowa Gaming Revenues - "As Is" scenario $1,640,000,000 $1,640,000,000Change $15,000,000 $6,000,000
Projected Iowa Gaming Revenues from Out of State - this scenario $770,000,000 $770,000,000Projected Iowa Gaming Revenues from Out of State - "As Is" scenario $770,000,000 $770,000,000Change $0 $0
Economic ImpactEstimated Employment Impact 420 250Estimated Payroll & Employee Benefits $9,647,500 $5,185,000Expenditures on Supplies and Services $14,187,500 $7,625,000IA Gaming Tax $10,780,000 $6,160,000
Source: GVA Marquette Advisors
Table 14
Summary of Market ImpactAssumed Casino Development - Franklin County, IA

Iowa Gaming Market Analysis May 2009 Page 58
GVA Marquette Advisors - International Hospitality & Gaming Consultants
Scenario 5: Tama County Gaming Development Tama County is a rural county; however, it is strategically located within a 60- to 90-minute drive from four of Iowa’s largest cities, those being Waterloo and Cedar Falls to the north, Cedar Rapids and Iowa City to the east, and Des Moines to the southwest. Other significant population centers in the area include Ames, about 80 minutes to the west, and Marshalltown approximately 15 minutes to the west. Because of its location within an easy driving range of several key population centers, Tama County was considered for both a “large” and “mid size” resort casino. Several large casinos exist within close proximity, however, creating a very competitive market situation. In fact, since the opening of Riverside and Isle-Waterloo, we are aware the large tribal facility known as Meskwaki, located within Tama County, has seen a significant decline in its share of regional gaming expenditures. Riverside has also had difficulty in penetrating more distant markets since the opening of the Isle facility. Moreover, we expect that Altoona’s Prairie Meadows Casino will capture more regional gamer visits upon completion of its expansion and on-site hotel addition.
Tama County Competitive Gaming Market
The “large” casino resort option which we evaluated assumed the development of a casino with approximately 1,500 to 1,700 gaming positions, a hotel with around 200 rooms, spa, extensive food and beverage options ranging from casual to fine dining, a significant conference facility, and a quality events center with seating for at least 1,000 guests. The cost of such a facility is estimated at
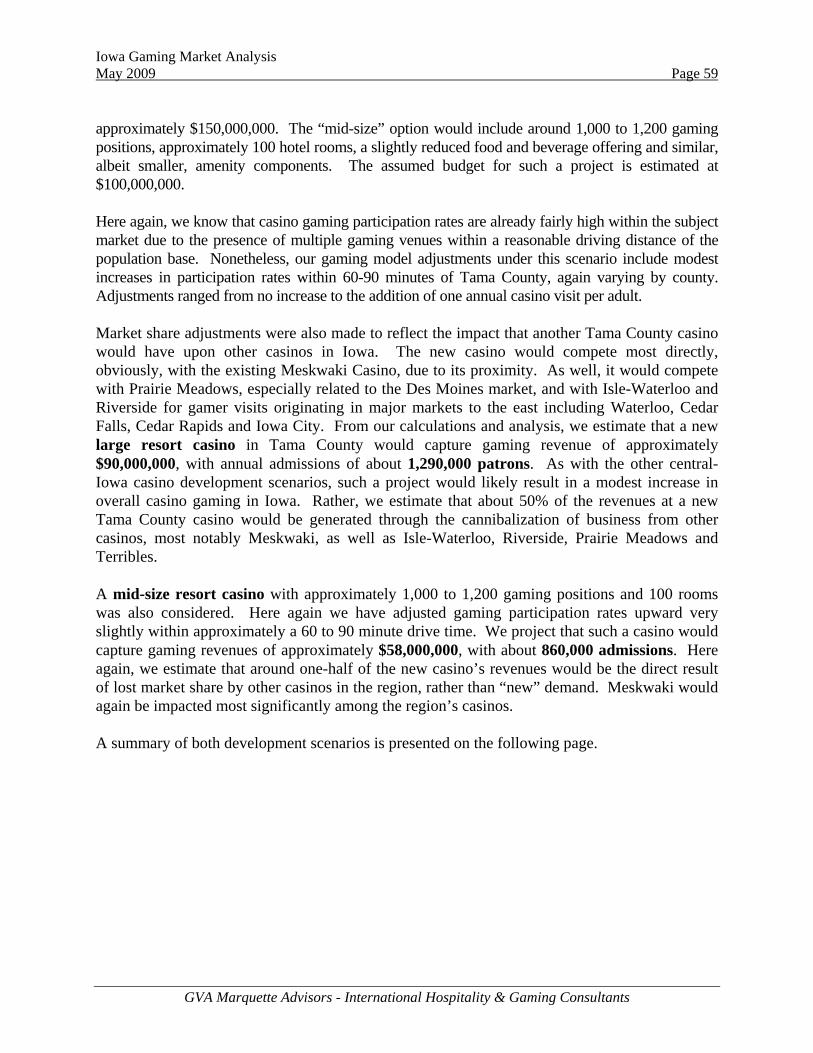
Iowa Gaming Market Analysis May 2009 Page 59
GVA Marquette Advisors - International Hospitality & Gaming Consultants
approximately $150,000,000. The “mid-size” option would include around 1,000 to 1,200 gaming positions, approximately 100 hotel rooms, a slightly reduced food and beverage offering and similar, albeit smaller, amenity components. The assumed budget for such a project is estimated at $100,000,000. Here again, we know that casino gaming participation rates are already fairly high within the subject market due to the presence of multiple gaming venues within a reasonable driving distance of the population base. Nonetheless, our gaming model adjustments under this scenario include modest increases in participation rates within 60-90 minutes of Tama County, again varying by county. Adjustments ranged from no increase to the addition of one annual casino visit per adult. Market share adjustments were also made to reflect the impact that another Tama County casino would have upon other casinos in Iowa. The new casino would compete most directly, obviously, with the existing Meskwaki Casino, due to its proximity. As well, it would compete with Prairie Meadows, especially related to the Des Moines market, and with Isle-Waterloo and Riverside for gamer visits originating in major markets to the east including Waterloo, Cedar Falls, Cedar Rapids and Iowa City. From our calculations and analysis, we estimate that a new large resort casino in Tama County would capture gaming revenue of approximately $90,000,000, with annual admissions of about 1,290,000 patrons. As with the other central-Iowa casino development scenarios, such a project would likely result in a modest increase in overall casino gaming in Iowa. Rather, we estimate that about 50% of the revenues at a new Tama County casino would be generated through the cannibalization of business from other casinos, most notably Meskwaki, as well as Isle-Waterloo, Riverside, Prairie Meadows and Terribles. A mid-size resort casino with approximately 1,000 to 1,200 gaming positions and 100 rooms was also considered. Here again we have adjusted gaming participation rates upward very slightly within approximately a 60 to 90 minute drive time. We project that such a casino would capture gaming revenues of approximately $58,000,000, with about 860,000 admissions. Here again, we estimate that around one-half of the new casino’s revenues would be the direct result of lost market share by other casinos in the region, rather than “new” demand. Meskwaki would again be impacted most significantly among the region’s casinos. A summary of both development scenarios is presented on the following page.

Iowa Gaming Market Analysis May 2009 Page 60
GVA Marquette Advisors - International Hospitality & Gaming Consultants
Large Mid-SizeResort Casino Resort Casino
Projected Subject Casino PerformanceAnnual Revenues $90,000,000 $58,000,000Admissions 1,290,000 860,000Win per Visit $70 $67
Estimated Construction Cost $150,000,000 $100,000,000
Analysis of Financial Return on InvestmentGaming Revenues $90,000,000 $58,000,000Hotel $5,500,000 $2,700,000F&B and Other $11,500,000 $7,500,000Total Revenues $107,000,000 $68,200,000Less: Expenses $79,000,000 $47,200,000Projected EBITDA $28,000,000 $21,000,000
% Return on Total Construction Cost 18.7% 21.0%
Market Impact
Projected Negative Impact on Existing Iowa Casinos (lost revenue) $40,000,000 $33,000,000
Projected Iowa Gaming Revenues - this scenario $1,690,000,000 $1,665,000,000Projected Iowa Gaming Revenues - "As Is" scenario $1,640,000,000 $1,640,000,000Change $50,000,000 $25,000,000
Projected Iowa Gaming Revenues from Out of State - this scenario $770,000,000 $770,000,000Projected Iowa Gaming Revenues from Out of State - "As Is" scenario $770,000,000 $770,000,000Change $0 $0
Economic ImpactEstimated Employment Impact 600 480Estimated Payroll & Employee Benefits $18,190,000 $11,594,000Expenditures on Supplies and Services $26,750,000 $17,050,000IA Gaming Tax $19,800,000 $12,760,000
Source: GVA Marquette Advisors
Table 15
Summary of Market ImpactAssumed Casino Development - Tama County, IA

Iowa Gaming Market Analysis May 2009 Page 61
GVA Marquette Advisors - International Hospitality & Gaming Consultants
SUMMARY OF CONCLUSIONS Several gaming venues have been developed throughout the State. Today, most of Iowa’s significant population centers have access to one or more casinos within a driving distance of one to two hours, or less. As well, several casinos have been developed in border communities, thereby attracting gaming dollars from outside the State. Examples include the Council Bluffs market, which effectively taps the Omaha market, Lincoln and much of Nebraska, as well as Kansas and Missouri to a lesser degree. Meanwhile, Dubuque’s facilities and those in the Quad Cities are positioned to capture gamer visits from neighboring Wisconsin and Illinois. Small to mid-size casinos such as those at Marquette, Clinton, and Burlington operate similarly, albeit on a smaller scale. Northern Iowa facilities such as Wild Rose-Emmetsburg and Diamond Jo-Northwood (especially) have had success in serving the primarily rural northern Iowa markets and also tapping southern Minnesota population centers such as Albert Lea, Austin and Owatonna. Those casinos located within the central part of the State such as Riverside, Isle-Waterloo, Meskwaki, Prairie Meadows and Terribles provide multiple attractive gaming options for persons residing in major Iowa cities such as Des Moines, Waterloo/Cedar Falls, Cedar Rapids and Iowa City. In summary, we believe that the opportunity for additional gaming development in Iowa is limited at this time. Based on our analysis and professional experience, we believe that most of Iowa is approaching and “equilibrium” gaming market situation, whereby the supply of gaming approximately matches up with maximum demand originating from the population base. Our analysis indicates that while several individual casino projects may be financially feasible, most of the casino development alternatives considered would create only a modest amount of new gaming demand in Iowa, while resulting in lost market share among many existing Iowa casinos. However, our analysis does show that a casino development in Lyon County could result in a marked increase in Iowa’s capture of gaming expenditures from outside the State, due to Lyon County’s proximity to the Sioux Falls market and the current distance of casino facilities from this significant population base. Our analysis shows that “locals” oriented casino seems to demonstrate the most favorable return on investment, considering that the majority of customers would likely arrive from the Sioux Falls market, less than 20 minutes to the northwest, and considering the relatively sparse population base farther to the west. Moreover, our analysis shows that a new casino in Lyon County would likely have only a modest impact upon two casinos in Iowa, those being Wild Rose-Emmetsburg and Argosy at Sioux Falls. The matrix on the following page summarizes our gaming projections and the impact of varied scenarios upon the Iowa market.

Large Mid-Size Casino only Mid-Size Casino only Mid-Size Casino only Mid-Size Casino only Large Mid-SizeCasino Resort Casino Resort (no lodging) Casino Resort (no lodging) Casino Resort (no lodging) Casino Resort (no lodging) Casino Resort Casino Resort
Projected Subject Casino PerformanceAnnual Revenues $75,000,000 $60,000,000 $48,000,000 $54,000,000 $32,000,000 $54,000,000 $28,000,000 $49,000,000 $28,000,000 $90,000,000 $58,000,000Admissions 1,300,000 1,100,000 1,000,000 870,000 570,000 890,000 540,000 765,000 480,000 1,290,000 860,000Win per Visit $58 $55 $48 $62 $56 $61 $52 $64 $58 $70 $67
Estimated Construction Cost $120,000,000 $80,000,000 $50,000,000 $80,000,000 $45,000,000 $80,000,000 $40,000,000 $80,000,000 $40,000,000 $150,000,000 $100,000,000
Analysis of Financial Return on InvestmentGaming Revenues $75,000,000 $60,000,000 $48,000,000 $54,000,000 $32,000,000 $54,000,000 $28,000,000 $49,000,000 $28,000,000 $90,000,000 $58,000,000Hotel $3,500,000 $2,000,000 $0 $2,000,000 $0 $2,000,000 $0 $1,750,000 $0 $5,500,000 $2,700,000F&B and Other $12,000,000 $9,000,000 $4,000,000 $7,000,000 $2,500,000 $7,000,000 $2,500,000 $6,000,000 $2,500,000 $11,500,000 $7,500,000Total Revneues $90,500,000 $71,000,000 $52,000,000 $63,000,000 $34,500,000 $63,000,000 $30,500,000 $56,750,000 $30,500,000 $107,000,000 $68,200,000Less: Expenses $67,000,000 $51,000,000 $35,000,000 $44,000,000 $22,500,000 $46,000,000 $18,500,000 $41,250,000 $18,500,000 $79,000,000 $47,200,000Projected EBITDA $23,500,000 $20,000,000 $17,000,000 $19,000,000 $12,000,000 $17,000,000 $12,000,000 $15,500,000 $12,000,000 $28,000,000 $21,000,000
% Return on Total Construction Cost 19.6% 25.0% 34.0% 23.8% 26.7% 21.3% 30.0% 19.4% 30.0% 18.7% 21.0%
Market Impact
Projected Negative Impact on Existing Iowa Casinos (lost revenue) $20,000,000 $15,000,000 $8,000,000 $37,000,000 $28,000,000 $27,000,000 $23,000,000 $34,000,000 $22,000,000 $40,000,000 $33,000,000
Projected Iowa Gaming Revenues - this scenario $1,695,000,000 $1,685,000,000 $1,680,000,000 $1,657,000,000 $1,644,000,000 $1,667,000,000 $1,645,000,000 $1,655,000,000 $1,646,000,000 $1,690,000,000 $1,665,000,000Projected Iowa Gaming Revenues - "As Is" scenario $1,640,000,000 $1,640,000,000 $1,640,000,000 $1,640,000,000 $1,640,000,000 $1,640,000,000 $1,640,000,000 $1,640,000,000 $1,640,000,000 $1,640,000,000 $1,640,000,000Change $55,000,000 $45,000,000 $40,000,000 $17,000,000 $4,000,000 $27,000,000 $5,000,000 $15,000,000 $6,000,000 $50,000,000 $25,000,000
Projected Iowa Gaming Revenues from Out of State - this scenario $820,000,000 $815,000,000 $810,000,000 $776,000,000 $772,000,000 $770,000,000 $770,000,000 $770,000,000 $770,000,000 $770,000,000 $770,000,000Projected Iowa Gaming Revenues from Out of State - "As Is" scenario $770,000,000 $770,000,000 $770,000,000 $770,000,000 $770,000,000 $770,000,000 $770,000,000 $770,000,000 $770,000,000 $770,000,000 $770,000,000Change $50,000,000 $45,000,000 $40,000,000 $6,000,000 $2,000,000 $0 $0 $0 $0 $0 $0
Economic ImpactEstimated Employment Impact 550 450 420 420 250 420 250 420 250 600 480Estimated Payroll & Employee Benefits $15,385,000 $12,070,000 $8,840,000 $10,710,000 $5,865,000 $10,710,000 $5,185,000 $9,647,500 $5,185,000 $18,190,000 $11,594,000Expenditures on Supplies and Services $22,625,000 $17,750,000 $13,000,000 $15,750,000 $8,625,000 $15,750,000 $7,625,000 $14,187,500 $7,625,000 $26,750,000 $17,050,000IA Gaming Tax $16,500,000 $13,200,000 $10,560,000 $11,880,000 $7,040,000 $11,880,000 $6,160,000 $10,780,000 $6,160,000 $19,800,000 $12,760,000
Franklin Co. Development Scenarios Tama Co. Development Scenarios
Summary of Market ImpactIowa Gaming Market - 2013 - Varied Development Scenarios
Table 16
Lyon Co. Development Scenarios Wapello Co. Development Scenarios Webster Co. Development Scenarios
Source: GVA Marquette Advisors

ADDENDA

IOWA CASINO PROFILES

Casino Name: Lady Luck Casino & HotelLocation: 100 Anti-Monopoly Street
Highway 18 WestMarquette, Iowa
Year Opened: 2000p
Total Slots: 650Gaming Tables: 13Poker Tables: 2Total Gaming Positions: 759
Hotel Rooms 24
FY 2008 Net Win: $34,327,956Win Per Position/Day: $127FY 2008 Admissions: 428,745Win per Admission: $80
$34,149,876
$43,092,259
$34,327,956 $32,000,000
$20,000,000$25,000,000$30,000,000$35,000,000$40,000,000$45,000,000$50,000,000$55,000,000$60,000,000
2000 2005 2008 2009 (Proj.)
Adjusted Gross Reven
ue (N
et
Win)
Lady Luck Casino & Hotel (Marquette, IA)

Casino Name: Dubuque Greyhound Park & CasinoLocation: 1855 Greyhound Park Rd
Dubuque, IA 52001
Year Opened: 1985
Total Slots: 1,000Gaming Tables: 16Poker Tables: 4Total Gaming Positions: 1,148
Hotel Rooms 120 (Hilton Garden Inn)( )
FY 2008 Net Win: $71,620,436Win Per Position/Day: $172FY 2008 Admissions: 1,517,818Win per Admission: $47
$35,271,560$43,996,260
$71,620,436
$69,500,000
$10,000,000$20,000,000$30,000,000$40,000,000$50,000,000$60,000,000$70,000,000$80,000,000$90,000,000$100,000,000
2000 2005 2008 2009 (Proj.)
Adjusted Gross Reven
ue (N
et
Win)
Dubuque Greyhound Park & Casino
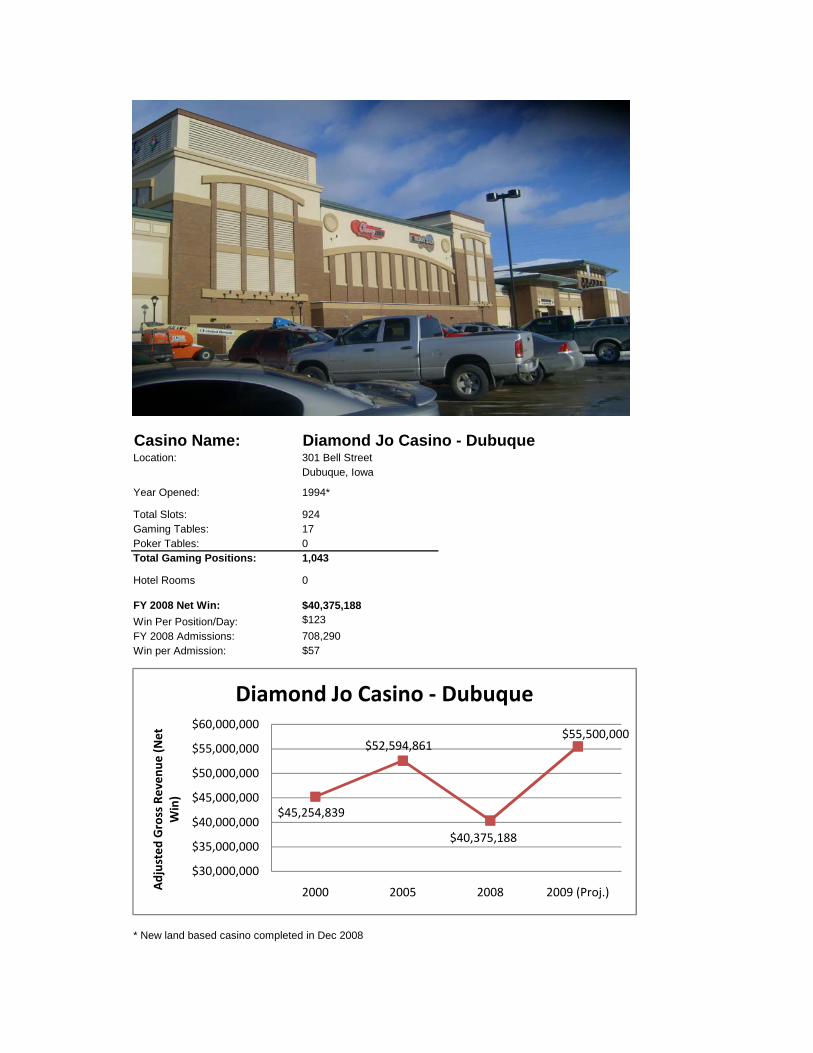
Casino Name: Diamond Jo Casino - DubuqueLocation: 301 Bell Street
Dubuque, Iowa
Year Opened: 1994*Year Opened: 1994
Total Slots: 924Gaming Tables: 17Poker Tables: 0Total Gaming Positions: 1,043
Hotel Rooms 0
FY 2008 Net Win: $40,375,188Win Per Position/Day: $123FY 2008 Admissions: 708,290Win per Admission: $57
* New land based casino completed in Dec 2008
$45,254,839
$52,594,861
$40,375,188
$55,500,000
$30,000,000
$35,000,000
$40,000,000
$45,000,000
$50,000,000
$55,000,000
$60,000,000
2000 2005 2008 2009 (Proj.)Adjusted Gross Reven
ue (N
et
Win)
Diamond Jo Casino ‐ Dubuque

Casino Name: Wild Rose Casino & ResortLocation: 777 Wild Rose Circle
Clinton, Iowa
Year Opened: 1991*
Total Slots: 600Gaming Tables: 17Poker Tables: 2Total Gaming Positions: 737g
Hotel Rooms 40
FY 2008 Net Win: $27,488,959 Win Per Position/Day: $115FY 2008 Admissions: 413,966Win per Admission: $66
* new land based casino hotel replaced Miss. Belle riverboat in July 2008
$27,488,959
$42,000,000
$0
$10,000,000
$20,000,000
$30,000,000
$40,000,000
$50,000,000
$60,000,000
2008 2009 (Proj.)Adjusted Gross Reven
ue (N
et
Win)
Wild Rose Casino & Resort

Casino Name: Isle of Capri CasinoLocation: 1777 Isle Parkway
Bettendorf, Iowa
Year Opened: 1995
Total Slots: 1,034Gaming Tables: 26Poker Tables: 8Total Gaming Positions: 1,288Hotel Rooms 504
FY 2008 Net Win: $96,563,711 Win Per Position/Day: $208FY 2008 Admissions: 1,451,452Win per Admission: $67
$89,389,210
$103,900,655
$96,563,711
$90,000,000
$80,000,000
$85,000,000
$90,000,000
$95,000,000
$100,000,000
$105,000,000
$110,000,000
2000 2005 2008 2009 (Proj.)
Adjusted Gross Reven
ue (N
et W
in)
Isle of Capri Casino ‐ Bettendorf

Casino Name: Rhythm City CasinoLocation: 101 W River Dr
Davenport, IA 52801
Year Opened: 1991
Total Slots: 975Gaming Tables: 23Poker Tables: 9Total Gaming Positions: 1,217
FY 2008 Net Win: $56,663,557Win Per Position/Day: $139FY 2008 Admissions: 947,343Win per Admission: $60
$68,474,132
$78,210,268
$56,663,557
$58,500,000
$40,000,000$45,000,000$50,000,000$55,000,000$60,000,000$65,000,000$70,000,000$75,000,000$80,000,000$85,000,000$90,000,000
2000 2005 2008 2009 (Proj.)Adjusted Gross Reven
ue (N
et
Win)
Rhythm City Casino
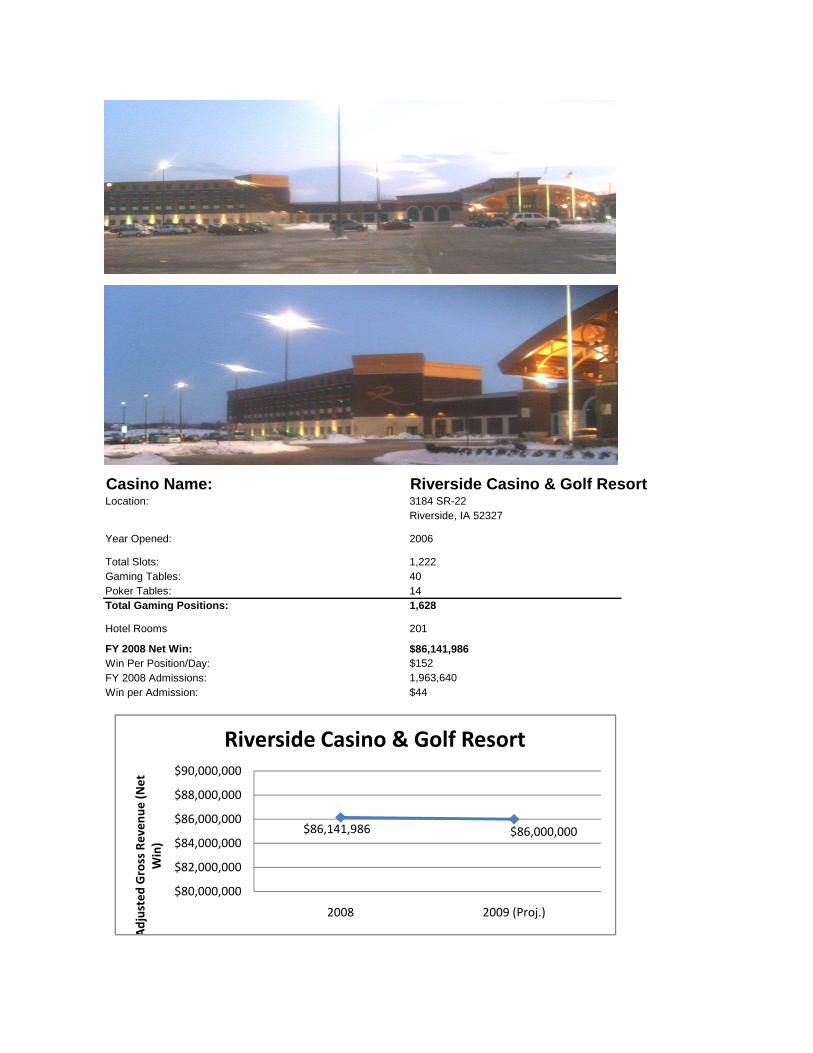
Casino Name: Riverside Casino & Golf ResortLocation: 3184 SR-22
Riverside, IA 52327
Year Opened: 2006
Total Slots: 1,222Gaming Tables: 40Poker Tables: 14Total Gaming Positions: 1,628
Hotel Rooms 201
FY 2008 Net Win: $86,141,986Win Per Position/Day: $152FY 2008 Admissions: 1,963,640Win per Admission: $44
$86,141,986 $86,000,000
$80,000,000
$82,000,000
$84,000,000
$86,000,000
$88,000,000
$90,000,000
2008 2009 (Proj.)
Adjusted Gross Reven
ue (N
et
Win)
Riverside Casino & Golf Resort
Casino Name: Catfish Bend Casino & HotelLocation: 3001 Winegard Dr
Burlington, IA 52601g
Year Opened: 1994
Total Slots: 680Gaming Tables: 18Poker Tables: 5Total Gaming Positions: 851
Hotel Rooms 180
FY 2008 Net Win: $39,290,774Win Per Position/Day: $105FY 2008 Admissions: 1,035,443Win per Admission: $38
$30,807,058 $31,299,346
$39,290,774
$39,000,000
$20,000,000
$25,000,000
$30,000,000
$35,000,000
$40,000,000
$45,000,000
2000 2005 2008 2009 (Proj.)Adjusted Gross Reven
ue (N
et
Win)
Catfish Bend Casino

Casino Name: Argosy CasinoLocation: 100 Larsen Park Rd
Sioux City, IA 51101
Year Opened: 1994p
Total Slots: 703Gaming Tables: 21Poker Tables: 4Total Gaming Positions: 886
Hotel Rooms 0
FY 2008 Net Win: $57,537,914Win Per Position/Day: $181FY 2008 Admissions: 1,123,261Win per Admission: $51
$33,488,180
$54,837,518$57,537,914 $57,000,000
$20,000,000$25,000,000$30,000,000$35,000,000$40,000,000$45,000,000$50,000,000$55,000,000$60,000,000
2000 2005 2008 2009 (Proj.)Adjusted Gross Reven
ue (N
et
Win)
Argosy Casino ‐ Sioux City
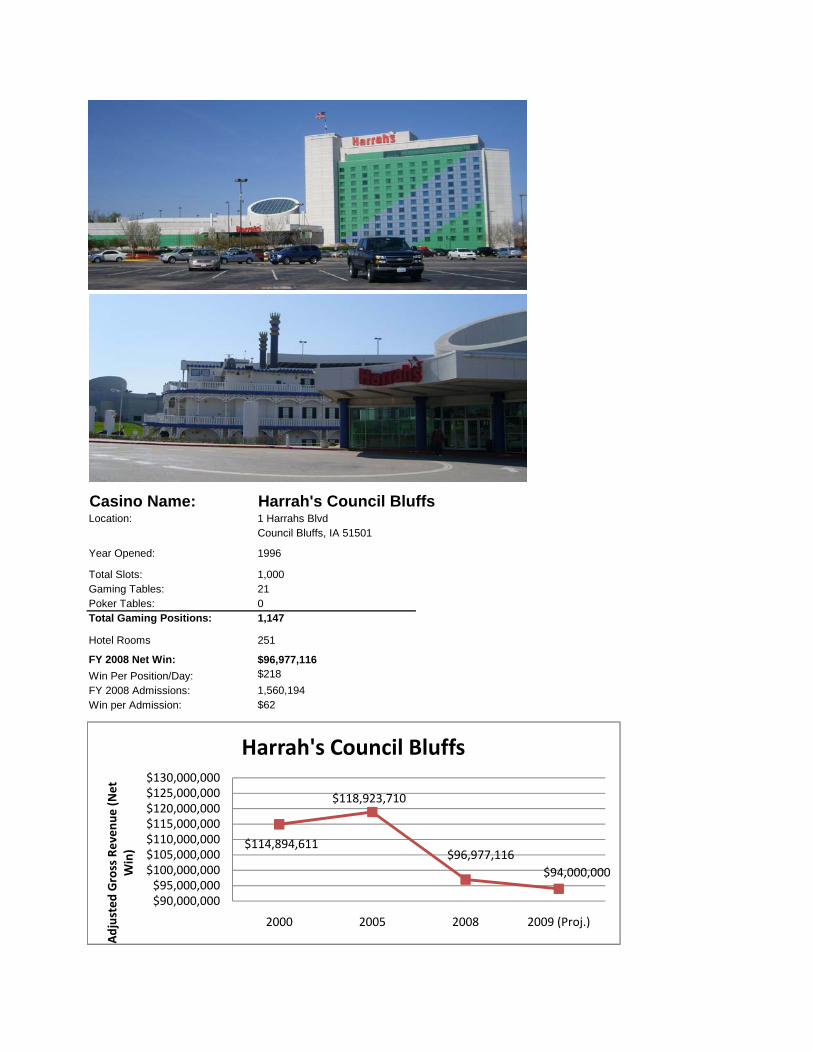
Casino Name: Harrah's Council BluffsLocation: 1 Harrahs Blvd
Council Bluffs, IA 51501
Year Opened: 1996
Total Slots: 1,000Gaming Tables: 21Poker Tables: 0Total Gaming Positions: 1,147
Hotel Rooms 251
FY 2008 Net Win: $96,977,116Win Per Position/Day: $218FY 2008 Admissions: 1,560,194Win per Admission: $62
$114,894,611
$118,923,710
$96,977,116$94,000,000
$90,000,000$95,000,000$100,000,000$105,000,000$110,000,000$115,000,000$120,000,000$125,000,000$130,000,000
2000 2005 2008 2009 (Proj.)
Adjusted Gross Reven
ue (N
et
Win)
Harrah's Council Bluffs

Casino Name: Ameristar Casino HotelLocation: 2200 River Rd
Council Bluffs, IA 51501
Year Opened: 1996
Total Slots: 1,650Gaming Tables: 39Poker Tables: 0Total Gaming Positions: 1,923
Hotel Rooms 160
FY 2008 Net Win: $178,899,018Win Per Position/Day: $266FY 2008 Admissions: 2,677,638Win per Admission: $67
$109,565,075
$180,112,287 $178,899,018
$170,000,000
$100,000,000$110,000,000$120,000,000$130,000,000$140,000,000$150,000,000$160,000,000$170,000,000$180,000,000$190,000,000$200,000,000
2000 2005 2008 2009 (Proj.)
Adjusted Gross Reven
ue (N
et W
in)
Ameristar Council Bluffs

Casino Name: Horseshoe Council BluffsLocation: 2701 23rd Ave
Council Bluffs, IA 51501
Year Opened: 1986
Total Slots: 1,900Gaming Tables: 44gPoker Tables: 18Total Gaming Positions: 2,370
Hotel Rooms 0
FY 2008 Net Win: $198,410,252Win Per Position/Day: $233FY 2008 Admissions: 2,735,731Win per Admission: $73
$118,748,736$132,085,471
$198,410,252
$193,000,000
$40,000,000$60,000,000$80,000,000$100,000,000$120,000,000$140,000,000$160,000,000$180,000,000$200,000,000$220,000,000
2000 2005 2008 2009 (Proj.)Adjusted Gross Reven
ue (N
et
Win)
Horseshoe Council Bluffs
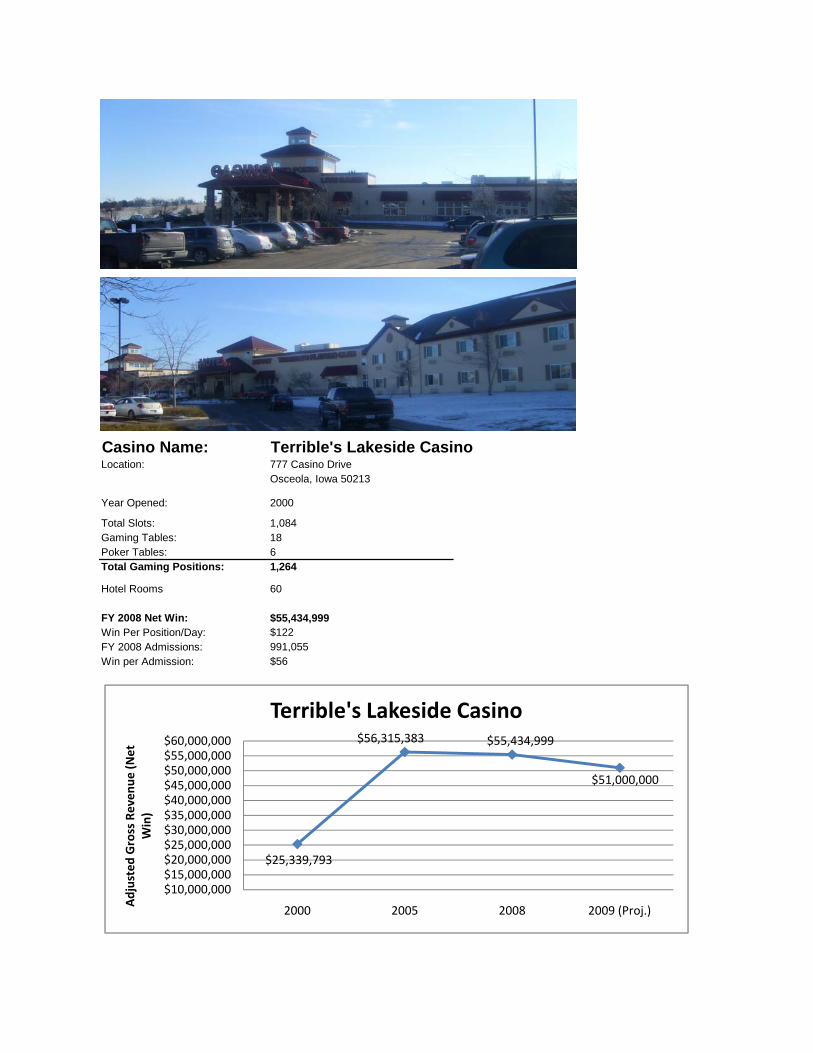
Casino Name: Terrible's Lakeside CasinoLocation: 777 Casino Drive
Osceola, Iowa 50213
Year Opened: 2000
Total Slots: 1,084Gaming Tables: 18Poker Tables: 6Total Gaming Positions: 1,264
Hotel Rooms 60
FY 2008 Net Win: $55,434,999Win Per Position/Day: $122FY 2008 Admissions: 991,055Win per Admission: $56
$25,339,793
$56,315,383 $55,434,999
$51,000,000
$10,000,000$15,000,000$20,000,000$25,000,000$30,000,000$35,000,000$40,000,000$45,000,000$50,000,000$55,000,000$60,000,000
2000 2005 2008 2009 (Proj.)
Adjusted Gross Reven
ue (N
et
Win)
Terrible's Lakeside Casino
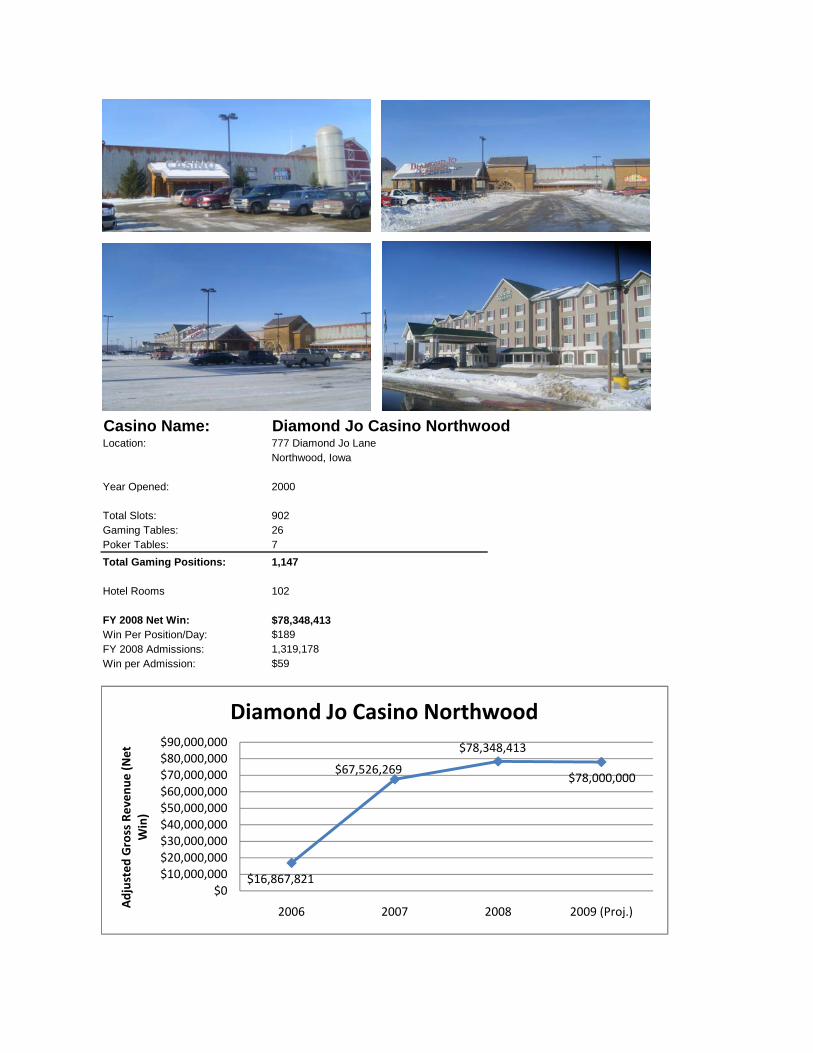
Casino Name: Diamond Jo Casino NorthwoodLocation: 777 Diamond Jo Lane
Northwood, Iowa
Year Opened: 2000p
Total Slots: 902Gaming Tables: 26Poker Tables: 7Total Gaming Positions: 1,147
Hotel Rooms 102
FY 2008 Net Win: $78,348,413Win Per Position/Day: $189FY 2008 Admissions: 1,319,178Win per Admission: $59
$16,867,821
$67,526,269
$78,348,413
$78,000,000
$0$10,000,000$20,000,000$30,000,000$40,000,000$50,000,000$60,000,000$70,000,000$80,000,000$90,000,000
2006 2007 2008 2009 (Proj.)
Adjusted Gross Reven
ue (N
et
Win)
Diamond Jo Casino Northwood
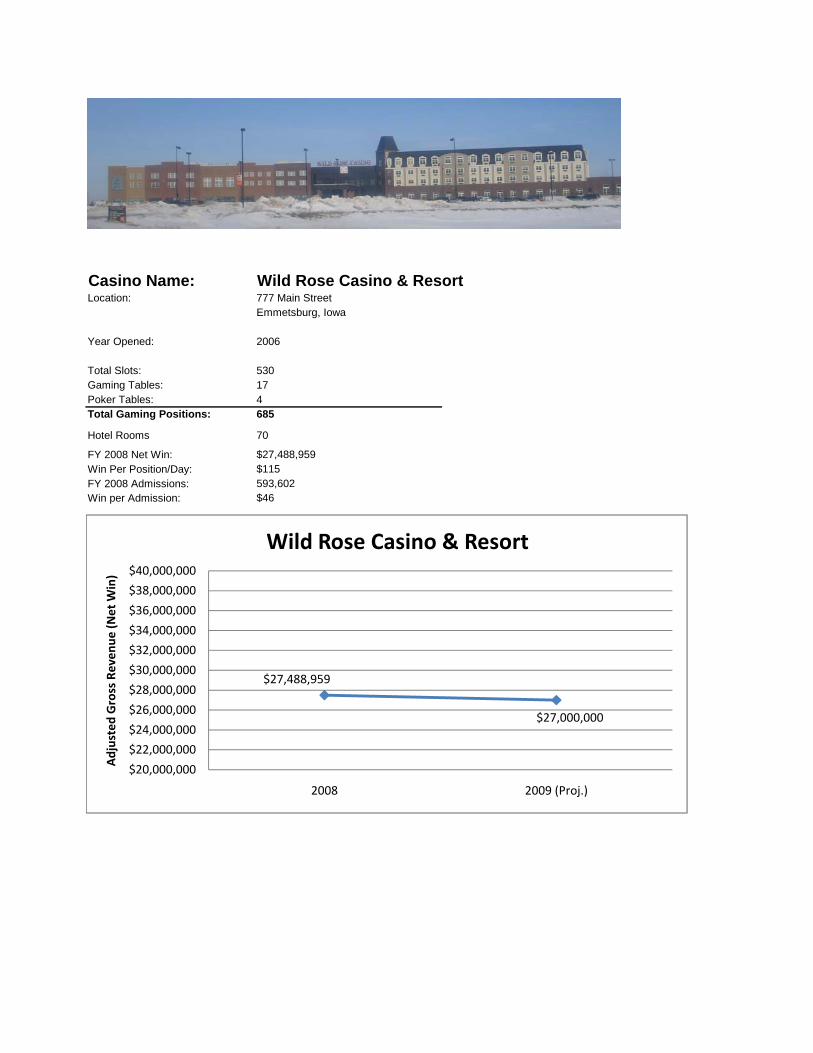
Casino Name: Wild Rose Casino & ResortLocation: 777 Main Street
Emmetsburg, Iowa
Year Opened: 2006
Total Slots: 530Gaming Tables: 17Poker Tables: 4Total Gaming Positions: 685
Hotel Rooms 70
FY 2008 Net Win: $27,488,959Win Per Position/Day: $115FY 2008 Admissions: 593,602Win per Admission: $46
$27,488,959
$27,000,000
$20,000,000
$22,000,000
$24,000,000
$26,000,000
$28,000,000
$30,000,000
$32,000,000
$34,000,000
$36,000,000
$38,000,000
$40,000,000
2008 2009 (Proj.)
Adjusted Gross Reven
ue (N
et W
in)
Wild Rose Casino & Resort

Casino Name: The Isle Casino and Hotel at WaterlooLocation: 777 Isle of Capri Boulevard
Waterloo, Iowa
Year Opened: 2007
Total Slots: 1,000Gaming Tables: 29Poker Tables: 6Total Gaming Positions: 1,257g
Hotel Rooms 195
FY 2008 Net Win: $76,577,583Win Per Position/Day: $156FY 2008 Admissions: 1,777,746Win per Admission: $43
$76,577,583
$81,000,000
$60,000,000
$65,000,000
$70,000,000
$75,000,000
$80,000,000
$85,000,000
$90,000,000
2008 2009 (Proj.)
Adjusted Gross Reven
ue (N
et
Win)
The Isle Casino & Hotel at Waterloo
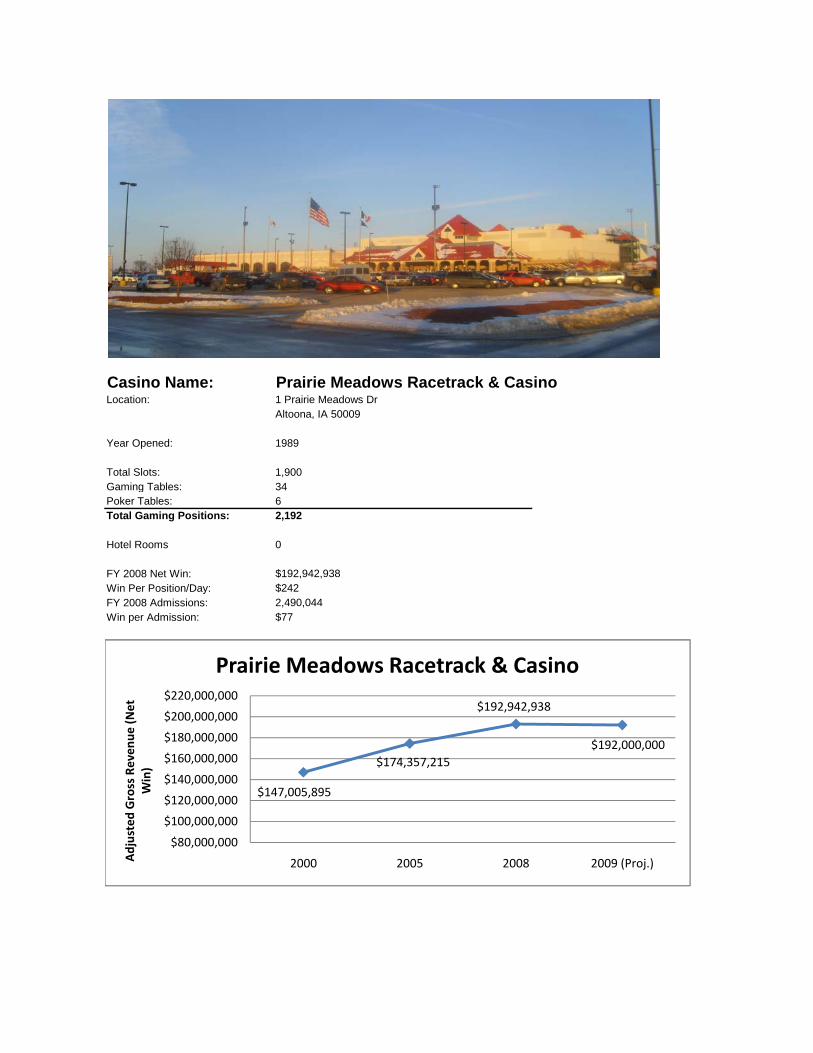
Casino Name: Prairie Meadows Racetrack & CasinoLocation: 1 Prairie Meadows Dr
Altoona, IA 50009
Year Opened: 1989
Total Slots: 1,900Gaming Tables: 34gPoker Tables: 6Total Gaming Positions: 2,192
Hotel Rooms 0
FY 2008 Net Win: $192,942,938Win Per Position/Day: $242FY 2008 Admissions: 2,490,044Win per Admission: $77
$147,005,895
$174,357,215
$192,942,938
$192,000,000
$80,000,000
$100,000,000
$120,000,000
$140,000,000
$160,000,000
$180,000,000
$200,000,000
$220,000,000
2000 2005 2008 2009 (Proj.)Adjusted Gross Reven
ue (N
et
Win)
Prairie Meadows Racetrack & Casino
International Hospitality and Gaming Consultants
International Hospitality and Gaming Consultants
THE COMPANY GVA Marquette Advisors is a full-service market study and financial counseling firm providing comprehensive consulting, valuation and advisory services to gaming and hospitality projects of all types. GVA Marquette Advisors offers highly specialized consulting services to gaming operations, resorts and hotels throughout North America. GVA has a specialty in gaming consulting and is a recognized consultant with international expertise. GVA has completed nearly 1,000 studies of varied types throughout the United States, Canada, Mexico, and Bermuda. The ability to address issues related not only to the casinos themselves, but to the supporting facilities, such as lodging, food and beverage, convention and entertainment facilities, attractions, retail and other recreational amenities such as golf courses, marinas and RV parks, is a critical component of our gaming services. EXPERIENCE The principals of GVA have more than 30 years of consulting experience and spanning several business cycles. No consultant at GVA has less than 10 years of consulting experience within the hospitality industry. This experience has provided us with a perspective that is invaluable in providing relevant advisory services in today’s increasingly competitive and complex markets. We were pioneers in Native American gaming market research with projects that began in the 1980’s. Since then, GVA has performed market studies for gaming projects located in 31 states and three Canadian provinces. Our studies were instrumental in the development of the gaming industry in Minnesota and we performed studies for several of the early casinos along the Gulf Coast and Tunica, and in southern and northern California. We continue to be actively involved in these and the other US gaming markets, working on behalf of Tribes and commercial casino operators, lenders and investment organizations, as well as state government and gaming regulatory agencies. All aspects of the hospitality industry are becoming increasingly more competitive. GVA’s consultants possess the skills and techniques necessary to perform in-depth market analysis and to interpret the findings with a deep comprehension of both demand characteristics and likely competitive supply reactions. Such insight is essential to the accurate assessment of a particular project’s potential and in the identification of its appropriate size and amenities. Many of our casino assignments involve an expansion or the addition of amenities to a previous client, so that we have the opportunity to revisit markets and study their evolution.
GVA Marquette Advisors Offices: Minneapolis Office: 333 South Seventh Street, Suite 2300, Minneapolis, MN 55402-3200
Phone: 612-335-8888; Fax: 612-334-3022 Seattle Office: 22525 SE 64th Place, Suite 180, Seattle, WA 98027
Phone: 425-392-7482; Fax: 425-392-7330 Las Vegas Office: 3960 Howard Hughes Parkway, Suite 500, Las Vegas, NV 89169
Phone: 702-990-3688; Fax: 702-990-3501
SERVICES We try to provide as much value to our clients as possible. Therefore, we communicate frequently with our clients during an assignment and often meet with members of the project team, including the architect and lender. This provides an opportunity for all involved in a project to understand and interpret our findings, conclusions and recommendations. Market Studies - Our market studies include an in-depth analysis of the business potential that exists in a market, as well as a critical evaluation of the competition. With respect to casino projects, we focus on likely market share and recommend facilities and amenities that will maximize this market share. Through our quantitative analysis, we are able to assess the business impact that will result from alternative competitive development scenarios to help our clients evaluate business risk. Financial Projections - Our financial projections are prepared by department from a detailed financial model and are based on local market conditions. The results are then compared to the actual operating results of similar projects that we have access to. We are also capable of assessing the economic feasibility of a project by comparing its projected cash flow to its development cost and its cost of capital. Economic Impact Assessment - GVA Marquette Advisors is a recognized leader in the analysis of the economic and social impact of gaming and other leisure industries and projects. Our landmark studies of the economic benefits of Indian gaming in the states of Minnesota, Oregon, and Washington have been distributed in both the United States and Canada and widely quoted in the gaming industry trade press. Impact studies and business plans for individual projects have been used for public relations and lobbying purposes and to fulfill submission requirements to the National Indian Gaming Commission. The principals of the Hospitality Group have made presentations on feasibility and impact issues at regional, national and international conferences in the United States and Canada. Other Services - Our significant gaming experience, also enable us to provide a broader range of services to assist in other development opportunities. Our service lines include:
• Business Plans • Development of gaming strategies • Valuation of gaming assets and facilities • Analysis of all ancillary facilities including hotels, retail, entertainment venues,
convention facilities, restaurants, golf • Evaluation of management and operations • Tribal project development management outsourcing
LOCATIONS OF GAMING ASSIGNMENTS
Minnesota Wisconsin Michigan Illinois Maryland Indiana Ohio Pennsylvania New York Florida Louisiana Mississippi Missouri
Texas New Mexico Arizona California Oregon Washington North Dakota Iowa Kansas Oklahoma Wyoming Nevada
Colorado New Jersey South Dakota Montana Quebec Ontario British Columbia Idaho

PROFESSIONAL QUALIFICATIONS OF LOUIS W. FRILLMAN
President
GVA MARQUETTE ADVISORS Louis W. Frillman has been engaged in the real estate business nationwide since 1975. During this time, he has completed counseling assignments dealing with significant decisions regarding real property utilized for real estate tax petitions, market feasibility and absorption analysis studies, valuations and disposition of major business properties, and investment analyses for acquisition of property by major pension accounts. In addition, he has provided counsel to real estate buyers, sellers, investors and lenders concerning virtually all types of real estate. In the hospitality and gaming areas, Mr. Frillman has conducted numerous market and feasibility studies, financial analysis and projections, going concern and real estate valuations, and has provided other counseling services to scores of hospitality and gaming projects throughout North America. Mr. Frillman is experienced at managing and overseeing large projects nationwide. Recently he completed a series of engagements relating to the recapitalization of the Mall Of America. Mr. Frillman has a Bachelor of Arts Degree in Finance from the College of St. Thomas. He has lectured and taught real estate valuation for the University of St. Thomas and has been a guest lecturer at numerous continuing education seminars for the Law Board, NAIOP, American Society of Real Estate Counselors, and NACORE. Mr. Frillman is a licensed and bonded real estate broker in the State of Minnesota and is an affiliate member of the National Association of Industrial and Office Parks (NAIOP), and served on the 1986 Legislative Committee of that association. He is a member of the American Society of Real Estate Counselors, the real estate counseling affiliate of the National Association of Realtors. He is an elected member of the Appraisal Institute and has served on the MAI Demonstration Appraisal Reports Committee nationally, and was a member of the Board of Directors for the local Institute Chapter as well as on the local admissions committee. He has also served as Chairman of the Candidate Guidance Committee. His community activities include being a full member of the Greater Minneapolis Board of Realtors, an associate member of the Urban Land Institute, a member of the National Trust for Historic Preservation, and the Riverfront Development Committee of the Downtown Council of Minneapolis. He is an invited member of Lambda Alpha, the international Land Economics Fraternity. His charitable activities include eight years as director of Catholic Charities for the Elderly; he served that board as development coordinator of Marian Center, a skilled care and assisted living care facility.

PROFESSIONAL QUALIFICATIONS OF BRENT E. WITTENBERG
Vice President GVA MARQUETTE ADVISORS
Mr. Wittenberg has 12 years of experience as a real estate consultant, with a special expertise in gaming and hospitality projects, as well as commercial, residential and mixed-use real estate ventures. His diverse background has included market analyses, feasibility studies, and economic and fiscal impact studies. Brent has worked on a wide variety of gaming and real estate consulting assignments in 22 states. He is a known expert in the field of real estate research and has evaluated numerous property types on behalf of GVA Marquette’s clients. In addition to casinos and hotels, Brent has provided feasibility studies and financial projections for numerous commercial real estate projects, multifamily housing, golf courses, marinas, RV Parks, event centers, retail and shopping center developments, gas station/c-stores and full service travel plazas, community centers and health clubs. Brent has been an invited speaker at several local and national conferences and seminars regarding both gaming and real estate market issues and trends, including multiple IMN Native American Finance Conferences. He has also been a guest lecturer at universities in the Twin Cities region. Articles by Mr. Wittenberg have been published in the Minnesota Real Estate Journal and Heartland Real Estate Business. He is widely quoted in the local, regional and national press on issues pertaining to the multifamily housing and hospitality industries. Mr. Wittenberg holds a Master of City and Regional Planning Degree (MCRP) from Clemson University, where he was recognized by the American Institute of Certified Planners (AICP) for outstanding attainment in the study of planning. He earned a Bachelor of Arts Degree in Local and Urban Affairs at St. Cloud State University.