Embed Size (px)
Citation preview
International Flavors & Fragrances Inc. - Climate Change 2020
C0. Introduction
C0.1
(C0.1) Give a general description and introduction to your organization.
International Flavors & Fragrances Inc. is a leading global creator of flavors and fragrances for consumer products.
C0.2
(C0.2) State the start and end date of the year for which you are reporting data.
Start date End date Indicate if you are providing emissions data for past reportingyears
Select the number of past reporting years you will be providing emissions datafor
Reportingyear
January 12019
December 312019
Yes 2 years
C0.3
(C0.3) Select the countries/areas for which you will be supplying data.AustraliaAustriaBelgiumBrazilCanadaChileChinaColombiaEgyptFranceGermanyGuatemalaIndiaIndonesiaIrelandIsraelItalyJapanMexicoNetherlandsNew ZealandPeruPolandRepublic of KoreaRussian FederationSingaporeSloveniaSouth AfricaSpainSwitzerlandThailandTurkeyUnited Kingdom of Great Britain and Northern IrelandUnited States of AmericaViet Nam
C0.4
(C0.4) Select the currency used for all financial information disclosed throughout your response.USD
CDP Page of 801
C0.5
(C0.5) Select the option that describes the reporting boundary for which climate-related impacts on your business are being reported. Note that this option shouldalign with your chosen approach for consolidating your GHG inventory.Operational control
C-CH0.7
(C-CH0.7) Which part of the chemicals value chain does your organization operate in?
Row 1
Bulk organic chemicalsAromatics
Bulk inorganic chemicalsPlease select
Other chemicalsSpecialty chemicalsSpecialty organic chemicals
C1. Governance
C1.1
(C1.1) Is there board-level oversight of climate-related issues within your organization?Yes
C1.1a
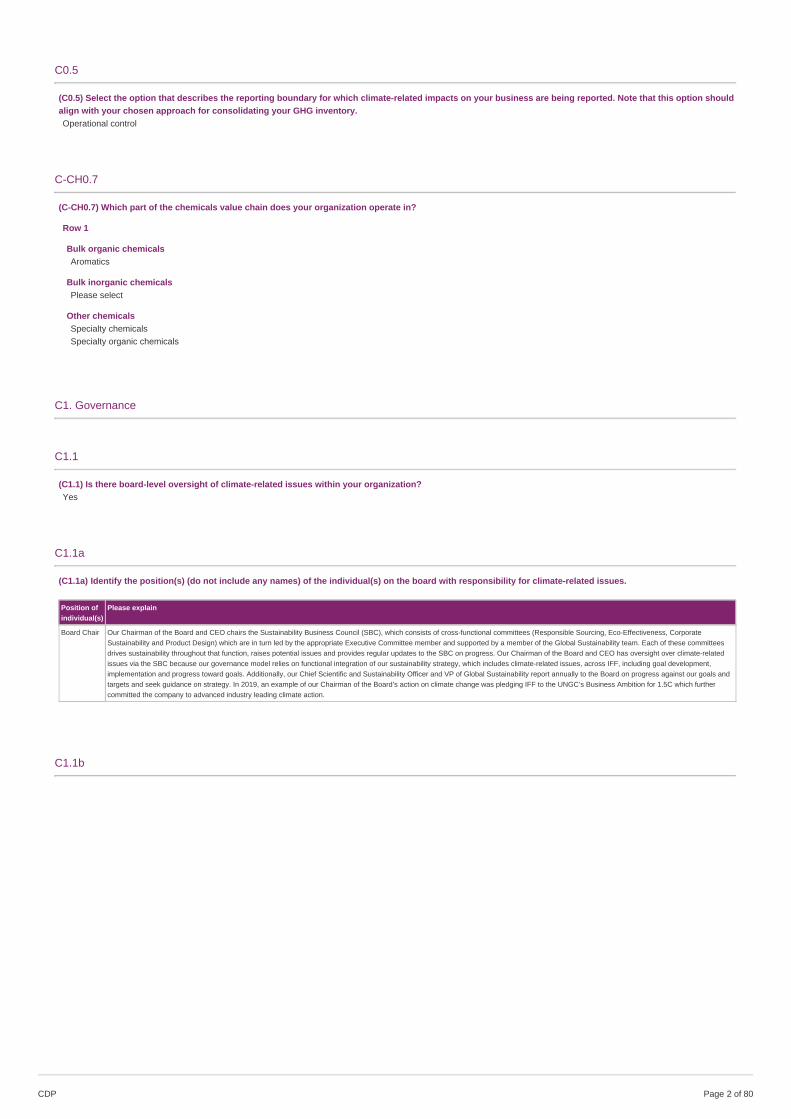
(C1.1a) Identify the position(s) (do not include any names) of the individual(s) on the board with responsibility for climate-related issues.
Position ofindividual(s)
Please explain
Board Chair Our Chairman of the Board and CEO chairs the Sustainability Business Council (SBC), which consists of cross-functional committees (Responsible Sourcing, Eco-Effectiveness, CorporateSustainability and Product Design) which are in turn led by the appropriate Executive Committee member and supported by a member of the Global Sustainability team. Each of these committeesdrives sustainability throughout that function, raises potential issues and provides regular updates to the SBC on progress. Our Chairman of the Board and CEO has oversight over climate-relatedissues via the SBC because our governance model relies on functional integration of our sustainability strategy, which includes climate-related issues, across IFF, including goal development,implementation and progress toward goals. Additionally, our Chief Scientific and Sustainability Officer and VP of Global Sustainability report annually to the Board on progress against our goals andtargets and seek guidance on strategy. In 2019, an example of our Chairman of the Board’s action on climate change was pledging IFF to the UNGC’s Business Ambition for 1.5C which furthercommitted the company to advanced industry leading climate action.
C1.1b
CDP Page of 802
(C1.1b) Provide further details on the board’s oversight of climate-related issues.
Frequencywithwhichclimate-relatedissues areascheduledagendaitem
Governancemechanismsinto whichclimate-related issuesare integrated
Scope ofboard-leveloversight
Please explain
Scheduled– somemeetings
Reviewing andguidingstrategyReviewing andguiding majorplans of actionSettingperformanceobjectivesMonitoringimplementationandperformance ofobjectivesOverseeingmajor capitalexpenditures,acquisitionsanddivestitures
<NotApplicable>
Our Chairman of the Board and CEO chairs the Sustainability Business Council (SBC), and cross-functional committees – Responsible Sourcing, Eco-Effectiveness,Corporate Sustainability and Product Design – are each led by the appropriate Executive Committee (EC) member and supported by a member of the Global Sustainabilityteam. Each of these committees drives sustainability throughout that function, raises potential issues and provides regular updates to the SBC on progress. Thisgovernance model relies on functional integration of our sustainability strategy, which includes climate-related issues, across IFF, including goal development,implementation and progress toward goals. Our Chairman of the Board and CEO’s position leading the SBC, combined with our company-wide functional integration ofsustainability strategy, allows the board to continually monitor implementation and performance of objectives, thereby contributing to the board's oversight of climate issues.Additionally, our Chief Scientific and Sustainability Officer and VP of Global Sustainability report annually to the board on progress against our climate related goals andtargets and seek guidance on strategy. In 2019, an example of our board’s action towards climate change was to catalyze progress towards our SBT by signing off on theUNGC’s Business Ambition for 1.5C further strengthening IFF’s commitment towards reducing our emissions.
C1.2
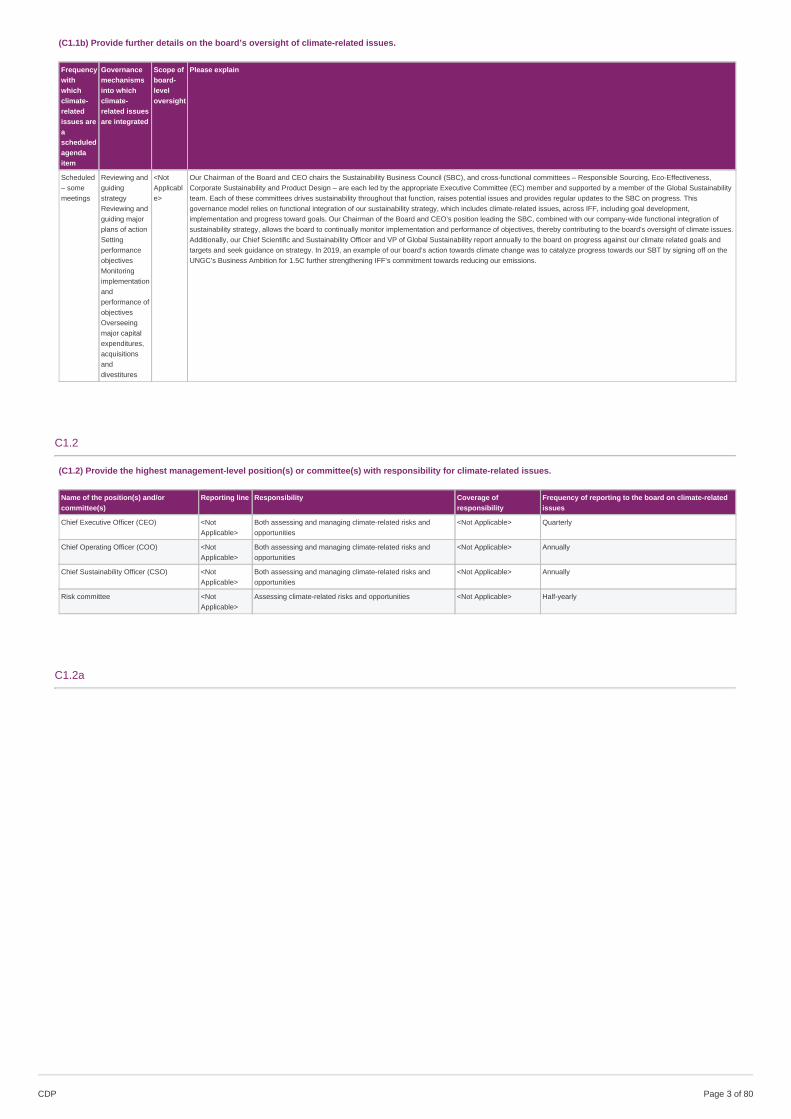
(C1.2) Provide the highest management-level position(s) or committee(s) with responsibility for climate-related issues.
Name of the position(s) and/orcommittee(s)
Reporting line Responsibility Coverage ofresponsibility
Frequency of reporting to the board on climate-relatedissues
Chief Executive Officer (CEO) <NotApplicable>
Both assessing and managing climate-related risks andopportunities
<Not Applicable> Quarterly
Chief Operating Officer (COO) <NotApplicable>
Both assessing and managing climate-related risks andopportunities
<Not Applicable> Annually
Chief Sustainability Officer (CSO) <NotApplicable>
Both assessing and managing climate-related risks andopportunities
<Not Applicable> Annually
Risk committee <NotApplicable>
Assessing climate-related risks and opportunities <Not Applicable> Half-yearly
C1.2a
CDP Page of 803
(C1.2a) Describe where in the organizational structure this/these position(s) and/or committees lie, what their associated responsibilities are, and how climate-related issues are monitored (do not include the names of individuals).
The Chief Executive Officer (CEO) is a major stakeholder in overseeing the direction of the global sustainability department and climate action at IFF. As an example of ourmanagement’s commitment to climate policy, the VP of Global Sustainability and Chief Sustainability Office report quarterly to the CEO and executive committee on progressof climate related activities for the entire company including new acquisitions. In 2019, our CEO committed IFF further to climate action through the UNGC’s BusinessAmbition for 1.5C which will require surpassing the goals of our current SBT.
The Executive Vice President (EVP) of Operations is the highest level Executive responsible for oversight of operations globally (note IFF does not have the title of COO).This role reports directly to the Chairman and CEO. This position is responsible for climate change issues, risks and opportunities in operations and at our facilities. Hemanages these issues by overseeing the Eco-Effectiveness Leadership Team. The EVP of Operations has responsibility for climate-related issues because of hismanagement of the Eco-Effective Leadership Team, which has direct oversight for the achievement of our climate-change related goals.
The Chief Sustainability Officer (CSO) is a key leader of the Sustainable Business Council (SBC), which reviews targets and metrics quarterly. The SBC consists of cross-functional committees (Responsible Sourcing, Eco-Effectiveness, Corporate Sustainability and Product Design) which are in turn led by the appropriate Executive Committee(EC) member and supported by a member of the Global Sustainability team. The CSO has responsibility for climate-related issues because each of these committees drivessustainability throughout that function, raises potential issues and provides regular updates to the SBC on progress. The CSO position is also charged with driving low-carbonand circular-economy solutions into the R&D process.
These positions and our organization more broadly monitor climate-related issues through engagement with the World Business Council for Sustainable Development(WBCSD). Our Chairman and CEO, VP of Global Sustainability, and CSO each participate in WBCSD. Our Chairman and CEO was elected to the EC. Our engagement withthe WBCSD, which holds forums and climate policy groups that provide information and trends on climate-related issues, is an opportunity to work with influential leaders tomonitor these issues and make positive, lasting changes in society. Additionally, these positions also attend other forums, such as CDP events, to stay abreast of changes onkey climate-related issues.
Our Eco-Effectiveness Leadership Team, which is composed of the VP’s of Operations Globally as well as subject matter experts and operations representatives from each ofour regions, drives climate change management in Operations and has implemented numerous projects to enable us to reach our 2019 climate change-related goals andachieve progress towards our 2020 climate-change related goals, which are (normalized per metric ton of production):
-reduce energy use by 20% by 2020 from a 2010 baseline;
-reduce carbon emissions by 25% by 2020 from a 2010 baseline.
We have also adopted an SBTi-approved Science Based Target (SBT) of reducing our absolute scope 1 and 2 GHG emissions 30% by 2025, from a 2015 base-year, and theEco-Effectiveness Leadership Team will manage operational changes that drive us to achieve this goal.
In addition, the Global Risk Committee is a management risk committee made up of key members of the Company’s management to integrate global risk activities (includingclimate-related issues) and to ensure appropriate prioritization of resources and alignment across the Company. The Global Risk Committee is co-chaired by our CFO andEVP General Counsel and Corporate Secretary. The Global Risk Committee meets approximately six times per year to discuss critical risks, critique mitigation plans andreview the gap analyses. The Global Risk Committee has responsibility over climate-related issues because ESG risks are also included in this program based on input fromour Global Sustainability Team. The team evaluates for "Failure of climate change mitigation or adoption" and "Facility loss due to extreme weather event".
C1.3
(C1.3) Do you provide incentives for the management of climate-related issues, including the attainment of targets?
Provide incentives for the management of climate-related issues Comment
Row 1 Yes
C1.3a
CDP Page of 804
(C1.3a) Provide further details on the incentives provided for the management of climate-related issues (do not include the names of individuals).
Entitled to incentive Type ofincentive
Activityinventivized
Comment
Chief Operating Officer(COO)
Monetaryreward
Emissionsreductiontarget
The Executive Vice President (EVP) of Operations is the highest level Executive responsible for oversight of operations globally (note IFF does not have the titleof COO). This role reports directly to the Chairman and CEO. The EVP of Operations, who is ultimately responsible for our eco efficiency initiatives, hasperformance based objectives that are aligned with organizational energy and GHG emissions reduction goals of 20% and 25% per metric ton of production,respectively, by 2020.
Facilities manager Monetaryreward
Emissionsreductionproject
Facility managers have performance based objectives that are aligned with our organizational energy and GHG emissions reduction goals of respective 20%and 25% per metric ton of production by 2020. Performance on these goals is assessed annually during performance reviews and salary determination.
Environment/Sustainabilitymanager
Monetaryreward
Emissionsreductionproject
Environment/Sustainability managers have performance based objectives that are aligned with our organizational energy and GHG emissions reduction goalsof respective 20% and 25% per metric ton of production by 2020. Performance on these goals is assessed annually during performance reviews and salarydetermination.
All employees Non-monetaryreward
Emissionsreductionproject
Employees are internally recognized locally and corporately for achieving results from energy and carbon reducing projects on the company intranet's TopStory, which recognizes employees for exemplary performance. Employees are internally recognized locally and corporately for achieving results from energyand carbon reducing projects on the company intranet's Top Story, which recognizes employees for exemplary performance. In 2015, we launched an eco-efficiency awards program to formally recognize facilities that have been the most effective at implementing a culture of sustainability and improvingperformance related to sustainability standards.
C2. Risks and opportunities
C2.1
(C2.1) Does your organization have a process for identifying, assessing, and responding to climate-related risks and opportunities?Yes
C2.1a
(C2.1a) How does your organization define short-, medium- and long-term time horizons?
From (years) To (years) Comment
Short-term 1 3
Medium-term 3 6
Long-term 6 10
C2.1b
(C2.1b) How does your organization define substantive financial or strategic impact on your business?
We define 'substantive financial impact' when identifying or assessing climate-related risks in both our direct operations and supply chain as any change that wouldsignificantly affect our business, operations, revenue or expenditure.
In order to come to this definition of substantive risk, we have a multidisciplinary company-wide enterprise risk management program that annually assesses risks, includingsustainability issues and climate change, on our business and the business of our customers. We annually prepare and review a risk dashboard with senior management andthe Board of Directors. When prioritizing risks and opportunities, our strategic pillars are the starting point. However, we also identify natural disasters and other climate-related exposures as part of our process. As it relates to prioritization, consideration is also given to the following items: impact; both internal and external influences; ourcurrent capability and prior experience in mitigating such risks; and our expectations of the future outlook for the identified risk. ERM Risk Assessments are conducted whenchanging conditions warrant new analysis. Through this expansive program we were able to define substantive risk at the corporate level.
We further manage risk at the asset level, where we have global and regional crisis-management plans and procedures, and we conduct training for members of our cross-functional global and regional crisis teams. Additionally, each IFF facility assesses local risks and has a crisis management plan. Our regional and site level Eco-efficiencychampions convey risks detected on the ground up through to corporate executives, who review risks annually.
In addition, we conducted a structured materiality analysis to identify the issues of most importance to our company and our stakeholders. The materiality analysis identifiedclimate change—along with water efficiency, renewable raw materials and energy efficiency—as most material to IFF’s stakeholders. We first assessed the materiality ofconventional and emerging sustainability and carbon management issues in 2010. We evaluated these issues for their importance to our stakeholders, their potential impacton our business, and the degree of influence that we had on each issue In 2014, we formally updated our materiality work by soliciting feedback from IFF employees,including our Sustainability Steering Team, key customers, academics, and NGOs. This input helped us further transform and adapt our sustainability strategy in order toproperly manage climate change and related environmental issues. At IFF, we know that our approach to sustainability, climate change and carbon management mustcontinually evolve, and we will continue to engage with stakeholders through dialogue on sustainability and materiality. As part of the Frutarom acquisition, in 2019 IFFrefreshed our materiality assessment. The results of the refresh were consistent with the results with the prior material assessment and identified new emerging and evolvingclimate change risk and opportunities topics to consider in the future. All of the above methodologies have helped to further define substantive risk.
CDP Page of 805
C2.2
(C2.2) Describe your process(es) for identifying, assessing and responding to climate-related risks and opportunities.
Value chain stage(s) coveredDirect operations
Risk management processIntegrated into multi-disciplinary company-wide risk management process
Frequency of assessmentMore than once a year
Time horizon(s) coveredShort-termMedium-termLong-term
Description of processAt the corporate level, IFF’s general approach for identifying and managing significant risks and opportunities relies on our management’s evaluation of current events andits expectations regarding future developments. Climate risks and opportunities are assessed based on the magnitude and likelihood of impact, potential financial impact,return on investment, scale of capital costs or operational expenditures, and potential for disruption or delays in production. We have a multidisciplinary company-wideenterprise risk management program that continually assesses risks more than once a year, including sustainability issues and climate change, on our business and thebusiness of our customers. This enterprise risk management program considers risks for short-, medium-, and long-term time horizons within our direct operations. Byassessing these time horizons in tandem with the procedures above, this enterprise risk management program determines which risks could a have a substantive financialor strategic impact. Our CEO and other senior management oversee the day-to-day execution of the risk management process, including decisions to mitigate, transfer,accept or control climate-related risks. The Board receives regular reports on IFF’s ERM process and oversees and reviews with management the company’s enterprise-wide risks and the policies and practices established to manage such risks. Management maintains the ERM program, which is designed to identify and assess our globalrisks and to develop steps to mitigate and manage risks. The Global Risk Committee, composed of key members of management, meets approximately six times per yearto discuss critical risks, critique mitigation plans and review the gap analyses. The Global Risk Committee reviews and evaluates each risk for impact and vulnerability. Eachrisk is identified as Low, Moderate, High or Critical based on its impact and vulnerability. We semi-annually prepare and review a risk dashboard with senior managementand the Board of Directors. When prioritizing risks and opportunities, our strategic pillars are the starting point. However, we also identify natural disasters and other climaterelated exposures as part of our process. As it relates to prioritization, consideration is also given to the following items: impact; both internal and external influences; ourcurrent capability and prior experience in mitigating such risks; and our expectations of the future outlook for the identified risk or opportunity. Risks beyond 6 years areconsidered. At the asset level, we have global and regional crisis-management plans and procedures, and we conduct training for members of our cross-functional globaland regional crisis teams. In addition, each IFF facility assesses local risks and has a crisis management plan. Our regional and site level Eco-efficiency champions alsoplay the role of conveying risks detected on the ground up through to corporate executives, who review risks annually. We also conducted a formalized materiality analysisto identify the issues of most importance to our company and our stakeholders. At the corporate level, day-to-day management of sustainability and climate-relatedopportunities is under the purview of the Sustainability Business Council (SBC), chaired by our Chairman of the Board and CEO. The SBC consists of cross-functionalcommittees (Responsible Sourcing, Eco-Effectiveness, Corporate Sustainability and Product Design) which are in turn led by the appropriate EC member and supported bya member of the Global Sustainability team. Each of these committees drives sustainability throughout that function, raises potential issues and provides regular updates tothe SBC on progress. As relevant opportunities are identified, they are also reviewed with our R&D and Commercial teams. At the asset level, opportunities we pursue areimplemented by our Eco-Effectiveness Leadership Team. These processes can determine which risks have a substantive financial or strategic impact on the organization.One example of a climate-related physical risk that was managed through this process is facility loss due to an extreme weather event. Specifically, our Union Beachfacility incurred damage during Superstorm Sandy. Following the storm, we undertook mitigation processes and renovated these facilities to withstand flood events. Duringour ERM process, the likelihood of occurrence for climate related extreme weather events at key facilities was deemed low. The result of the risk evaluation process wasthat it was determined not a substantive risk for the business. One example of a climate-related transitional risk that was managed through this process is reputationalimpacts tied to the fact that our customers are increasingly demanding transparency regarding our climate change policies. For instance, during 2019 thirteen of our majorcustomers, representing approximately 21% of our Legacy IFF business, requested we respond to the CDP supply chain questionnaire. Some customers specifically useCDP as a grade for an annual supplier performance evaluation and use this information to help generate their core lists, where not being included can significantly reducethe number of future projects and sales. The result of the risk evaluation process was that it was determined not a critical risk for the business. In addition to our formal riskmanagement process, we conducted a structured materiality analysis to identify the issues of most importance to our company and our stakeholders, including size, scopeand significance of identified risks. The materiality analysis identified several issues that are relevant to IFF, have global impact and influence product and facility energyand carbon management. We first assessed the materiality of conventional and emerging sustainability and carbon management issues in 2010. We evaluated theseissues for their importance to our stakeholders, their potential impact on our business and the degree of influence that we had on each issue. We continue to engage withstakeholders, solicit feedback and refine our focus and approach. In 2014, we formally updated our materiality work by soliciting feedback from IFF employees, includingour Sustainability Steering Team, key customers, academics and NGOs. This input helped us further refine IFF’s sustainability strategy and reporting. At IFF, we know thatour approach to sustainability, climate change and carbon management must continually evolve, and we will continue to engage with stakeholders through dialogue onsustainability and materiality. As part of the Frutarom acquisition, in 2019 IFF refreshed our materiality assessment. The results of the refresh were consistent with theresults with the prior material assessment and identified new emerging and evolving climate change risk and opportunities topics to consider in the future.
Value chain stage(s) coveredDownstream
Risk management processIntegrated into multi-disciplinary company-wide risk management process
Frequency of assessmentMore than once a year
Time horizon(s) coveredShort-termMedium-termLong-term
Description of processThere is a global trend towards an increasing demand for sustainable, climate-friendly products and technologies. IFF sells its products primarily to consumer facingcompanies and our customers. Customers are limiting the number of their suppliers in order to increase their margins and profitability. These customers are creating “corelists” of suppliers and giving these “core lists” suppliers priority for new or modified products. These and other profitability initiatives being pursued by our customers reducethe market opportunity for which we compete and subject the volume and pricing of the remaining suppliers to downward pressure. To be successful in this competitiveenvironment, we must continue to anticipate customers’ needs, deliver products that contribute to our customers’ profitability, provide effective customer service and offercompetitive cost-in- use solutions to secure and maintain inclusion on certain “core lists” and our share of our customers’ purchases. If we are unable to do so, it could
CDP Page of 806
adversely impact our future results of operations. As a result, downstream risks are always included in our climate-related risk assessments. To enhance our riskmanagement practices, we recently established a Global Risk Committee made up of key members of management to integrate global risk activities. The Global RiskCommittee meets approximately six times per year to discuss critical risks, including downstream risks, critique mitigation plans and review the gap analyses. ESG risks arealso included in this program based on input from our Global Sustainability Team. This process, which covers short-, medium- and long-term time horizons, is used todetermine which downstream risks and/or opportunities could have a substantive financial or strategic impact on our business. For example, a considered potential climate-related downstream transition risk specific to IFF is that our customers are increasingly demanding transparency regarding our climate change policies. For instance,during 2019, thirteen of our major customers requested we respond to the CDP supply chain questionnaire. Some customers specifically use CDP as a grade to helpgenerate their core lists, where not being included can significantly reduce the number of future projects and sales. Additionally, in response to growing concerns from ourcustomers of climate related upstream physical risks we have begun procuring electricity from green energy sources to mitigate our output of greenhouse gases. This riskwas identified and evaluated via the ERM process. The result of this process was that the climate-related risk was determined to not be a substantive risk for the business.
Value chain stage(s) coveredUpstream
Risk management processIntegrated into multi-disciplinary company-wide risk management process
Frequency of assessmentMore than once a year
Time horizon(s) coveredShort-termMedium-termLong-term
Description of processOur purchases of raw materials are subject to fluctuations in market price and availability caused by weather, growing and harvesting conditions, market conditions,governmental actions and other factors beyond our control. In addition, our ingredient suppliers, similar to us, are subject to the risks inherent in manufacturing anddistribution on a global scale over which they have no control. These suppliers also could become insolvent or experience other financial distress. We purchaseapproximately 11,000 different raw materials from about 3,000 domestic and international suppliers and distributors. Approximately half of the materials we purchase arenaturals or crop-related items and the other half are synthetics and chemicals. As a result, upstream risks are always included in our climate-related risk assessments. Toenhance our risk management practices, we recently established a Global Risk Committee made up of key members of management to integrate global risk activities(including cybersecurity, compliance, business and crisis management) and to ensure appropriate prioritization of resources and alignment across IFF. The Global RiskCommittee meets approximately six times per year to discuss critical risks, including upstream risks, critique mitigation plans and review the gap analyses. ESG risks arealso included in this program based on input from our Global Sustainability Team. This process, which covers short-, medium- and long-term time horizons, is used todetermine which upstream risks and/or opportunities could have a substantive financial or strategic impact on our business. One example of a potential physical upstreamclimate-related risk evaluated in 2019 is the risk of reduced raw material availability caused by precipitation extremes and droughts that are exacerbated by the effects ofclimate change. Over the past several years, changes in precipitation extremes and droughts in Brazil, Madagascar, and Florida, USA, have affected the availability andcost of our key natural ingredients, such as orange oil and vanilla. This risk could impact the availability and pricing of these natural products. If we are unable to increasethe prices to our customers of our products to offset raw material and other input cost increases, or if we are unable to achieve cost savings to offset such cost increases,we could fail to meet our cost expectations and our profits and operating results could be adversely affected. Increases in prices of our products to customers may lead todeclines in sales volumes, and we may not be able to accurately predict the volume impact of price increases, which could adversely affect our financial condition andresults of operations. This risk was identified and evaluated via the ERM process. The result of this process was that the risk was determined to not be a substantive risk forthe business. However, other disruptions in our supply chain could adversely affect our business and financial results. For additional information, please see our 2019Annual Report.
C2.2a
(C2.2a) Which risk types are considered in your organization's climate-related risk assessments?
Relevance&inclusion
Please explain
Currentregulation
Relevant,alwaysincluded
We operate on a global basis, with manufacturing and sales facilities in the United States, Europe, Africa, the Middle East, Latin America and Greater Asia. Any regulation that increasesthe cost of raw materials or commodities, particularly energy used to operate our facilities, has the potential to impact our profit margins and operations. In particular, various currentregulatory efforts in environmental (including climate change), health and safety regulations and similar regulations could impact costs for our operations or supply chain. As a result,current regulations are always included in our climate-related risk assessments. To enhance our risk management practices, we established a Global Risk Committee made up of keymembers of management to integrate global risk activities (including cybersecurity, compliance, business and crisis management) and to ensure appropriate prioritization of resources andalignment across IFF. The Global Risk Committee meets approximately six times per year to discuss critical risks, including current regulation, and then critique mitigation plans and reviewthe gap analyses. ESG risks are also included in this program based on input from our Global Sustainability Team. One example of a considered potential risk from current regulationspecific to IFF is compliance with environmental regulations for our Tilburg facility in the Netherlands, which requires annual reporting of energy and carbon emissions. To address this, wedeveloped a plan for reducing energy and low carbon energy procurement at this facility. The result of this risk assessment process was that the risk was determined to not be asubstantive risk for the business. However, new or changes to other environmental regulations could have a material impact on our business. For additional information, please see our2019 Annual Report.
Emergingregulation
Relevant,alwaysincluded
We operate on a global basis, with manufacturing and sales facilities in the United States, Europe, Africa, the Middle East, Latin America and Greater Asia. Any regulation that increasesthe cost of raw materials or commodities, particularly energy used to operate our facilities, has the potential to impact our profit margins and operations. In particular, various emergingregulatory efforts in environmental (including climate change), health and safety regulations and similar regulations could impact costs for our operations or supply chain. As a result,emerging regulations are always included in our climate-related risk assessments. To enhance our risk management practices, we established a Global Risk Committee made up of keymembers of management to integrate global risk activities (including cybersecurity, compliance, business and crisis management) and to ensure appropriate prioritization of resources andalignment across IFF. The Global Risk Committee meets approximately six times per year to discuss critical risks, including emerging regulation, and then critique mitigation plans andreview the gap analyses. ESG risks are also included in this program based on input from our Global Sustainability Team. One example of a considered potential risk from emergingregulation specific to IFF identified and evaluated by the Global Risk Committee in 2019 is the failure of climate change mitigation or adoption caused by increasing carbon taxes in regionsin which we operate. This risk of this type of emerging regulation could cause higher operating costs including a fluctuation in energy prices that could adversely affect our profit margins.The result of this process was that the climate-related risk was determined to not be a substantive risk for the business. However, new or changes to other environmental regulations couldhave a material impact on our business. For additional information, please see our 2019 Annual Report.
Technology Relevant,alwaysincluded
To enhance our risk management practices, we recently established a Global Risk Committee made up of key members of management to integrate global risk activities (includingcybersecurity, compliance, business and crisis management) and to ensure appropriate prioritization of resources and alignment across IFF. The Global Risk Committee meetsapproximately six times per year to discuss critical risks, including technology risks, critique mitigation plans and review the gap analyses. ESG risks are also included in this programbased on input from our Global Sustainability Team. One example of a potential risk from technology specific to IFF considered in 2019 was the risk of security breaches, higher costs andgreater energy consumption and resulting energy costs from our on-site IT servers. In evaluating these risks, IFF made the decision to move our IT servers onto the cloud to save energyand increase technological security, although the move to the cloud carried its own risks, which were also considered. While the decision to move to the cloud was made, the risk of notsaving this energy as a climate related risk was determined to not be a substantive risk for the business.
CDP Page of 807
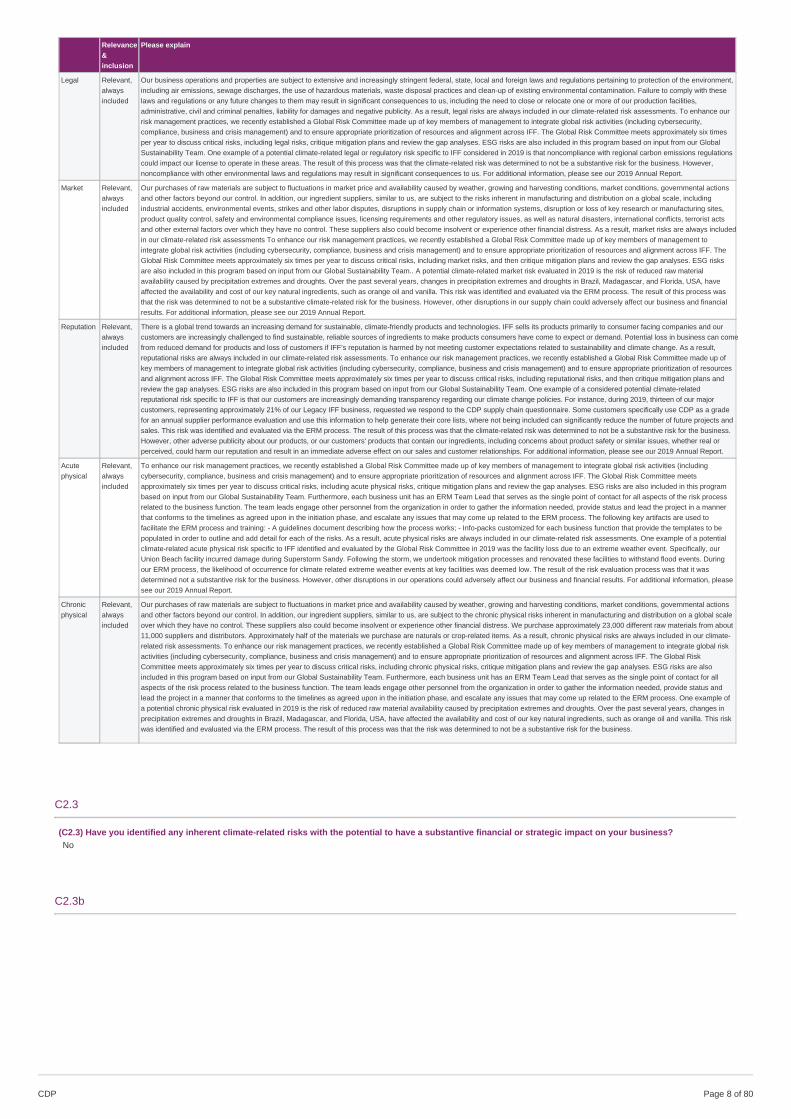
Legal Relevant,alwaysincluded
Our business operations and properties are subject to extensive and increasingly stringent federal, state, local and foreign laws and regulations pertaining to protection of the environment,including air emissions, sewage discharges, the use of hazardous materials, waste disposal practices and clean-up of existing environmental contamination. Failure to comply with theselaws and regulations or any future changes to them may result in significant consequences to us, including the need to close or relocate one or more of our production facilities,administrative, civil and criminal penalties, liability for damages and negative publicity. As a result, legal risks are always included in our climate-related risk assessments. To enhance ourrisk management practices, we recently established a Global Risk Committee made up of key members of management to integrate global risk activities (including cybersecurity,compliance, business and crisis management) and to ensure appropriate prioritization of resources and alignment across IFF. The Global Risk Committee meets approximately six timesper year to discuss critical risks, including legal risks, critique mitigation plans and review the gap analyses. ESG risks are also included in this program based on input from our GlobalSustainability Team. One example of a potential climate-related legal or regulatory risk specific to IFF considered in 2019 is that noncompliance with regional carbon emissions regulationscould impact our license to operate in these areas. The result of this process was that the climate-related risk was determined to not be a substantive risk for the business. However,noncompliance with other environmental laws and regulations may result in significant consequences to us. For additional information, please see our 2019 Annual Report.
Market Relevant,alwaysincluded
Our purchases of raw materials are subject to fluctuations in market price and availability caused by weather, growing and harvesting conditions, market conditions, governmental actionsand other factors beyond our control. In addition, our ingredient suppliers, similar to us, are subject to the risks inherent in manufacturing and distribution on a global scale, includingindustrial accidents, environmental events, strikes and other labor disputes, disruptions in supply chain or information systems, disruption or loss of key research or manufacturing sites,product quality control, safety and environmental compliance issues, licensing requirements and other regulatory issues, as well as natural disasters, international conflicts, terrorist actsand other external factors over which they have no control. These suppliers also could become insolvent or experience other financial distress. As a result, market risks are always includedin our climate-related risk assessments To enhance our risk management practices, we recently established a Global Risk Committee made up of key members of management tointegrate global risk activities (including cybersecurity, compliance, business and crisis management) and to ensure appropriate prioritization of resources and alignment across IFF. TheGlobal Risk Committee meets approximately six times per year to discuss critical risks, including market risks, and then critique mitigation plans and review the gap analyses. ESG risksare also included in this program based on input from our Global Sustainability Team.. A potential climate-related market risk evaluated in 2019 is the risk of reduced raw materialavailability caused by precipitation extremes and droughts. Over the past several years, changes in precipitation extremes and droughts in Brazil, Madagascar, and Florida, USA, haveaffected the availability and cost of our key natural ingredients, such as orange oil and vanilla. This risk was identified and evaluated via the ERM process. The result of this process wasthat the risk was determined to not be a substantive climate-related risk for the business. However, other disruptions in our supply chain could adversely affect our business and financialresults. For additional information, please see our 2019 Annual Report.
Reputation Relevant,alwaysincluded
There is a global trend towards an increasing demand for sustainable, climate-friendly products and technologies. IFF sells its products primarily to consumer facing companies and ourcustomers are increasingly challenged to find sustainable, reliable sources of ingredients to make products consumers have come to expect or demand. Potential loss in business can comefrom reduced demand for products and loss of customers if IFF’s reputation is harmed by not meeting customer expectations related to sustainability and climate change. As a result,reputational risks are always included in our climate-related risk assessments. To enhance our risk management practices, we recently established a Global Risk Committee made up ofkey members of management to integrate global risk activities (including cybersecurity, compliance, business and crisis management) and to ensure appropriate prioritization of resourcesand alignment across IFF. The Global Risk Committee meets approximately six times per year to discuss critical risks, including reputational risks, and then critique mitigation plans andreview the gap analyses. ESG risks are also included in this program based on input from our Global Sustainability Team. One example of a considered potential climate-relatedreputational risk specific to IFF is that our customers are increasingly demanding transparency regarding our climate change policies. For instance, during 2019, thirteen of our majorcustomers, representing approximately 21% of our Legacy IFF business, requested we respond to the CDP supply chain questionnaire. Some customers specifically use CDP as a gradefor an annual supplier performance evaluation and use this information to help generate their core lists, where not being included can significantly reduce the number of future projects andsales. This risk was identified and evaluated via the ERM process. The result of this process was that the climate-related risk was determined to not be a substantive risk for the business.However, other adverse publicity about our products, or our customers' products that contain our ingredients, including concerns about product safety or similar issues, whether real orperceived, could harm our reputation and result in an immediate adverse effect on our sales and customer relationships. For additional information, please see our 2019 Annual Report.
Acutephysical
Relevant,alwaysincluded
To enhance our risk management practices, we recently established a Global Risk Committee made up of key members of management to integrate global risk activities (includingcybersecurity, compliance, business and crisis management) and to ensure appropriate prioritization of resources and alignment across IFF. The Global Risk Committee meetsapproximately six times per year to discuss critical risks, including acute physical risks, critique mitigation plans and review the gap analyses. ESG risks are also included in this programbased on input from our Global Sustainability Team. Furthermore, each business unit has an ERM Team Lead that serves as the single point of contact for all aspects of the risk processrelated to the business function. The team leads engage other personnel from the organization in order to gather the information needed, provide status and lead the project in a mannerthat conforms to the timelines as agreed upon in the initiation phase, and escalate any issues that may come up related to the ERM process. The following key artifacts are used tofacilitate the ERM process and training: - A guidelines document describing how the process works; - Info-packs customized for each business function that provide the templates to bepopulated in order to outline and add detail for each of the risks. As a result, acute physical risks are always included in our climate-related risk assessments. One example of a potentialclimate-related acute physical risk specific to IFF identified and evaluated by the Global Risk Committee in 2019 was the facility loss due to an extreme weather event. Specifically, ourUnion Beach facility incurred damage during Superstorm Sandy. Following the storm, we undertook mitigation processes and renovated these facilities to withstand flood events. Duringour ERM process, the likelihood of occurrence for climate related extreme weather events at key facilities was deemed low. The result of the risk evaluation process was that it wasdetermined not a substantive risk for the business. However, other disruptions in our operations could adversely affect our business and financial results. For additional information, pleasesee our 2019 Annual Report.
Chronicphysical
Relevant,alwaysincluded
Our purchases of raw materials are subject to fluctuations in market price and availability caused by weather, growing and harvesting conditions, market conditions, governmental actionsand other factors beyond our control. In addition, our ingredient suppliers, similar to us, are subject to the chronic physical risks inherent in manufacturing and distribution on a global scaleover which they have no control. These suppliers also could become insolvent or experience other financial distress. We purchase approximately 23,000 different raw materials from about11,000 suppliers and distributors. Approximately half of the materials we purchase are naturals or crop-related items. As a result, chronic physical risks are always included in our climate-related risk assessments. To enhance our risk management practices, we recently established a Global Risk Committee made up of key members of management to integrate global riskactivities (including cybersecurity, compliance, business and crisis management) and to ensure appropriate prioritization of resources and alignment across IFF. The Global RiskCommittee meets approximately six times per year to discuss critical risks, including chronic physical risks, critique mitigation plans and review the gap analyses. ESG risks are alsoincluded in this program based on input from our Global Sustainability Team. Furthermore, each business unit has an ERM Team Lead that serves as the single point of contact for allaspects of the risk process related to the business function. The team leads engage other personnel from the organization in order to gather the information needed, provide status andlead the project in a manner that conforms to the timelines as agreed upon in the initiation phase, and escalate any issues that may come up related to the ERM process. One example ofa potential chronic physical risk evaluated in 2019 is the risk of reduced raw material availability caused by precipitation extremes and droughts. Over the past several years, changes inprecipitation extremes and droughts in Brazil, Madagascar, and Florida, USA, have affected the availability and cost of our key natural ingredients, such as orange oil and vanilla. This riskwas identified and evaluated via the ERM process. The result of this process was that the risk was determined to not be a substantive risk for the business.
Relevance&inclusion
Please explain
C2.3
(C2.3) Have you identified any inherent climate-related risks with the potential to have a substantive financial or strategic impact on your business?No
C2.3b
CDP Page of 808
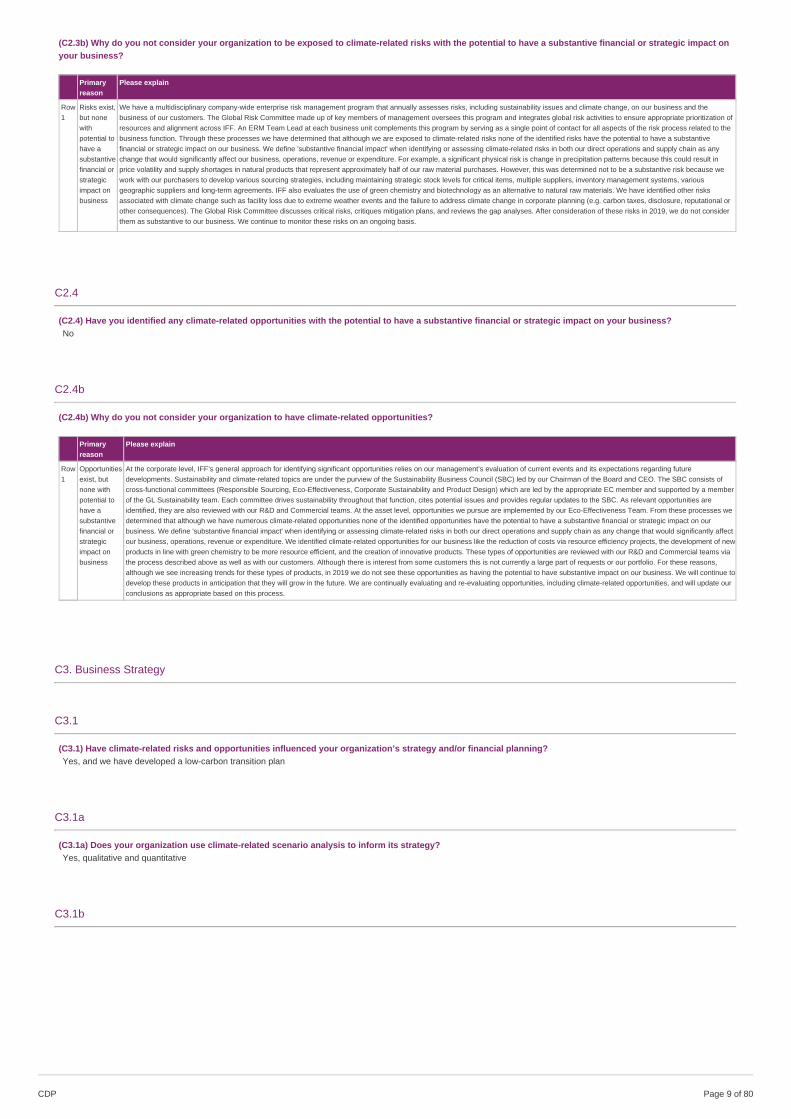
(C2.3b) Why do you not consider your organization to be exposed to climate-related risks with the potential to have a substantive financial or strategic impact onyour business?
Primaryreason
Please explain
Row1
Risks exist,but nonewithpotential tohave asubstantivefinancial orstrategicimpact onbusiness
We have a multidisciplinary company-wide enterprise risk management program that annually assesses risks, including sustainability issues and climate change, on our business and thebusiness of our customers. The Global Risk Committee made up of key members of management oversees this program and integrates global risk activities to ensure appropriate prioritization ofresources and alignment across IFF. An ERM Team Lead at each business unit complements this program by serving as a single point of contact for all aspects of the risk process related to thebusiness function. Through these processes we have determined that although we are exposed to climate-related risks none of the identified risks have the potential to have a substantivefinancial or strategic impact on our business. We define 'substantive financial impact' when identifying or assessing climate-related risks in both our direct operations and supply chain as anychange that would significantly affect our business, operations, revenue or expenditure. For example, a significant physical risk is change in precipitation patterns because this could result inprice volatility and supply shortages in natural products that represent approximately half of our raw material purchases. However, this was determined not to be a substantive risk because wework with our purchasers to develop various sourcing strategies, including maintaining strategic stock levels for critical items, multiple suppliers, inventory management systems, variousgeographic suppliers and long-term agreements. IFF also evaluates the use of green chemistry and biotechnology as an alternative to natural raw materials. We have identified other risksassociated with climate change such as facility loss due to extreme weather events and the failure to address climate change in corporate planning (e.g. carbon taxes, disclosure, reputational orother consequences). The Global Risk Committee discusses critical risks, critiques mitigation plans, and reviews the gap analyses. After consideration of these risks in 2019, we do not considerthem as substantive to our business. We continue to monitor these risks on an ongoing basis.
C2.4
(C2.4) Have you identified any climate-related opportunities with the potential to have a substantive financial or strategic impact on your business?No
C2.4b
(C2.4b) Why do you not consider your organization to have climate-related opportunities?
Primaryreason
Please explain
Row1
Opportunitiesexist, butnone withpotential tohave asubstantivefinancial orstrategicimpact onbusiness
At the corporate level, IFF’s general approach for identifying significant opportunities relies on our management’s evaluation of current events and its expectations regarding futuredevelopments. Sustainability and climate-related topics are under the purview of the Sustainability Business Council (SBC) led by our Chairman of the Board and CEO. The SBC consists ofcross-functional committees (Responsible Sourcing, Eco-Effectiveness, Corporate Sustainability and Product Design) which are led by the appropriate EC member and supported by a memberof the GL Sustainability team. Each committee drives sustainability throughout that function, cites potential issues and provides regular updates to the SBC. As relevant opportunities areidentified, they are also reviewed with our R&D and Commercial teams. At the asset level, opportunities we pursue are implemented by our Eco-Effectiveness Team. From these processes wedetermined that although we have numerous climate-related opportunities none of the identified opportunities have the potential to have a substantive financial or strategic impact on ourbusiness. We define 'substantive financial impact' when identifying or assessing climate-related risks in both our direct operations and supply chain as any change that would significantly affectour business, operations, revenue or expenditure. We identified climate-related opportunities for our business like the reduction of costs via resource efficiency projects, the development of newproducts in line with green chemistry to be more resource efficient, and the creation of innovative products. These types of opportunities are reviewed with our R&D and Commercial teams viathe process described above as well as with our customers. Although there is interest from some customers this is not currently a large part of requests or our portfolio. For these reasons,although we see increasing trends for these types of products, in 2019 we do not see these opportunities as having the potential to have substantive impact on our business. We will continue todevelop these products in anticipation that they will grow in the future. We are continually evaluating and re-evaluating opportunities, including climate-related opportunities, and will update ourconclusions as appropriate based on this process.
C3. Business Strategy
C3.1
(C3.1) Have climate-related risks and opportunities influenced your organization’s strategy and/or financial planning?Yes, and we have developed a low-carbon transition plan
C3.1a
(C3.1a) Does your organization use climate-related scenario analysis to inform its strategy?Yes, qualitative and quantitative
C3.1b
CDP Page of 809
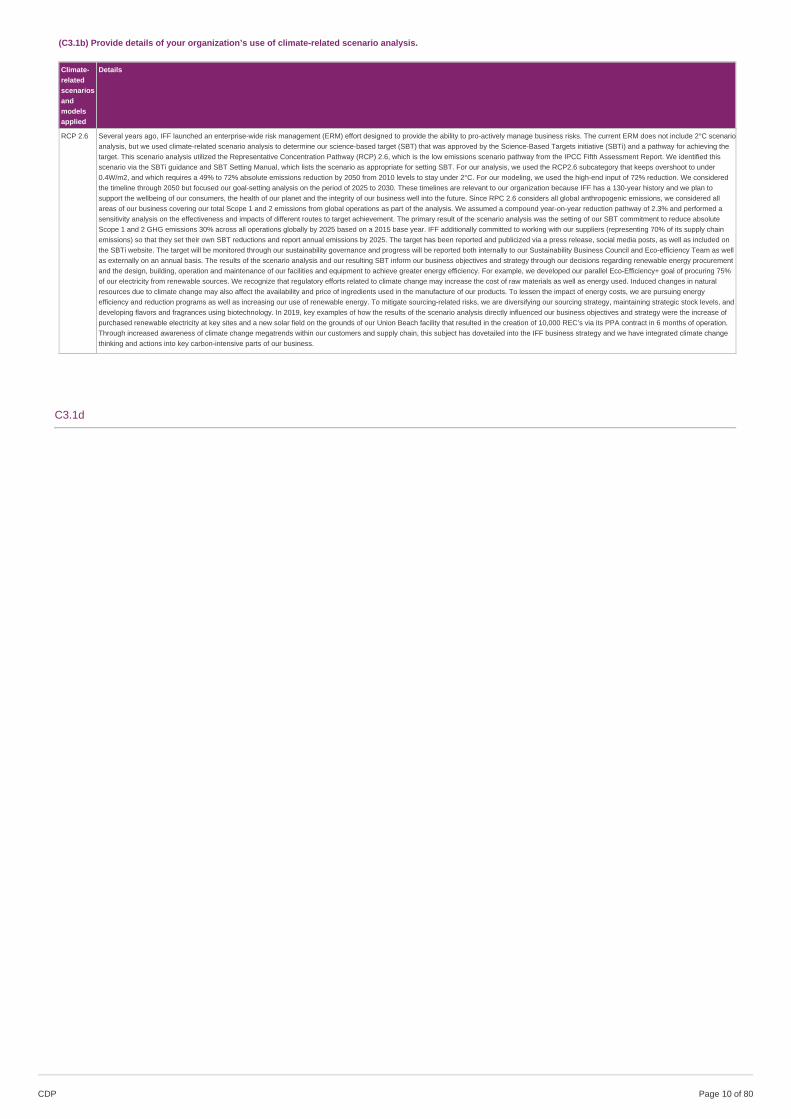
(C3.1b) Provide details of your organization’s use of climate-related scenario analysis.
Climate-relatedscenariosandmodelsapplied
Details
RCP 2.6 Several years ago, IFF launched an enterprise-wide risk management (ERM) effort designed to provide the ability to pro-actively manage business risks. The current ERM does not include 2°C scenarioanalysis, but we used climate-related scenario analysis to determine our science-based target (SBT) that was approved by the Science-Based Targets initiative (SBTi) and a pathway for achieving thetarget. This scenario analysis utilized the Representative Concentration Pathway (RCP) 2.6, which is the low emissions scenario pathway from the IPCC Fifth Assessment Report. We identified thisscenario via the SBTi guidance and SBT Setting Manual, which lists the scenario as appropriate for setting SBT. For our analysis, we used the RCP2.6 subcategory that keeps overshoot to under0.4W/m2, and which requires a 49% to 72% absolute emissions reduction by 2050 from 2010 levels to stay under 2°C. For our modeling, we used the high-end input of 72% reduction. We consideredthe timeline through 2050 but focused our goal-setting analysis on the period of 2025 to 2030. These timelines are relevant to our organization because IFF has a 130-year history and we plan tosupport the wellbeing of our consumers, the health of our planet and the integrity of our business well into the future. Since RPC 2.6 considers all global anthropogenic emissions, we considered allareas of our business covering our total Scope 1 and 2 emissions from global operations as part of the analysis. We assumed a compound year-on-year reduction pathway of 2.3% and performed asensitivity analysis on the effectiveness and impacts of different routes to target achievement. The primary result of the scenario analysis was the setting of our SBT commitment to reduce absoluteScope 1 and 2 GHG emissions 30% across all operations globally by 2025 based on a 2015 base year. IFF additionally committed to working with our suppliers (representing 70% of its supply chainemissions) so that they set their own SBT reductions and report annual emissions by 2025. The target has been reported and publicized via a press release, social media posts, as well as included onthe SBTi website. The target will be monitored through our sustainability governance and progress will be reported both internally to our Sustainability Business Council and Eco-efficiency Team as wellas externally on an annual basis. The results of the scenario analysis and our resulting SBT inform our business objectives and strategy through our decisions regarding renewable energy procurementand the design, building, operation and maintenance of our facilities and equipment to achieve greater energy efficiency. For example, we developed our parallel Eco-Efficiency+ goal of procuring 75%of our electricity from renewable sources. We recognize that regulatory efforts related to climate change may increase the cost of raw materials as well as energy used. Induced changes in naturalresources due to climate change may also affect the availability and price of ingredients used in the manufacture of our products. To lessen the impact of energy costs, we are pursuing energyefficiency and reduction programs as well as increasing our use of renewable energy. To mitigate sourcing-related risks, we are diversifying our sourcing strategy, maintaining strategic stock levels, anddeveloping flavors and fragrances using biotechnology. In 2019, key examples of how the results of the scenario analysis directly influenced our business objectives and strategy were the increase ofpurchased renewable electricity at key sites and a new solar field on the grounds of our Union Beach facility that resulted in the creation of 10,000 REC’s via its PPA contract in 6 months of operation.Through increased awareness of climate change megatrends within our customers and supply chain, this subject has dovetailed into the IFF business strategy and we have integrated climate changethinking and actions into key carbon-intensive parts of our business.
C3.1d
CDP Page of 8010
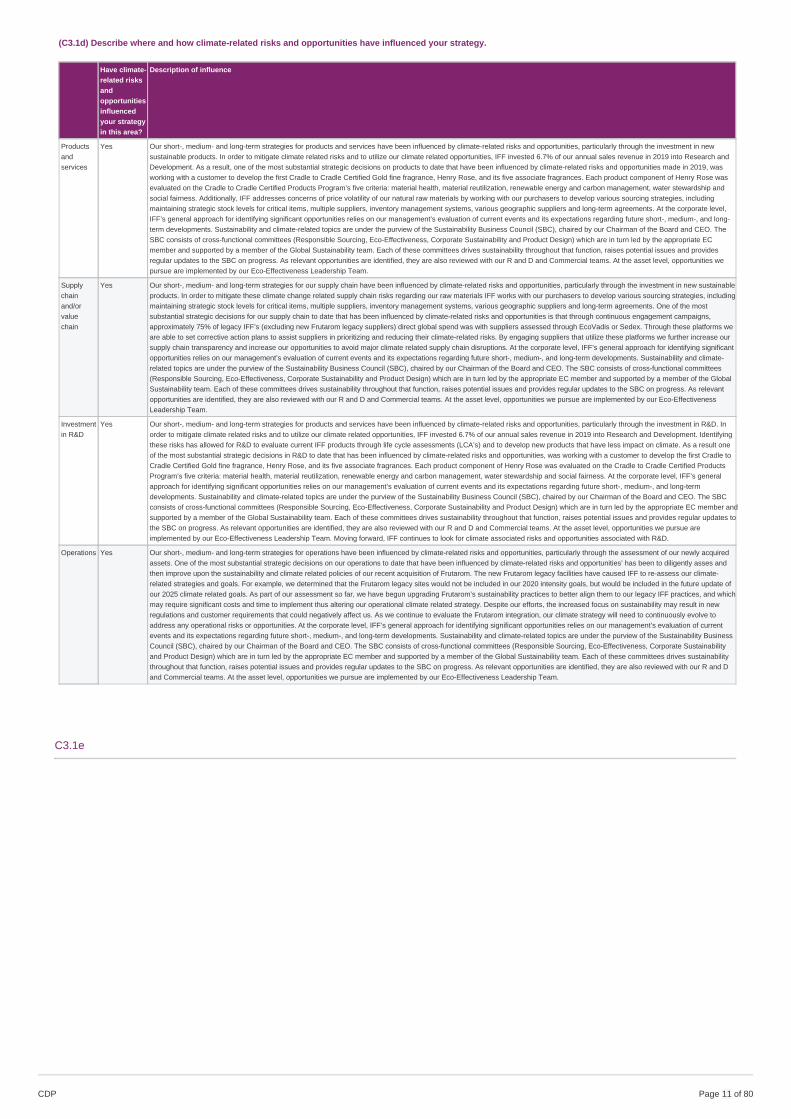
(C3.1d) Describe where and how climate-related risks and opportunities have influenced your strategy.
Have climate-related risksandopportunitiesinfluencedyour strategyin this area?
Description of influence
Productsandservices
Yes Our short-, medium- and long-term strategies for products and services have been influenced by climate-related risks and opportunities, particularly through the investment in newsustainable products. In order to mitigate climate related risks and to utilize our climate related opportunities, IFF invested 6.7% of our annual sales revenue in 2019 into Research andDevelopment. As a result, one of the most substantial strategic decisions on products to date that have been influenced by climate-related risks and opportunities made in 2019, wasworking with a customer to develop the first Cradle to Cradle Certified Gold fine fragrance, Henry Rose, and its five associate fragrances. Each product component of Henry Rose wasevaluated on the Cradle to Cradle Certified Products Program’s five criteria: material health, material reutilization, renewable energy and carbon management, water stewardship andsocial fairness. Additionally, IFF addresses concerns of price volatility of our natural raw materials by working with our purchasers to develop various sourcing strategies, includingmaintaining strategic stock levels for critical items, multiple suppliers, inventory management systems, various geographic suppliers and long-term agreements. At the corporate level,IFF’s general approach for identifying significant opportunities relies on our management’s evaluation of current events and its expectations regarding future short-, medium-, and long-term developments. Sustainability and climate-related topics are under the purview of the Sustainability Business Council (SBC), chaired by our Chairman of the Board and CEO. TheSBC consists of cross-functional committees (Responsible Sourcing, Eco-Effectiveness, Corporate Sustainability and Product Design) which are in turn led by the appropriate ECmember and supported by a member of the Global Sustainability team. Each of these committees drives sustainability throughout that function, raises potential issues and providesregular updates to the SBC on progress. As relevant opportunities are identified, they are also reviewed with our R and D and Commercial teams. At the asset level, opportunities wepursue are implemented by our Eco-Effectiveness Leadership Team.
Supplychainand/orvaluechain
Yes Our short-, medium- and long-term strategies for our supply chain have been influenced by climate-related risks and opportunities, particularly through the investment in new sustainableproducts. In order to mitigate these climate change related supply chain risks regarding our raw materials IFF works with our purchasers to develop various sourcing strategies, includingmaintaining strategic stock levels for critical items, multiple suppliers, inventory management systems, various geographic suppliers and long-term agreements. One of the mostsubstantial strategic decisions for our supply chain to date that has been influenced by climate-related risks and opportunities is that through continuous engagement campaigns,approximately 75% of legacy IFF’s (excluding new Frutarom legacy suppliers) direct global spend was with suppliers assessed through EcoVadis or Sedex. Through these platforms weare able to set corrective action plans to assist suppliers in prioritizing and reducing their climate-related risks. By engaging suppliers that utilize these platforms we further increase oursupply chain transparency and increase our opportunities to avoid major climate related supply chain disruptions. At the corporate level, IFF’s general approach for identifying significantopportunities relies on our management’s evaluation of current events and its expectations regarding future short-, medium-, and long-term developments. Sustainability and climate-related topics are under the purview of the Sustainability Business Council (SBC), chaired by our Chairman of the Board and CEO. The SBC consists of cross-functional committees(Responsible Sourcing, Eco-Effectiveness, Corporate Sustainability and Product Design) which are in turn led by the appropriate EC member and supported by a member of the GlobalSustainability team. Each of these committees drives sustainability throughout that function, raises potential issues and provides regular updates to the SBC on progress. As relevantopportunities are identified, they are also reviewed with our R and D and Commercial teams. At the asset level, opportunities we pursue are implemented by our Eco-EffectivenessLeadership Team.
Investmentin R&D
Yes Our short-, medium- and long-term strategies for products and services have been influenced by climate-related risks and opportunities, particularly through the investment in R&D. Inorder to mitigate climate related risks and to utilize our climate related opportunities, IFF invested 6.7% of our annual sales revenue in 2019 into Research and Development. Identifyingthese risks has allowed for R&D to evaluate current IFF products through life cycle assessments (LCA’s) and to develop new products that have less impact on climate. As a result oneof the most substantial strategic decisions in R&D to date that has been influenced by climate-related risks and opportunities, was working with a customer to develop the first Cradle toCradle Certified Gold fine fragrance, Henry Rose, and its five associate fragrances. Each product component of Henry Rose was evaluated on the Cradle to Cradle Certified ProductsProgram’s five criteria: material health, material reutilization, renewable energy and carbon management, water stewardship and social fairness. At the corporate level, IFF’s generalapproach for identifying significant opportunities relies on our management’s evaluation of current events and its expectations regarding future short-, medium-, and long-termdevelopments. Sustainability and climate-related topics are under the purview of the Sustainability Business Council (SBC), chaired by our Chairman of the Board and CEO. The SBCconsists of cross-functional committees (Responsible Sourcing, Eco-Effectiveness, Corporate Sustainability and Product Design) which are in turn led by the appropriate EC member andsupported by a member of the Global Sustainability team. Each of these committees drives sustainability throughout that function, raises potential issues and provides regular updates tothe SBC on progress. As relevant opportunities are identified, they are also reviewed with our R and D and Commercial teams. At the asset level, opportunities we pursue areimplemented by our Eco-Effectiveness Leadership Team. Moving forward, IFF continues to look for climate associated risks and opportunities associated with R&D.
Operations Yes Our short-, medium- and long-term strategies for operations have been influenced by climate-related risks and opportunities, particularly through the assessment of our newly acquiredassets. One of the most substantial strategic decisions on our operations to date that have been influenced by climate-related risks and opportunities’ has been to diligently asses andthen improve upon the sustainability and climate related policies of our recent acquisition of Frutarom. The new Frutarom legacy facilities have caused IFF to re-assess our climate-related strategies and goals. For example, we determined that the Frutarom legacy sites would not be included in our 2020 intensity goals, but would be included in the future update ofour 2025 climate related goals. As part of our assessment so far, we have begun upgrading Frutarom’s sustainability practices to better align them to our legacy IFF practices, and whichmay require significant costs and time to implement thus altering our operational climate related strategy. Despite our efforts, the increased focus on sustainability may result in newregulations and customer requirements that could negatively affect us. As we continue to evaluate the Frutarom integration, our climate strategy will need to continuously evolve toaddress any operational risks or opportunities. At the corporate level, IFF’s general approach for identifying significant opportunities relies on our management’s evaluation of currentevents and its expectations regarding future short-, medium-, and long-term developments. Sustainability and climate-related topics are under the purview of the Sustainability BusinessCouncil (SBC), chaired by our Chairman of the Board and CEO. The SBC consists of cross-functional committees (Responsible Sourcing, Eco-Effectiveness, Corporate Sustainabilityand Product Design) which are in turn led by the appropriate EC member and supported by a member of the Global Sustainability team. Each of these committees drives sustainabilitythroughout that function, raises potential issues and provides regular updates to the SBC on progress. As relevant opportunities are identified, they are also reviewed with our R and Dand Commercial teams. At the asset level, opportunities we pursue are implemented by our Eco-Effectiveness Leadership Team.
C3.1e
CDP Page of 8011
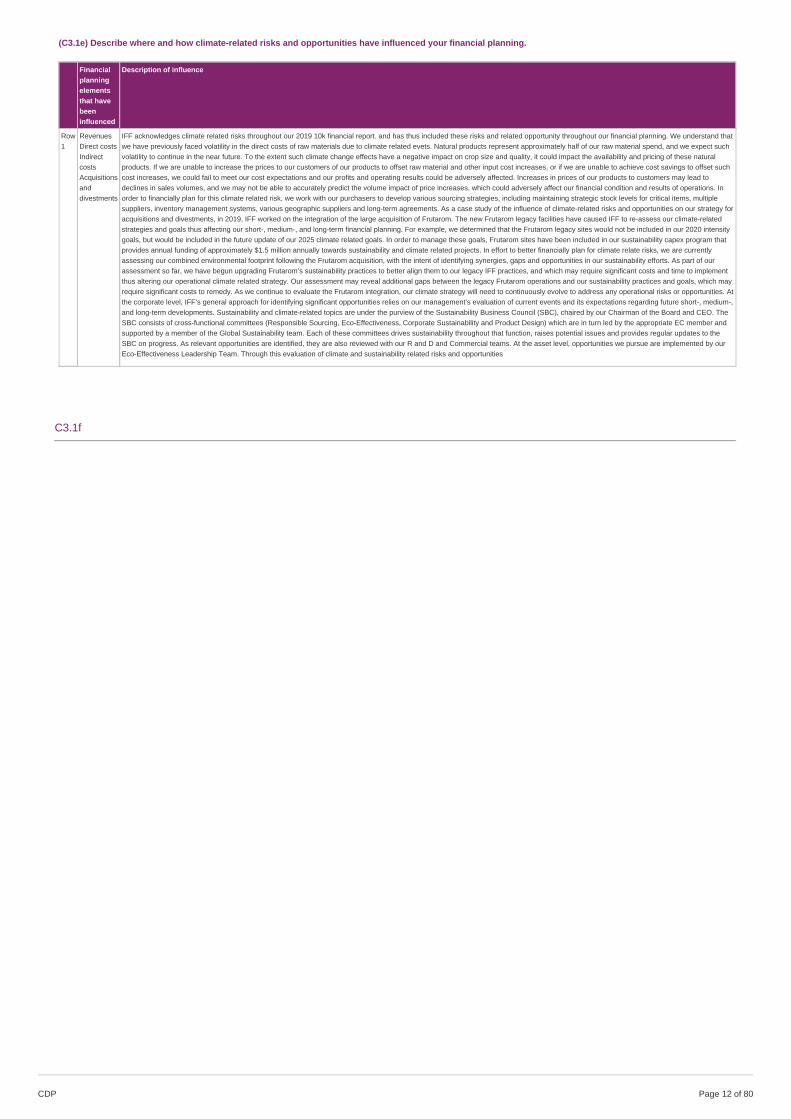
(C3.1e) Describe where and how climate-related risks and opportunities have influenced your financial planning.
Financialplanningelementsthat havebeeninfluenced
Description of influence
Row1
RevenuesDirect costsIndirectcostsAcquisitionsanddivestments
IFF acknowledges climate related risks throughout our 2019 10k financial report. and has thus included these risks and related opportunity throughout our financial planning. We understand thatwe have previously faced volatility in the direct costs of raw materials due to climate related evets. Natural products represent approximately half of our raw material spend, and we expect suchvolatility to continue in the near future. To the extent such climate change effects have a negative impact on crop size and quality, it could impact the availability and pricing of these naturalproducts. If we are unable to increase the prices to our customers of our products to offset raw material and other input cost increases, or if we are unable to achieve cost savings to offset suchcost increases, we could fail to meet our cost expectations and our profits and operating results could be adversely affected. Increases in prices of our products to customers may lead todeclines in sales volumes, and we may not be able to accurately predict the volume impact of price increases, which could adversely affect our financial condition and results of operations. Inorder to financially plan for this climate related risk, we work with our purchasers to develop various sourcing strategies, including maintaining strategic stock levels for critical items, multiplesuppliers, inventory management systems, various geographic suppliers and long-term agreements. As a case study of the influence of climate-related risks and opportunities on our strategy foracquisitions and divestments, in 2019, IFF worked on the integration of the large acquisition of Frutarom. The new Frutarom legacy facilities have caused IFF to re-assess our climate-relatedstrategies and goals thus affecting our short-, medium-, and long-term financial planning. For example, we determined that the Frutarom legacy sites would not be included in our 2020 intensitygoals, but would be included in the future update of our 2025 climate related goals. In order to manage these goals, Frutarom sites have been included in our sustainability capex program thatprovides annual funding of approximately $1.5 million annually towards sustainability and climate related projects. In effort to better financially plan for climate relate risks, we are currentlyassessing our combined environmental footprint following the Frutarom acquisition, with the intent of identifying synergies, gaps and opportunities in our sustainability efforts. As part of ourassessment so far, we have begun upgrading Frutarom’s sustainability practices to better align them to our legacy IFF practices, and which may require significant costs and time to implementthus altering our operational climate related strategy. Our assessment may reveal additional gaps between the legacy Frutarom operations and our sustainability practices and goals, which mayrequire significant costs to remedy. As we continue to evaluate the Frutarom integration, our climate strategy will need to continuously evolve to address any operational risks or opportunities. Atthe corporate level, IFF’s general approach for identifying significant opportunities relies on our management’s evaluation of current events and its expectations regarding future short-, medium-,and long-term developments. Sustainability and climate-related topics are under the purview of the Sustainability Business Council (SBC), chaired by our Chairman of the Board and CEO. TheSBC consists of cross-functional committees (Responsible Sourcing, Eco-Effectiveness, Corporate Sustainability and Product Design) which are in turn led by the appropriate EC member andsupported by a member of the Global Sustainability team. Each of these committees drives sustainability throughout that function, raises potential issues and provides regular updates to theSBC on progress. As relevant opportunities are identified, they are also reviewed with our R and D and Commercial teams. At the asset level, opportunities we pursue are implemented by ourEco-Effectiveness Leadership Team. Through this evaluation of climate and sustainability related risks and opportunities
C3.1f
CDP Page of 8012
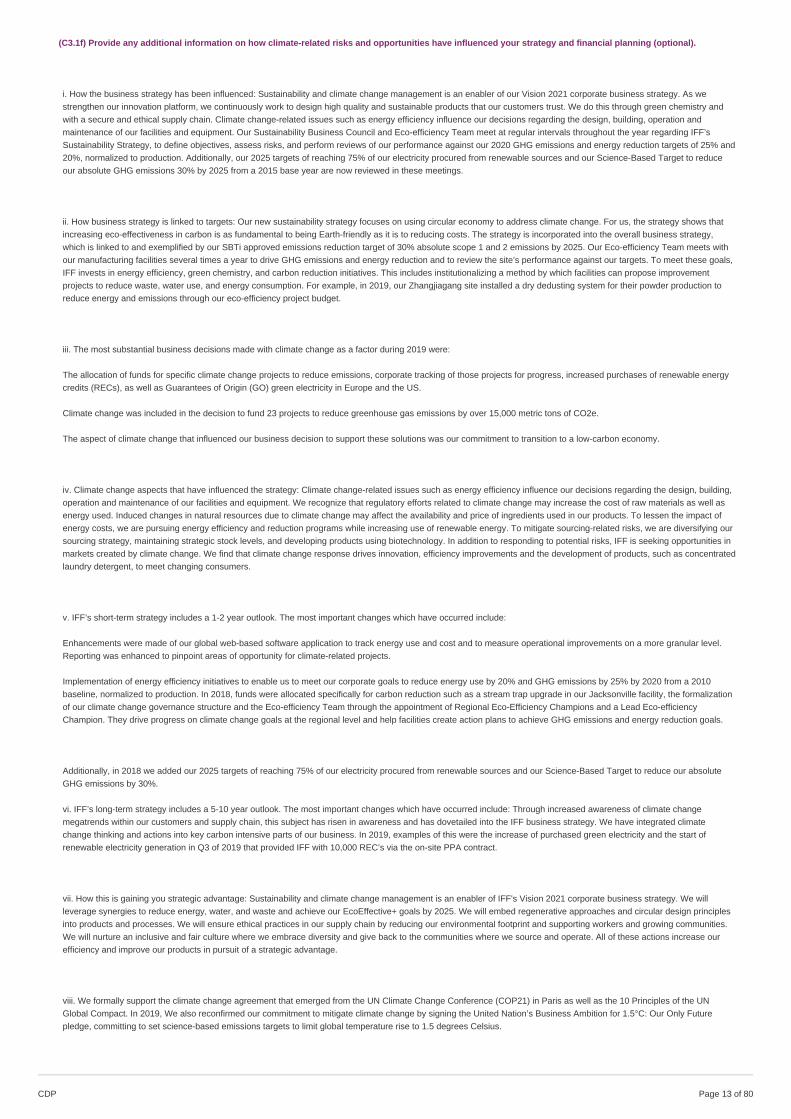
(C3.1f) Provide any additional information on how climate-related risks and opportunities have influenced your strategy and financial planning (optional).
i. How the business strategy has been influenced: Sustainability and climate change management is an enabler of our Vision 2021 corporate business strategy. As westrengthen our innovation platform, we continuously work to design high quality and sustainable products that our customers trust. We do this through green chemistry andwith a secure and ethical supply chain. Climate change-related issues such as energy efficiency influence our decisions regarding the design, building, operation andmaintenance of our facilities and equipment. Our Sustainability Business Council and Eco-efficiency Team meet at regular intervals throughout the year regarding IFF’sSustainability Strategy, to define objectives, assess risks, and perform reviews of our performance against our 2020 GHG emissions and energy reduction targets of 25% and20%, normalized to production. Additionally, our 2025 targets of reaching 75% of our electricity procured from renewable sources and our Science-Based Target to reduceour absolute GHG emissions 30% by 2025 from a 2015 base year are now reviewed in these meetings.
ii. How business strategy is linked to targets: Our new sustainability strategy focuses on using circular economy to address climate change. For us, the strategy shows thatincreasing eco-effectiveness in carbon is as fundamental to being Earth-friendly as it is to reducing costs. The strategy is incorporated into the overall business strategy,which is linked to and exemplified by our SBTi approved emissions reduction target of 30% absolute scope 1 and 2 emissions by 2025. Our Eco-efficiency Team meets withour manufacturing facilities several times a year to drive GHG emissions and energy reduction and to review the site’s performance against our targets. To meet these goals,IFF invests in energy efficiency, green chemistry, and carbon reduction initiatives. This includes institutionalizing a method by which facilities can propose improvementprojects to reduce waste, water use, and energy consumption. For example, in 2019, our Zhangjiagang site installed a dry dedusting system for their powder production toreduce energy and emissions through our eco-efficiency project budget.
iii. The most substantial business decisions made with climate change as a factor during 2019 were:
The allocation of funds for specific climate change projects to reduce emissions, corporate tracking of those projects for progress, increased purchases of renewable energycredits (RECs), as well as Guarantees of Origin (GO) green electricity in Europe and the US.
Climate change was included in the decision to fund 23 projects to reduce greenhouse gas emissions by over 15,000 metric tons of CO2e.
The aspect of climate change that influenced our business decision to support these solutions was our commitment to transition to a low-carbon economy.
iv. Climate change aspects that have influenced the strategy: Climate change-related issues such as energy efficiency influence our decisions regarding the design, building,operation and maintenance of our facilities and equipment. We recognize that regulatory efforts related to climate change may increase the cost of raw materials as well asenergy used. Induced changes in natural resources due to climate change may affect the availability and price of ingredients used in our products. To lessen the impact ofenergy costs, we are pursuing energy efficiency and reduction programs while increasing use of renewable energy. To mitigate sourcing-related risks, we are diversifying oursourcing strategy, maintaining strategic stock levels, and developing products using biotechnology. In addition to responding to potential risks, IFF is seeking opportunities inmarkets created by climate change. We find that climate change response drives innovation, efficiency improvements and the development of products, such as concentratedlaundry detergent, to meet changing consumers.
v. IFF’s short-term strategy includes a 1-2 year outlook. The most important changes which have occurred include:
Enhancements were made of our global web-based software application to track energy use and cost and to measure operational improvements on a more granular level.Reporting was enhanced to pinpoint areas of opportunity for climate-related projects.
Implementation of energy efficiency initiatives to enable us to meet our corporate goals to reduce energy use by 20% and GHG emissions by 25% by 2020 from a 2010baseline, normalized to production. In 2018, funds were allocated specifically for carbon reduction such as a stream trap upgrade in our Jacksonville facility, the formalizationof our climate change governance structure and the Eco-efficiency Team through the appointment of Regional Eco-Efficiency Champions and a Lead Eco-efficiencyChampion. They drive progress on climate change goals at the regional level and help facilities create action plans to achieve GHG emissions and energy reduction goals.
Additionally, in 2018 we added our 2025 targets of reaching 75% of our electricity procured from renewable sources and our Science-Based Target to reduce our absoluteGHG emissions by 30%.
vi. IFF’s long-term strategy includes a 5-10 year outlook. The most important changes which have occurred include: Through increased awareness of climate changemegatrends within our customers and supply chain, this subject has risen in awareness and has dovetailed into the IFF business strategy. We have integrated climatechange thinking and actions into key carbon intensive parts of our business. In 2019, examples of this were the increase of purchased green electricity and the start ofrenewable electricity generation in Q3 of 2019 that provided IFF with 10,000 REC’s via the on-site PPA contract.
vii. How this is gaining you strategic advantage: Sustainability and climate change management is an enabler of IFF's Vision 2021 corporate business strategy. We willleverage synergies to reduce energy, water, and waste and achieve our EcoEffective+ goals by 2025. We will embed regenerative approaches and circular design principlesinto products and processes. We will ensure ethical practices in our supply chain by reducing our environmental footprint and supporting workers and growing communities.We will nurture an inclusive and fair culture where we embrace diversity and give back to the communities where we source and operate. All of these actions increase ourefficiency and improve our products in pursuit of a strategic advantage.
viii. We formally support the climate change agreement that emerged from the UN Climate Change Conference (COP21) in Paris as well as the 10 Principles of the UNGlobal Compact. In 2019, We also reconfirmed our commitment to mitigate climate change by signing the United Nation’s Business Ambition for 1.5°C: Our Only Futurepledge, committing to set science-based emissions targets to limit global temperature rise to 1.5 degrees Celsius.
CDP Page of 8013
C4. Targets and performance
C4.1
(C4.1) Did you have an emissions target that was active in the reporting year?Both absolute and intensity targets
C4.1a
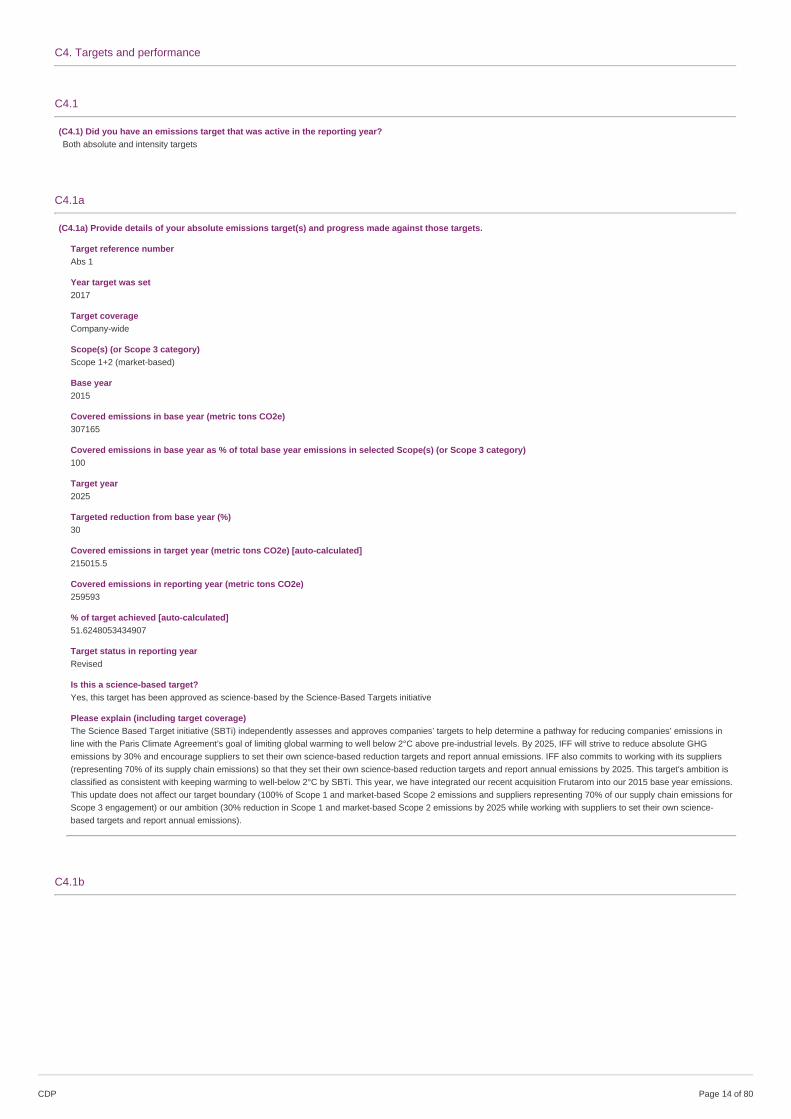
(C4.1a) Provide details of your absolute emissions target(s) and progress made against those targets.
Target reference numberAbs 1
Year target was set2017
Target coverageCompany-wide
Scope(s) (or Scope 3 category)Scope 1+2 (market-based)
Base year2015
Covered emissions in base year (metric tons CO2e)307165
Covered emissions in base year as % of total base year emissions in selected Scope(s) (or Scope 3 category)100
Target year2025
Targeted reduction from base year (%)30
Covered emissions in target year (metric tons CO2e) [auto-calculated]215015.5
Covered emissions in reporting year (metric tons CO2e)259593
% of target achieved [auto-calculated]51.6248053434907
Target status in reporting yearRevised
Is this a science-based target?Yes, this target has been approved as science-based by the Science-Based Targets initiative
Please explain (including target coverage)The Science Based Target initiative (SBTi) independently assesses and approves companies’ targets to help determine a pathway for reducing companies’ emissions inline with the Paris Climate Agreement’s goal of limiting global warming to well below 2°C above pre-industrial levels. By 2025, IFF will strive to reduce absolute GHGemissions by 30% and encourage suppliers to set their own science-based reduction targets and report annual emissions. IFF also commits to working with its suppliers(representing 70% of its supply chain emissions) so that they set their own science-based reduction targets and report annual emissions by 2025. This target's ambition isclassified as consistent with keeping warming to well-below 2°C by SBTi. This year, we have integrated our recent acquisition Frutarom into our 2015 base year emissions.This update does not affect our target boundary (100% of Scope 1 and market-based Scope 2 emissions and suppliers representing 70% of our supply chain emissions forScope 3 engagement) or our ambition (30% reduction in Scope 1 and market-based Scope 2 emissions by 2025 while working with suppliers to set their own science-based targets and report annual emissions).
C4.1b
CDP Page of 8014
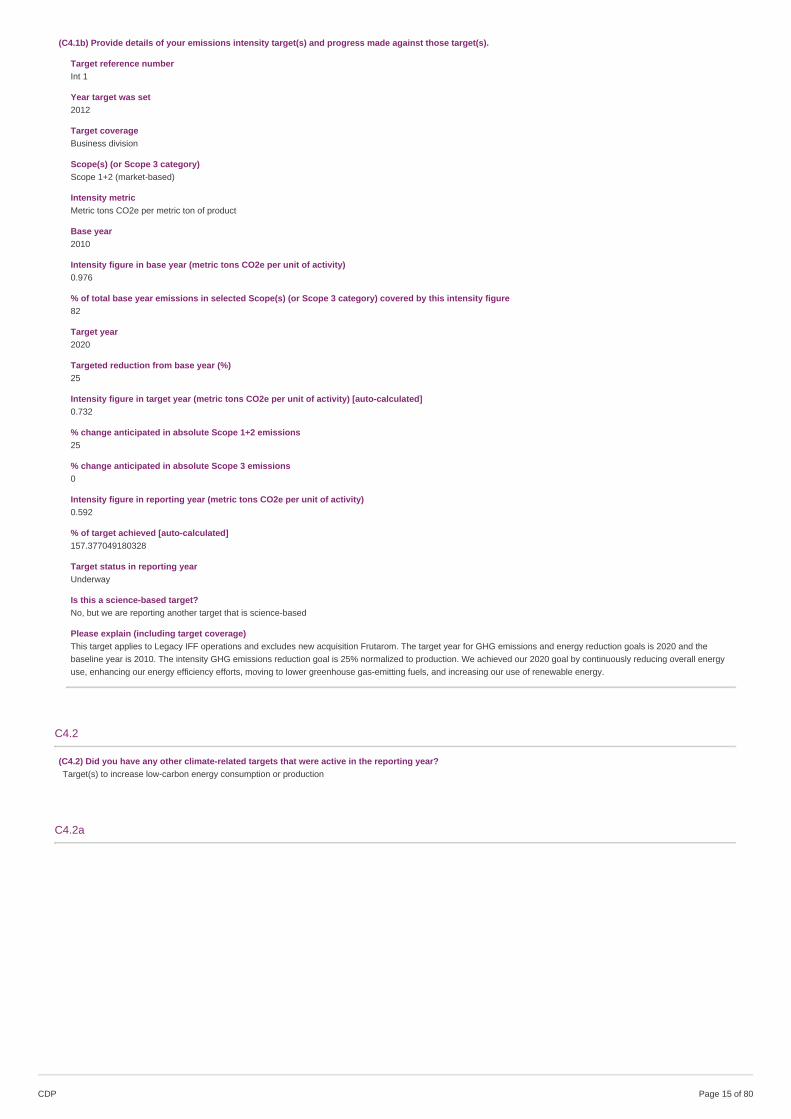
(C4.1b) Provide details of your emissions intensity target(s) and progress made against those target(s).
Target reference numberInt 1
Year target was set2012
Target coverageBusiness division
Scope(s) (or Scope 3 category)Scope 1+2 (market-based)
Intensity metricMetric tons CO2e per metric ton of product
Base year2010
Intensity figure in base year (metric tons CO2e per unit of activity)0.976
% of total base year emissions in selected Scope(s) (or Scope 3 category) covered by this intensity figure82
Target year2020
Targeted reduction from base year (%)25
Intensity figure in target year (metric tons CO2e per unit of activity) [auto-calculated]0.732
% change anticipated in absolute Scope 1+2 emissions25
% change anticipated in absolute Scope 3 emissions0
Intensity figure in reporting year (metric tons CO2e per unit of activity)0.592
% of target achieved [auto-calculated]157.377049180328
Target status in reporting yearUnderway
Is this a science-based target?No, but we are reporting another target that is science-based
Please explain (including target coverage)This target applies to Legacy IFF operations and excludes new acquisition Frutarom. The target year for GHG emissions and energy reduction goals is 2020 and thebaseline year is 2010. The intensity GHG emissions reduction goal is 25% normalized to production. We achieved our 2020 goal by continuously reducing overall energyuse, enhancing our energy efficiency efforts, moving to lower greenhouse gas-emitting fuels, and increasing our use of renewable energy.
C4.2
(C4.2) Did you have any other climate-related targets that were active in the reporting year?Target(s) to increase low-carbon energy consumption or production
C4.2a
CDP Page of 8015
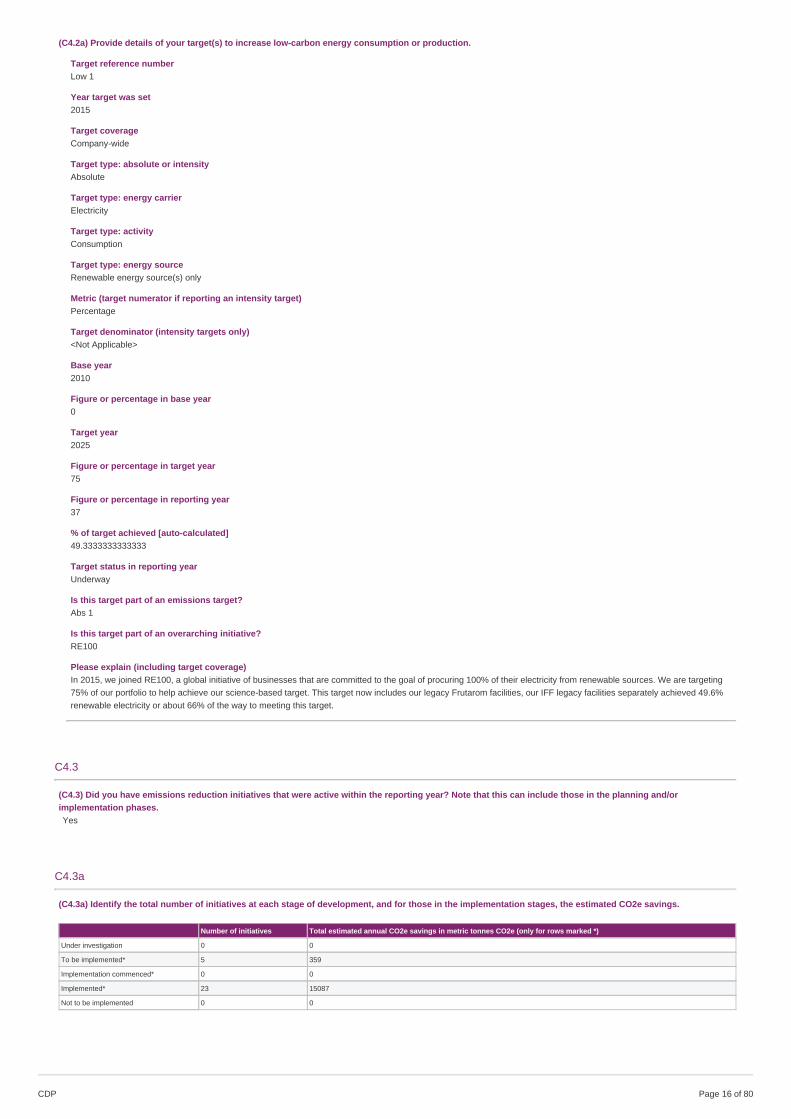
(C4.2a) Provide details of your target(s) to increase low-carbon energy consumption or production.
Target reference numberLow 1
Year target was set2015
Target coverageCompany-wide
Target type: absolute or intensityAbsolute
Target type: energy carrierElectricity
Target type: activityConsumption
Target type: energy sourceRenewable energy source(s) only
Metric (target numerator if reporting an intensity target)Percentage
Target denominator (intensity targets only)<Not Applicable>
Base year2010
Figure or percentage in base year0
Target year2025
Figure or percentage in target year75
Figure or percentage in reporting year37
% of target achieved [auto-calculated]49.3333333333333
Target status in reporting yearUnderway
Is this target part of an emissions target?Abs 1
Is this target part of an overarching initiative?RE100
Please explain (including target coverage)In 2015, we joined RE100, a global initiative of businesses that are committed to the goal of procuring 100% of their electricity from renewable sources. We are targeting75% of our portfolio to help achieve our science-based target. This target now includes our legacy Frutarom facilities, our IFF legacy facilities separately achieved 49.6%renewable electricity or about 66% of the way to meeting this target.
C4.3
(C4.3) Did you have emissions reduction initiatives that were active within the reporting year? Note that this can include those in the planning and/orimplementation phases.Yes
C4.3a
(C4.3a) Identify the total number of initiatives at each stage of development, and for those in the implementation stages, the estimated CO2e savings.
Number of initiatives Total estimated annual CO2e savings in metric tonnes CO2e (only for rows marked *)
Under investigation 0 0
To be implemented* 5 359
Implementation commenced* 0 0
Implemented* 23 15087
Not to be implemented 0 0
CDP Page of 8016
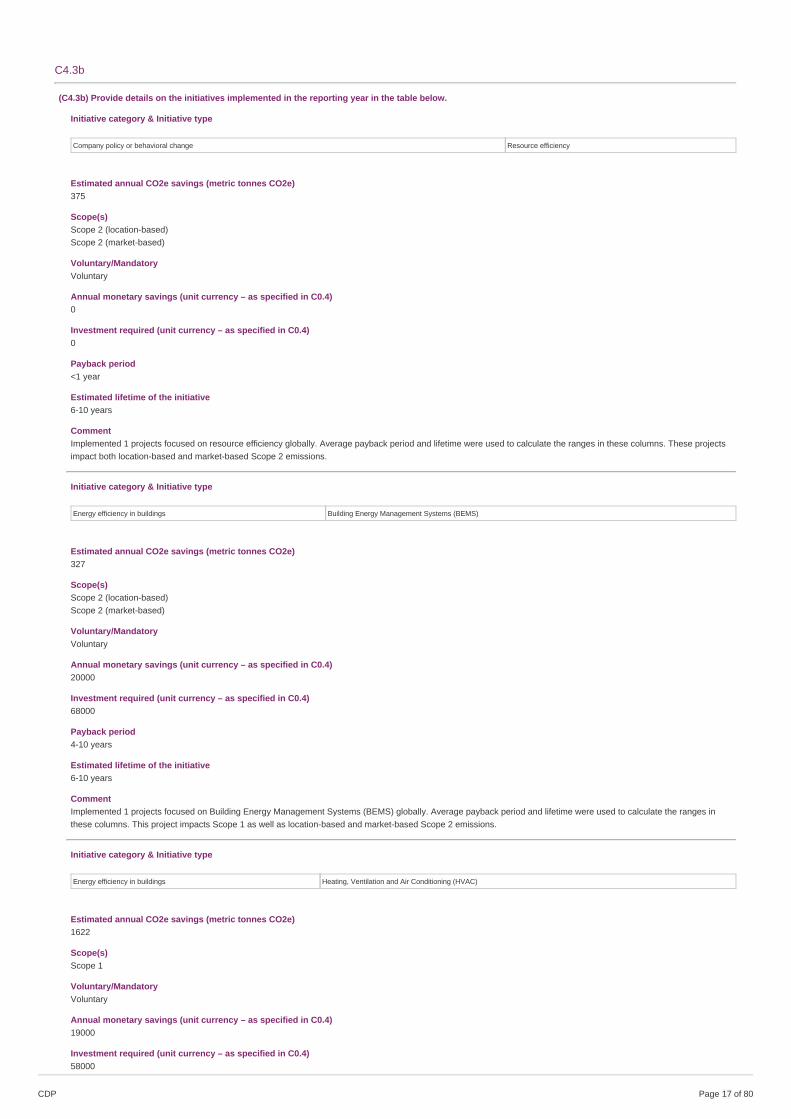
C4.3b
(C4.3b) Provide details on the initiatives implemented in the reporting year in the table below.
Initiative category & Initiative type
Company policy or behavioral change Resource efficiency
Estimated annual CO2e savings (metric tonnes CO2e)375
Scope(s)Scope 2 (location-based)Scope 2 (market-based)
Voluntary/MandatoryVoluntary
Annual monetary savings (unit currency – as specified in C0.4)0
Investment required (unit currency – as specified in C0.4)0
Payback period<1 year
Estimated lifetime of the initiative6-10 years
CommentImplemented 1 projects focused on resource efficiency globally. Average payback period and lifetime were used to calculate the ranges in these columns. These projectsimpact both location-based and market-based Scope 2 emissions.
Initiative category & Initiative type
Energy efficiency in buildings Building Energy Management Systems (BEMS)
Estimated annual CO2e savings (metric tonnes CO2e)327
Scope(s)Scope 2 (location-based)Scope 2 (market-based)
Voluntary/MandatoryVoluntary
Annual monetary savings (unit currency – as specified in C0.4)20000
Investment required (unit currency – as specified in C0.4)68000
Payback period4-10 years
Estimated lifetime of the initiative6-10 years
CommentImplemented 1 projects focused on Building Energy Management Systems (BEMS) globally. Average payback period and lifetime were used to calculate the ranges inthese columns. This project impacts Scope 1 as well as location-based and market-based Scope 2 emissions.
Initiative category & Initiative type
Energy efficiency in buildings Heating, Ventilation and Air Conditioning (HVAC)
Estimated annual CO2e savings (metric tonnes CO2e)1622
Scope(s)Scope 1
Voluntary/MandatoryVoluntary
Annual monetary savings (unit currency – as specified in C0.4)19000
Investment required (unit currency – as specified in C0.4)58000
CDP Page of 8017
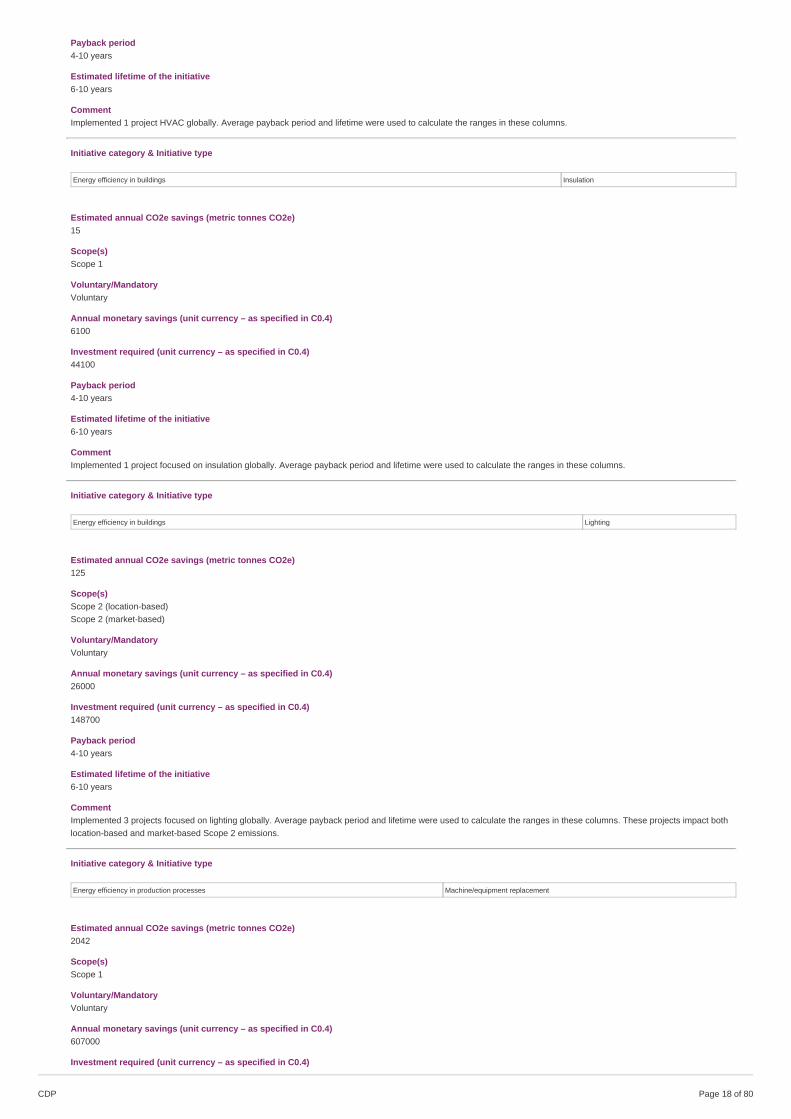
Payback period4-10 years
Estimated lifetime of the initiative6-10 years
CommentImplemented 1 project HVAC globally. Average payback period and lifetime were used to calculate the ranges in these columns.
Initiative category & Initiative type
Energy efficiency in buildings Insulation
Estimated annual CO2e savings (metric tonnes CO2e)15
Scope(s)Scope 1
Voluntary/MandatoryVoluntary
Annual monetary savings (unit currency – as specified in C0.4)6100
Investment required (unit currency – as specified in C0.4)44100
Payback period4-10 years
Estimated lifetime of the initiative6-10 years
CommentImplemented 1 project focused on insulation globally. Average payback period and lifetime were used to calculate the ranges in these columns.
Initiative category & Initiative type
Energy efficiency in buildings Lighting
Estimated annual CO2e savings (metric tonnes CO2e)125
Scope(s)Scope 2 (location-based)Scope 2 (market-based)
Voluntary/MandatoryVoluntary
Annual monetary savings (unit currency – as specified in C0.4)26000
Investment required (unit currency – as specified in C0.4)148700
Payback period4-10 years
Estimated lifetime of the initiative6-10 years
CommentImplemented 3 projects focused on lighting globally. Average payback period and lifetime were used to calculate the ranges in these columns. These projects impact bothlocation-based and market-based Scope 2 emissions.
Initiative category & Initiative type
Energy efficiency in production processes Machine/equipment replacement
Estimated annual CO2e savings (metric tonnes CO2e)2042
Scope(s)Scope 1
Voluntary/MandatoryVoluntary
Annual monetary savings (unit currency – as specified in C0.4)607000
Investment required (unit currency – as specified in C0.4)
CDP Page of 8018
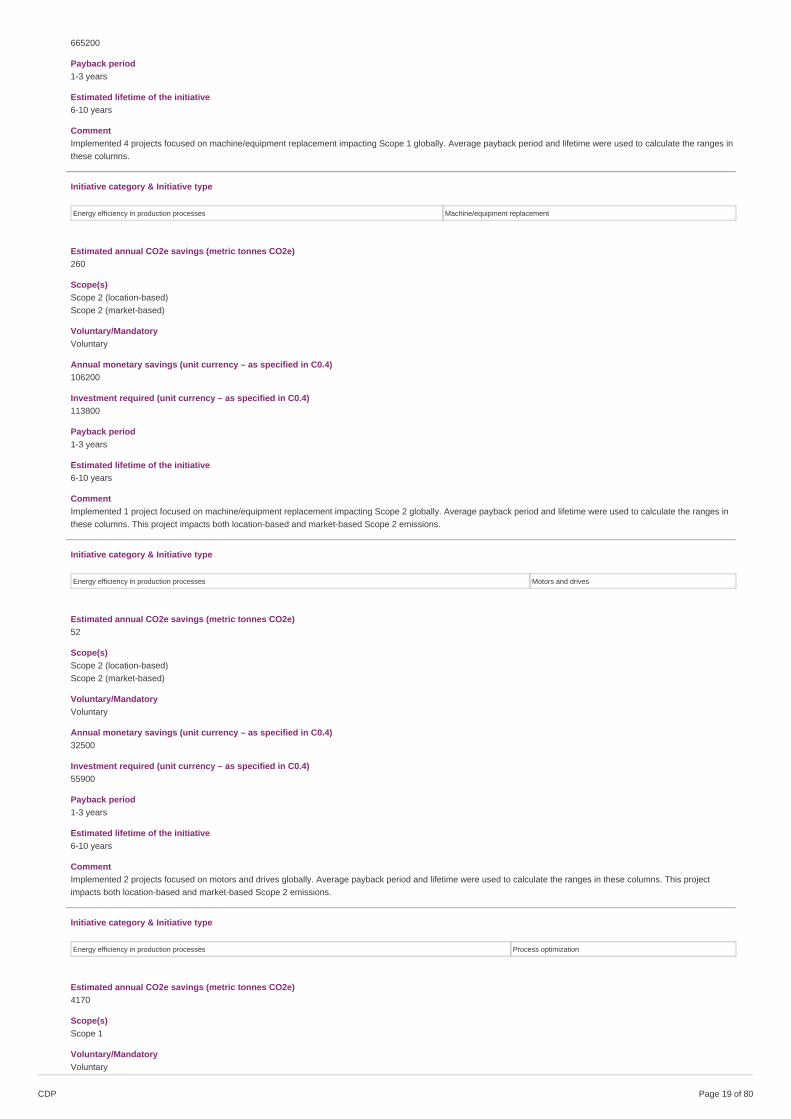
665200
Payback period1-3 years
Estimated lifetime of the initiative6-10 years
CommentImplemented 4 projects focused on machine/equipment replacement impacting Scope 1 globally. Average payback period and lifetime were used to calculate the ranges inthese columns.
Initiative category & Initiative type
Energy efficiency in production processes Machine/equipment replacement
Estimated annual CO2e savings (metric tonnes CO2e)260
Scope(s)Scope 2 (location-based)Scope 2 (market-based)
Voluntary/MandatoryVoluntary
Annual monetary savings (unit currency – as specified in C0.4)106200
Investment required (unit currency – as specified in C0.4)113800
Payback period1-3 years
Estimated lifetime of the initiative6-10 years
CommentImplemented 1 project focused on machine/equipment replacement impacting Scope 2 globally. Average payback period and lifetime were used to calculate the ranges inthese columns. This project impacts both location-based and market-based Scope 2 emissions.
Initiative category & Initiative type
Energy efficiency in production processes Motors and drives
Estimated annual CO2e savings (metric tonnes CO2e)52
Scope(s)Scope 2 (location-based)Scope 2 (market-based)
Voluntary/MandatoryVoluntary
Annual monetary savings (unit currency – as specified in C0.4)32500
Investment required (unit currency – as specified in C0.4)55900
Payback period1-3 years
Estimated lifetime of the initiative6-10 years
CommentImplemented 2 projects focused on motors and drives globally. Average payback period and lifetime were used to calculate the ranges in these columns. This projectimpacts both location-based and market-based Scope 2 emissions.
Initiative category & Initiative type
Energy efficiency in production processes Process optimization
Estimated annual CO2e savings (metric tonnes CO2e)4170
Scope(s)Scope 1
Voluntary/MandatoryVoluntary
CDP Page of 8019
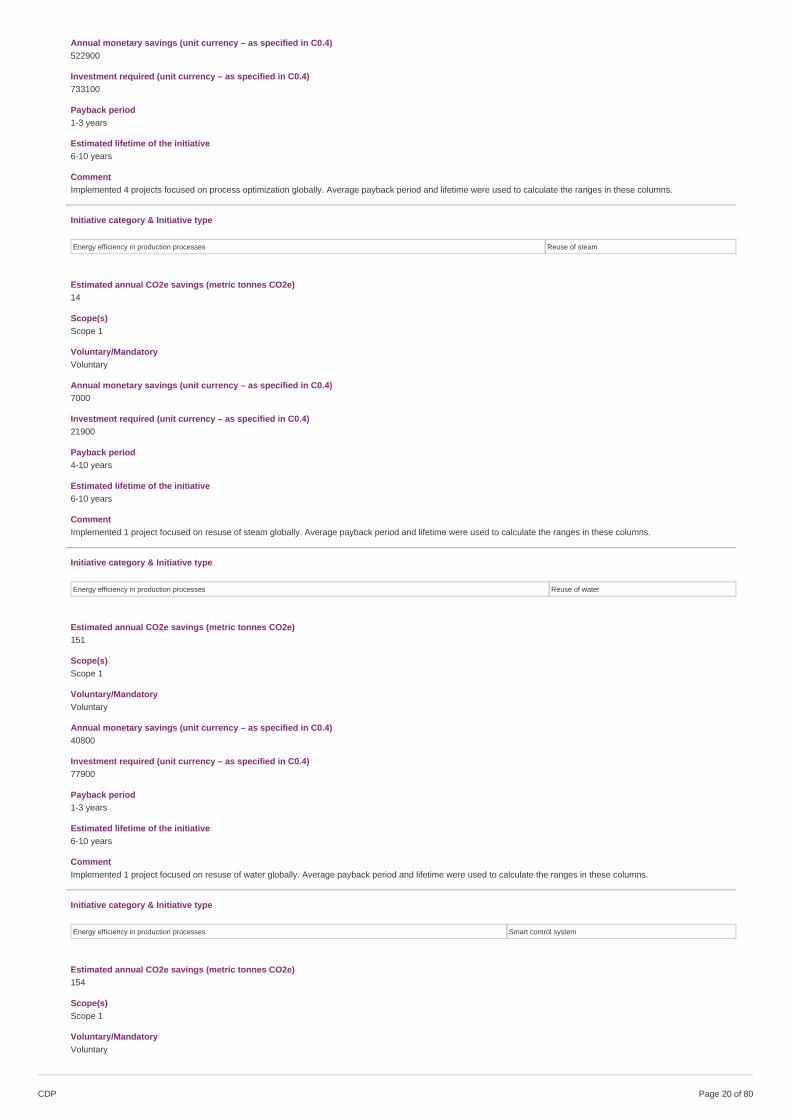
Annual monetary savings (unit currency – as specified in C0.4)522900
Investment required (unit currency – as specified in C0.4)733100
Payback period1-3 years
Estimated lifetime of the initiative6-10 years
CommentImplemented 4 projects focused on process optimization globally. Average payback period and lifetime were used to calculate the ranges in these columns.
Initiative category & Initiative type
Energy efficiency in production processes Reuse of steam
Estimated annual CO2e savings (metric tonnes CO2e)14
Scope(s)Scope 1
Voluntary/MandatoryVoluntary
Annual monetary savings (unit currency – as specified in C0.4)7000
Investment required (unit currency – as specified in C0.4)21900
Payback period4-10 years
Estimated lifetime of the initiative6-10 years
CommentImplemented 1 project focused on resuse of steam globally. Average payback period and lifetime were used to calculate the ranges in these columns.
Initiative category & Initiative type
Energy efficiency in production processes Reuse of water
Estimated annual CO2e savings (metric tonnes CO2e)151
Scope(s)Scope 1
Voluntary/MandatoryVoluntary
Annual monetary savings (unit currency – as specified in C0.4)40800
Investment required (unit currency – as specified in C0.4)77900
Payback period1-3 years
Estimated lifetime of the initiative6-10 years
CommentImplemented 1 project focused on resuse of water globally. Average payback period and lifetime were used to calculate the ranges in these columns.
Initiative category & Initiative type
Energy efficiency in production processes Smart control system
Estimated annual CO2e savings (metric tonnes CO2e)154
Scope(s)Scope 1
Voluntary/MandatoryVoluntary
CDP Page of 8020
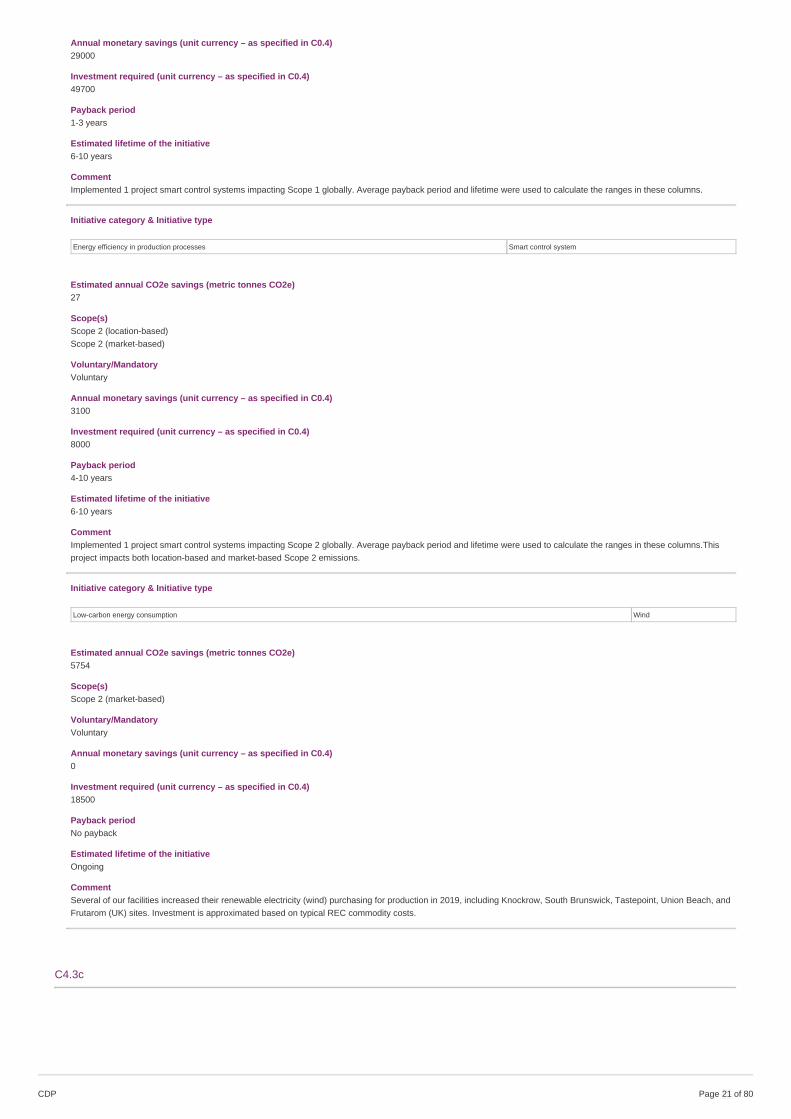
Annual monetary savings (unit currency – as specified in C0.4)29000
Investment required (unit currency – as specified in C0.4)49700
Payback period1-3 years
Estimated lifetime of the initiative6-10 years
CommentImplemented 1 project smart control systems impacting Scope 1 globally. Average payback period and lifetime were used to calculate the ranges in these columns.
Initiative category & Initiative type
Energy efficiency in production processes Smart control system
Estimated annual CO2e savings (metric tonnes CO2e)27
Scope(s)Scope 2 (location-based)Scope 2 (market-based)
Voluntary/MandatoryVoluntary
Annual monetary savings (unit currency – as specified in C0.4)3100
Investment required (unit currency – as specified in C0.4)8000
Payback period4-10 years
Estimated lifetime of the initiative6-10 years
CommentImplemented 1 project smart control systems impacting Scope 2 globally. Average payback period and lifetime were used to calculate the ranges in these columns.Thisproject impacts both location-based and market-based Scope 2 emissions.
Initiative category & Initiative type
Low-carbon energy consumption Wind
Estimated annual CO2e savings (metric tonnes CO2e)5754
Scope(s)Scope 2 (market-based)
Voluntary/MandatoryVoluntary
Annual monetary savings (unit currency – as specified in C0.4)0
Investment required (unit currency – as specified in C0.4)18500
Payback periodNo payback
Estimated lifetime of the initiativeOngoing
CommentSeveral of our facilities increased their renewable electricity (wind) purchasing for production in 2019, including Knockrow, South Brunswick, Tastepoint, Union Beach, andFrutarom (UK) sites. Investment is approximated based on typical REC commodity costs.
C4.3c
CDP Page of 8021
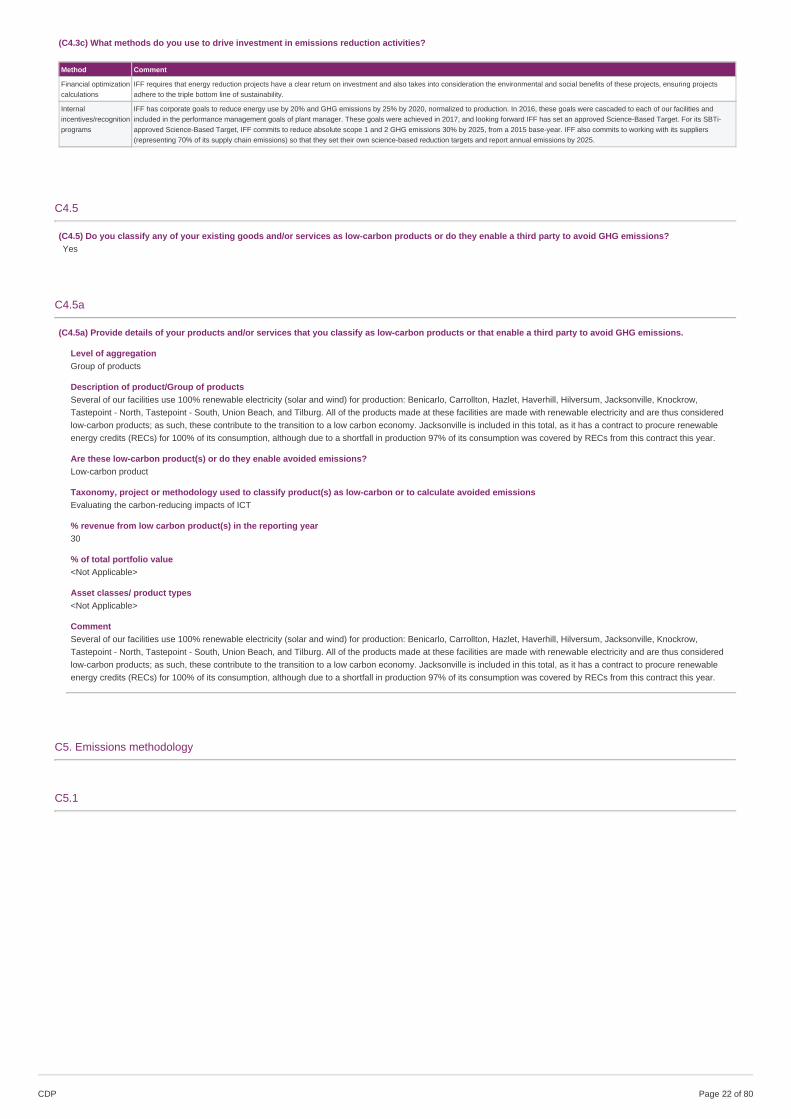
(C4.3c) What methods do you use to drive investment in emissions reduction activities?
Method Comment
Financial optimizationcalculations
IFF requires that energy reduction projects have a clear return on investment and also takes into consideration the environmental and social benefits of these projects, ensuring projectsadhere to the triple bottom line of sustainability.
Internalincentives/recognitionprograms
IFF has corporate goals to reduce energy use by 20% and GHG emissions by 25% by 2020, normalized to production. In 2016, these goals were cascaded to each of our facilities andincluded in the performance management goals of plant manager. These goals were achieved in 2017, and looking forward IFF has set an approved Science-Based Target. For its SBTi-approved Science-Based Target, IFF commits to reduce absolute scope 1 and 2 GHG emissions 30% by 2025, from a 2015 base-year. IFF also commits to working with its suppliers(representing 70% of its supply chain emissions) so that they set their own science-based reduction targets and report annual emissions by 2025.
C4.5
(C4.5) Do you classify any of your existing goods and/or services as low-carbon products or do they enable a third party to avoid GHG emissions?Yes
C4.5a
(C4.5a) Provide details of your products and/or services that you classify as low-carbon products or that enable a third party to avoid GHG emissions.
Level of aggregationGroup of products
Description of product/Group of productsSeveral of our facilities use 100% renewable electricity (solar and wind) for production: Benicarlo, Carrollton, Hazlet, Haverhill, Hilversum, Jacksonville, Knockrow,Tastepoint - North, Tastepoint - South, Union Beach, and Tilburg. All of the products made at these facilities are made with renewable electricity and are thus consideredlow-carbon products; as such, these contribute to the transition to a low carbon economy. Jacksonville is included in this total, as it has a contract to procure renewableenergy credits (RECs) for 100% of its consumption, although due to a shortfall in production 97% of its consumption was covered by RECs from this contract this year.
Are these low-carbon product(s) or do they enable avoided emissions?Low-carbon product
Taxonomy, project or methodology used to classify product(s) as low-carbon or to calculate avoided emissionsEvaluating the carbon-reducing impacts of ICT
% revenue from low carbon product(s) in the reporting year30
% of total portfolio value<Not Applicable>
Asset classes/ product types<Not Applicable>
CommentSeveral of our facilities use 100% renewable electricity (solar and wind) for production: Benicarlo, Carrollton, Hazlet, Haverhill, Hilversum, Jacksonville, Knockrow,Tastepoint - North, Tastepoint - South, Union Beach, and Tilburg. All of the products made at these facilities are made with renewable electricity and are thus consideredlow-carbon products; as such, these contribute to the transition to a low carbon economy. Jacksonville is included in this total, as it has a contract to procure renewableenergy credits (RECs) for 100% of its consumption, although due to a shortfall in production 97% of its consumption was covered by RECs from this contract this year.
C5. Emissions methodology
C5.1
CDP Page of 8022
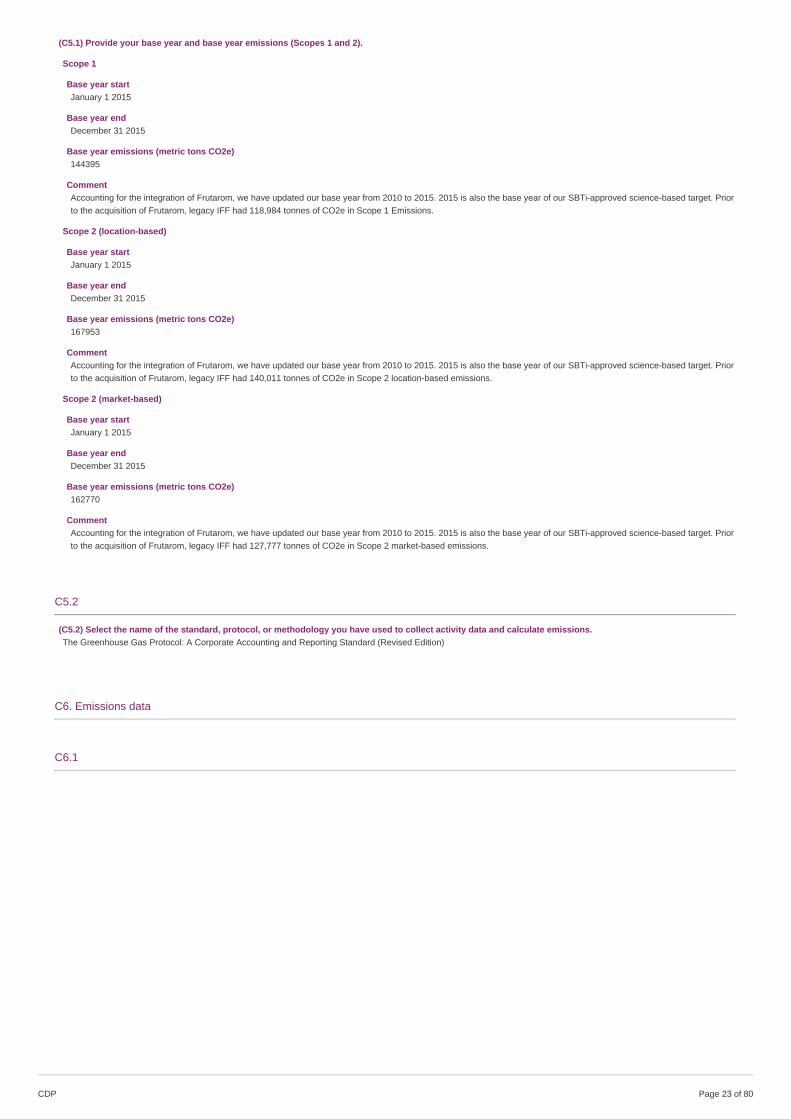
(C5.1) Provide your base year and base year emissions (Scopes 1 and 2).
Scope 1
Base year startJanuary 1 2015
Base year endDecember 31 2015
Base year emissions (metric tons CO2e)144395
CommentAccounting for the integration of Frutarom, we have updated our base year from 2010 to 2015. 2015 is also the base year of our SBTi-approved science-based target. Priorto the acquisition of Frutarom, legacy IFF had 118,984 tonnes of CO2e in Scope 1 Emissions.
Scope 2 (location-based)
Base year startJanuary 1 2015
Base year endDecember 31 2015
Base year emissions (metric tons CO2e)167953
CommentAccounting for the integration of Frutarom, we have updated our base year from 2010 to 2015. 2015 is also the base year of our SBTi-approved science-based target. Priorto the acquisition of Frutarom, legacy IFF had 140,011 tonnes of CO2e in Scope 2 location-based emissions.
Scope 2 (market-based)
Base year startJanuary 1 2015
Base year endDecember 31 2015
Base year emissions (metric tons CO2e)162770
CommentAccounting for the integration of Frutarom, we have updated our base year from 2010 to 2015. 2015 is also the base year of our SBTi-approved science-based target. Priorto the acquisition of Frutarom, legacy IFF had 127,777 tonnes of CO2e in Scope 2 market-based emissions.
C5.2
(C5.2) Select the name of the standard, protocol, or methodology you have used to collect activity data and calculate emissions.The Greenhouse Gas Protocol: A Corporate Accounting and Reporting Standard (Revised Edition)
C6. Emissions data
C6.1
CDP Page of 8023
(C6.1) What were your organization’s gross global Scope 1 emissions in metric tons CO2e?
Reporting year
Gross global Scope 1 emissions (metric tons CO2e)151002
Start dateJanuary 1 2019
End dateDecember 31 2019
CommentThis is accounting for the acquisition of Frutarom. In 2019, IFF Legacy had 122,996 tonnes of CO2e in Scope 1 emissions.
Past year 1
Gross global Scope 1 emissions (metric tons CO2e)150840
Start dateJanuary 1 2018
End dateDecember 31 2018
CommentThis is accounting for the integration of Frutarom in 2018. Legacy IFF had 125,429 tonnes of CO2e in Scope 1 Emissions in 2018.
Past year 2
Gross global Scope 1 emissions (metric tons CO2e)144395
Start dateJanuary 1 2015
End dateDecember 31 2015
CommentAccounting for the integration of Frutarom, we have updated our base year 2015 baseline which is the base year of our SBTi-approved science-based target. Prior to theacquisition of Frutarom, legacy IFF had 118,984 tonnes of CO2e in Scope 1 Emissions in 2015.
C6.2
(C6.2) Describe your organization’s approach to reporting Scope 2 emissions.
Row 1
Scope 2, location-based We are reporting a Scope 2, location-based figure
Scope 2, market-basedWe are reporting a Scope 2, market-based figure
Comment
C6.3
CDP Page of 8024
(C6.3) What were your organization’s gross global Scope 2 emissions in metric tons CO2e?
Reporting year
Scope 2, location-based138718
Scope 2, market-based (if applicable)108591
Start dateJanuary 1 2019
End dateDecember 31 2019
CommentThis is accounting for the acquisition of Frutarom. In 2019, IFF Legacy had 110,775 tonnes of CO2e in Scope 2 location-based emissions and 75,542 tonnes of CO2e inScope 2 market-based emissions.
Past year 1
Scope 2, location-based145813
Scope 2, market-based (if applicable)119990
Start dateJanuary 1 2018
End dateDecember 31 2018
CommentThis is accounting for the integration of Frutarom in 2018., Legacy IFF had 116,433 tonnes of CO2e in Scope 2 location-based emissions and 85,048 tonnes of CO2e inScope 2 market-based emissions.
Past year 2
Scope 2, location-based167953
Scope 2, market-based (if applicable)162770
Start dateJanuary 1 2015
End dateDecember 31 2015
CommentAccounting for the integration of Frutarom, we have updated our base year from 2010 to 2015. 2015 is also the base year of our SBTi-approved science-based target. Priorto the acquisition of Frutarom, legacy IFF had 140,011 tonnes of CO2e in Scope 2 location-based emissions and 127,777 tonnes of CO2e in Scope 2 market-basedemissions.
C6.4
(C6.4) Are there any sources (e.g. facilities, specific GHGs, activities, geographies, etc.) of Scope 1 and Scope 2 emissions that are within your selected reportingboundary which are not included in your disclosure?No
C6.5
(C6.5) Account for your organization’s gross global Scope 3 emissions, disclosing and explaining any exclusions.
CDP Page of 8025
Purchased goods and services
Evaluation statusRelevant, calculated
Metric tonnes CO2e1407000
Emissions calculation methodologyCorporate-wide global direct and indirect expense data was obtained from finance. The spend was mapped to corresponding industry sectors and then multiplied by cradle-to-gate emission factors by sector from UK DEFRA's "Table 13 – Indirect emissions from the supply chain," Version 2.0, updated March 2014. The year 2011 factors areconverted from British Pounds to US Dollars via the IRS Yearly Average Currency Exchange Rates. The factors are then updated to 2019 factors per the USA Bureau ofLabor Statistics annual average inflation rate. Sectors already included in Scopes 1 and 2 (such as electricity purchases) and other Scope 3 categories (such as capitalgoods) were removed to prevent double counting. Global warming potentials (GWPs) used in the DEFRA factors are from the IPCC Second Assessment Report, 100 yearaverage. Indirect spend data was not available for Frutarom operations, so this portion of company-wide purchased goods and services emissions was estimated based onlegacy IFF's calculated indirect spend emissions scaled by Frutarom's share of company-wide direct spend, for which data was available for both Legacy IFF and Frutarom.
Percentage of emissions calculated using data obtained from suppliers or value chain partners0
Please explain
Capital goods
Evaluation statusRelevant, calculated
Metric tonnes CO2e11200
Emissions calculation methodologyLegacy IFF capital expenditure (CAPEX) data was obtained from finance. The spend was mapped to corresponding industry sectors and then multiplied by cradle-to-gateemission factors by sector from UK DEFRA's "Table 13 – Indirect emissions from the supply chain," Version 2.0, updated March 2014. The year 2011 factors are convertedfrom British Pounds to US Dollars via the IRS Yearly Average Currency Exchange Rates. The factors are then updated to 2019 factors per the USA Bureau of LaborStatistics annual average inflation rate. Global warming potentials (GWPs) used in the DEFRA factors are from the IPCC Second Assessment Report, 100 year average.CAPEX data was not available for Frutarom operations, so this portion of company-wide capital goods emissions was estimated based on legacy IFF's calculated CapitalGoods emissions scaled by Frutarom's share of company-wide direct spend, for which data was available for both Legacy IFF and Frutarom.
Percentage of emissions calculated using data obtained from suppliers or value chain partners0
Please explain
Fuel-and-energy-related activities (not included in Scope 1 or 2)
Evaluation statusRelevant, calculated
Metric tonnes CO2e49362
Emissions calculation methodologyTotal global electricity and fuel use derived from our Scope 1 & 2 inventory are used as activity data in this category. Upstream emissions from fuel use are quantified byapplied emissions factors based on life cycle assessment of fuels in various countries derived from lifecycle assessment tools. Upstream emissions from US purchasedfuels (Activity A) and electricity purchases in the US (Activity B) are quantified using life cycle emissions factors from Argonne Labs' GREET1_2019 model (Version1_2019, October 2019), with the electricity life cycle factors based on Year 2018 eGRID grid generation mix. Upstream emissions from internationally purchased fuels(Activity A) are quantified using life cycle emissions factors from multiple lifecycle assessment tools including Ecoinvent LCI Database v3.5, USLCI NREL database 2018update, and thinkstep professional database 2018, service pack 39, with conversion factors from EPA's Climate Leaders Design Principles. Upstream emissions fromelectricity purchases internationally (Activity B) are quantified using the multipliers in the UK DEFRA’s 2015 Guidelines. Emissions due to losses from transmission anddistribution in the US (Activity C) are calculated using loss factors from the EPA’s eGRID2018, January 2020. Emissions due to loses from transmission and distributioninternationally (Activity C) are quantified using the loss factors from International Energy Agency (IEA)'s "Emission Factors 2019" product, specifically the "Adjustment fortransmission and distribution losses induced emissions (gCO2/kWh)" year 2017 factors. Steam transmission and distribution (T&D) losses (activity C) are derived from lossfactors in 2010 Guidelines to Defra / DECC's GHG Conversion Factors for Company Reporting (Year 2010 Factors from Annex 10). Global warming potentials come fromthe IPCC’s Fifth Assessment Report, 100 year average.
Percentage of emissions calculated using data obtained from suppliers or value chain partners100
Please explain
CDP Page of 8026
Upstream transportation and distribution
Evaluation statusRelevant, calculated
Metric tonnes CO2e200000
Emissions calculation methodologyThis category includes emissions associated with inbound shipments to our facilities, shipments between our facilities, and outbound shipments from our facilities that wepay for. Data was not available for 2019, so 2014 data was used as a proxy. For each of these categories, total mass, distance shipped, and method of shipping werecollected on a per-shipment basis. Emission factors per ton-mile for cargo shipments via air, ocean, and rail were taken from Table A-116 of the U.S. Greenhouse GasEmissions and Sinks: 1990-2012. The emission factor for highway shipment was taken from Table 2-15 of the same source. Also included in this category is warehousing.For all warehoused material, approximate area of storage space and time spent in storage was determined. Average electricity use per sqft*yr for warehouses was takenfrom CBECs Table C15A: Electricity Consumption and Conditional Energy Intensity by Census Region for All Buildings, 2003. It was assumed that the average electricityemission factor is approximately equal to the U.S. eGRID's RFCE region, where many warehouses are located. GWPs were taken from the IPCC Second AssessmentReport, 100 year avg. Data was not available for Frutarom operations, so this portion of company-wide upstream transportation and distribution emissions was estimatedbased on legacy IFF's estimated emissions in this category scaled by Frutarom's share of company-wide direct spend, for which data was available for both Legacy IFF andFrutarom.
Percentage of emissions calculated using data obtained from suppliers or value chain partners0
Please explain
Waste generated in operations
Evaluation statusRelevant, calculated
Metric tonnes CO2e25314
Emissions calculation methodologyTotal weight of hazardous and non-hazardous waste generated from IFF’s total global production are used as activity data for this calculation. Waste is categorized by typeof material and diversion method, including recycling, composting, incineration, and landfilling. The waste-type-specific method, described in "Technical Guidance forCalculating Scope 3 Emissions," is then applied. Waste emissions factors are consistent with the GHG Protocol Scope 3 guidance, and include the voluntary transportationemissions, with an assumed average distance traveled to the processing facility. Recycling emissions include transport to recycling facility and sorting of recycled materialsat material recovery facility. Landfill emissions include transport to landfill, equipment use at landfill and landfill CH4. Landfill CH4 is based on typical landfill gas collectionpractices, average landfill moisture conditions, and U.S.-average non-baseload electricity grid mix. Combustion emissions include transport to waste-to-energy facility andcombustion-related non-biogenic CO2 and N2O. Compost emissions include transport to compost, equipment use at compost facility and CH4 and N2O emissions duringcomposting. Factors are from the EPA, Office of Resource Conservation and Recovery (February 2016) Documentation for Greenhouse Gas Emission and Energy Factorsused in the Waste Reduction Model (WARM). Factors from tables provided in the Management Practices Chapters and Background Chapters. WARM Version 14.Additional data provided from EPA. These US emission factors are assumed to be applicable across the rest of the world. Avoided emissions due to waste to energy andrecycling are not included in this emissions reporting. Global warming potentials come from the IPCC’s Fourth Assessment Report, 100 year average, and are used toconvert all waste emission factors into CO2e.
Percentage of emissions calculated using data obtained from suppliers or value chain partners100
Please explain
Business travel
Evaluation statusRelevant, calculated
Metric tonnes CO2e11346
Emissions calculation methodologyTravel data is provided by our travel agency and includes global air travel by cabin class and distance threshold for each trip. For air travel, each cabin class / distancethreshold pairing is multiplied by the appropriate emission factor from the 2019 Guidelines to Defra / DECC's GHG Conversion Factors for Company Reporting, Version 1.0August 2019 release. GWPs come from the IPCC Fifth Assessment Report. Travel data was not available for Frutarom operations, so this portion of company-widebusiness travel emissions was estimated by scaling Legacy IFF calculated business travel emissions based on ratio of employees in Frutarom and Legacy IFF.
Percentage of emissions calculated using data obtained from suppliers or value chain partners100
Please explain
Employee commuting
Evaluation statusRelevant, calculated
Metric tonnes CO2e23300
Emissions calculation methodologyScreening done for SBTi using Quantis Scope 3 Evaluator tool.
Percentage of emissions calculated using data obtained from suppliers or value chain partners0
Please explainThis category was found to be relevant after our 2017 sustainability report was published and was determined during the SBTi approval process.
CDP Page of 8027
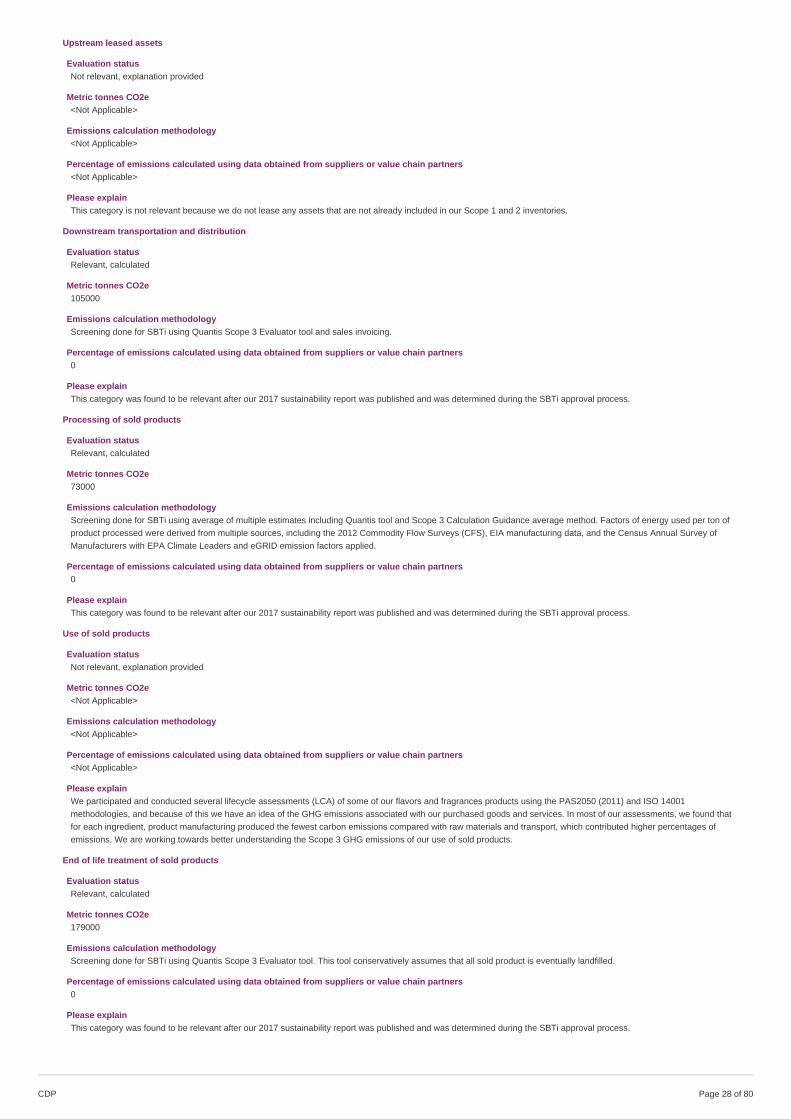
Upstream leased assets
Evaluation statusNot relevant, explanation provided
Metric tonnes CO2e<Not Applicable>
Emissions calculation methodology<Not Applicable>
Percentage of emissions calculated using data obtained from suppliers or value chain partners<Not Applicable>
Please explainThis category is not relevant because we do not lease any assets that are not already included in our Scope 1 and 2 inventories.
Downstream transportation and distribution
Evaluation statusRelevant, calculated
Metric tonnes CO2e105000
Emissions calculation methodologyScreening done for SBTi using Quantis Scope 3 Evaluator tool and sales invoicing.
Percentage of emissions calculated using data obtained from suppliers or value chain partners0
Please explainThis category was found to be relevant after our 2017 sustainability report was published and was determined during the SBTi approval process.
Processing of sold products
Evaluation statusRelevant, calculated
Metric tonnes CO2e73000
Emissions calculation methodologyScreening done for SBTi using average of multiple estimates including Quantis tool and Scope 3 Calculation Guidance average method. Factors of energy used per ton ofproduct processed were derived from multiple sources, including the 2012 Commodity Flow Surveys (CFS), EIA manufacturing data, and the Census Annual Survey ofManufacturers with EPA Climate Leaders and eGRID emission factors applied.
Percentage of emissions calculated using data obtained from suppliers or value chain partners0
Please explainThis category was found to be relevant after our 2017 sustainability report was published and was determined during the SBTi approval process.
Use of sold products
Evaluation statusNot relevant, explanation provided
Metric tonnes CO2e<Not Applicable>
Emissions calculation methodology<Not Applicable>
Percentage of emissions calculated using data obtained from suppliers or value chain partners<Not Applicable>
Please explainWe participated and conducted several lifecycle assessments (LCA) of some of our flavors and fragrances products using the PAS2050 (2011) and ISO 14001methodologies, and because of this we have an idea of the GHG emissions associated with our purchased goods and services. In most of our assessments, we found thatfor each ingredient, product manufacturing produced the fewest carbon emissions compared with raw materials and transport, which contributed higher percentages ofemissions. We are working towards better understanding the Scope 3 GHG emissions of our use of sold products.
End of life treatment of sold products
Evaluation statusRelevant, calculated
Metric tonnes CO2e179000
Emissions calculation methodologyScreening done for SBTi using Quantis Scope 3 Evaluator tool. This tool conservatively assumes that all sold product is eventually landfilled.
Percentage of emissions calculated using data obtained from suppliers or value chain partners0
Please explainThis category was found to be relevant after our 2017 sustainability report was published and was determined during the SBTi approval process.
CDP Page of 8028
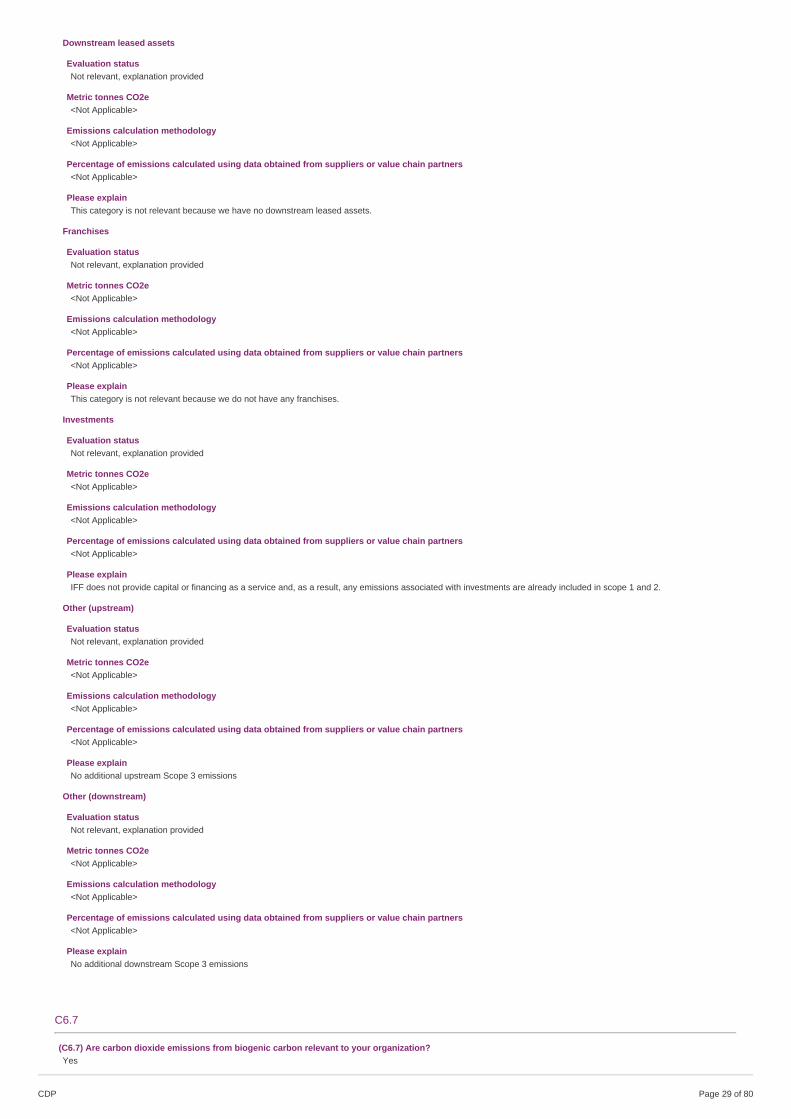
Downstream leased assets
Evaluation statusNot relevant, explanation provided
Metric tonnes CO2e<Not Applicable>
Emissions calculation methodology<Not Applicable>
Percentage of emissions calculated using data obtained from suppliers or value chain partners<Not Applicable>
Please explainThis category is not relevant because we have no downstream leased assets.
Franchises
Evaluation statusNot relevant, explanation provided
Metric tonnes CO2e<Not Applicable>
Emissions calculation methodology<Not Applicable>
Percentage of emissions calculated using data obtained from suppliers or value chain partners<Not Applicable>
Please explainThis category is not relevant because we do not have any franchises.
Investments
Evaluation statusNot relevant, explanation provided
Metric tonnes CO2e<Not Applicable>
Emissions calculation methodology<Not Applicable>
Percentage of emissions calculated using data obtained from suppliers or value chain partners<Not Applicable>
Please explainIFF does not provide capital or financing as a service and, as a result, any emissions associated with investments are already included in scope 1 and 2.
Other (upstream)
Evaluation statusNot relevant, explanation provided
Metric tonnes CO2e<Not Applicable>
Emissions calculation methodology<Not Applicable>
Percentage of emissions calculated using data obtained from suppliers or value chain partners<Not Applicable>
Please explainNo additional upstream Scope 3 emissions
Other (downstream)
Evaluation statusNot relevant, explanation provided
Metric tonnes CO2e<Not Applicable>
Emissions calculation methodology<Not Applicable>
Percentage of emissions calculated using data obtained from suppliers or value chain partners<Not Applicable>
Please explainNo additional downstream Scope 3 emissions
C6.7
(C6.7) Are carbon dioxide emissions from biogenic carbon relevant to your organization?Yes
CDP Page of 8029
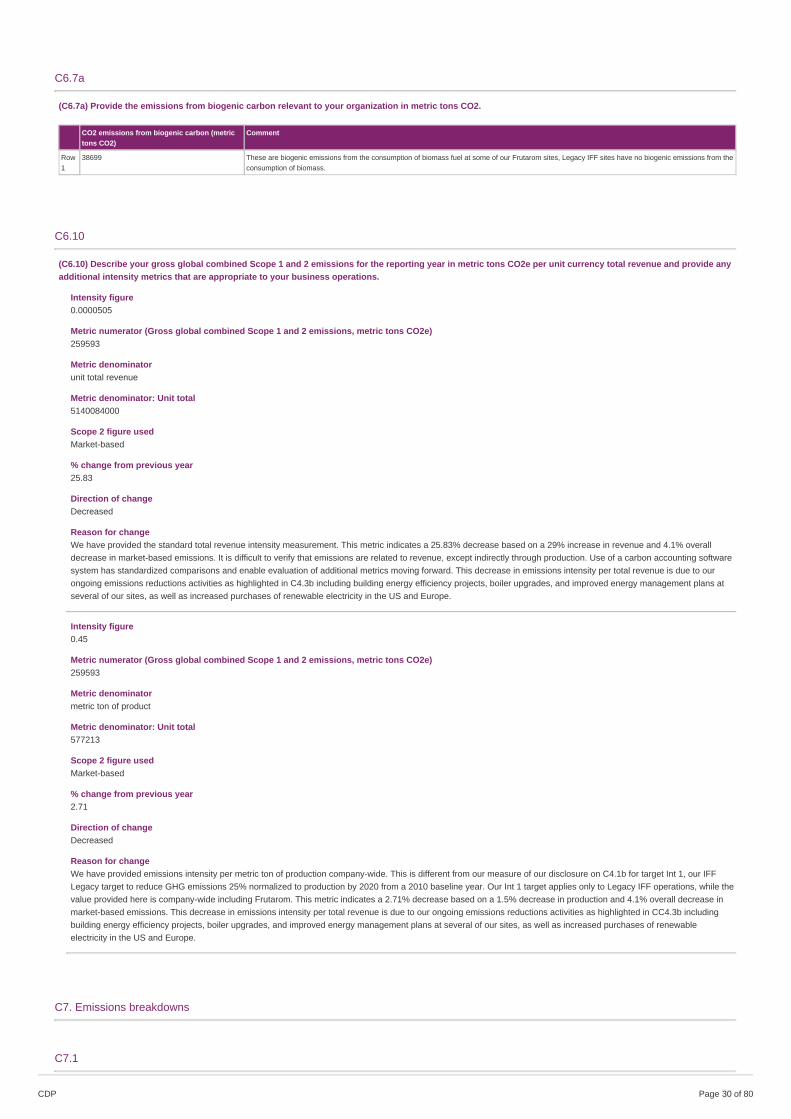
C6.7a
(C6.7a) Provide the emissions from biogenic carbon relevant to your organization in metric tons CO2.
CO2 emissions from biogenic carbon (metrictons CO2)
Comment
Row1
38699 These are biogenic emissions from the consumption of biomass fuel at some of our Frutarom sites, Legacy IFF sites have no biogenic emissions from theconsumption of biomass.
C6.10
(C6.10) Describe your gross global combined Scope 1 and 2 emissions for the reporting year in metric tons CO2e per unit currency total revenue and provide anyadditional intensity metrics that are appropriate to your business operations.
Intensity figure0.0000505
Metric numerator (Gross global combined Scope 1 and 2 emissions, metric tons CO2e)259593
Metric denominatorunit total revenue
Metric denominator: Unit total5140084000
Scope 2 figure usedMarket-based
% change from previous year25.83
Direction of changeDecreased
Reason for changeWe have provided the standard total revenue intensity measurement. This metric indicates a 25.83% decrease based on a 29% increase in revenue and 4.1% overalldecrease in market-based emissions. It is difficult to verify that emissions are related to revenue, except indirectly through production. Use of a carbon accounting softwaresystem has standardized comparisons and enable evaluation of additional metrics moving forward. This decrease in emissions intensity per total revenue is due to ourongoing emissions reductions activities as highlighted in C4.3b including building energy efficiency projects, boiler upgrades, and improved energy management plans atseveral of our sites, as well as increased purchases of renewable electricity in the US and Europe.
Intensity figure0.45
Metric numerator (Gross global combined Scope 1 and 2 emissions, metric tons CO2e)259593
Metric denominatormetric ton of product
Metric denominator: Unit total577213
Scope 2 figure usedMarket-based
% change from previous year2.71
Direction of changeDecreased
Reason for changeWe have provided emissions intensity per metric ton of production company-wide. This is different from our measure of our disclosure on C4.1b for target Int 1, our IFFLegacy target to reduce GHG emissions 25% normalized to production by 2020 from a 2010 baseline year. Our Int 1 target applies only to Legacy IFF operations, while thevalue provided here is company-wide including Frutarom. This metric indicates a 2.71% decrease based on a 1.5% decrease in production and 4.1% overall decrease inmarket-based emissions. This decrease in emissions intensity per total revenue is due to our ongoing emissions reductions activities as highlighted in CC4.3b includingbuilding energy efficiency projects, boiler upgrades, and improved energy management plans at several of our sites, as well as increased purchases of renewableelectricity in the US and Europe.
C7. Emissions breakdowns
C7.1
CDP Page of 8030
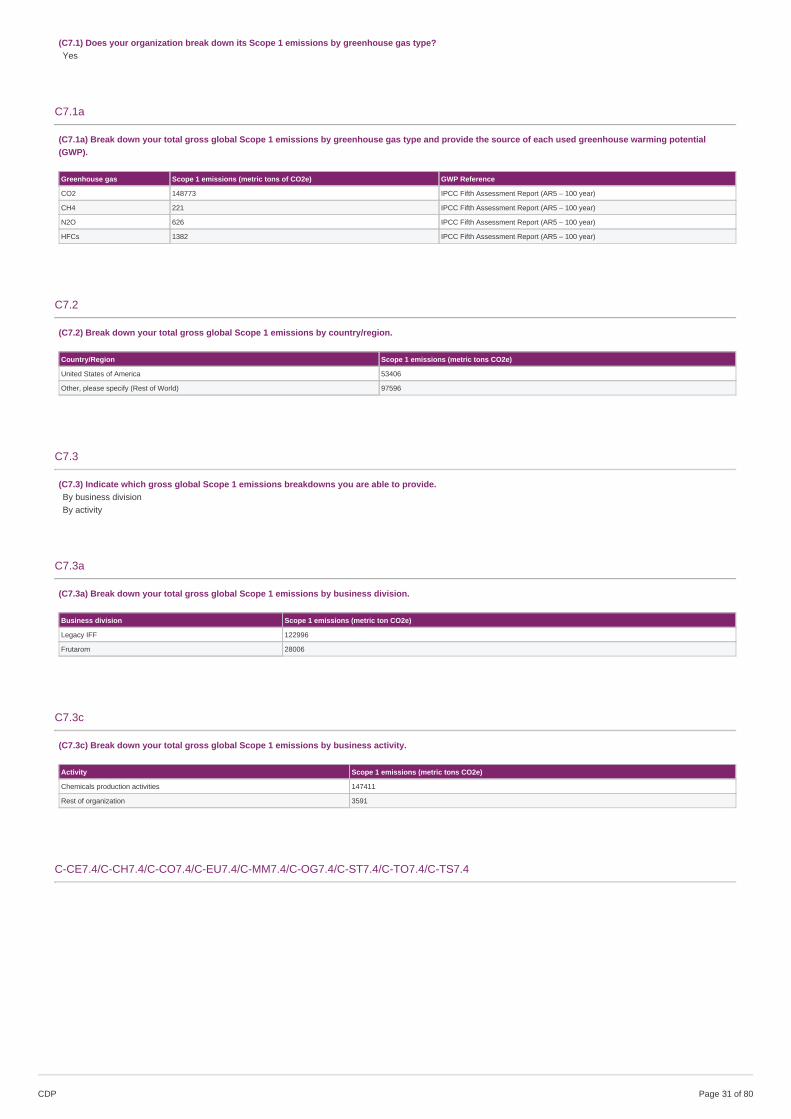
(C7.1) Does your organization break down its Scope 1 emissions by greenhouse gas type?Yes
C7.1a
(C7.1a) Break down your total gross global Scope 1 emissions by greenhouse gas type and provide the source of each used greenhouse warming potential(GWP).
Greenhouse gas Scope 1 emissions (metric tons of CO2e) GWP Reference
CO2 148773 IPCC Fifth Assessment Report (AR5 – 100 year)
CH4 221 IPCC Fifth Assessment Report (AR5 – 100 year)
N2O 626 IPCC Fifth Assessment Report (AR5 – 100 year)
HFCs 1382 IPCC Fifth Assessment Report (AR5 – 100 year)
C7.2
(C7.2) Break down your total gross global Scope 1 emissions by country/region.
Country/Region Scope 1 emissions (metric tons CO2e)
United States of America 53406
Other, please specify (Rest of World) 97596
C7.3
(C7.3) Indicate which gross global Scope 1 emissions breakdowns you are able to provide.By business divisionBy activity
C7.3a
(C7.3a) Break down your total gross global Scope 1 emissions by business division.
Business division Scope 1 emissions (metric ton CO2e)
Legacy IFF 122996
Frutarom 28006
C7.3c
(C7.3c) Break down your total gross global Scope 1 emissions by business activity.
Activity Scope 1 emissions (metric tons CO2e)
Chemicals production activities 147411
Rest of organization 3591
C-CE7.4/C-CH7.4/C-CO7.4/C-EU7.4/C-MM7.4/C-OG7.4/C-ST7.4/C-TO7.4/C-TS7.4
CDP Page of 8031
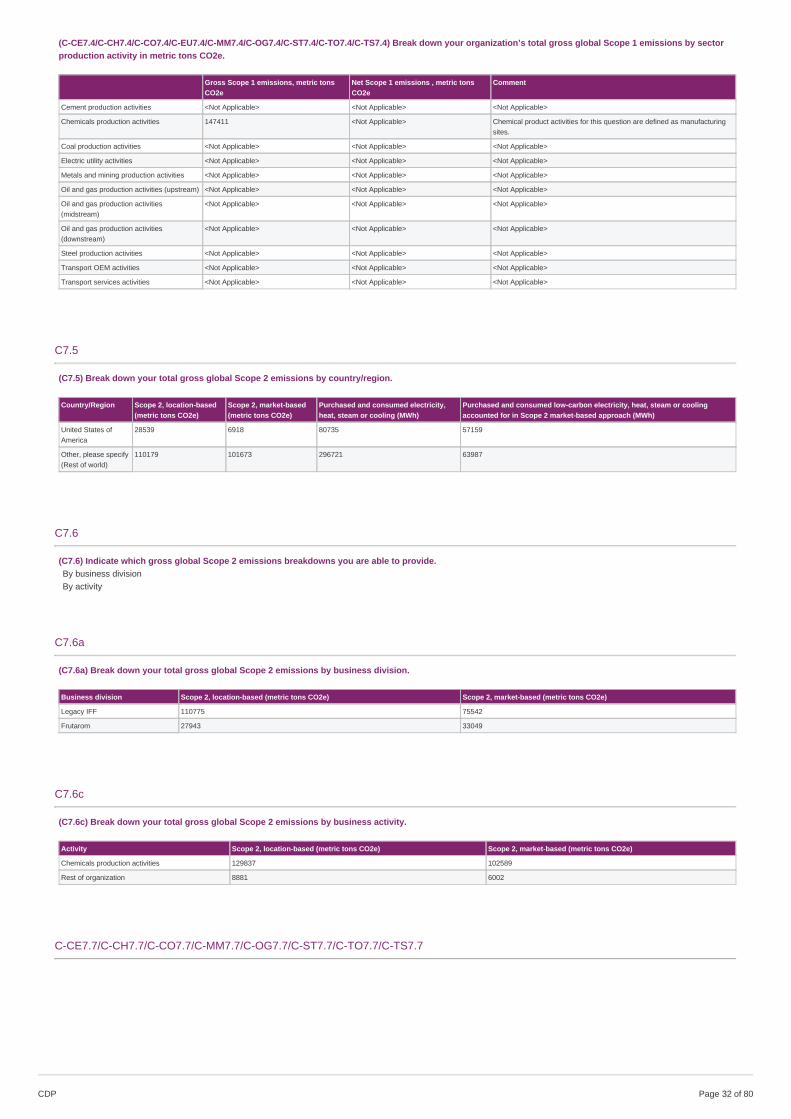
(C-CE7.4/C-CH7.4/C-CO7.4/C-EU7.4/C-MM7.4/C-OG7.4/C-ST7.4/C-TO7.4/C-TS7.4) Break down your organization’s total gross global Scope 1 emissions by sectorproduction activity in metric tons CO2e.
Gross Scope 1 emissions, metric tonsCO2e
Net Scope 1 emissions , metric tonsCO2e
Comment
Cement production activities <Not Applicable> <Not Applicable> <Not Applicable>
Chemicals production activities 147411 <Not Applicable> Chemical product activities for this question are defined as manufacturingsites.
Coal production activities <Not Applicable> <Not Applicable> <Not Applicable>
Electric utility activities <Not Applicable> <Not Applicable> <Not Applicable>
Metals and mining production activities <Not Applicable> <Not Applicable> <Not Applicable>
Oil and gas production activities (upstream) <Not Applicable> <Not Applicable> <Not Applicable>
Oil and gas production activities(midstream)
<Not Applicable> <Not Applicable> <Not Applicable>
Oil and gas production activities(downstream)
<Not Applicable> <Not Applicable> <Not Applicable>
Steel production activities <Not Applicable> <Not Applicable> <Not Applicable>
Transport OEM activities <Not Applicable> <Not Applicable> <Not Applicable>
Transport services activities <Not Applicable> <Not Applicable> <Not Applicable>
C7.5
(C7.5) Break down your total gross global Scope 2 emissions by country/region.
Country/Region Scope 2, location-based(metric tons CO2e)
Scope 2, market-based(metric tons CO2e)
Purchased and consumed electricity,heat, steam or cooling (MWh)
Purchased and consumed low-carbon electricity, heat, steam or coolingaccounted for in Scope 2 market-based approach (MWh)
United States ofAmerica
28539 6918 80735 57159
Other, please specify(Rest of world)
110179 101673 296721 63987
C7.6
(C7.6) Indicate which gross global Scope 2 emissions breakdowns you are able to provide.By business divisionBy activity
C7.6a
(C7.6a) Break down your total gross global Scope 2 emissions by business division.
Business division Scope 2, location-based (metric tons CO2e) Scope 2, market-based (metric tons CO2e)
Legacy IFF 110775 75542
Frutarom 27943 33049
C7.6c
(C7.6c) Break down your total gross global Scope 2 emissions by business activity.
Activity Scope 2, location-based (metric tons CO2e) Scope 2, market-based (metric tons CO2e)
Chemicals production activities 129837 102589
Rest of organization 8881 6002
C-CE7.7/C-CH7.7/C-CO7.7/C-MM7.7/C-OG7.7/C-ST7.7/C-TO7.7/C-TS7.7
CDP Page of 8032
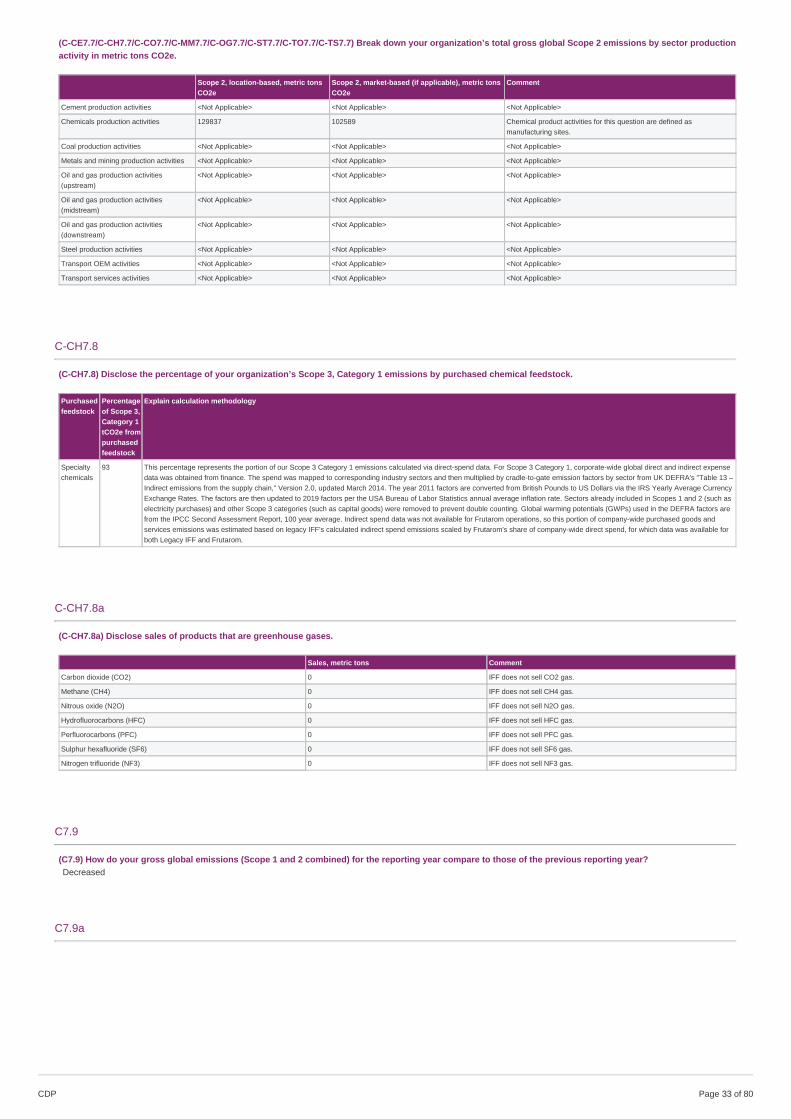
(C-CE7.7/C-CH7.7/C-CO7.7/C-MM7.7/C-OG7.7/C-ST7.7/C-TO7.7/C-TS7.7) Break down your organization’s total gross global Scope 2 emissions by sector productionactivity in metric tons CO2e.
Scope 2, location-based, metric tonsCO2e
Scope 2, market-based (if applicable), metric tonsCO2e
Comment
Cement production activities <Not Applicable> <Not Applicable> <Not Applicable>
Chemicals production activities 129837 102589 Chemical product activities for this question are defined asmanufacturing sites.
Coal production activities <Not Applicable> <Not Applicable> <Not Applicable>
Metals and mining production activities <Not Applicable> <Not Applicable> <Not Applicable>
Oil and gas production activities(upstream)
<Not Applicable> <Not Applicable> <Not Applicable>
Oil and gas production activities(midstream)
<Not Applicable> <Not Applicable> <Not Applicable>
Oil and gas production activities(downstream)
<Not Applicable> <Not Applicable> <Not Applicable>
Steel production activities <Not Applicable> <Not Applicable> <Not Applicable>
Transport OEM activities <Not Applicable> <Not Applicable> <Not Applicable>
Transport services activities <Not Applicable> <Not Applicable> <Not Applicable>
C-CH7.8
(C-CH7.8) Disclose the percentage of your organization’s Scope 3, Category 1 emissions by purchased chemical feedstock.
Purchasedfeedstock
Percentageof Scope 3,Category 1tCO2e frompurchasedfeedstock
Explain calculation methodology
Specialtychemicals
93 This percentage represents the portion of our Scope 3 Category 1 emissions calculated via direct-spend data. For Scope 3 Category 1, corporate-wide global direct and indirect expensedata was obtained from finance. The spend was mapped to corresponding industry sectors and then multiplied by cradle-to-gate emission factors by sector from UK DEFRA's "Table 13 –Indirect emissions from the supply chain," Version 2.0, updated March 2014. The year 2011 factors are converted from British Pounds to US Dollars via the IRS Yearly Average CurrencyExchange Rates. The factors are then updated to 2019 factors per the USA Bureau of Labor Statistics annual average inflation rate. Sectors already included in Scopes 1 and 2 (such aselectricity purchases) and other Scope 3 categories (such as capital goods) were removed to prevent double counting. Global warming potentials (GWPs) used in the DEFRA factors arefrom the IPCC Second Assessment Report, 100 year average. Indirect spend data was not available for Frutarom operations, so this portion of company-wide purchased goods andservices emissions was estimated based on legacy IFF's calculated indirect spend emissions scaled by Frutarom's share of company-wide direct spend, for which data was available forboth Legacy IFF and Frutarom.
C-CH7.8a
(C-CH7.8a) Disclose sales of products that are greenhouse gases.
Sales, metric tons Comment
Carbon dioxide (CO2) 0 IFF does not sell CO2 gas.
Methane (CH4) 0 IFF does not sell CH4 gas.
Nitrous oxide (N2O) 0 IFF does not sell N2O gas.
Hydrofluorocarbons (HFC) 0 IFF does not sell HFC gas.
Perfluorocarbons (PFC) 0 IFF does not sell PFC gas.
Sulphur hexafluoride (SF6) 0 IFF does not sell SF6 gas.
Nitrogen trifluoride (NF3) 0 IFF does not sell NF3 gas.
C7.9
(C7.9) How do your gross global emissions (Scope 1 and 2 combined) for the reporting year compare to those of the previous reporting year?Decreased
C7.9a
CDP Page of 8033
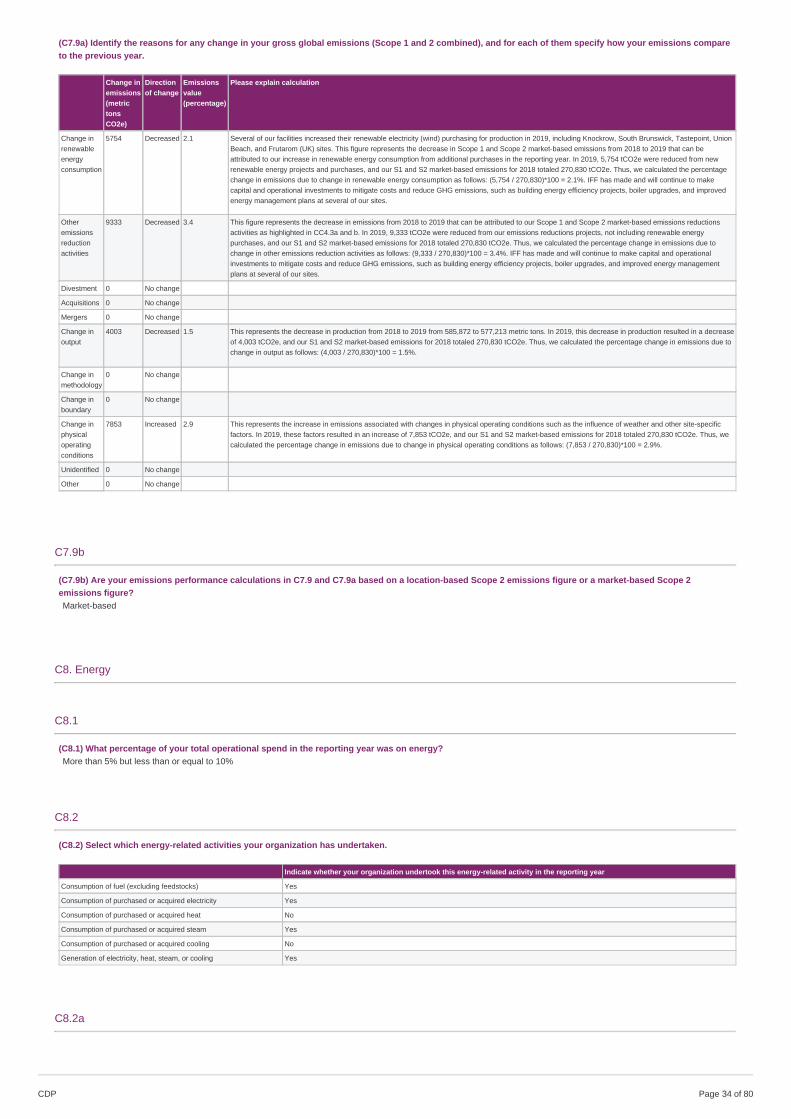
(C7.9a) Identify the reasons for any change in your gross global emissions (Scope 1 and 2 combined), and for each of them specify how your emissions compareto the previous year.
Change inemissions(metrictonsCO2e)
Directionof change
Emissionsvalue(percentage)
Please explain calculation
Change inrenewableenergyconsumption
5754 Decreased 2.1 Several of our facilities increased their renewable electricity (wind) purchasing for production in 2019, including Knockrow, South Brunswick, Tastepoint, UnionBeach, and Frutarom (UK) sites. This figure represents the decrease in Scope 1 and Scope 2 market-based emissions from 2018 to 2019 that can beattributed to our increase in renewable energy consumption from additional purchases in the reporting year. In 2019, 5,754 tCO2e were reduced from newrenewable energy projects and purchases, and our S1 and S2 market-based emissions for 2018 totaled 270,830 tCO2e. Thus, we calculated the percentagechange in emissions due to change in renewable energy consumption as follows: (5,754 / 270,830)*100 = 2.1%. IFF has made and will continue to makecapital and operational investments to mitigate costs and reduce GHG emissions, such as building energy efficiency projects, boiler upgrades, and improvedenergy management plans at several of our sites.
Otheremissionsreductionactivities
9333 Decreased 3.4 This figure represents the decrease in emissions from 2018 to 2019 that can be attributed to our Scope 1 and Scope 2 market-based emissions reductionsactivities as highlighted in CC4.3a and b. In 2019, 9,333 tCO2e were reduced from our emissions reductions projects, not including renewable energypurchases, and our S1 and S2 market-based emissions for 2018 totaled 270,830 tCO2e. Thus, we calculated the percentage change in emissions due tochange in other emissions reduction activities as follows: (9,333 / 270,830)*100 = 3.4%. IFF has made and will continue to make capital and operationalinvestments to mitigate costs and reduce GHG emissions, such as building energy efficiency projects, boiler upgrades, and improved energy managementplans at several of our sites.
Divestment 0 No change
Acquisitions 0 No change
Mergers 0 No change
Change inoutput
4003 Decreased 1.5 This represents the decrease in production from 2018 to 2019 from 585,872 to 577,213 metric tons. In 2019, this decrease in production resulted in a decreaseof 4,003 tCO2e, and our S1 and S2 market-based emissions for 2018 totaled 270,830 tCO2e. Thus, we calculated the percentage change in emissions due tochange in output as follows: (4,003 / 270,830)*100 = 1.5%.
Change inmethodology
0 No change
Change inboundary
0 No change
Change inphysicaloperatingconditions
7853 Increased 2.9 This represents the increase in emissions associated with changes in physical operating conditions such as the influence of weather and other site-specificfactors. In 2019, these factors resulted in an increase of 7,853 tCO2e, and our S1 and S2 market-based emissions for 2018 totaled 270,830 tCO2e. Thus, wecalculated the percentage change in emissions due to change in physical operating conditions as follows: (7,853 / 270,830)*100 = 2.9%.
Unidentified 0 No change
Other 0 No change
C7.9b
(C7.9b) Are your emissions performance calculations in C7.9 and C7.9a based on a location-based Scope 2 emissions figure or a market-based Scope 2emissions figure?Market-based
C8. Energy
C8.1
(C8.1) What percentage of your total operational spend in the reporting year was on energy?More than 5% but less than or equal to 10%
C8.2
(C8.2) Select which energy-related activities your organization has undertaken.
Indicate whether your organization undertook this energy-related activity in the reporting year
Consumption of fuel (excluding feedstocks) Yes
Consumption of purchased or acquired electricity Yes
Consumption of purchased or acquired heat No
Consumption of purchased or acquired steam Yes
Consumption of purchased or acquired cooling No
Generation of electricity, heat, steam, or cooling Yes
C8.2a
CDP Page of 8034
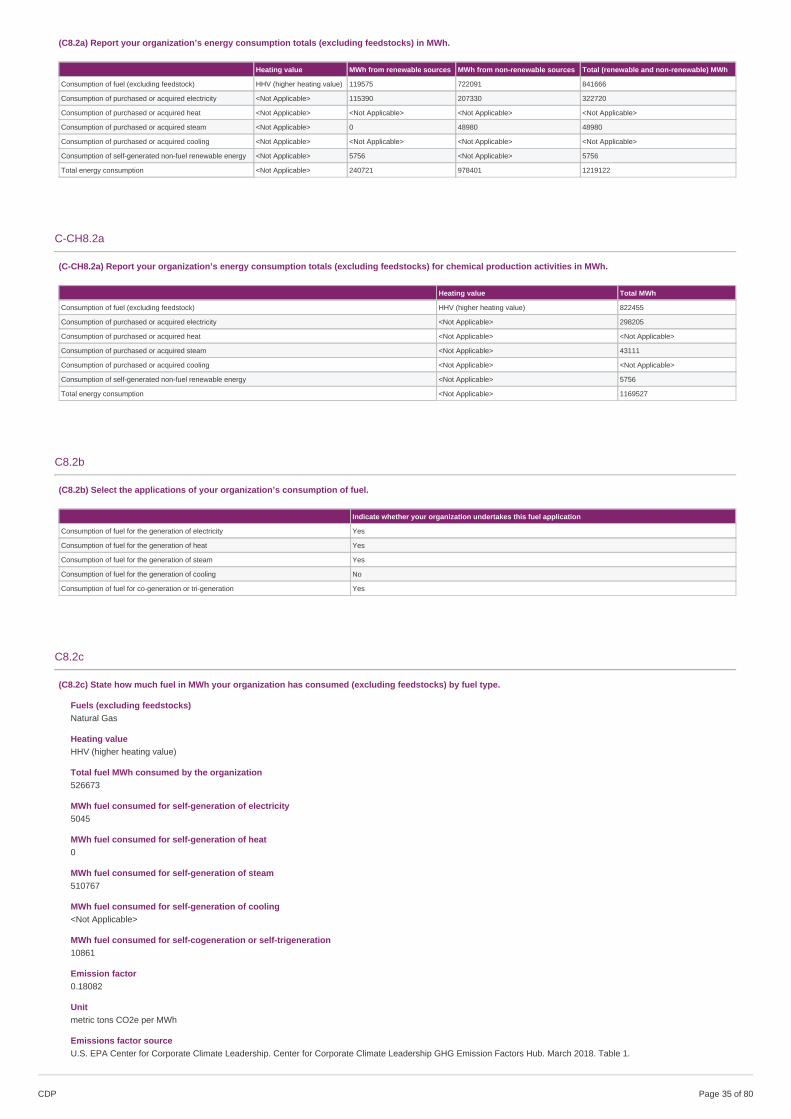
(C8.2a) Report your organization’s energy consumption totals (excluding feedstocks) in MWh.
Heating value MWh from renewable sources MWh from non-renewable sources Total (renewable and non-renewable) MWh
Consumption of fuel (excluding feedstock) HHV (higher heating value) 119575 722091 841666
Consumption of purchased or acquired electricity <Not Applicable> 115390 207330 322720
Consumption of purchased or acquired heat <Not Applicable> <Not Applicable> <Not Applicable> <Not Applicable>
Consumption of purchased or acquired steam <Not Applicable> 0 48980 48980
Consumption of purchased or acquired cooling <Not Applicable> <Not Applicable> <Not Applicable> <Not Applicable>
Consumption of self-generated non-fuel renewable energy <Not Applicable> 5756 <Not Applicable> 5756
Total energy consumption <Not Applicable> 240721 978401 1219122
C-CH8.2a
(C-CH8.2a) Report your organization’s energy consumption totals (excluding feedstocks) for chemical production activities in MWh.
Heating value Total MWh
Consumption of fuel (excluding feedstock) HHV (higher heating value) 822455
Consumption of purchased or acquired electricity <Not Applicable> 298205
Consumption of purchased or acquired heat <Not Applicable> <Not Applicable>
Consumption of purchased or acquired steam <Not Applicable> 43111
Consumption of purchased or acquired cooling <Not Applicable> <Not Applicable>
Consumption of self-generated non-fuel renewable energy <Not Applicable> 5756
Total energy consumption <Not Applicable> 1169527
C8.2b
(C8.2b) Select the applications of your organization’s consumption of fuel.
Indicate whether your organization undertakes this fuel application
Consumption of fuel for the generation of electricity Yes
Consumption of fuel for the generation of heat Yes
Consumption of fuel for the generation of steam Yes
Consumption of fuel for the generation of cooling No
Consumption of fuel for co-generation or tri-generation Yes
C8.2c
(C8.2c) State how much fuel in MWh your organization has consumed (excluding feedstocks) by fuel type.
Fuels (excluding feedstocks)Natural Gas
Heating valueHHV (higher heating value)
Total fuel MWh consumed by the organization526673
MWh fuel consumed for self-generation of electricity5045
MWh fuel consumed for self-generation of heat0
MWh fuel consumed for self-generation of steam510767
MWh fuel consumed for self-generation of cooling<Not Applicable>
MWh fuel consumed for self-cogeneration or self-trigeneration10861
Emission factor0.18082
Unitmetric tons CO2e per MWh
Emissions factor sourceU.S. EPA Center for Corporate Climate Leadership. Center for Corporate Climate Leadership GHG Emission Factors Hub. March 2018. Table 1.
CDP Page of 8035
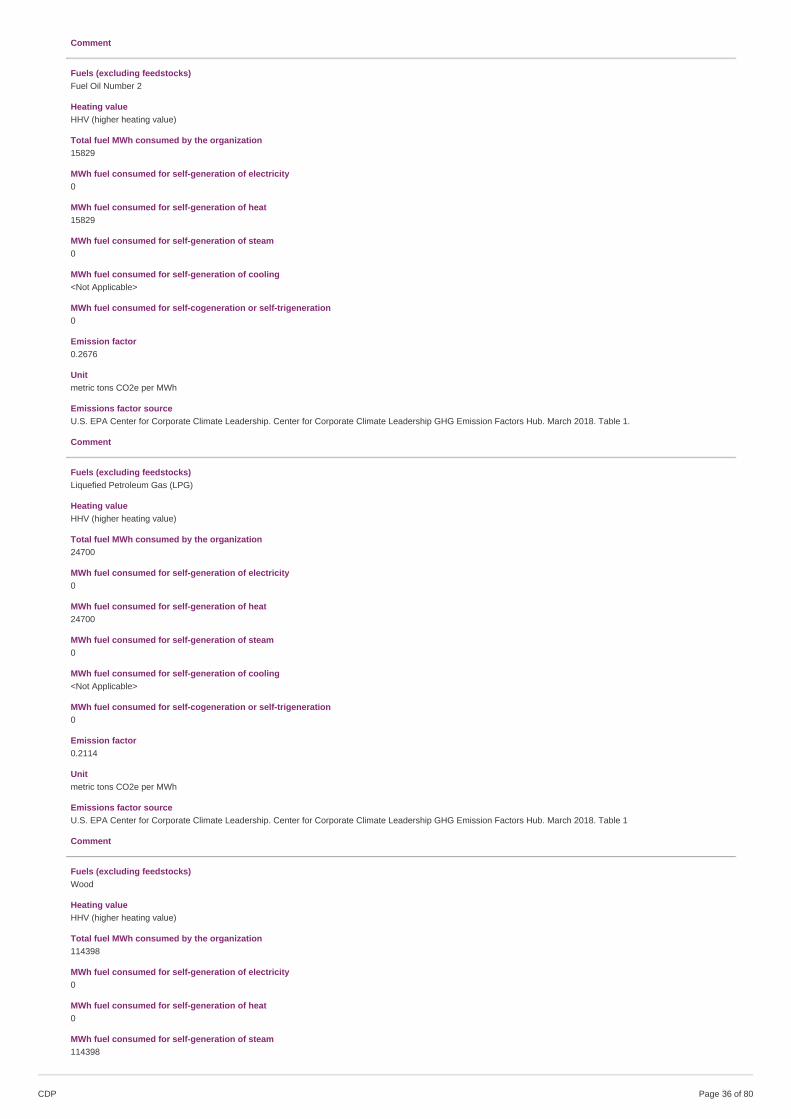
Comment
Fuels (excluding feedstocks)Fuel Oil Number 2
Heating valueHHV (higher heating value)
Total fuel MWh consumed by the organization15829
MWh fuel consumed for self-generation of electricity0
MWh fuel consumed for self-generation of heat15829
MWh fuel consumed for self-generation of steam0
MWh fuel consumed for self-generation of cooling<Not Applicable>
MWh fuel consumed for self-cogeneration or self-trigeneration0
Emission factor0.2676
Unitmetric tons CO2e per MWh
Emissions factor sourceU.S. EPA Center for Corporate Climate Leadership. Center for Corporate Climate Leadership GHG Emission Factors Hub. March 2018. Table 1.
Comment
Fuels (excluding feedstocks)Liquefied Petroleum Gas (LPG)
Heating valueHHV (higher heating value)
Total fuel MWh consumed by the organization24700
MWh fuel consumed for self-generation of electricity0
MWh fuel consumed for self-generation of heat24700
MWh fuel consumed for self-generation of steam0
MWh fuel consumed for self-generation of cooling<Not Applicable>
MWh fuel consumed for self-cogeneration or self-trigeneration0
Emission factor0.2114
Unitmetric tons CO2e per MWh
Emissions factor sourceU.S. EPA Center for Corporate Climate Leadership. Center for Corporate Climate Leadership GHG Emission Factors Hub. March 2018. Table 1
Comment
Fuels (excluding feedstocks)Wood
Heating valueHHV (higher heating value)
Total fuel MWh consumed by the organization114398
MWh fuel consumed for self-generation of electricity0
MWh fuel consumed for self-generation of heat0
MWh fuel consumed for self-generation of steam114398
CDP Page of 8036
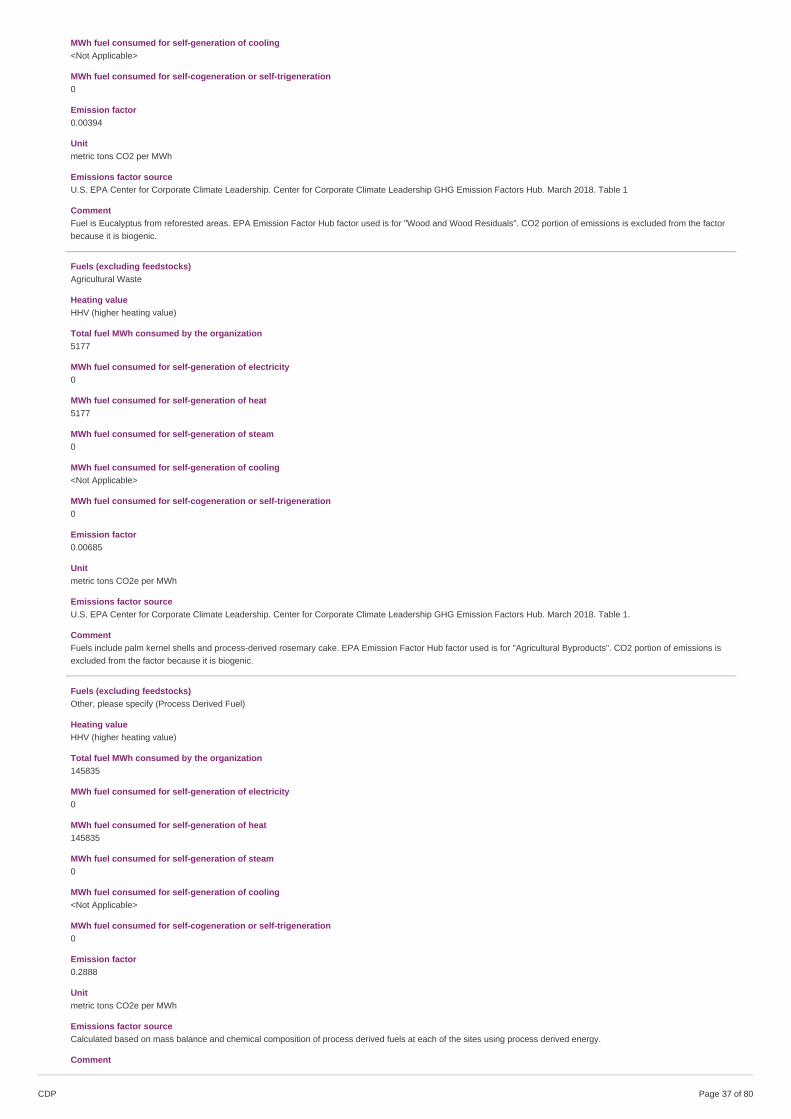
MWh fuel consumed for self-generation of cooling<Not Applicable>
MWh fuel consumed for self-cogeneration or self-trigeneration0
Emission factor0.00394
Unitmetric tons CO2 per MWh
Emissions factor sourceU.S. EPA Center for Corporate Climate Leadership. Center for Corporate Climate Leadership GHG Emission Factors Hub. March 2018. Table 1
CommentFuel is Eucalyptus from reforested areas. EPA Emission Factor Hub factor used is for "Wood and Wood Residuals". CO2 portion of emissions is excluded from the factorbecause it is biogenic.
Fuels (excluding feedstocks)Agricultural Waste
Heating valueHHV (higher heating value)
Total fuel MWh consumed by the organization5177
MWh fuel consumed for self-generation of electricity0
MWh fuel consumed for self-generation of heat5177
MWh fuel consumed for self-generation of steam0
MWh fuel consumed for self-generation of cooling<Not Applicable>
MWh fuel consumed for self-cogeneration or self-trigeneration0
Emission factor0.00685
Unitmetric tons CO2e per MWh
Emissions factor sourceU.S. EPA Center for Corporate Climate Leadership. Center for Corporate Climate Leadership GHG Emission Factors Hub. March 2018. Table 1.
CommentFuels include palm kernel shells and process-derived rosemary cake. EPA Emission Factor Hub factor used is for "Agricultural Byproducts". CO2 portion of emissions isexcluded from the factor because it is biogenic.
Fuels (excluding feedstocks)Other, please specify (Process Derived Fuel)
Heating valueHHV (higher heating value)
Total fuel MWh consumed by the organization145835
MWh fuel consumed for self-generation of electricity0
MWh fuel consumed for self-generation of heat145835
MWh fuel consumed for self-generation of steam0
MWh fuel consumed for self-generation of cooling<Not Applicable>
MWh fuel consumed for self-cogeneration or self-trigeneration0
Emission factor0.2888
Unitmetric tons CO2e per MWh
Emissions factor sourceCalculated based on mass balance and chemical composition of process derived fuels at each of the sites using process derived energy.
Comment
CDP Page of 8037
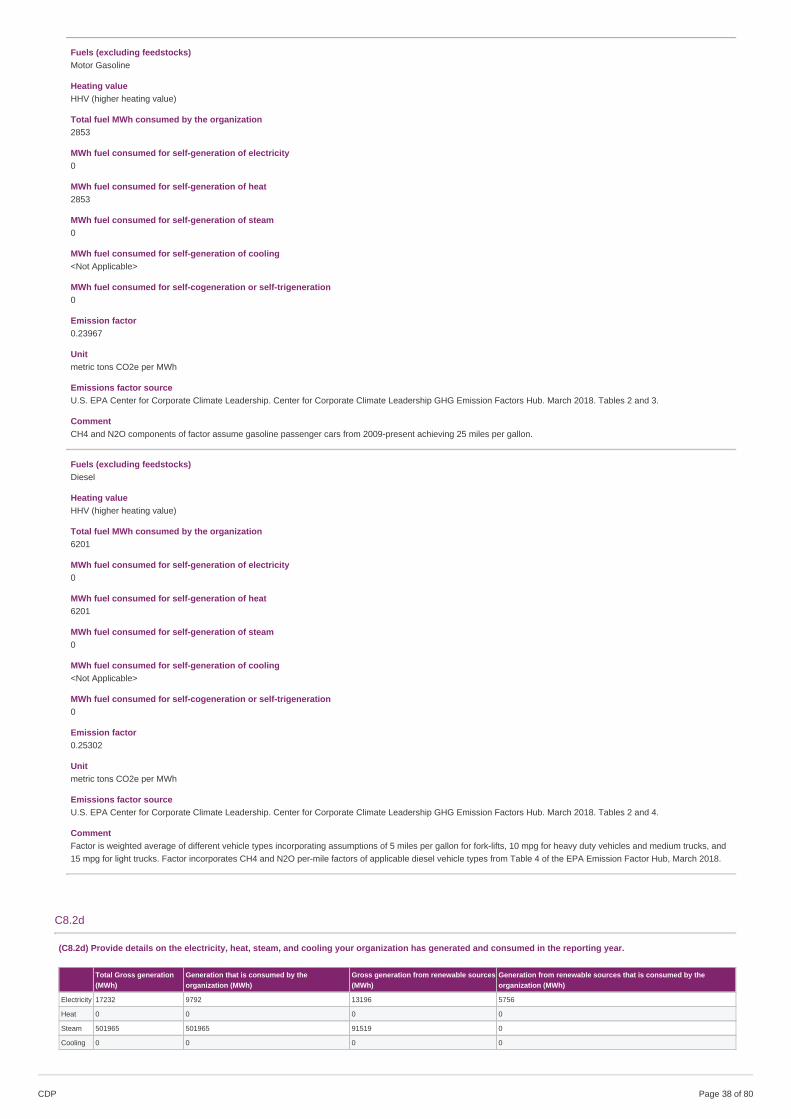
Fuels (excluding feedstocks)Motor Gasoline
Heating valueHHV (higher heating value)
Total fuel MWh consumed by the organization2853
MWh fuel consumed for self-generation of electricity0
MWh fuel consumed for self-generation of heat2853
MWh fuel consumed for self-generation of steam0
MWh fuel consumed for self-generation of cooling<Not Applicable>
MWh fuel consumed for self-cogeneration or self-trigeneration0
Emission factor0.23967
Unitmetric tons CO2e per MWh
Emissions factor sourceU.S. EPA Center for Corporate Climate Leadership. Center for Corporate Climate Leadership GHG Emission Factors Hub. March 2018. Tables 2 and 3.
CommentCH4 and N2O components of factor assume gasoline passenger cars from 2009-present achieving 25 miles per gallon.
Fuels (excluding feedstocks)Diesel
Heating valueHHV (higher heating value)
Total fuel MWh consumed by the organization6201
MWh fuel consumed for self-generation of electricity0
MWh fuel consumed for self-generation of heat6201
MWh fuel consumed for self-generation of steam0
MWh fuel consumed for self-generation of cooling<Not Applicable>
MWh fuel consumed for self-cogeneration or self-trigeneration0
Emission factor0.25302
Unitmetric tons CO2e per MWh
Emissions factor sourceU.S. EPA Center for Corporate Climate Leadership. Center for Corporate Climate Leadership GHG Emission Factors Hub. March 2018. Tables 2 and 4.
CommentFactor is weighted average of different vehicle types incorporating assumptions of 5 miles per gallon for fork-lifts, 10 mpg for heavy duty vehicles and medium trucks, and15 mpg for light trucks. Factor incorporates CH4 and N2O per-mile factors of applicable diesel vehicle types from Table 4 of the EPA Emission Factor Hub, March 2018.
C8.2d
(C8.2d) Provide details on the electricity, heat, steam, and cooling your organization has generated and consumed in the reporting year.
Total Gross generation(MWh)
Generation that is consumed by theorganization (MWh)
Gross generation from renewable sources(MWh)
Generation from renewable sources that is consumed by theorganization (MWh)
Electricity 17232 9792 13196 5756
Heat 0 0 0 0
Steam 501965 501965 91519 0
Cooling 0 0 0 0
CDP Page of 8038
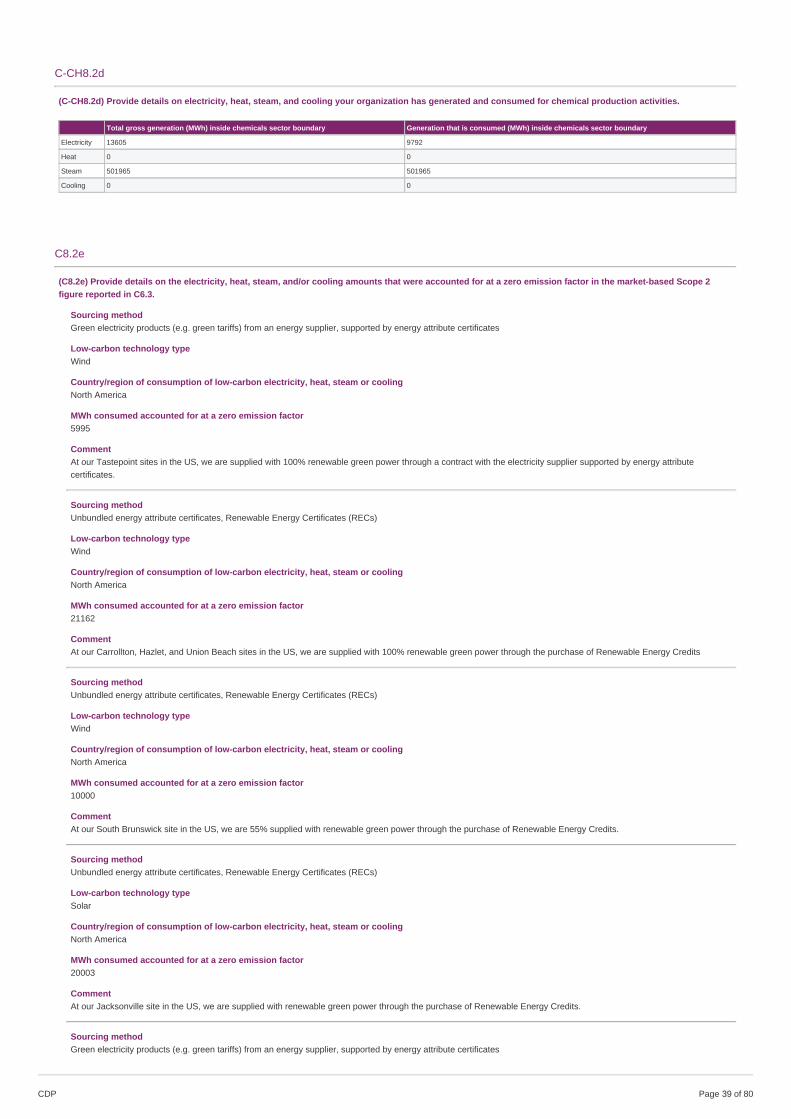
C-CH8.2d
(C-CH8.2d) Provide details on electricity, heat, steam, and cooling your organization has generated and consumed for chemical production activities.
Total gross generation (MWh) inside chemicals sector boundary Generation that is consumed (MWh) inside chemicals sector boundary
Electricity 13605 9792
Heat 0 0
Steam 501965 501965
Cooling 0 0
C8.2e
(C8.2e) Provide details on the electricity, heat, steam, and/or cooling amounts that were accounted for at a zero emission factor in the market-based Scope 2figure reported in C6.3.
Sourcing methodGreen electricity products (e.g. green tariffs) from an energy supplier, supported by energy attribute certificates
Low-carbon technology typeWind
Country/region of consumption of low-carbon electricity, heat, steam or coolingNorth America
MWh consumed accounted for at a zero emission factor5995
CommentAt our Tastepoint sites in the US, we are supplied with 100% renewable green power through a contract with the electricity supplier supported by energy attributecertificates.
Sourcing methodUnbundled energy attribute certificates, Renewable Energy Certificates (RECs)
Low-carbon technology typeWind
Country/region of consumption of low-carbon electricity, heat, steam or coolingNorth America
MWh consumed accounted for at a zero emission factor21162
CommentAt our Carrollton, Hazlet, and Union Beach sites in the US, we are supplied with 100% renewable green power through the purchase of Renewable Energy Credits
Sourcing methodUnbundled energy attribute certificates, Renewable Energy Certificates (RECs)
Low-carbon technology typeWind
Country/region of consumption of low-carbon electricity, heat, steam or coolingNorth America
MWh consumed accounted for at a zero emission factor10000
CommentAt our South Brunswick site in the US, we are 55% supplied with renewable green power through the purchase of Renewable Energy Credits.
Sourcing methodUnbundled energy attribute certificates, Renewable Energy Certificates (RECs)
Low-carbon technology typeSolar
Country/region of consumption of low-carbon electricity, heat, steam or coolingNorth America
MWh consumed accounted for at a zero emission factor20003
CommentAt our Jacksonville site in the US, we are supplied with renewable green power through the purchase of Renewable Energy Credits.
Sourcing methodGreen electricity products (e.g. green tariffs) from an energy supplier, supported by energy attribute certificates
CDP Page of 8039
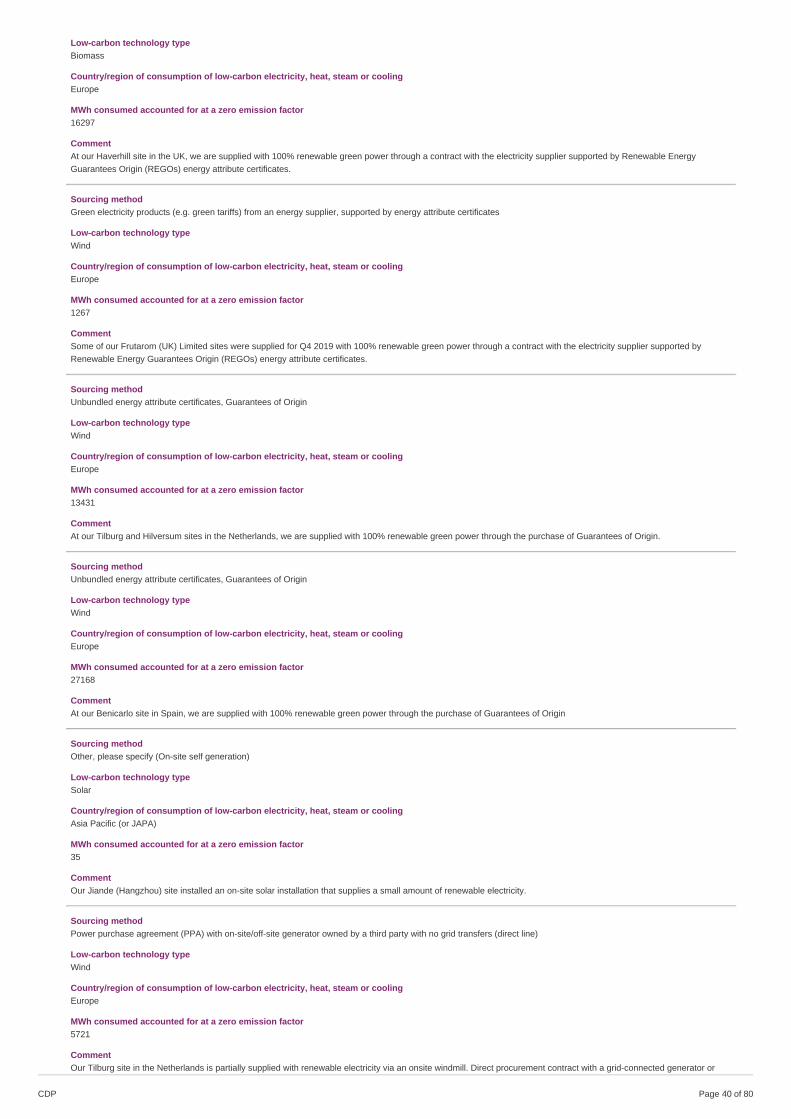
Low-carbon technology typeBiomass
Country/region of consumption of low-carbon electricity, heat, steam or coolingEurope
MWh consumed accounted for at a zero emission factor16297
CommentAt our Haverhill site in the UK, we are supplied with 100% renewable green power through a contract with the electricity supplier supported by Renewable EnergyGuarantees Origin (REGOs) energy attribute certificates.
Sourcing methodGreen electricity products (e.g. green tariffs) from an energy supplier, supported by energy attribute certificates
Low-carbon technology typeWind
Country/region of consumption of low-carbon electricity, heat, steam or coolingEurope
MWh consumed accounted for at a zero emission factor1267
CommentSome of our Frutarom (UK) Limited sites were supplied for Q4 2019 with 100% renewable green power through a contract with the electricity supplier supported byRenewable Energy Guarantees Origin (REGOs) energy attribute certificates.
Sourcing methodUnbundled energy attribute certificates, Guarantees of Origin
Low-carbon technology typeWind
Country/region of consumption of low-carbon electricity, heat, steam or coolingEurope
MWh consumed accounted for at a zero emission factor13431
CommentAt our Tilburg and Hilversum sites in the Netherlands, we are supplied with 100% renewable green power through the purchase of Guarantees of Origin.
Sourcing methodUnbundled energy attribute certificates, Guarantees of Origin
Low-carbon technology typeWind
Country/region of consumption of low-carbon electricity, heat, steam or coolingEurope
MWh consumed accounted for at a zero emission factor27168
CommentAt our Benicarlo site in Spain, we are supplied with 100% renewable green power through the purchase of Guarantees of Origin
Sourcing methodOther, please specify (On-site self generation)
Low-carbon technology typeSolar
Country/region of consumption of low-carbon electricity, heat, steam or coolingAsia Pacific (or JAPA)
MWh consumed accounted for at a zero emission factor35
CommentOur Jiande (Hangzhou) site installed an on-site solar installation that supplies a small amount of renewable electricity.
Sourcing methodPower purchase agreement (PPA) with on-site/off-site generator owned by a third party with no grid transfers (direct line)
Low-carbon technology typeWind
Country/region of consumption of low-carbon electricity, heat, steam or coolingEurope
MWh consumed accounted for at a zero emission factor5721
CommentOur Tilburg site in the Netherlands is partially supplied with renewable electricity via an onsite windmill. Direct procurement contract with a grid-connected generator or
CDP Page of 8040
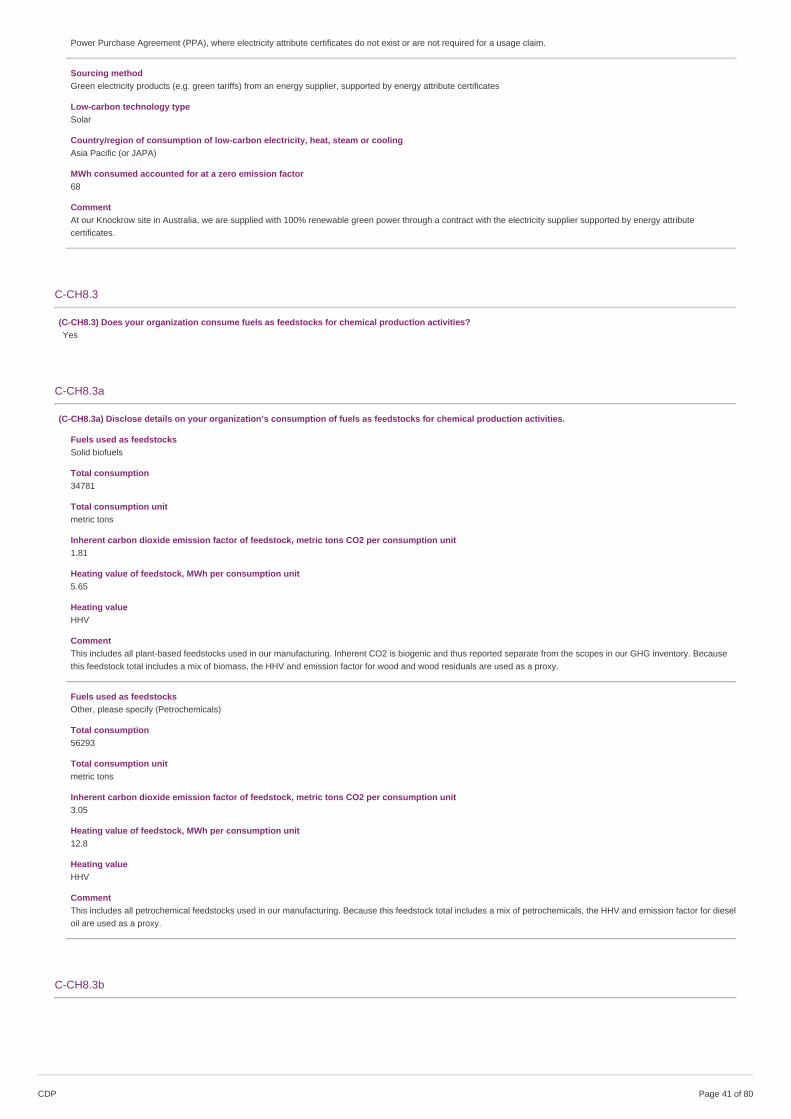
Power Purchase Agreement (PPA), where electricity attribute certificates do not exist or are not required for a usage claim.
Sourcing methodGreen electricity products (e.g. green tariffs) from an energy supplier, supported by energy attribute certificates
Low-carbon technology typeSolar
Country/region of consumption of low-carbon electricity, heat, steam or coolingAsia Pacific (or JAPA)
MWh consumed accounted for at a zero emission factor68
CommentAt our Knockrow site in Australia, we are supplied with 100% renewable green power through a contract with the electricity supplier supported by energy attributecertificates.
C-CH8.3
(C-CH8.3) Does your organization consume fuels as feedstocks for chemical production activities?Yes
C-CH8.3a
(C-CH8.3a) Disclose details on your organization’s consumption of fuels as feedstocks for chemical production activities.
Fuels used as feedstocksSolid biofuels
Total consumption34781
Total consumption unitmetric tons
Inherent carbon dioxide emission factor of feedstock, metric tons CO2 per consumption unit1.81
Heating value of feedstock, MWh per consumption unit5.65
Heating valueHHV
CommentThis includes all plant-based feedstocks used in our manufacturing. Inherent CO2 is biogenic and thus reported separate from the scopes in our GHG inventory. Becausethis feedstock total includes a mix of biomass, the HHV and emission factor for wood and wood residuals are used as a proxy.
Fuels used as feedstocksOther, please specify (Petrochemicals)
Total consumption56293
Total consumption unitmetric tons
Inherent carbon dioxide emission factor of feedstock, metric tons CO2 per consumption unit3.05
Heating value of feedstock, MWh per consumption unit12.8
Heating valueHHV
CommentThis includes all petrochemical feedstocks used in our manufacturing. Because this feedstock total includes a mix of petrochemicals, the HHV and emission factor for dieseloil are used as a proxy.
C-CH8.3b
CDP Page of 8041
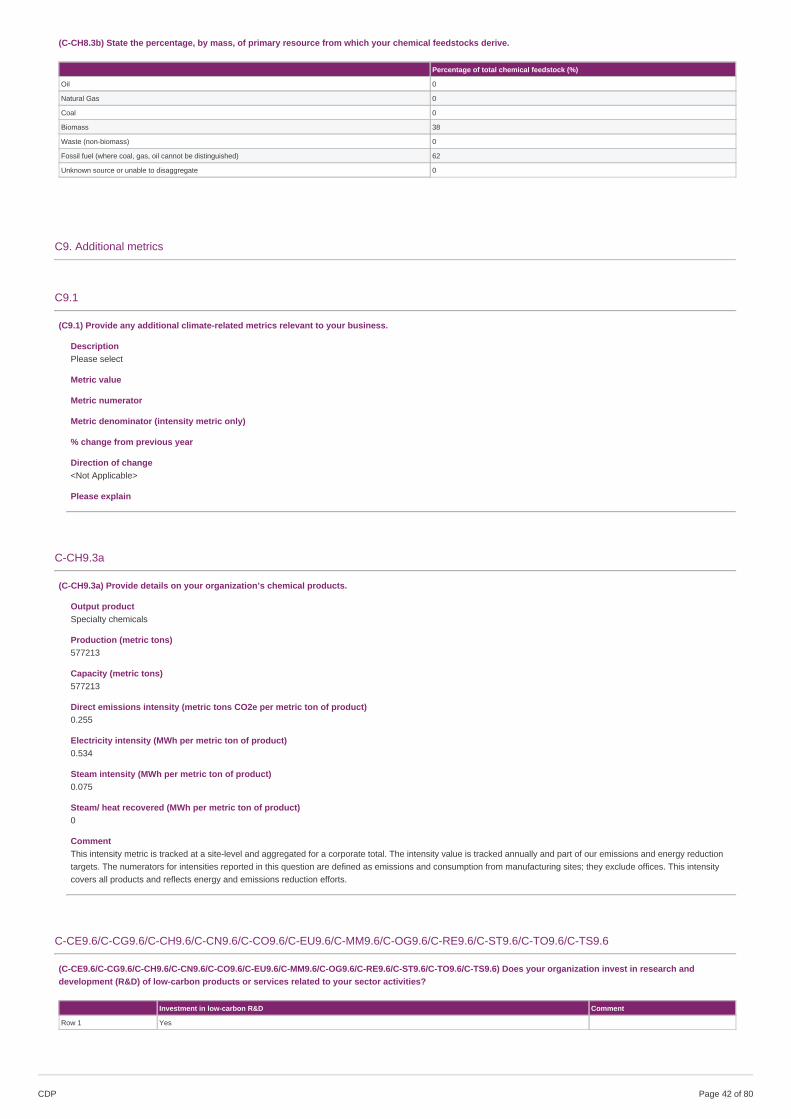
(C-CH8.3b) State the percentage, by mass, of primary resource from which your chemical feedstocks derive.
Percentage of total chemical feedstock (%)
Oil 0
Natural Gas 0
Coal 0
Biomass 38
Waste (non-biomass) 0
Fossil fuel (where coal, gas, oil cannot be distinguished) 62
Unknown source or unable to disaggregate 0
C9. Additional metrics
C9.1
(C9.1) Provide any additional climate-related metrics relevant to your business.
DescriptionPlease select
Metric value
Metric numerator
Metric denominator (intensity metric only)
% change from previous year
Direction of change<Not Applicable>
Please explain
C-CH9.3a
(C-CH9.3a) Provide details on your organization’s chemical products.
Output productSpecialty chemicals
Production (metric tons)577213
Capacity (metric tons)577213
Direct emissions intensity (metric tons CO2e per metric ton of product)0.255
Electricity intensity (MWh per metric ton of product)0.534
Steam intensity (MWh per metric ton of product)0.075
Steam/ heat recovered (MWh per metric ton of product)0
CommentThis intensity metric is tracked at a site-level and aggregated for a corporate total. The intensity value is tracked annually and part of our emissions and energy reductiontargets. The numerators for intensities reported in this question are defined as emissions and consumption from manufacturing sites; they exclude offices. This intensitycovers all products and reflects energy and emissions reduction efforts.
C-CE9.6/C-CG9.6/C-CH9.6/C-CN9.6/C-CO9.6/C-EU9.6/C-MM9.6/C-OG9.6/C-RE9.6/C-ST9.6/C-TO9.6/C-TS9.6
(C-CE9.6/C-CG9.6/C-CH9.6/C-CN9.6/C-CO9.6/C-EU9.6/C-MM9.6/C-OG9.6/C-RE9.6/C-ST9.6/C-TO9.6/C-TS9.6) Does your organization invest in research anddevelopment (R&D) of low-carbon products or services related to your sector activities?
Investment in low-carbon R&D Comment
Row 1 Yes
CDP Page of 8042
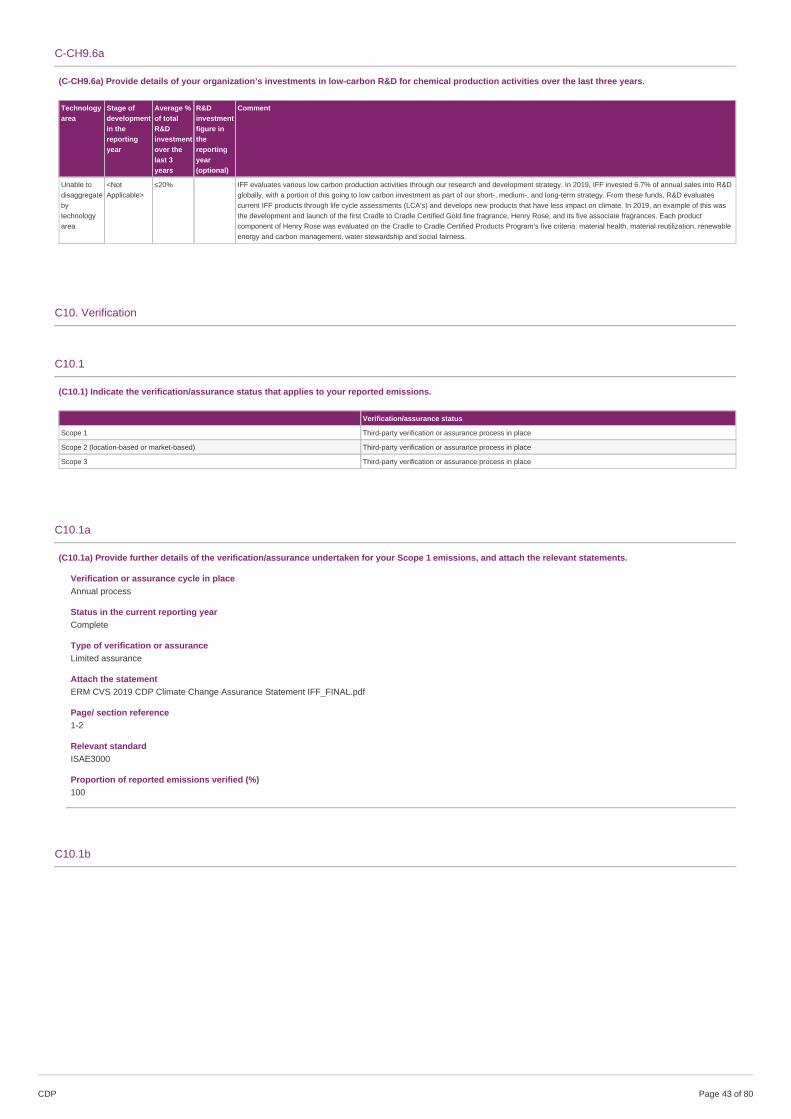
C-CH9.6a
(C-CH9.6a) Provide details of your organization’s investments in low-carbon R&D for chemical production activities over the last three years.
Technologyarea
Stage ofdevelopmentin thereportingyear
Average %of totalR&Dinvestmentover thelast 3years
R&Dinvestmentfigure inthereportingyear(optional)
Comment
Unable todisaggregatebytechnologyarea
<NotApplicable>
≤20% IFF evaluates various low carbon production activities through our research and development strategy. In 2019, IFF invested 6.7% of annual sales into R&Dglobally, with a portion of this going to low carbon investment as part of our short-, medium-, and long-term strategy. From these funds, R&D evaluatescurrent IFF products through life cycle assessments (LCA’s) and develops new products that have less impact on climate. In 2019, an example of this wasthe development and launch of the first Cradle to Cradle Certified Gold fine fragrance, Henry Rose, and its five associate fragrances. Each productcomponent of Henry Rose was evaluated on the Cradle to Cradle Certified Products Program’s five criteria: material health, material reutilization, renewableenergy and carbon management, water stewardship and social fairness.
C10. Verification
C10.1
(C10.1) Indicate the verification/assurance status that applies to your reported emissions.
Verification/assurance status
Scope 1 Third-party verification or assurance process in place
Scope 2 (location-based or market-based) Third-party verification or assurance process in place
Scope 3 Third-party verification or assurance process in place
C10.1a
(C10.1a) Provide further details of the verification/assurance undertaken for your Scope 1 emissions, and attach the relevant statements.
Verification or assurance cycle in placeAnnual process
Status in the current reporting yearComplete
Type of verification or assuranceLimited assurance
Attach the statementERM CVS 2019 CDP Climate Change Assurance Statement IFF_FINAL.pdf
Page/ section reference1-2
Relevant standardISAE3000
Proportion of reported emissions verified (%)100
C10.1b
CDP Page of 8043
(C10.1b) Provide further details of the verification/assurance undertaken for your Scope 2 emissions and attach the relevant statements.
Scope 2 approachScope 2 location-based
Verification or assurance cycle in placeAnnual process
Status in the current reporting yearComplete
Type of verification or assuranceLimited assurance
Attach the statementERM CVS 2019 CDP Climate Change Assurance Statement IFF_FINAL.pdf
Page/ section reference1-2
Relevant standardISAE3000
Proportion of reported emissions verified (%)100
Scope 2 approachScope 2 market-based
Verification or assurance cycle in placeAnnual process
Status in the current reporting yearComplete
Type of verification or assuranceLimited assurance
Attach the statementERM CVS 2019 CDP Climate Change Assurance Statement IFF_FINAL.pdf
Page/ section reference1-2
Relevant standardISAE3000
Proportion of reported emissions verified (%)100
C10.1c
CDP Page of 8044
(C10.1c) Provide further details of the verification/assurance undertaken for your Scope 3 emissions and attach the relevant statements.
Scope 3 categoryScope 3: Fuel and energy-related activities (not included in Scopes 1 or 2)
Verification or assurance cycle in placeAnnual process
Status in the current reporting yearUnderway but not complete for reporting year – previous statement of process attached
Type of verification or assuranceLimited assurance
Attach the statementERM CVS 2018 CDP Assurance Statement IFF_17Jul2019_FINAL.pdf
Page/section reference1
Relevant standardISAE3000
Proportion of reported emissions verified (%)100
Scope 3 categoryScope 3: Business travel
Verification or assurance cycle in placeAnnual process
Status in the current reporting yearUnderway but not complete for reporting year – previous statement of process attached
Type of verification or assuranceLimited assurance
Attach the statementERM CVS 2018 CDP Assurance Statement IFF_17Jul2019_FINAL.pdf
Page/section reference1
Relevant standardISAE3000
Proportion of reported emissions verified (%)100
C10.2
(C10.2) Do you verify any climate-related information reported in your CDP disclosure other than the emissions figures reported in C6.1, C6.3, and C6.5?Yes
C10.2a
(C10.2a) Which data points within your CDP disclosure have been verified, and which verification standards were used?
Disclosuremoduleverificationrelates to
Data verified Verificationstandard
Please explain
C8. Energy Energyconsumption
ISAE3000 IFF verifies its direct and indirect energy data annually for year on year change in energy usage. This is an organization wide verification and is part of oursustainability reporting process. The verification also helps IFF monitor and report on our 2020 energy intensity reduction goal.ERM CVS 2019 CDP Climate Change Assurance Statement IFF_FINAL.pdf
C6. Emissionsdata
Year on yearchange inemissions(Scope 1 and 2)
ISAE3000 IFF receives verification on Scope 1 and Scope 2 emissions data annually for both scope 1 and scope 2. The verified numbers are used to support our year onyear change in emissions calculations. IFF Legacy 2018 Scope 1 and Scope 2 data was assured. This is an organization wide verification and is part of oursustainability reporting process. The verification also helps IFF monitor and report on progress towards our SBTi approved emissions reduction target.ERM CVS 2019 CDP Climate Change Assurance Statement IFF_FINAL.pdf
C11. Carbon pricing
C11.1
CDP Page of 8045
(C11.1) Are any of your operations or activities regulated by a carbon pricing system (i.e. ETS, Cap & Trade or Carbon Tax)?No, and we do not anticipate being regulated in the next three years
C11.2
(C11.2) Has your organization originated or purchased any project-based carbon credits within the reporting period?No
C11.3
(C11.3) Does your organization use an internal price on carbon?Yes
C11.3a
(C11.3a) Provide details of how your organization uses an internal price on carbon.
Objective for implementing an internal carbon priceDrive energy efficiencyDrive low-carbon investmentIdentify and seize low-carbon opportunities
GHG ScopeScope 1Scope 2
ApplicationIFF has a formalized capital project approval process to promote energy efficiency projects and low-carbon solutions. If a project can claim environmental benefits in termsof energy, water, and hazardous waste, this is taken into consideration along with traditional ROI calculations. By integrating sustainability criteria into project evaluationframeworks, we can show additional environmental value from investments which are then taken into consideration for internal hurdle rates. This process helps us to valueand implement carbon-reducing solutions. This process is applied at the corporate level and is applicable to all regions and business units. Based on 2019 projects, wecalculated that the shadow price was equivalent to approximately $30 per metric ton of CO2e. We will explore framing this internally as an "internal carbon price" goingforward, including applying the ICP to the ROI for each project.
Actual price(s) used (Currency /metric ton)30
Variance of price(s) usedUniform pricing that is applied throughout the company independent of geography, business unit, or type of decision. It will be updated annually as proposed projects willchange each year.
Type of internal carbon priceShadow price
Impact & implicationThe carbon price will help IFF transition to low-carbon economy by emphasizing the need for a proper carbon management strategy. We expect it to help drive energyefficiency, drive low-carbon investment, and identify and seize low-carbon opportunities. Along with our traditional financial measures and eco savings approach, theshadow carbon price adds value to capital projects that reduce GHG emissions. Our Eco-Effectiveness Leadership Team is able to greenlight and implement numerouscarbon-reduction projects to make progress toward our climate-related goals, including our approved Science-Based Target. IFF approved 23 capital projects in 2019 tosave an additional 15,087 metric tons of CO2e per year. An example in 2019 of one of these projects was an energy efficiency improvement by our Jacksonville facility thatenhanced their cleaning stations steam control, leading to an estimated 300 tonne reduction of CO2e.
C12. Engagement
C12.1
(C12.1) Do you engage with your value chain on climate-related issues?Yes, our suppliersYes, our customers
C12.1a
CDP Page of 8046
(C12.1a) Provide details of your climate-related supplier engagement strategy.
Type of engagementEngagement & incentivization (changing supplier behavior)
Details of engagementRun an engagement campaign to educate suppliers about climate change
% of suppliers by number0.6
% total procurement spend (direct and indirect)27.4
% of supplier-related Scope 3 emissions as reported in C6.542
Rationale for the coverage of your engagementOur supplier engagement strategy is based around the Scope 3 component of our SBTi-approved science-based target, which committed to working with our suppliers(representing 70% of its supply chain emissions) so that they set their own science-based reduction targets and report annual emissions by 2025. The coverage of thistarget prioritizes IFF’s engagement not on a vaguely defined list of “key suppliers” but rather on the absolute emissions of all suppliers, which will maximize the science-based target’s impact. The target’s requirement of suppliers to report emission reduction progress will not only encourage progress on GHG emissions management butalso allow measurement of absolute emissions reductions. At this point this coverage is only of legacy IFF suppliers as we continue to integrate Frutarom’s supply chaininto all of our goals and targets.
Impact of engagement, including measures of successIFF’s science-based target was recently approved by SBTi. As we move toward our target, the impact of engagement will include supplier GHG emissions reductionsand/or improved climate change strategies including target setting. Based on an estimated average absolute emissions reduction of 15% per supplier involved in achievingthe goal, we anticipate the absolute emissions impact will be 100,000 tCO2e per year (a 10.5% reduction in IFF’s total scope 3 emissions). Success will be measured bypercent of suppliers engaged, with a target to have 70% of supply chain emissions set their own science-based reduction targets and report annual emissions by 2025. In2019, we measured the success of this strategy versus our targets for the first time as we have engaged suppliers representing 33% of our legacy IFF supply chainemissions through the CDP Supply Chain platform. Of this, suppliers representing 26% of our legacy IFF supply chain emissions have approved, committed to or plan toset an SBT.
CommentOur engagement of suppliers for our approved science-based target will primarily be through CDP Supply Chain and in the future we will strive to report on legacy Frutaromsupply chain emissions progress.
C12.1b
CDP Page of 8047
(C12.1b) Give details of your climate-related engagement strategy with your customers.
Type of engagementEducation/information sharing
Details of engagementRun an engagement campaign to education customers about your climate change performance and strategy
% of customers by number2.6
% of customer - related Scope 3 emissions as reported in C6.532
Portfolio coverage (total or outstanding)<Not Applicable>
Please explain the rationale for selecting this group of customers and scope of engagementThe sustainability of our customers, their brands and their products is key to our strategy. Our customers are increasingly challenged to find sustainable, reliable sources ofingredients to make products consumers have come to expect or demand. With so many pressing needs, we prioritize and adopt only those initiatives that are right for us,our customers and our communities. We engage with our customers both proactively and on an as needed basis. The measure of success is the customer scorecard. Forinstance, during 2019, 13 of our major customers, representing approximately 21% of our business, requested we respond to the CDP supply chain questionnaire. Weengaged with other key customers on climate-related issues via other channels, resulting in engagement of customers representing a combined total of 32% of our Scope 3emissions. Our rationale for the scope of this engagement is that focusing on our largest customers provides the largest opportunity for impact and engaging through CDPSupply Chain is an established mechanism for education and information sharing.
Impact of engagement, including measures of successIFF engages its customers through multiple channels but our primary means of engagement is CDP supply chain, which is included on customers’ scorecards evaluatingIFF’s sustainability strategy and performance. The impact of engagement via CDP supply chain could include customers reducing use-phase GHG emissions, increasingrenewable energy procurement, or selecting our low carbon products because of the focus on these in our disclosure process. We conduct customer-specific monitoring tomeasure success, which we measure by monitoring our rating in performance scorecards of our customers and our presence on their core lists. Our CDP Climate Changescore is often factored into these scorecards. Some customers specifically use CDP as a grade for an annual supplier performance evaluation and use this information tohelp generate their core lists, where not being included can significantly reduce the number of future projects and sales. A positive score on customer scorecards and ourinclusion on their core lists are our key measures of success. In 2019, all performance ratings received were positive (100% satisfied customers among those providingperformance ratings).
Type of engagementCollaboration & innovation
Details of engagementRun a campaign to encourage innovation to reduce climate change impacts
% of customers by number2.6
% of customer - related Scope 3 emissions as reported in C6.532
Portfolio coverage (total or outstanding)<Not Applicable>
Please explain the rationale for selecting this group of customers and scope of engagementThe sustainability of our customers, their brands and their products is key to our strategy. Our customers are increasingly challenged to find sustainable, reliable sources ofingredients to make products consumers have come to expect or demand. With so many pressing needs, we prioritize and adopt only those initiatives that are right for us,our customers and our communities. We engage with our customers both proactively and on an as needed basis. The measure of success is the customer scorecard. Forinstance, during 2019, thirteen of our major customers, representing approximately 21% of our business, requested we respond to the CDP supply chain questionnaire. Weengaged with other key customers on climate-related issues via other channels, resulting in engagement of customers representing a combined total of 32% of our Scope 3emissions. Our rationale for the scope of this engagement is that focusing on our largest customers provides the largest opportunity for impact and engaging through CDPSupply Chain is an established mechanism for education and information sharing.
Impact of engagement, including measures of successIFF engages its customers through multiple channels but our primary means of engagement is CDP supply chain, which is included on customers’ scorecards evaluatingIFF’s sustainability strategy and performance. The impact of engagement via CDP supply chain could include customers reducing use-phase GHG emissions, increasingrenewable energy procurement, or selecting our low carbon products because of the focus on these in our disclosure process. We conduct customer-specific monitoring tomeasure success, which we measure by monitoring our rating in performance scorecards of our customers and our presence on their core lists. Our CDP Climate Changescore is often factored into these scorecards. Some customers specifically use CDP as a grade for an annual supplier performance evaluation and use this information tohelp generate their core lists, where not being included can significantly reduce the number of future projects and sales. A positive score on customer scorecards and ourinclusion on their core lists are our key measures of success. In 2019, all CDP performance ratings received were positive (100% satisfied customers among thoseproviding performance ratings).
C12.3
(C12.3) Do you engage in activities that could either directly or indirectly influence public policy on climate-related issues through any of the following?Trade associationsOther
C12.3b
(C12.3b) Are you on the board of any trade associations or do you provide funding beyond membership?Yes
CDP Page of 8048
C12.3c
(C12.3c) Enter the details of those trade associations that are likely to take a position on climate change legislation.
Trade associationInternational Fragrance Association (IFRA)
Is your position on climate change consistent with theirs?Consistent
Please explain the trade association’s positionThe fragrance industry’s creativity is built on a sound understanding of human behavior and attitudes. In common purpose with its customers and consumers the industryseeks to be at the forefront of what is environmentally sound, socially acceptable and economically viable, including climate change. Through initiatives in energy and waterconservation, emission and waste reduction and education and community relations projects it continues to invest in improving the sustainability of its harvest of rawmaterials, its processing of essential oils and its manufacture of fragrance blends.
How have you influenced, or are you attempting to influence their position?IFF is on the board of and supports IFRA’s sustainability policies. International Fragrance Association (IFRA) works closely with the Research Institute for FragranceMaterials (RIFM) to develop standards on fragrance material usage. In 2011, IFF partnered with the Research Institute for Fragrance Materials (RIFM) to develop a lifecycleassessment methodology for measuring and communicating product sustainability.
Trade associationNatural Resources Stewardship Circle (NRSC)
Is your position on climate change consistent with theirs?Consistent
Please explain the trade association’s positionThe NRSC works to promote the responsible and ethical management of natural resources used in the beauty, cosmetics, fragrance, and avor industries. NRSC membershave pledged their personal commitment to creating a positive impact on the sourcing of natural ingredients.
How have you influenced, or are you attempting to influence their position?IFF also serves on the board of the Natural Resources Stewardship Circle, where it supports the NRSC’s sustainability initiatives, such as the vetiver root oil project in Haiti.IFF is working with the NRSC and other members to preserve the biodiversity of the vetiver supply chain and to develop cooperative, sustainable fair-trade projects with thelocal communities and farmers who grow this crop. Vetiver farmers in Haiti are encouraged through the program to take necessary steps to fight erosion to ensure soilfertility is preserved by implementing erosion control structures or by using sustainable harvesting techniques.
Trade associationWBCSD
Is your position on climate change consistent with theirs?Consistent
Please explain the trade association’s positionThe WBCSD is a CEO-led organization of forward-thinking companies that galvanizes the global business community to create a sustainable future for business, societyand the environment.
How have you influenced, or are you attempting to influence their position?Our Chairman and CEO was elected to the Executive Committee of the World Business Council for Sustainable Development (WBCSD). This is an opportunity to work withinfluential leaders to make positive, lasting changes in society. IFF’s participation in this organization is another way we can help leave the world a better place forgenerations to come.
C12.3e
CDP Page of 8049
(C12.3e) Provide details of the other engagement activities that you undertake.
IFF is a member of the World Business Council for Sustainable Development (WBCSD), which is a CEO-led organization of companies that galvanize the global businesscommunity to create a sustainable future for business, society, and the environment; a triple bottom approach that aligns with IFF’s sustainability strategy. We specificallyengaged as both a company and individual. Our Vice President of Global Sustainability is the liaison delegate to our CEO within the organization and our CEO is on theexecutive committee of WBCSD. He personally attends and participates in climate change workgroups on both policy and climate mitigation measures. We participate in andadvocate the low carbon technologies partnership initiative of the WBCSD and support their position on COP 21 as well as the position of the CDP on the Road to Paris.
IFF also serves on the board of the Natural Resources Stewardship Circle, which is a non-profit organization that works to promote the responsible and ethical management ofnatural resources used in the beauty, cosmetics, fragrance, and avor industries. NRSC members have pledged their personal commitment to creating a positive impact onthe sourcing of natural ingredients. For example, vetiver farmers in Haiti are encouraged through the program to take necessary steps to fight erosion to ensure soil fertility ispreserved by implementing erosion control structures or by using sustainable harvesting techniques.
IFF is a founding member of the International Fragrance Association (IFRA), the official representative body of the fragrances industry worldwide, with the main purpose ofensuring the safety of fragrance materials. IFF participated in an IFRA working group to develop sector-specific approach to GHG emissions calculation for the fragrancesand flavors industry.
IFF has a long association with the Research Institute for Fragrance Materials and partnered with them to conduct a life-cycle analysis of popular fragrance materials todetermine their overall sustainability. RIFM’s purpose is to gather and analyze scientific data, engage in testing and evaluation, distribute information, cooperate with officialagencies and to encourage uniform safety standards related to the use of fragrance ingredients. The RIFM Database of flavor and fragrance materials is the largest availableworldwide, classifying more than 5000 materials. The database is available online, 24/7, by subscription. RIFM's Database also houses an online collection ofFlavor/Fragrance Ingredient Data Sheets (FFIDS) from 1985-present. FFIDSs are issued to assist with compliance for U.S. OSHA's Hazard Communication Standards andthe European Commission's Dangerous Substances Directives.
IFF is also a member of the American Cleaning Institute (ACI), the Home of the U.S. Cleaning Products Industry™, representing producers of household, industrial, andinstitutional cleaning products, their ingredients and finished packaging; oleochemical producers; and chemical distributors to the cleaning product industry. IFF annuallyparticipates in the ACI’s Sustainability Metrics Program. IFF also joined the ACI’s Charter for Sustainable Cleaning, a voluntary lifecycle-based framework that promotes acommon industry approach to sharing and reporting best practices for sustainability. Companies participating in the Charter demonstrate their commitment to continuousimprovement of key aspects of sustainability across all stages of the cleaning product supply chain.
IFF is a member of the International Organization of the Flavor Industry (IOFI), which is a non-profit organization that represents the interest of the global flavor industry and itspartners by providing leadership in safety, scientific and regulatory matters. One of IOFI’s key objectives is “Organizational Sustainability and Growth: Increase IOFI's globalrepresentation and, in partnership with member associations, prepare the association for future challenges with adequate resources and reserves.”
IFF is also a member of the Flavor and Extract Manufacturers Association (FEMA), the oldest and largest national association of the flavor industry and is engaged principallyin activities which ensure a substantial supply of safe flavor materials.
C12.3f
(C12.3f) What processes do you have in place to ensure that all of your direct and indirect activities that influence policy are consistent with your overall climatechange strategy?
By supporting the works of external entities, such as industry associations and other organizations, we are able to monitor current and/or pending climate change legislationthat may impact our business globally. IFF’s Vice President of Global Sustainability along with the Sustainability Business Council, which is comprised of cross-functionalbusiness leaders, review all policies related to climate change to provide consistent alignment with our sustainability and business strategies.
Our process for ensuring engagement is consistent across different geographies and markets starts with the Sustainability Business Council. In addition to reviewing policieswith the VP of Global Sustainability to ensure alignment with our sustainability principles and business objectives, members of this council are also frequently ourrepresentatives on or liaisons with trade organizations. They engage policymakers directly at a high level and relay information back to the VP of Global Sustainability toensure consistency.
At the local level, Green Team core members interact with local officials to comply with regulatory frameworks and leverage ISO 14001 to help foster a working relationshipwith regulators to ensure they are updated with changing legislation. ISO 14001 is recertified every 3 years. The Green Team members report back to the Eco-EffectivenessLeadership Team, who report to the VP of Global Sustainability to maintain consistency and alignment with corporate policy engagement and strategy.
CDP Page of 8050
C12.4
(C12.4) Have you published information about your organization’s response to climate change and GHG emissions performance for this reporting year in placesother than in your CDP response? If so, please attach the publication(s).
PublicationIn mainstream reports
StatusComplete
Attach the documentIFF Annual Report 2019-Full Spread - FINAL.pdf
Page/Section reference2,7,16-20
Content elementsGovernanceStrategyRisks & opportunities
Comment
PublicationIn voluntary sustainability report
StatusComplete
Attach the documentiff-sustainability-report-2019.pdf
Page/Section reference36-41
Content elementsGovernanceStrategyRisks & opportunitiesEmissions figuresEmission targetsOther metrics
Comment
C15. Signoff
C-FI
(C-FI) Use this field to provide any additional information or context that you feel is relevant to your organization's response. Please note that this field is optionaland is not scored.
IFF is continuing the process of a large integration of our recent purchase of Frutarom. Frutarom data was part of our 2019 data verification process and has been includedthroughout the questionnaire, except where specified that data only pertains to Legacy IFF.
C15.1
(C15.1) Provide details for the person that has signed off (approved) your CDP climate change response.
Job title Corresponding job category
Row 1 Executive VP and Chief Financial Officer Chief Financial Officer (CFO)
SC. Supply chain module
SC0.0
CDP Page of 8051
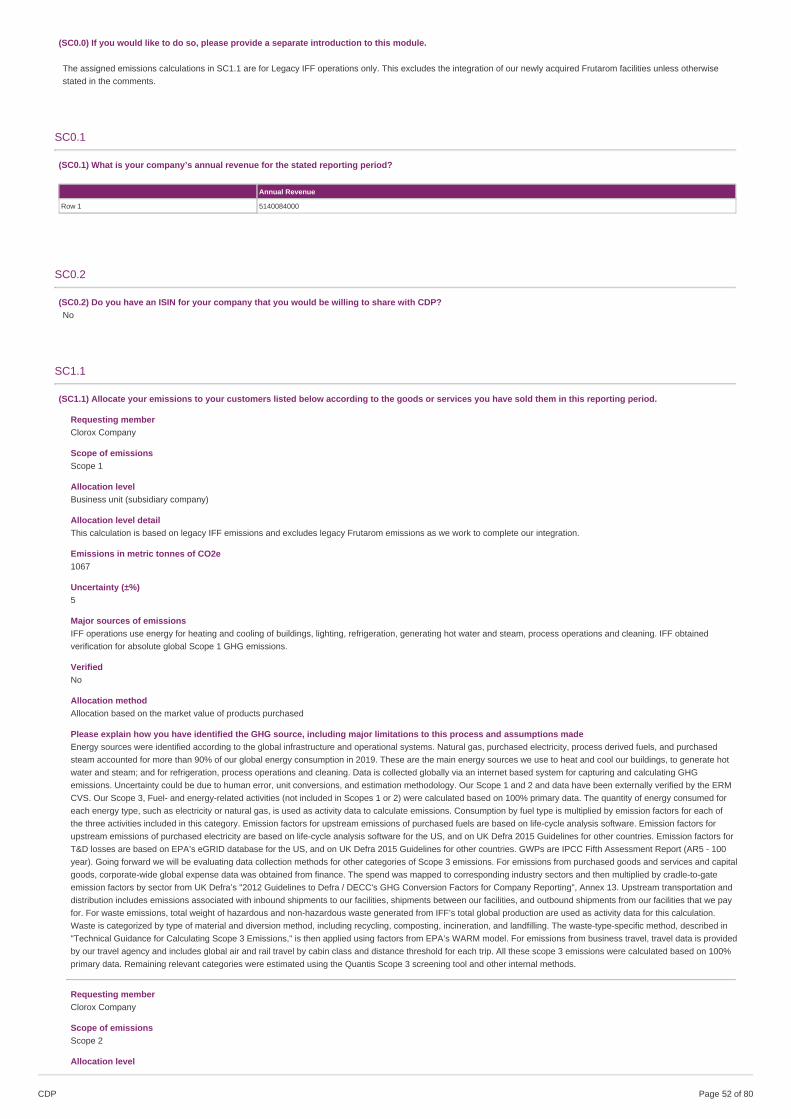
(SC0.0) If you would like to do so, please provide a separate introduction to this module.
The assigned emissions calculations in SC1.1 are for Legacy IFF operations only. This excludes the integration of our newly acquired Frutarom facilities unless otherwisestated in the comments.
SC0.1
(SC0.1) What is your company’s annual revenue for the stated reporting period?
Annual Revenue
Row 1 5140084000
SC0.2
(SC0.2) Do you have an ISIN for your company that you would be willing to share with CDP?No
SC1.1
(SC1.1) Allocate your emissions to your customers listed below according to the goods or services you have sold them in this reporting period.
Requesting memberClorox Company
Scope of emissionsScope 1
Allocation levelBusiness unit (subsidiary company)
Allocation level detailThis calculation is based on legacy IFF emissions and excludes legacy Frutarom emissions as we work to complete our integration.
Emissions in metric tonnes of CO2e1067
Uncertainty (±%)5
Major sources of emissionsIFF operations use energy for heating and cooling of buildings, lighting, refrigeration, generating hot water and steam, process operations and cleaning. IFF obtainedverification for absolute global Scope 1 GHG emissions.
VerifiedNo
Allocation methodAllocation based on the market value of products purchased
Please explain how you have identified the GHG source, including major limitations to this process and assumptions madeEnergy sources were identified according to the global infrastructure and operational systems. Natural gas, purchased electricity, process derived fuels, and purchasedsteam accounted for more than 90% of our global energy consumption in 2019. These are the main energy sources we use to heat and cool our buildings, to generate hotwater and steam; and for refrigeration, process operations and cleaning. Data is collected globally via an internet based system for capturing and calculating GHGemissions. Uncertainty could be due to human error, unit conversions, and estimation methodology. Our Scope 1 and 2 and data have been externally verified by the ERMCVS. Our Scope 3, Fuel- and energy-related activities (not included in Scopes 1 or 2) were calculated based on 100% primary data. The quantity of energy consumed foreach energy type, such as electricity or natural gas, is used as activity data to calculate emissions. Consumption by fuel type is multiplied by emission factors for each ofthe three activities included in this category. Emission factors for upstream emissions of purchased fuels are based on life-cycle analysis software. Emission factors forupstream emissions of purchased electricity are based on life-cycle analysis software for the US, and on UK Defra 2015 Guidelines for other countries. Emission factors forT&D losses are based on EPA’s eGRID database for the US, and on UK Defra 2015 Guidelines for other countries. GWPs are IPCC Fifth Assessment Report (AR5 - 100year). Going forward we will be evaluating data collection methods for other categories of Scope 3 emissions. For emissions from purchased goods and services and capitalgoods, corporate-wide global expense data was obtained from finance. The spend was mapped to corresponding industry sectors and then multiplied by cradle-to-gateemission factors by sector from UK Defra’s "2012 Guidelines to Defra / DECC's GHG Conversion Factors for Company Reporting", Annex 13. Upstream transportation anddistribution includes emissions associated with inbound shipments to our facilities, shipments between our facilities, and outbound shipments from our facilities that we payfor. For waste emissions, total weight of hazardous and non-hazardous waste generated from IFF’s total global production are used as activity data for this calculation.Waste is categorized by type of material and diversion method, including recycling, composting, incineration, and landfilling. The waste-type-specific method, described in"Technical Guidance for Calculating Scope 3 Emissions," is then applied using factors from EPA’s WARM model. For emissions from business travel, travel data is providedby our travel agency and includes global air and rail travel by cabin class and distance threshold for each trip. All these scope 3 emissions were calculated based on 100%primary data. Remaining relevant categories were estimated using the Quantis Scope 3 screening tool and other internal methods.
Requesting memberClorox Company
Scope of emissionsScope 2
Allocation level
CDP Page of 8052
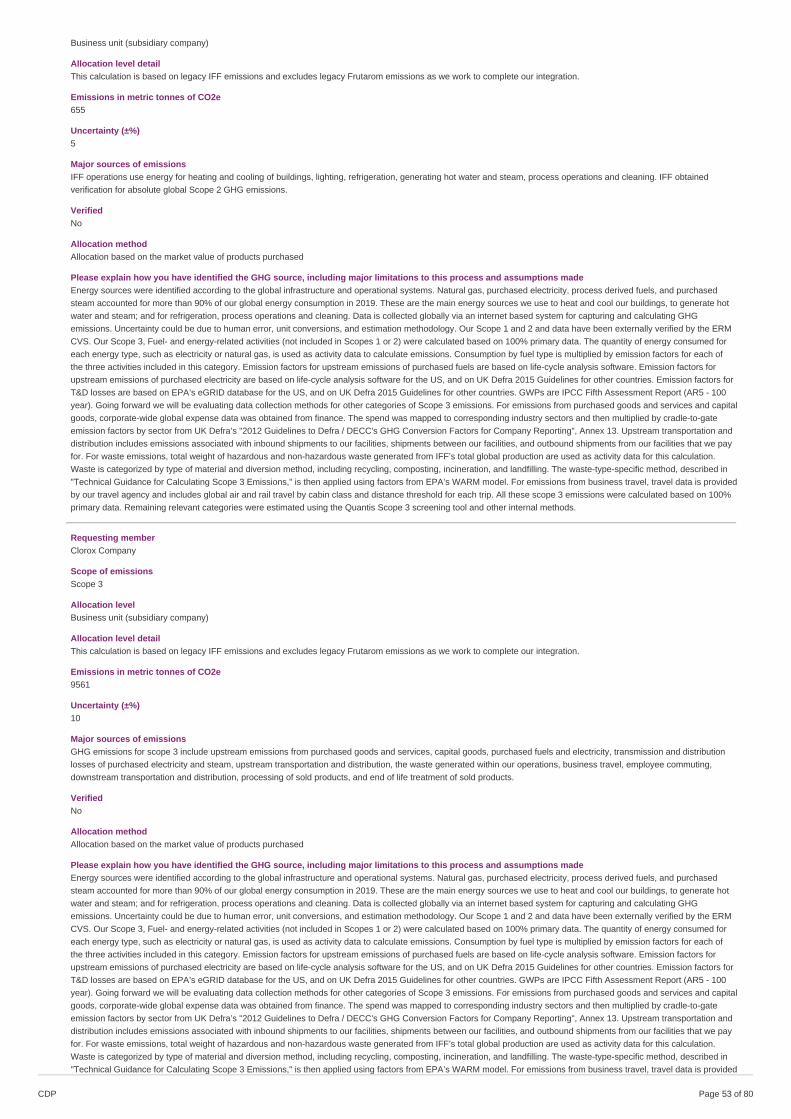
Business unit (subsidiary company)
Allocation level detailThis calculation is based on legacy IFF emissions and excludes legacy Frutarom emissions as we work to complete our integration.
Emissions in metric tonnes of CO2e655
Uncertainty (±%)5
Major sources of emissionsIFF operations use energy for heating and cooling of buildings, lighting, refrigeration, generating hot water and steam, process operations and cleaning. IFF obtainedverification for absolute global Scope 2 GHG emissions.
VerifiedNo
Allocation methodAllocation based on the market value of products purchased
Please explain how you have identified the GHG source, including major limitations to this process and assumptions madeEnergy sources were identified according to the global infrastructure and operational systems. Natural gas, purchased electricity, process derived fuels, and purchasedsteam accounted for more than 90% of our global energy consumption in 2019. These are the main energy sources we use to heat and cool our buildings, to generate hotwater and steam; and for refrigeration, process operations and cleaning. Data is collected globally via an internet based system for capturing and calculating GHGemissions. Uncertainty could be due to human error, unit conversions, and estimation methodology. Our Scope 1 and 2 and data have been externally verified by the ERMCVS. Our Scope 3, Fuel- and energy-related activities (not included in Scopes 1 or 2) were calculated based on 100% primary data. The quantity of energy consumed foreach energy type, such as electricity or natural gas, is used as activity data to calculate emissions. Consumption by fuel type is multiplied by emission factors for each ofthe three activities included in this category. Emission factors for upstream emissions of purchased fuels are based on life-cycle analysis software. Emission factors forupstream emissions of purchased electricity are based on life-cycle analysis software for the US, and on UK Defra 2015 Guidelines for other countries. Emission factors forT&D losses are based on EPA’s eGRID database for the US, and on UK Defra 2015 Guidelines for other countries. GWPs are IPCC Fifth Assessment Report (AR5 - 100year). Going forward we will be evaluating data collection methods for other categories of Scope 3 emissions. For emissions from purchased goods and services and capitalgoods, corporate-wide global expense data was obtained from finance. The spend was mapped to corresponding industry sectors and then multiplied by cradle-to-gateemission factors by sector from UK Defra’s "2012 Guidelines to Defra / DECC's GHG Conversion Factors for Company Reporting", Annex 13. Upstream transportation anddistribution includes emissions associated with inbound shipments to our facilities, shipments between our facilities, and outbound shipments from our facilities that we payfor. For waste emissions, total weight of hazardous and non-hazardous waste generated from IFF’s total global production are used as activity data for this calculation.Waste is categorized by type of material and diversion method, including recycling, composting, incineration, and landfilling. The waste-type-specific method, described in"Technical Guidance for Calculating Scope 3 Emissions," is then applied using factors from EPA’s WARM model. For emissions from business travel, travel data is providedby our travel agency and includes global air and rail travel by cabin class and distance threshold for each trip. All these scope 3 emissions were calculated based on 100%primary data. Remaining relevant categories were estimated using the Quantis Scope 3 screening tool and other internal methods.
Requesting memberClorox Company
Scope of emissionsScope 3
Allocation levelBusiness unit (subsidiary company)
Allocation level detailThis calculation is based on legacy IFF emissions and excludes legacy Frutarom emissions as we work to complete our integration.
Emissions in metric tonnes of CO2e9561
Uncertainty (±%)10
Major sources of emissionsGHG emissions for scope 3 include upstream emissions from purchased goods and services, capital goods, purchased fuels and electricity, transmission and distributionlosses of purchased electricity and steam, upstream transportation and distribution, the waste generated within our operations, business travel, employee commuting,downstream transportation and distribution, processing of sold products, and end of life treatment of sold products.
VerifiedNo
Allocation methodAllocation based on the market value of products purchased
Please explain how you have identified the GHG source, including major limitations to this process and assumptions madeEnergy sources were identified according to the global infrastructure and operational systems. Natural gas, purchased electricity, process derived fuels, and purchasedsteam accounted for more than 90% of our global energy consumption in 2019. These are the main energy sources we use to heat and cool our buildings, to generate hotwater and steam; and for refrigeration, process operations and cleaning. Data is collected globally via an internet based system for capturing and calculating GHGemissions. Uncertainty could be due to human error, unit conversions, and estimation methodology. Our Scope 1 and 2 and data have been externally verified by the ERMCVS. Our Scope 3, Fuel- and energy-related activities (not included in Scopes 1 or 2) were calculated based on 100% primary data. The quantity of energy consumed foreach energy type, such as electricity or natural gas, is used as activity data to calculate emissions. Consumption by fuel type is multiplied by emission factors for each ofthe three activities included in this category. Emission factors for upstream emissions of purchased fuels are based on life-cycle analysis software. Emission factors forupstream emissions of purchased electricity are based on life-cycle analysis software for the US, and on UK Defra 2015 Guidelines for other countries. Emission factors forT&D losses are based on EPA’s eGRID database for the US, and on UK Defra 2015 Guidelines for other countries. GWPs are IPCC Fifth Assessment Report (AR5 - 100year). Going forward we will be evaluating data collection methods for other categories of Scope 3 emissions. For emissions from purchased goods and services and capitalgoods, corporate-wide global expense data was obtained from finance. The spend was mapped to corresponding industry sectors and then multiplied by cradle-to-gateemission factors by sector from UK Defra’s "2012 Guidelines to Defra / DECC's GHG Conversion Factors for Company Reporting", Annex 13. Upstream transportation anddistribution includes emissions associated with inbound shipments to our facilities, shipments between our facilities, and outbound shipments from our facilities that we payfor. For waste emissions, total weight of hazardous and non-hazardous waste generated from IFF’s total global production are used as activity data for this calculation.Waste is categorized by type of material and diversion method, including recycling, composting, incineration, and landfilling. The waste-type-specific method, described in"Technical Guidance for Calculating Scope 3 Emissions," is then applied using factors from EPA’s WARM model. For emissions from business travel, travel data is provided
CDP Page of 8053
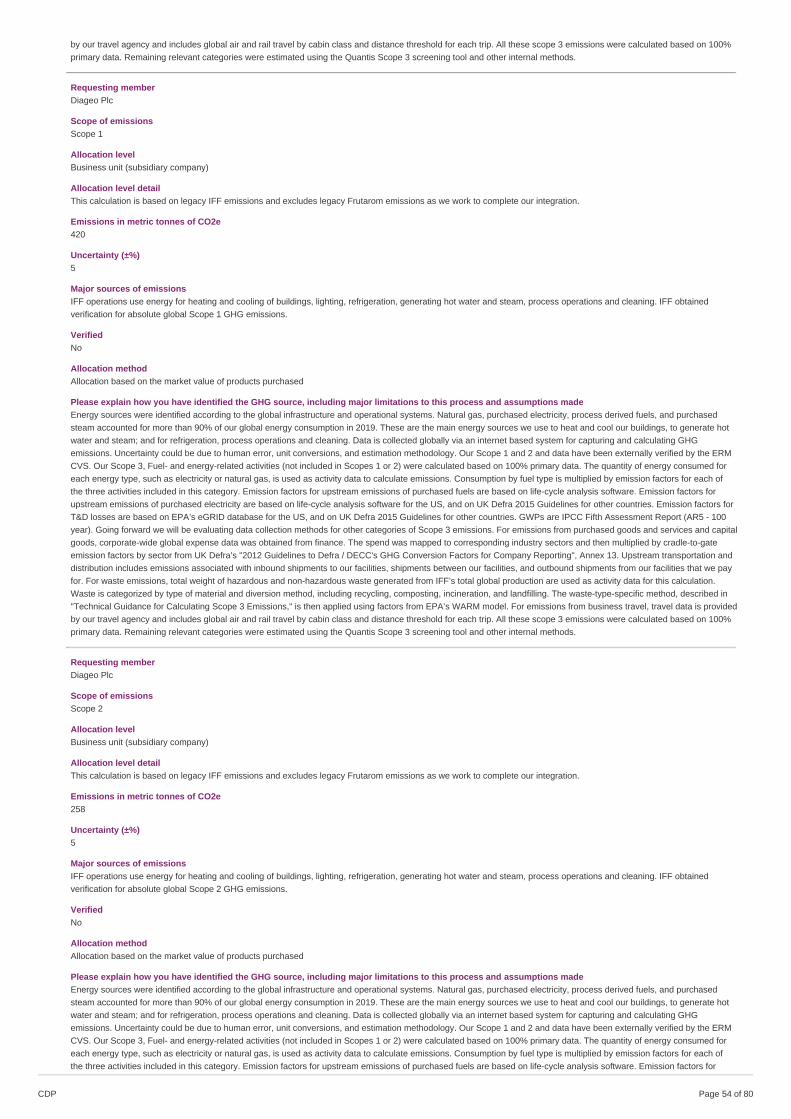
by our travel agency and includes global air and rail travel by cabin class and distance threshold for each trip. All these scope 3 emissions were calculated based on 100%primary data. Remaining relevant categories were estimated using the Quantis Scope 3 screening tool and other internal methods.
Requesting memberDiageo Plc
Scope of emissionsScope 1
Allocation levelBusiness unit (subsidiary company)
Allocation level detailThis calculation is based on legacy IFF emissions and excludes legacy Frutarom emissions as we work to complete our integration.
Emissions in metric tonnes of CO2e420
Uncertainty (±%)5
Major sources of emissionsIFF operations use energy for heating and cooling of buildings, lighting, refrigeration, generating hot water and steam, process operations and cleaning. IFF obtainedverification for absolute global Scope 1 GHG emissions.
VerifiedNo
Allocation methodAllocation based on the market value of products purchased
Please explain how you have identified the GHG source, including major limitations to this process and assumptions madeEnergy sources were identified according to the global infrastructure and operational systems. Natural gas, purchased electricity, process derived fuels, and purchasedsteam accounted for more than 90% of our global energy consumption in 2019. These are the main energy sources we use to heat and cool our buildings, to generate hotwater and steam; and for refrigeration, process operations and cleaning. Data is collected globally via an internet based system for capturing and calculating GHGemissions. Uncertainty could be due to human error, unit conversions, and estimation methodology. Our Scope 1 and 2 and data have been externally verified by the ERMCVS. Our Scope 3, Fuel- and energy-related activities (not included in Scopes 1 or 2) were calculated based on 100% primary data. The quantity of energy consumed foreach energy type, such as electricity or natural gas, is used as activity data to calculate emissions. Consumption by fuel type is multiplied by emission factors for each ofthe three activities included in this category. Emission factors for upstream emissions of purchased fuels are based on life-cycle analysis software. Emission factors forupstream emissions of purchased electricity are based on life-cycle analysis software for the US, and on UK Defra 2015 Guidelines for other countries. Emission factors forT&D losses are based on EPA’s eGRID database for the US, and on UK Defra 2015 Guidelines for other countries. GWPs are IPCC Fifth Assessment Report (AR5 - 100year). Going forward we will be evaluating data collection methods for other categories of Scope 3 emissions. For emissions from purchased goods and services and capitalgoods, corporate-wide global expense data was obtained from finance. The spend was mapped to corresponding industry sectors and then multiplied by cradle-to-gateemission factors by sector from UK Defra’s "2012 Guidelines to Defra / DECC's GHG Conversion Factors for Company Reporting", Annex 13. Upstream transportation anddistribution includes emissions associated with inbound shipments to our facilities, shipments between our facilities, and outbound shipments from our facilities that we payfor. For waste emissions, total weight of hazardous and non-hazardous waste generated from IFF’s total global production are used as activity data for this calculation.Waste is categorized by type of material and diversion method, including recycling, composting, incineration, and landfilling. The waste-type-specific method, described in"Technical Guidance for Calculating Scope 3 Emissions," is then applied using factors from EPA’s WARM model. For emissions from business travel, travel data is providedby our travel agency and includes global air and rail travel by cabin class and distance threshold for each trip. All these scope 3 emissions were calculated based on 100%primary data. Remaining relevant categories were estimated using the Quantis Scope 3 screening tool and other internal methods.
Requesting memberDiageo Plc
Scope of emissionsScope 2
Allocation levelBusiness unit (subsidiary company)
Allocation level detailThis calculation is based on legacy IFF emissions and excludes legacy Frutarom emissions as we work to complete our integration.
Emissions in metric tonnes of CO2e258
Uncertainty (±%)5
Major sources of emissionsIFF operations use energy for heating and cooling of buildings, lighting, refrigeration, generating hot water and steam, process operations and cleaning. IFF obtainedverification for absolute global Scope 2 GHG emissions.
VerifiedNo
Allocation methodAllocation based on the market value of products purchased
Please explain how you have identified the GHG source, including major limitations to this process and assumptions madeEnergy sources were identified according to the global infrastructure and operational systems. Natural gas, purchased electricity, process derived fuels, and purchasedsteam accounted for more than 90% of our global energy consumption in 2019. These are the main energy sources we use to heat and cool our buildings, to generate hotwater and steam; and for refrigeration, process operations and cleaning. Data is collected globally via an internet based system for capturing and calculating GHGemissions. Uncertainty could be due to human error, unit conversions, and estimation methodology. Our Scope 1 and 2 and data have been externally verified by the ERMCVS. Our Scope 3, Fuel- and energy-related activities (not included in Scopes 1 or 2) were calculated based on 100% primary data. The quantity of energy consumed foreach energy type, such as electricity or natural gas, is used as activity data to calculate emissions. Consumption by fuel type is multiplied by emission factors for each ofthe three activities included in this category. Emission factors for upstream emissions of purchased fuels are based on life-cycle analysis software. Emission factors for
CDP Page of 8054
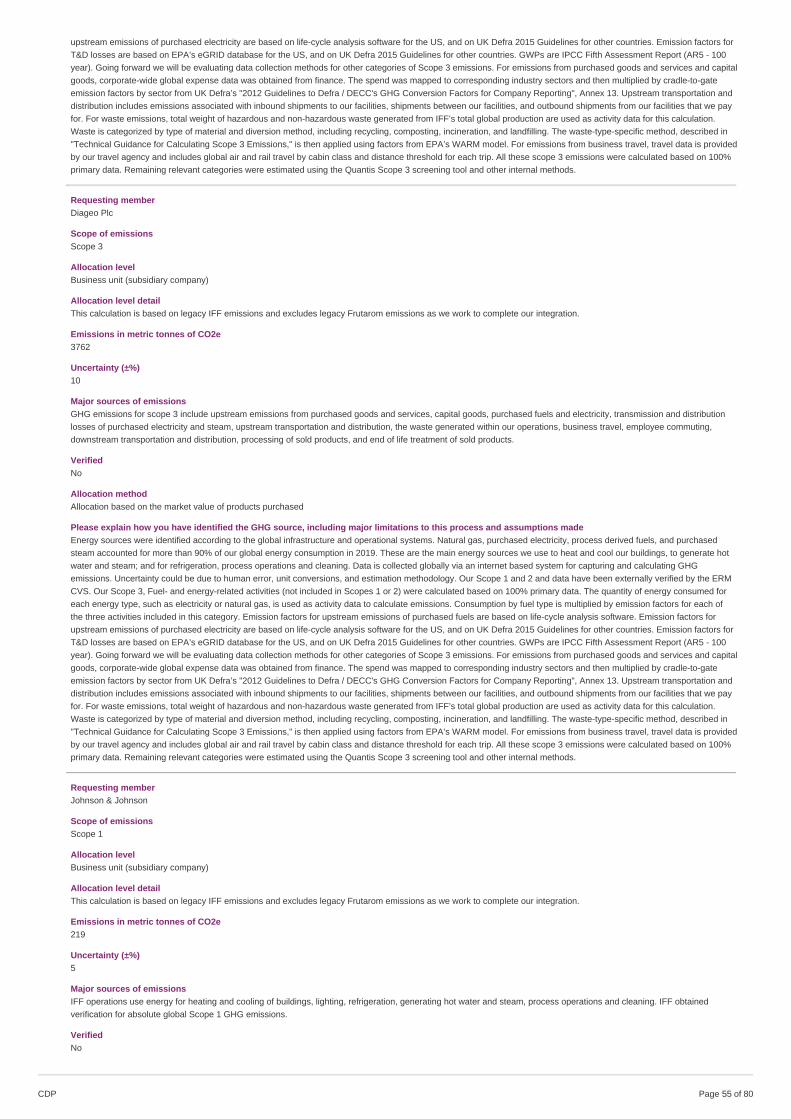
upstream emissions of purchased electricity are based on life-cycle analysis software for the US, and on UK Defra 2015 Guidelines for other countries. Emission factors forT&D losses are based on EPA’s eGRID database for the US, and on UK Defra 2015 Guidelines for other countries. GWPs are IPCC Fifth Assessment Report (AR5 - 100year). Going forward we will be evaluating data collection methods for other categories of Scope 3 emissions. For emissions from purchased goods and services and capitalgoods, corporate-wide global expense data was obtained from finance. The spend was mapped to corresponding industry sectors and then multiplied by cradle-to-gateemission factors by sector from UK Defra’s "2012 Guidelines to Defra / DECC's GHG Conversion Factors for Company Reporting", Annex 13. Upstream transportation anddistribution includes emissions associated with inbound shipments to our facilities, shipments between our facilities, and outbound shipments from our facilities that we payfor. For waste emissions, total weight of hazardous and non-hazardous waste generated from IFF’s total global production are used as activity data for this calculation.Waste is categorized by type of material and diversion method, including recycling, composting, incineration, and landfilling. The waste-type-specific method, described in"Technical Guidance for Calculating Scope 3 Emissions," is then applied using factors from EPA’s WARM model. For emissions from business travel, travel data is providedby our travel agency and includes global air and rail travel by cabin class and distance threshold for each trip. All these scope 3 emissions were calculated based on 100%primary data. Remaining relevant categories were estimated using the Quantis Scope 3 screening tool and other internal methods.
Requesting memberDiageo Plc
Scope of emissionsScope 3
Allocation levelBusiness unit (subsidiary company)
Allocation level detailThis calculation is based on legacy IFF emissions and excludes legacy Frutarom emissions as we work to complete our integration.
Emissions in metric tonnes of CO2e3762
Uncertainty (±%)10
Major sources of emissionsGHG emissions for scope 3 include upstream emissions from purchased goods and services, capital goods, purchased fuels and electricity, transmission and distributionlosses of purchased electricity and steam, upstream transportation and distribution, the waste generated within our operations, business travel, employee commuting,downstream transportation and distribution, processing of sold products, and end of life treatment of sold products.
VerifiedNo
Allocation methodAllocation based on the market value of products purchased
Please explain how you have identified the GHG source, including major limitations to this process and assumptions madeEnergy sources were identified according to the global infrastructure and operational systems. Natural gas, purchased electricity, process derived fuels, and purchasedsteam accounted for more than 90% of our global energy consumption in 2019. These are the main energy sources we use to heat and cool our buildings, to generate hotwater and steam; and for refrigeration, process operations and cleaning. Data is collected globally via an internet based system for capturing and calculating GHGemissions. Uncertainty could be due to human error, unit conversions, and estimation methodology. Our Scope 1 and 2 and data have been externally verified by the ERMCVS. Our Scope 3, Fuel- and energy-related activities (not included in Scopes 1 or 2) were calculated based on 100% primary data. The quantity of energy consumed foreach energy type, such as electricity or natural gas, is used as activity data to calculate emissions. Consumption by fuel type is multiplied by emission factors for each ofthe three activities included in this category. Emission factors for upstream emissions of purchased fuels are based on life-cycle analysis software. Emission factors forupstream emissions of purchased electricity are based on life-cycle analysis software for the US, and on UK Defra 2015 Guidelines for other countries. Emission factors forT&D losses are based on EPA’s eGRID database for the US, and on UK Defra 2015 Guidelines for other countries. GWPs are IPCC Fifth Assessment Report (AR5 - 100year). Going forward we will be evaluating data collection methods for other categories of Scope 3 emissions. For emissions from purchased goods and services and capitalgoods, corporate-wide global expense data was obtained from finance. The spend was mapped to corresponding industry sectors and then multiplied by cradle-to-gateemission factors by sector from UK Defra’s "2012 Guidelines to Defra / DECC's GHG Conversion Factors for Company Reporting", Annex 13. Upstream transportation anddistribution includes emissions associated with inbound shipments to our facilities, shipments between our facilities, and outbound shipments from our facilities that we payfor. For waste emissions, total weight of hazardous and non-hazardous waste generated from IFF’s total global production are used as activity data for this calculation.Waste is categorized by type of material and diversion method, including recycling, composting, incineration, and landfilling. The waste-type-specific method, described in"Technical Guidance for Calculating Scope 3 Emissions," is then applied using factors from EPA’s WARM model. For emissions from business travel, travel data is providedby our travel agency and includes global air and rail travel by cabin class and distance threshold for each trip. All these scope 3 emissions were calculated based on 100%primary data. Remaining relevant categories were estimated using the Quantis Scope 3 screening tool and other internal methods.
Requesting memberJohnson & Johnson
Scope of emissionsScope 1
Allocation levelBusiness unit (subsidiary company)
Allocation level detailThis calculation is based on legacy IFF emissions and excludes legacy Frutarom emissions as we work to complete our integration.
Emissions in metric tonnes of CO2e219
Uncertainty (±%)5
Major sources of emissionsIFF operations use energy for heating and cooling of buildings, lighting, refrigeration, generating hot water and steam, process operations and cleaning. IFF obtainedverification for absolute global Scope 1 GHG emissions.
VerifiedNo
CDP Page of 8055
Allocation methodAllocation based on the market value of products purchased
Please explain how you have identified the GHG source, including major limitations to this process and assumptions madeEnergy sources were identified according to the global infrastructure and operational systems. Natural gas, purchased electricity, process derived fuels, and purchasedsteam accounted for more than 90% of our global energy consumption in 2019. These are the main energy sources we use to heat and cool our buildings, to generate hotwater and steam; and for refrigeration, process operations and cleaning. Data is collected globally via an internet based system for capturing and calculating GHGemissions. Uncertainty could be due to human error, unit conversions, and estimation methodology. Our Scope 1 and 2 and data have been externally verified by the ERMCVS. Our Scope 3, Fuel- and energy-related activities (not included in Scopes 1 or 2) were calculated based on 100% primary data. The quantity of energy consumed foreach energy type, such as electricity or natural gas, is used as activity data to calculate emissions. Consumption by fuel type is multiplied by emission factors for each ofthe three activities included in this category. Emission factors for upstream emissions of purchased fuels are based on life-cycle analysis software. Emission factors forupstream emissions of purchased electricity are based on life-cycle analysis software for the US, and on UK Defra 2015 Guidelines for other countries. Emission factors forT&D losses are based on EPA’s eGRID database for the US, and on UK Defra 2015 Guidelines for other countries. GWPs are IPCC Fifth Assessment Report (AR5 - 100year). Going forward we will be evaluating data collection methods for other categories of Scope 3 emissions. For emissions from purchased goods and services and capitalgoods, corporate-wide global expense data was obtained from finance. The spend was mapped to corresponding industry sectors and then multiplied by cradle-to-gateemission factors by sector from UK Defra’s "2012 Guidelines to Defra / DECC's GHG Conversion Factors for Company Reporting", Annex 13. Upstream transportation anddistribution includes emissions associated with inbound shipments to our facilities, shipments between our facilities, and outbound shipments from our facilities that we payfor. For waste emissions, total weight of hazardous and non-hazardous waste generated from IFF’s total global production are used as activity data for this calculation.Waste is categorized by type of material and diversion method, including recycling, composting, incineration, and landfilling. The waste-type-specific method, described in"Technical Guidance for Calculating Scope 3 Emissions," is then applied using factors from EPA’s WARM model. For emissions from business travel, travel data is providedby our travel agency and includes global air and rail travel by cabin class and distance threshold for each trip. All these scope 3 emissions were calculated based on 100%primary data. Remaining relevant categories were estimated using the Quantis Scope 3 screening tool and other internal methods.
Requesting memberJohnson & Johnson
Scope of emissionsScope 2
Allocation levelBusiness unit (subsidiary company)
Allocation level detailThis calculation is based on legacy IFF emissions and excludes legacy Frutarom emissions as we work to complete our integration.
Emissions in metric tonnes of CO2e135
Uncertainty (±%)5
Major sources of emissionsIFF operations use energy for heating and cooling of buildings, lighting, refrigeration, generating hot water and steam, process operations and cleaning. IFF obtainedverification for absolute global Scope 2 GHG emissions.
VerifiedNo
Allocation methodAllocation based on the market value of products purchased
Please explain how you have identified the GHG source, including major limitations to this process and assumptions madeEnergy sources were identified according to the global infrastructure and operational systems. Natural gas, purchased electricity, process derived fuels, and purchasedsteam accounted for more than 90% of our global energy consumption in 2019. These are the main energy sources we use to heat and cool our buildings, to generate hotwater and steam; and for refrigeration, process operations and cleaning. Data is collected globally via an internet based system for capturing and calculating GHGemissions. Uncertainty could be due to human error, unit conversions, and estimation methodology. Our Scope 1 and 2 and data have been externally verified by the ERMCVS. Our Scope 3, Fuel- and energy-related activities (not included in Scopes 1 or 2) were calculated based on 100% primary data. The quantity of energy consumed foreach energy type, such as electricity or natural gas, is used as activity data to calculate emissions. Consumption by fuel type is multiplied by emission factors for each ofthe three activities included in this category. Emission factors for upstream emissions of purchased fuels are based on life-cycle analysis software. Emission factors forupstream emissions of purchased electricity are based on life-cycle analysis software for the US, and on UK Defra 2015 Guidelines for other countries. Emission factors forT&D losses are based on EPA’s eGRID database for the US, and on UK Defra 2015 Guidelines for other countries. GWPs are IPCC Fifth Assessment Report (AR5 - 100year). Going forward we will be evaluating data collection methods for other categories of Scope 3 emissions. For emissions from purchased goods and services and capitalgoods, corporate-wide global expense data was obtained from finance. The spend was mapped to corresponding industry sectors and then multiplied by cradle-to-gateemission factors by sector from UK Defra’s "2012 Guidelines to Defra / DECC's GHG Conversion Factors for Company Reporting", Annex 13. Upstream transportation anddistribution includes emissions associated with inbound shipments to our facilities, shipments between our facilities, and outbound shipments from our facilities that we payfor. For waste emissions, total weight of hazardous and non-hazardous waste generated from IFF’s total global production are used as activity data for this calculation.Waste is categorized by type of material and diversion method, including recycling, composting, incineration, and landfilling. The waste-type-specific method, described in"Technical Guidance for Calculating Scope 3 Emissions," is then applied using factors from EPA’s WARM model. For emissions from business travel, travel data is providedby our travel agency and includes global air and rail travel by cabin class and distance threshold for each trip. All these scope 3 emissions were calculated based on 100%primary data. Remaining relevant categories were estimated using the Quantis Scope 3 screening tool and other internal methods.
Requesting memberJohnson & Johnson
Scope of emissionsScope 3
Allocation levelBusiness unit (subsidiary company)
Allocation level detailThis calculation is based on legacy IFF emissions and excludes legacy Frutarom emissions as we work to complete our integration.
Emissions in metric tonnes of CO2e1967
CDP Page of 8056
Uncertainty (±%)10
Major sources of emissionsGHG emissions for scope 3 include upstream emissions from purchased goods and services, capital goods, purchased fuels and electricity, transmission and distributionlosses of purchased electricity and steam, upstream transportation and distribution, the waste generated within our operations, business travel, employee commuting,downstream transportation and distribution, processing of sold products, and end of life treatment of sold products.
VerifiedNo
Allocation methodAllocation based on the market value of products purchased
Please explain how you have identified the GHG source, including major limitations to this process and assumptions madeEnergy sources were identified according to the global infrastructure and operational systems. Natural gas, purchased electricity, process derived fuels, and purchasedsteam accounted for more than 90% of our global energy consumption in 2019. These are the main energy sources we use to heat and cool our buildings, to generate hotwater and steam; and for refrigeration, process operations and cleaning. Data is collected globally via an internet based system for capturing and calculating GHGemissions. Uncertainty could be due to human error, unit conversions, and estimation methodology. Our Scope 1 and 2 and data have been externally verified by the ERMCVS. Our Scope 3, Fuel- and energy-related activities (not included in Scopes 1 or 2) were calculated based on 100% primary data. The quantity of energy consumed foreach energy type, such as electricity or natural gas, is used as activity data to calculate emissions. Consumption by fuel type is multiplied by emission factors for each ofthe three activities included in this category. Emission factors for upstream emissions of purchased fuels are based on life-cycle analysis software. Emission factors forupstream emissions of purchased electricity are based on life-cycle analysis software for the US, and on UK Defra 2015 Guidelines for other countries. Emission factors forT&D losses are based on EPA’s eGRID database for the US, and on UK Defra 2015 Guidelines for other countries. GWPs are IPCC Fifth Assessment Report (AR5 - 100year). Going forward we will be evaluating data collection methods for other categories of Scope 3 emissions. For emissions from purchased goods and services and capitalgoods, corporate-wide global expense data was obtained from finance. The spend was mapped to corresponding industry sectors and then multiplied by cradle-to-gateemission factors by sector from UK Defra’s "2012 Guidelines to Defra / DECC's GHG Conversion Factors for Company Reporting", Annex 13. Upstream transportation anddistribution includes emissions associated with inbound shipments to our facilities, shipments between our facilities, and outbound shipments from our facilities that we payfor. For waste emissions, total weight of hazardous and non-hazardous waste generated from IFF’s total global production are used as activity data for this calculation.Waste is categorized by type of material and diversion method, including recycling, composting, incineration, and landfilling. The waste-type-specific method, described in"Technical Guidance for Calculating Scope 3 Emissions," is then applied using factors from EPA’s WARM model. For emissions from business travel, travel data is providedby our travel agency and includes global air and rail travel by cabin class and distance threshold for each trip. All these scope 3 emissions were calculated based on 100%primary data. Remaining relevant categories were estimated using the Quantis Scope 3 screening tool and other internal methods.
Requesting memberKAO Corporation
Scope of emissionsScope 1
Allocation levelBusiness unit (subsidiary company)
Allocation level detailThis calculation is based on legacy IFF emissions and excludes legacy Frutarom emissions as we work to complete our integration.
Emissions in metric tonnes of CO2e664
Uncertainty (±%)5
Major sources of emissionsIFF operations use energy for heating and cooling of buildings, lighting, refrigeration, generating hot water and steam, process operations and cleaning. IFF obtainedverification for absolute global Scope 1 GHG emissions.
VerifiedNo
Allocation methodAllocation based on the market value of products purchased
Please explain how you have identified the GHG source, including major limitations to this process and assumptions madeEnergy sources were identified according to the global infrastructure and operational systems. Natural gas, purchased electricity, process derived fuels, and purchasedsteam accounted for more than 90% of our global energy consumption in 2019. These are the main energy sources we use to heat and cool our buildings, to generate hotwater and steam; and for refrigeration, process operations and cleaning. Data is collected globally via an internet based system for capturing and calculating GHGemissions. Uncertainty could be due to human error, unit conversions, and estimation methodology. Our Scope 1 and 2 and data have been externally verified by the ERMCVS. Our Scope 3, Fuel- and energy-related activities (not included in Scopes 1 or 2) were calculated based on 100% primary data. The quantity of energy consumed foreach energy type, such as electricity or natural gas, is used as activity data to calculate emissions. Consumption by fuel type is multiplied by emission factors for each ofthe three activities included in this category. Emission factors for upstream emissions of purchased fuels are based on life-cycle analysis software. Emission factors forupstream emissions of purchased electricity are based on life-cycle analysis software for the US, and on UK Defra 2015 Guidelines for other countries. Emission factors forT&D losses are based on EPA’s eGRID database for the US, and on UK Defra 2015 Guidelines for other countries. GWPs are IPCC Fifth Assessment Report (AR5 - 100year). Going forward we will be evaluating data collection methods for other categories of Scope 3 emissions. For emissions from purchased goods and services and capitalgoods, corporate-wide global expense data was obtained from finance. The spend was mapped to corresponding industry sectors and then multiplied by cradle-to-gateemission factors by sector from UK Defra’s "2012 Guidelines to Defra / DECC's GHG Conversion Factors for Company Reporting", Annex 13. Upstream transportation anddistribution includes emissions associated with inbound shipments to our facilities, shipments between our facilities, and outbound shipments from our facilities that we payfor. For waste emissions, total weight of hazardous and non-hazardous waste generated from IFF’s total global production are used as activity data for this calculation.Waste is categorized by type of material and diversion method, including recycling, composting, incineration, and landfilling. The waste-type-specific method, described in"Technical Guidance for Calculating Scope 3 Emissions," is then applied using factors from EPA’s WARM model. For emissions from business travel, travel data is providedby our travel agency and includes global air and rail travel by cabin class and distance threshold for each trip. All these scope 3 emissions were calculated based on 100%primary data. Remaining relevant categories were estimated using the Quantis Scope 3 screening tool and other internal methods.
Requesting memberKAO Corporation
CDP Page of 8057
Scope of emissionsScope 2
Allocation levelBusiness unit (subsidiary company)
Allocation level detailThis calculation is based on legacy IFF emissions and excludes legacy Frutarom emissions as we work to complete our integration.
Emissions in metric tonnes of CO2e408
Uncertainty (±%)5
Major sources of emissionsIFF operations use energy for heating and cooling of buildings, lighting, refrigeration, generating hot water and steam, process operations and cleaning. IFF obtainedverification for absolute global Scope 2 GHG emissions.
VerifiedNo
Allocation methodAllocation based on the market value of products purchased
Please explain how you have identified the GHG source, including major limitations to this process and assumptions madeEnergy sources were identified according to the global infrastructure and operational systems. Natural gas, purchased electricity, process derived fuels, and purchasedsteam accounted for more than 90% of our global energy consumption in 2019. These are the main energy sources we use to heat and cool our buildings, to generate hotwater and steam; and for refrigeration, process operations and cleaning. Data is collected globally via an internet based system for capturing and calculating GHGemissions. Uncertainty could be due to human error, unit conversions, and estimation methodology. Our Scope 1 and 2 and data have been externally verified by the ERMCVS. Our Scope 3, Fuel- and energy-related activities (not included in Scopes 1 or 2) were calculated based on 100% primary data. The quantity of energy consumed foreach energy type, such as electricity or natural gas, is used as activity data to calculate emissions. Consumption by fuel type is multiplied by emission factors for each ofthe three activities included in this category. Emission factors for upstream emissions of purchased fuels are based on life-cycle analysis software. Emission factors forupstream emissions of purchased electricity are based on life-cycle analysis software for the US, and on UK Defra 2015 Guidelines for other countries. Emission factors forT&D losses are based on EPA’s eGRID database for the US, and on UK Defra 2015 Guidelines for other countries. GWPs are IPCC Fifth Assessment Report (AR5 - 100year). Going forward we will be evaluating data collection methods for other categories of Scope 3 emissions. For emissions from purchased goods and services and capitalgoods, corporate-wide global expense data was obtained from finance. The spend was mapped to corresponding industry sectors and then multiplied by cradle-to-gateemission factors by sector from UK Defra’s "2012 Guidelines to Defra / DECC's GHG Conversion Factors for Company Reporting", Annex 13. Upstream transportation anddistribution includes emissions associated with inbound shipments to our facilities, shipments between our facilities, and outbound shipments from our facilities that we payfor. For waste emissions, total weight of hazardous and non-hazardous waste generated from IFF’s total global production are used as activity data for this calculation.Waste is categorized by type of material and diversion method, including recycling, composting, incineration, and landfilling. The waste-type-specific method, described in"Technical Guidance for Calculating Scope 3 Emissions," is then applied using factors from EPA’s WARM model. For emissions from business travel, travel data is providedby our travel agency and includes global air and rail travel by cabin class and distance threshold for each trip. All these scope 3 emissions were calculated based on 100%primary data. Remaining relevant categories were estimated using the Quantis Scope 3 screening tool and other internal methods.
Requesting memberKAO Corporation
Scope of emissionsScope 3
Allocation levelBusiness unit (subsidiary company)
Allocation level detailThis calculation is based on legacy IFF emissions and excludes legacy Frutarom emissions as we work to complete our integration.
Emissions in metric tonnes of CO2e5947
Uncertainty (±%)10
Major sources of emissionsGHG emissions for scope 3 include upstream emissions from purchased goods and services, capital goods, purchased fuels and electricity, transmission and distributionlosses of purchased electricity and steam, upstream transportation and distribution, the waste generated within our operations, business travel, employee commuting,downstream transportation and distribution, processing of sold products, and end of life treatment of sold products.
VerifiedNo
Allocation methodAllocation based on the market value of products purchased
Please explain how you have identified the GHG source, including major limitations to this process and assumptions madeEnergy sources were identified according to the global infrastructure and operational systems. Natural gas, purchased electricity, process derived fuels, and purchasedsteam accounted for more than 90% of our global energy consumption in 2019. These are the main energy sources we use to heat and cool our buildings, to generate hotwater and steam; and for refrigeration, process operations and cleaning. Data is collected globally via an internet based system for capturing and calculating GHGemissions. Uncertainty could be due to human error, unit conversions, and estimation methodology. Our Scope 1 and 2 and data have been externally verified by the ERMCVS. Our Scope 3, Fuel- and energy-related activities (not included in Scopes 1 or 2) were calculated based on 100% primary data. The quantity of energy consumed foreach energy type, such as electricity or natural gas, is used as activity data to calculate emissions. Consumption by fuel type is multiplied by emission factors for each ofthe three activities included in this category. Emission factors for upstream emissions of purchased fuels are based on life-cycle analysis software. Emission factors forupstream emissions of purchased electricity are based on life-cycle analysis software for the US, and on UK Defra 2015 Guidelines for other countries. Emission factors forT&D losses are based on EPA’s eGRID database for the US, and on UK Defra 2015 Guidelines for other countries. GWPs are IPCC Fifth Assessment Report (AR5 - 100year). Going forward we will be evaluating data collection methods for other categories of Scope 3 emissions. For emissions from purchased goods and services and capitalgoods, corporate-wide global expense data was obtained from finance. The spend was mapped to corresponding industry sectors and then multiplied by cradle-to-gateemission factors by sector from UK Defra’s "2012 Guidelines to Defra / DECC's GHG Conversion Factors for Company Reporting", Annex 13. Upstream transportation and
CDP Page of 8058
distribution includes emissions associated with inbound shipments to our facilities, shipments between our facilities, and outbound shipments from our facilities that we payfor. For waste emissions, total weight of hazardous and non-hazardous waste generated from IFF’s total global production are used as activity data for this calculation.Waste is categorized by type of material and diversion method, including recycling, composting, incineration, and landfilling. The waste-type-specific method, described in"Technical Guidance for Calculating Scope 3 Emissions," is then applied using factors from EPA’s WARM model. For emissions from business travel, travel data is providedby our travel agency and includes global air and rail travel by cabin class and distance threshold for each trip. All these scope 3 emissions were calculated based on 100%primary data. Remaining relevant categories were estimated using the Quantis Scope 3 screening tool and other internal methods.
Requesting memberKellogg Company
Scope of emissionsScope 1
Allocation levelBusiness unit (subsidiary company)
Allocation level detailThis calculation is based on legacy IFF emissions and excludes legacy Frutarom emissions as we work to complete our integration.
Emissions in metric tonnes of CO2e512
Uncertainty (±%)5
Major sources of emissionsIFF operations use energy for heating and cooling of buildings, lighting, refrigeration, generating hot water and steam, process operations and cleaning. IFF obtainedverification for absolute global Scope 1 GHG emissions.
VerifiedNo
Allocation methodAllocation based on the market value of products purchased
Please explain how you have identified the GHG source, including major limitations to this process and assumptions madeEnergy sources were identified according to the global infrastructure and operational systems. Natural gas, purchased electricity, process derived fuels, and purchasedsteam accounted for more than 90% of our global energy consumption in 2019. These are the main energy sources we use to heat and cool our buildings, to generate hotwater and steam; and for refrigeration, process operations and cleaning. Data is collected globally via an internet based system for capturing and calculating GHGemissions. Uncertainty could be due to human error, unit conversions, and estimation methodology. Our Scope 1 and 2 and data have been externally verified by the ERMCVS. Our Scope 3, Fuel- and energy-related activities (not included in Scopes 1 or 2) were calculated based on 100% primary data. The quantity of energy consumed foreach energy type, such as electricity or natural gas, is used as activity data to calculate emissions. Consumption by fuel type is multiplied by emission factors for each ofthe three activities included in this category. Emission factors for upstream emissions of purchased fuels are based on life-cycle analysis software. Emission factors forupstream emissions of purchased electricity are based on life-cycle analysis software for the US, and on UK Defra 2015 Guidelines for other countries. Emission factors forT&D losses are based on EPA’s eGRID database for the US, and on UK Defra 2015 Guidelines for other countries. GWPs are IPCC Fifth Assessment Report (AR5 - 100year). Going forward we will be evaluating data collection methods for other categories of Scope 3 emissions. For emissions from purchased goods and services and capitalgoods, corporate-wide global expense data was obtained from finance. The spend was mapped to corresponding industry sectors and then multiplied by cradle-to-gateemission factors by sector from UK Defra’s "2012 Guidelines to Defra / DECC's GHG Conversion Factors for Company Reporting", Annex 13. Upstream transportation anddistribution includes emissions associated with inbound shipments to our facilities, shipments between our facilities, and outbound shipments from our facilities that we payfor. For waste emissions, total weight of hazardous and non-hazardous waste generated from IFF’s total global production are used as activity data for this calculation.Waste is categorized by type of material and diversion method, including recycling, composting, incineration, and landfilling. The waste-type-specific method, described in"Technical Guidance for Calculating Scope 3 Emissions," is then applied using factors from EPA’s WARM model. For emissions from business travel, travel data is providedby our travel agency and includes global air and rail travel by cabin class and distance threshold for each trip. All these scope 3 emissions were calculated based on 100%primary data. Remaining relevant categories were estimated using the Quantis Scope 3 screening tool and other internal methods.
Requesting memberKellogg Company
Scope of emissionsScope 2
Allocation levelBusiness unit (subsidiary company)
Allocation level detailThis calculation is based on legacy IFF emissions and excludes legacy Frutarom emissions as we work to complete our integration.
Emissions in metric tonnes of CO2e314
Uncertainty (±%)5
Major sources of emissionsIFF operations use energy for heating and cooling of buildings, lighting, refrigeration, generating hot water and steam, process operations and cleaning. IFF obtainedverification for absolute global Scope 2 GHG emissions.
VerifiedNo
Allocation methodAllocation based on the market value of products purchased
Please explain how you have identified the GHG source, including major limitations to this process and assumptions madeEnergy sources were identified according to the global infrastructure and operational systems. Natural gas, purchased electricity, process derived fuels, and purchasedsteam accounted for more than 90% of our global energy consumption in 2019. These are the main energy sources we use to heat and cool our buildings, to generate hotwater and steam; and for refrigeration, process operations and cleaning. Data is collected globally via an internet based system for capturing and calculating GHG
CDP Page of 8059
emissions. Uncertainty could be due to human error, unit conversions, and estimation methodology. Our Scope 1 and 2 and data have been externally verified by the ERMCVS. Our Scope 3, Fuel- and energy-related activities (not included in Scopes 1 or 2) were calculated based on 100% primary data. The quantity of energy consumed foreach energy type, such as electricity or natural gas, is used as activity data to calculate emissions. Consumption by fuel type is multiplied by emission factors for each ofthe three activities included in this category. Emission factors for upstream emissions of purchased fuels are based on life-cycle analysis software. Emission factors forupstream emissions of purchased electricity are based on life-cycle analysis software for the US, and on UK Defra 2015 Guidelines for other countries. Emission factors forT&D losses are based on EPA’s eGRID database for the US, and on UK Defra 2015 Guidelines for other countries. GWPs are IPCC Fifth Assessment Report (AR5 - 100year). Going forward we will be evaluating data collection methods for other categories of Scope 3 emissions. For emissions from purchased goods and services and capitalgoods, corporate-wide global expense data was obtained from finance. The spend was mapped to corresponding industry sectors and then multiplied by cradle-to-gateemission factors by sector from UK Defra’s "2012 Guidelines to Defra / DECC's GHG Conversion Factors for Company Reporting", Annex 13. Upstream transportation anddistribution includes emissions associated with inbound shipments to our facilities, shipments between our facilities, and outbound shipments from our facilities that we payfor. For waste emissions, total weight of hazardous and non-hazardous waste generated from IFF’s total global production are used as activity data for this calculation.Waste is categorized by type of material and diversion method, including recycling, composting, incineration, and landfilling. The waste-type-specific method, described in"Technical Guidance for Calculating Scope 3 Emissions," is then applied using factors from EPA’s WARM model. For emissions from business travel, travel data is providedby our travel agency and includes global air and rail travel by cabin class and distance threshold for each trip. All these scope 3 emissions were calculated based on 100%primary data. Remaining relevant categories were estimated using the Quantis Scope 3 screening tool and other internal methods.
Requesting memberKellogg Company
Scope of emissionsScope 3
Allocation levelBusiness unit (subsidiary company)
Allocation level detailThis calculation is based on legacy IFF emissions and excludes legacy Frutarom emissions as we work to complete our integration.
Emissions in metric tonnes of CO2e4586
Uncertainty (±%)10
Major sources of emissionsGHG emissions for scope 3 include upstream emissions from purchased goods and services, capital goods, purchased fuels and electricity, transmission and distributionlosses of purchased electricity and steam, upstream transportation and distribution, the waste generated within our operations, business travel, employee commuting,downstream transportation and distribution, processing of sold products, and end of life treatment of sold products.
VerifiedNo
Allocation methodAllocation based on the market value of products purchased
Please explain how you have identified the GHG source, including major limitations to this process and assumptions madeEnergy sources were identified according to the global infrastructure and operational systems. Natural gas, purchased electricity, process derived fuels, and purchasedsteam accounted for more than 90% of our global energy consumption in 2019. These are the main energy sources we use to heat and cool our buildings, to generate hotwater and steam; and for refrigeration, process operations and cleaning. Data is collected globally via an internet based system for capturing and calculating GHGemissions. Uncertainty could be due to human error, unit conversions, and estimation methodology. Our Scope 1 and 2 and data have been externally verified by the ERMCVS. Our Scope 3, Fuel- and energy-related activities (not included in Scopes 1 or 2) were calculated based on 100% primary data. The quantity of energy consumed foreach energy type, such as electricity or natural gas, is used as activity data to calculate emissions. Consumption by fuel type is multiplied by emission factors for each ofthe three activities included in this category. Emission factors for upstream emissions of purchased fuels are based on life-cycle analysis software. Emission factors forupstream emissions of purchased electricity are based on life-cycle analysis software for the US, and on UK Defra 2015 Guidelines for other countries. Emission factors forT&D losses are based on EPA’s eGRID database for the US, and on UK Defra 2015 Guidelines for other countries. GWPs are IPCC Fifth Assessment Report (AR5 - 100year). Going forward we will be evaluating data collection methods for other categories of Scope 3 emissions. For emissions from purchased goods and services and capitalgoods, corporate-wide global expense data was obtained from finance. The spend was mapped to corresponding industry sectors and then multiplied by cradle-to-gateemission factors by sector from UK Defra’s "2012 Guidelines to Defra / DECC's GHG Conversion Factors for Company Reporting", Annex 13. Upstream transportation anddistribution includes emissions associated with inbound shipments to our facilities, shipments between our facilities, and outbound shipments from our facilities that we payfor. For waste emissions, total weight of hazardous and non-hazardous waste generated from IFF’s total global production are used as activity data for this calculation.Waste is categorized by type of material and diversion method, including recycling, composting, incineration, and landfilling. The waste-type-specific method, described in"Technical Guidance for Calculating Scope 3 Emissions," is then applied using factors from EPA’s WARM model. For emissions from business travel, travel data is providedby our travel agency and includes global air and rail travel by cabin class and distance threshold for each trip. All these scope 3 emissions were calculated based on 100%primary data. Remaining relevant categories were estimated using the Quantis Scope 3 screening tool and other internal methods.
Requesting memberL'Oréal
Scope of emissionsScope 1
Allocation levelBusiness unit (subsidiary company)
Allocation level detailThis calculation is based on legacy IFF emissions and excludes legacy Frutarom emissions as we work to complete our integration.
Emissions in metric tonnes of CO2e2424
Uncertainty (±%)5
Major sources of emissionsIFF operations use energy for heating and cooling of buildings, lighting, refrigeration, generating hot water and steam, process operations and cleaning. IFF obtainedverification for absolute global Scope 1 GHG emissions.
CDP Page of 8060

VerifiedNo
Allocation methodAllocation based on the market value of products purchased
Please explain how you have identified the GHG source, including major limitations to this process and assumptions madeEnergy sources were identified according to the global infrastructure and operational systems. Natural gas, purchased electricity, process derived fuels, and purchasedsteam accounted for more than 90% of our global energy consumption in 2019. These are the main energy sources we use to heat and cool our buildings, to generate hotwater and steam; and for refrigeration, process operations and cleaning. Data is collected globally via an internet based system for capturing and calculating GHGemissions. Uncertainty could be due to human error, unit conversions, and estimation methodology. Our Scope 1 and 2 and data have been externally verified by the ERMCVS. Our Scope 3, Fuel- and energy-related activities (not included in Scopes 1 or 2) were calculated based on 100% primary data. The quantity of energy consumed foreach energy type, such as electricity or natural gas, is used as activity data to calculate emissions. Consumption by fuel type is multiplied by emission factors for each ofthe three activities included in this category. Emission factors for upstream emissions of purchased fuels are based on life-cycle analysis software. Emission factors forupstream emissions of purchased electricity are based on life-cycle analysis software for the US, and on UK Defra 2015 Guidelines for other countries. Emission factors forT&D losses are based on EPA’s eGRID database for the US, and on UK Defra 2015 Guidelines for other countries. GWPs are IPCC Fifth Assessment Report (AR5 - 100year). Going forward we will be evaluating data collection methods for other categories of Scope 3 emissions. For emissions from purchased goods and services and capitalgoods, corporate-wide global expense data was obtained from finance. The spend was mapped to corresponding industry sectors and then multiplied by cradle-to-gateemission factors by sector from UK Defra’s "2012 Guidelines to Defra / DECC's GHG Conversion Factors for Company Reporting", Annex 13. Upstream transportation anddistribution includes emissions associated with inbound shipments to our facilities, shipments between our facilities, and outbound shipments from our facilities that we payfor. For waste emissions, total weight of hazardous and non-hazardous waste generated from IFF’s total global production are used as activity data for this calculation.Waste is categorized by type of material and diversion method, including recycling, composting, incineration, and landfilling. The waste-type-specific method, described in"Technical Guidance for Calculating Scope 3 Emissions," is then applied using factors from EPA’s WARM model. For emissions from business travel, travel data is providedby our travel agency and includes global air and rail travel by cabin class and distance threshold for each trip. All these scope 3 emissions were calculated based on 100%primary data. Remaining relevant categories were estimated using the Quantis Scope 3 screening tool and other internal methods.
Requesting memberL'Oréal
Scope of emissionsScope 2
Allocation levelBusiness unit (subsidiary company)
Allocation level detailThis calculation is based on legacy IFF emissions and excludes legacy Frutarom emissions as we work to complete our integration.
Emissions in metric tonnes of CO2e1489
Uncertainty (±%)5
Major sources of emissionsIFF operations use energy for heating and cooling of buildings, lighting, refrigeration, generating hot water and steam, process operations and cleaning. IFF obtainedverification for absolute global Scope 2 GHG emissions.
VerifiedNo
Allocation methodAllocation based on the market value of products purchased
Please explain how you have identified the GHG source, including major limitations to this process and assumptions madeEnergy sources were identified according to the global infrastructure and operational systems. Natural gas, purchased electricity, process derived fuels, and purchasedsteam accounted for more than 90% of our global energy consumption in 2019. These are the main energy sources we use to heat and cool our buildings, to generate hotwater and steam; and for refrigeration, process operations and cleaning. Data is collected globally via an internet based system for capturing and calculating GHGemissions. Uncertainty could be due to human error, unit conversions, and estimation methodology. Our Scope 1 and 2 and data have been externally verified by the ERMCVS. Our Scope 3, Fuel- and energy-related activities (not included in Scopes 1 or 2) were calculated based on 100% primary data. The quantity of energy consumed foreach energy type, such as electricity or natural gas, is used as activity data to calculate emissions. Consumption by fuel type is multiplied by emission factors for each ofthe three activities included in this category. Emission factors for upstream emissions of purchased fuels are based on life-cycle analysis software. Emission factors forupstream emissions of purchased electricity are based on life-cycle analysis software for the US, and on UK Defra 2015 Guidelines for other countries. Emission factors forT&D losses are based on EPA’s eGRID database for the US, and on UK Defra 2015 Guidelines for other countries. GWPs are IPCC Fifth Assessment Report (AR5 - 100year). Going forward we will be evaluating data collection methods for other categories of Scope 3 emissions. For emissions from purchased goods and services and capitalgoods, corporate-wide global expense data was obtained from finance. The spend was mapped to corresponding industry sectors and then multiplied by cradle-to-gateemission factors by sector from UK Defra’s "2012 Guidelines to Defra / DECC's GHG Conversion Factors for Company Reporting", Annex 13. Upstream transportation anddistribution includes emissions associated with inbound shipments to our facilities, shipments between our facilities, and outbound shipments from our facilities that we payfor. For waste emissions, total weight of hazardous and non-hazardous waste generated from IFF’s total global production are used as activity data for this calculation.Waste is categorized by type of material and diversion method, including recycling, composting, incineration, and landfilling. The waste-type-specific method, described in"Technical Guidance for Calculating Scope 3 Emissions," is then applied using factors from EPA’s WARM model. For emissions from business travel, travel data is providedby our travel agency and includes global air and rail travel by cabin class and distance threshold for each trip. All these scope 3 emissions were calculated based on 100%primary data. Remaining relevant categories were estimated using the Quantis Scope 3 screening tool and other internal methods.
Requesting memberL'Oréal
Scope of emissionsScope 3
Allocation levelBusiness unit (subsidiary company)
Allocation level detailThis calculation is based on legacy IFF emissions and excludes legacy Frutarom emissions as we work to complete our integration.
CDP Page of 8061
Emissions in metric tonnes of CO2e21722
Uncertainty (±%)10
Major sources of emissionsGHG emissions for scope 3 include upstream emissions from purchased goods and services, capital goods, purchased fuels and electricity, transmission and distributionlosses of purchased electricity and steam, upstream transportation and distribution, the waste generated within our operations, business travel, employee commuting,downstream transportation and distribution, processing of sold products, and end of life treatment of sold products.
VerifiedNo
Allocation methodAllocation based on the market value of products purchased
Please explain how you have identified the GHG source, including major limitations to this process and assumptions madeEnergy sources were identified according to the global infrastructure and operational systems. Natural gas, purchased electricity, process derived fuels, and purchasedsteam accounted for more than 90% of our global energy consumption in 2019. These are the main energy sources we use to heat and cool our buildings, to generate hotwater and steam; and for refrigeration, process operations and cleaning. Data is collected globally via an internet based system for capturing and calculating GHGemissions. Uncertainty could be due to human error, unit conversions, and estimation methodology. Our Scope 1 and 2 and data have been externally verified by the ERMCVS. Our Scope 3, Fuel- and energy-related activities (not included in Scopes 1 or 2) were calculated based on 100% primary data. The quantity of energy consumed foreach energy type, such as electricity or natural gas, is used as activity data to calculate emissions. Consumption by fuel type is multiplied by emission factors for each ofthe three activities included in this category. Emission factors for upstream emissions of purchased fuels are based on life-cycle analysis software. Emission factors forupstream emissions of purchased electricity are based on life-cycle analysis software for the US, and on UK Defra 2015 Guidelines for other countries. Emission factors forT&D losses are based on EPA’s eGRID database for the US, and on UK Defra 2015 Guidelines for other countries. GWPs are IPCC Fifth Assessment Report (AR5 - 100year). Going forward we will be evaluating data collection methods for other categories of Scope 3 emissions. For emissions from purchased goods and services and capitalgoods, corporate-wide global expense data was obtained from finance. The spend was mapped to corresponding industry sectors and then multiplied by cradle-to-gateemission factors by sector from UK Defra’s "2012 Guidelines to Defra / DECC's GHG Conversion Factors for Company Reporting", Annex 13. Upstream transportation anddistribution includes emissions associated with inbound shipments to our facilities, shipments between our facilities, and outbound shipments from our facilities that we payfor. For waste emissions, total weight of hazardous and non-hazardous waste generated from IFF’s total global production are used as activity data for this calculation.Waste is categorized by type of material and diversion method, including recycling, composting, incineration, and landfilling. The waste-type-specific method, described in"Technical Guidance for Calculating Scope 3 Emissions," is then applied using factors from EPA’s WARM model. For emissions from business travel, travel data is providedby our travel agency and includes global air and rail travel by cabin class and distance threshold for each trip. All these scope 3 emissions were calculated based on 100%primary data. Remaining relevant categories were estimated using the Quantis Scope 3 screening tool and other internal methods.
Requesting memberPepsiCo, Inc.
Scope of emissionsScope 1
Allocation levelBusiness unit (subsidiary company)
Allocation level detailThis calculation is based on legacy IFF emissions and excludes legacy Frutarom emissions as we work to complete our integration.
Emissions in metric tonnes of CO2e7194
Uncertainty (±%)5
Major sources of emissionsIFF operations use energy for heating and cooling of buildings, lighting, refrigeration, generating hot water and steam, process operations and cleaning. IFF obtainedverification for absolute global Scope 1 GHG emissions.
VerifiedNo
Allocation methodAllocation based on the market value of products purchased
Please explain how you have identified the GHG source, including major limitations to this process and assumptions madeEnergy sources were identified according to the global infrastructure and operational systems. Natural gas, purchased electricity, process derived fuels, and purchasedsteam accounted for more than 90% of our global energy consumption in 2019. These are the main energy sources we use to heat and cool our buildings, to generate hotwater and steam; and for refrigeration, process operations and cleaning. Data is collected globally via an internet based system for capturing and calculating GHGemissions. Uncertainty could be due to human error, unit conversions, and estimation methodology. Our Scope 1 and 2 and data have been externally verified by the ERMCVS. Our Scope 3, Fuel- and energy-related activities (not included in Scopes 1 or 2) were calculated based on 100% primary data. The quantity of energy consumed foreach energy type, such as electricity or natural gas, is used as activity data to calculate emissions. Consumption by fuel type is multiplied by emission factors for each ofthe three activities included in this category. Emission factors for upstream emissions of purchased fuels are based on life-cycle analysis software. Emission factors forupstream emissions of purchased electricity are based on life-cycle analysis software for the US, and on UK Defra 2015 Guidelines for other countries. Emission factors forT&D losses are based on EPA’s eGRID database for the US, and on UK Defra 2015 Guidelines for other countries. GWPs are IPCC Fifth Assessment Report (AR5 - 100year). Going forward we will be evaluating data collection methods for other categories of Scope 3 emissions. For emissions from purchased goods and services and capitalgoods, corporate-wide global expense data was obtained from finance. The spend was mapped to corresponding industry sectors and then multiplied by cradle-to-gateemission factors by sector from UK Defra’s "2012 Guidelines to Defra / DECC's GHG Conversion Factors for Company Reporting", Annex 13. Upstream transportation anddistribution includes emissions associated with inbound shipments to our facilities, shipments between our facilities, and outbound shipments from our facilities that we payfor. For waste emissions, total weight of hazardous and non-hazardous waste generated from IFF’s total global production are used as activity data for this calculation.Waste is categorized by type of material and diversion method, including recycling, composting, incineration, and landfilling. The waste-type-specific method, described in"Technical Guidance for Calculating Scope 3 Emissions," is then applied using factors from EPA’s WARM model. For emissions from business travel, travel data is providedby our travel agency and includes global air and rail travel by cabin class and distance threshold for each trip. All these scope 3 emissions were calculated based on 100%primary data. Remaining relevant categories were estimated using the Quantis Scope 3 screening tool and other internal methods.
Requesting member
CDP Page of 8062
Requesting memberPepsiCo, Inc.
Scope of emissionsScope 2
Allocation levelBusiness unit (subsidiary company)
Allocation level detailThis calculation is based on legacy IFF emissions and excludes legacy Frutarom emissions as we work to complete our integration.
Emissions in metric tonnes of CO2e4418
Uncertainty (±%)5
Major sources of emissionsIFF operations use energy for heating and cooling of buildings, lighting, refrigeration, generating hot water and steam, process operations and cleaning. IFF obtainedverification for absolute global Scope 2 GHG emissions.
VerifiedNo
Allocation methodAllocation based on the market value of products purchased
Please explain how you have identified the GHG source, including major limitations to this process and assumptions madeEnergy sources were identified according to the global infrastructure and operational systems. Natural gas, purchased electricity, process derived fuels, and purchasedsteam accounted for more than 90% of our global energy consumption in 2019. These are the main energy sources we use to heat and cool our buildings, to generate hotwater and steam; and for refrigeration, process operations and cleaning. Data is collected globally via an internet based system for capturing and calculating GHGemissions. Uncertainty could be due to human error, unit conversions, and estimation methodology. Our Scope 1 and 2 and data have been externally verified by the ERMCVS. Our Scope 3, Fuel- and energy-related activities (not included in Scopes 1 or 2) were calculated based on 100% primary data. The quantity of energy consumed foreach energy type, such as electricity or natural gas, is used as activity data to calculate emissions. Consumption by fuel type is multiplied by emission factors for each ofthe three activities included in this category. Emission factors for upstream emissions of purchased fuels are based on life-cycle analysis software. Emission factors forupstream emissions of purchased electricity are based on life-cycle analysis software for the US, and on UK Defra 2015 Guidelines for other countries. Emission factors forT&D losses are based on EPA’s eGRID database for the US, and on UK Defra 2015 Guidelines for other countries. GWPs are IPCC Fifth Assessment Report (AR5 - 100year). Going forward we will be evaluating data collection methods for other categories of Scope 3 emissions. For emissions from purchased goods and services and capitalgoods, corporate-wide global expense data was obtained from finance. The spend was mapped to corresponding industry sectors and then multiplied by cradle-to-gateemission factors by sector from UK Defra’s "2012 Guidelines to Defra / DECC's GHG Conversion Factors for Company Reporting", Annex 13. Upstream transportation anddistribution includes emissions associated with inbound shipments to our facilities, shipments between our facilities, and outbound shipments from our facilities that we payfor. For waste emissions, total weight of hazardous and non-hazardous waste generated from IFF’s total global production are used as activity data for this calculation.Waste is categorized by type of material and diversion method, including recycling, composting, incineration, and landfilling. The waste-type-specific method, described in"Technical Guidance for Calculating Scope 3 Emissions," is then applied using factors from EPA’s WARM model. For emissions from business travel, travel data is providedby our travel agency and includes global air and rail travel by cabin class and distance threshold for each trip. All these scope 3 emissions were calculated based on 100%primary data. Remaining relevant categories were estimated using the Quantis Scope 3 screening tool and other internal methods.
Requesting memberPepsiCo, Inc.
Scope of emissionsScope 3
Allocation levelBusiness unit (subsidiary company)
Allocation level detailThis calculation is based on legacy IFF emissions and excludes legacy Frutarom emissions as we work to complete our integration.
Emissions in metric tonnes of CO2e64460
Uncertainty (±%)10
Major sources of emissionsGHG emissions for scope 3 include upstream emissions from purchased goods and services, capital goods, purchased fuels and electricity, transmission and distributionlosses of purchased electricity and steam, upstream transportation and distribution, the waste generated within our operations, business travel, employee commuting,downstream transportation and distribution, processing of sold products, and end of life treatment of sold products.
VerifiedNo
Allocation methodAllocation based on the market value of products purchased
Please explain how you have identified the GHG source, including major limitations to this process and assumptions madeEnergy sources were identified according to the global infrastructure and operational systems. Natural gas, purchased electricity, process derived fuels, and purchasedsteam accounted for more than 90% of our global energy consumption in 2019. These are the main energy sources we use to heat and cool our buildings, to generate hotwater and steam; and for refrigeration, process operations and cleaning. Data is collected globally via an internet based system for capturing and calculating GHGemissions. Uncertainty could be due to human error, unit conversions, and estimation methodology. Our Scope 1 and 2 and data have been externally verified by the ERMCVS. Our Scope 3, Fuel- and energy-related activities (not included in Scopes 1 or 2) were calculated based on 100% primary data. The quantity of energy consumed foreach energy type, such as electricity or natural gas, is used as activity data to calculate emissions. Consumption by fuel type is multiplied by emission factors for each ofthe three activities included in this category. Emission factors for upstream emissions of purchased fuels are based on life-cycle analysis software. Emission factors forupstream emissions of purchased electricity are based on life-cycle analysis software for the US, and on UK Defra 2015 Guidelines for other countries. Emission factors forT&D losses are based on EPA’s eGRID database for the US, and on UK Defra 2015 Guidelines for other countries. GWPs are IPCC Fifth Assessment Report (AR5 - 100year). Going forward we will be evaluating data collection methods for other categories of Scope 3 emissions. For emissions from purchased goods and services and capital
CDP Page of 8063
goods, corporate-wide global expense data was obtained from finance. The spend was mapped to corresponding industry sectors and then multiplied by cradle-to-gateemission factors by sector from UK Defra’s "2012 Guidelines to Defra / DECC's GHG Conversion Factors for Company Reporting", Annex 13. Upstream transportation anddistribution includes emissions associated with inbound shipments to our facilities, shipments between our facilities, and outbound shipments from our facilities that we payfor. For waste emissions, total weight of hazardous and non-hazardous waste generated from IFF’s total global production are used as activity data for this calculation.Waste is categorized by type of material and diversion method, including recycling, composting, incineration, and landfilling. The waste-type-specific method, described in"Technical Guidance for Calculating Scope 3 Emissions," is then applied using factors from EPA’s WARM model. For emissions from business travel, travel data is providedby our travel agency and includes global air and rail travel by cabin class and distance threshold for each trip. All these scope 3 emissions were calculated based on 100%primary data. Remaining relevant categories were estimated using the Quantis Scope 3 screening tool and other internal methods.
Requesting memberUnilever plc
Scope of emissionsScope 1
Allocation levelBusiness unit (subsidiary company)
Allocation level detailThis calculation is based on legacy IFF emissions and excludes legacy Frutarom emissions as we work to complete our integration.
Emissions in metric tonnes of CO2e11013
Uncertainty (±%)5
Major sources of emissionsIFF operations use energy for heating and cooling of buildings, lighting, refrigeration, generating hot water and steam, process operations and cleaning. IFF obtainedverification for absolute global Scope 1 GHG emissions.
VerifiedNo
Allocation methodAllocation based on the market value of products purchased
Please explain how you have identified the GHG source, including major limitations to this process and assumptions madeEnergy sources were identified according to the global infrastructure and operational systems. Natural gas, purchased electricity, process derived fuels, and purchasedsteam accounted for more than 90% of our global energy consumption in 2019. These are the main energy sources we use to heat and cool our buildings, to generate hotwater and steam; and for refrigeration, process operations and cleaning. Data is collected globally via an internet based system for capturing and calculating GHGemissions. Uncertainty could be due to human error, unit conversions, and estimation methodology. Our Scope 1 and 2 and data have been externally verified by the ERMCVS. Our Scope 3, Fuel- and energy-related activities (not included in Scopes 1 or 2) were calculated based on 100% primary data. The quantity of energy consumed foreach energy type, such as electricity or natural gas, is used as activity data to calculate emissions. Consumption by fuel type is multiplied by emission factors for each ofthe three activities included in this category. Emission factors for upstream emissions of purchased fuels are based on life-cycle analysis software. Emission factors forupstream emissions of purchased electricity are based on life-cycle analysis software for the US, and on UK Defra 2015 Guidelines for other countries. Emission factors forT&D losses are based on EPA’s eGRID database for the US, and on UK Defra 2015 Guidelines for other countries. GWPs are IPCC Fifth Assessment Report (AR5 - 100year). Going forward we will be evaluating data collection methods for other categories of Scope 3 emissions. For emissions from purchased goods and services and capitalgoods, corporate-wide global expense data was obtained from finance. The spend was mapped to corresponding industry sectors and then multiplied by cradle-to-gateemission factors by sector from UK Defra’s "2012 Guidelines to Defra / DECC's GHG Conversion Factors for Company Reporting", Annex 13. Upstream transportation anddistribution includes emissions associated with inbound shipments to our facilities, shipments between our facilities, and outbound shipments from our facilities that we payfor. For waste emissions, total weight of hazardous and non-hazardous waste generated from IFF’s total global production are used as activity data for this calculation.Waste is categorized by type of material and diversion method, including recycling, composting, incineration, and landfilling. The waste-type-specific method, described in"Technical Guidance for Calculating Scope 3 Emissions," is then applied using factors from EPA’s WARM model. For emissions from business travel, travel data is providedby our travel agency and includes global air and rail travel by cabin class and distance threshold for each trip. All these scope 3 emissions were calculated based on 100%primary data. Remaining relevant categories were estimated using the Quantis Scope 3 screening tool and other internal methods.
Requesting memberUnilever plc
Scope of emissionsScope 2
Allocation levelBusiness unit (subsidiary company)
Allocation level detailThis calculation is based on legacy IFF emissions and excludes legacy Frutarom emissions as we work to complete our integration.
Emissions in metric tonnes of CO2e6764
Uncertainty (±%)5
Major sources of emissionsIFF operations use energy for heating and cooling of buildings, lighting, refrigeration, generating hot water and steam, process operations and cleaning. IFF obtainedverification for absolute global Scope 2 GHG emissions.
VerifiedNo
Allocation methodAllocation based on the market value of products purchased
Please explain how you have identified the GHG source, including major limitations to this process and assumptions madeEnergy sources were identified according to the global infrastructure and operational systems. Natural gas, purchased electricity, process derived fuels, and purchased
CDP Page of 8064
steam accounted for more than 90% of our global energy consumption in 2019. These are the main energy sources we use to heat and cool our buildings, to generate hotwater and steam; and for refrigeration, process operations and cleaning. Data is collected globally via an internet based system for capturing and calculating GHGemissions. Uncertainty could be due to human error, unit conversions, and estimation methodology. Our Scope 1 and 2 and data have been externally verified by the ERMCVS. Our Scope 3, Fuel- and energy-related activities (not included in Scopes 1 or 2) were calculated based on 100% primary data. The quantity of energy consumed foreach energy type, such as electricity or natural gas, is used as activity data to calculate emissions. Consumption by fuel type is multiplied by emission factors for each ofthe three activities included in this category. Emission factors for upstream emissions of purchased fuels are based on life-cycle analysis software. Emission factors forupstream emissions of purchased electricity are based on life-cycle analysis software for the US, and on UK Defra 2015 Guidelines for other countries. Emission factors forT&D losses are based on EPA’s eGRID database for the US, and on UK Defra 2015 Guidelines for other countries. GWPs are IPCC Fifth Assessment Report (AR5 - 100year). Going forward we will be evaluating data collection methods for other categories of Scope 3 emissions. For emissions from purchased goods and services and capitalgoods, corporate-wide global expense data was obtained from finance. The spend was mapped to corresponding industry sectors and then multiplied by cradle-to-gateemission factors by sector from UK Defra’s "2012 Guidelines to Defra / DECC's GHG Conversion Factors for Company Reporting", Annex 13. Upstream transportation anddistribution includes emissions associated with inbound shipments to our facilities, shipments between our facilities, and outbound shipments from our facilities that we payfor. For waste emissions, total weight of hazardous and non-hazardous waste generated from IFF’s total global production are used as activity data for this calculation.Waste is categorized by type of material and diversion method, including recycling, composting, incineration, and landfilling. The waste-type-specific method, described in"Technical Guidance for Calculating Scope 3 Emissions," is then applied using factors from EPA’s WARM model. For emissions from business travel, travel data is providedby our travel agency and includes global air and rail travel by cabin class and distance threshold for each trip. All these scope 3 emissions were calculated based on 100%primary data. Remaining relevant categories were estimated using the Quantis Scope 3 screening tool and other internal methods.
Requesting memberUnilever plc
Scope of emissionsScope 3
Allocation levelBusiness unit (subsidiary company)
Allocation level detailThis calculation is based on legacy IFF emissions and excludes legacy Frutarom emissions as we work to complete our integration.
Emissions in metric tonnes of CO2e98688
Uncertainty (±%)10
Major sources of emissionsGHG emissions for scope 3 include upstream emissions from purchased goods and services, capital goods, purchased fuels and electricity, transmission and distributionlosses of purchased electricity and steam, upstream transportation and distribution, the waste generated within our operations, business travel, employee commuting,downstream transportation and distribution, processing of sold products, and end of life treatment of sold products.
VerifiedNo
Allocation methodAllocation based on the market value of products purchased
Please explain how you have identified the GHG source, including major limitations to this process and assumptions madeEnergy sources were identified according to the global infrastructure and operational systems. Natural gas, purchased electricity, process derived fuels, and purchasedsteam accounted for more than 90% of our global energy consumption in 2019. These are the main energy sources we use to heat and cool our buildings, to generate hotwater and steam; and for refrigeration, process operations and cleaning. Data is collected globally via an internet based system for capturing and calculating GHGemissions. Uncertainty could be due to human error, unit conversions, and estimation methodology. Our Scope 1 and 2 and data have been externally verified by the ERMCVS. Our Scope 3, Fuel- and energy-related activities (not included in Scopes 1 or 2) were calculated based on 100% primary data. The quantity of energy consumed foreach energy type, such as electricity or natural gas, is used as activity data to calculate emissions. Consumption by fuel type is multiplied by emission factors for each ofthe three activities included in this category. Emission factors for upstream emissions of purchased fuels are based on life-cycle analysis software. Emission factors forupstream emissions of purchased electricity are based on life-cycle analysis software for the US, and on UK Defra 2015 Guidelines for other countries. Emission factors forT&D losses are based on EPA’s eGRID database for the US, and on UK Defra 2015 Guidelines for other countries. GWPs are IPCC Fifth Assessment Report (AR5 - 100year). Going forward we will be evaluating data collection methods for other categories of Scope 3 emissions. For emissions from purchased goods and services and capitalgoods, corporate-wide global expense data was obtained from finance. The spend was mapped to corresponding industry sectors and then multiplied by cradle-to-gateemission factors by sector from UK Defra’s "2012 Guidelines to Defra / DECC's GHG Conversion Factors for Company Reporting", Annex 13. Upstream transportation anddistribution includes emissions associated with inbound shipments to our facilities, shipments between our facilities, and outbound shipments from our facilities that we payfor. For waste emissions, total weight of hazardous and non-hazardous waste generated from IFF’s total global production are used as activity data for this calculation.Waste is categorized by type of material and diversion method, including recycling, composting, incineration, and landfilling. The waste-type-specific method, described in"Technical Guidance for Calculating Scope 3 Emissions," is then applied using factors from EPA’s WARM model. For emissions from business travel, travel data is providedby our travel agency and includes global air and rail travel by cabin class and distance threshold for each trip. All these scope 3 emissions were calculated based on 100%primary data. Remaining relevant categories were estimated using the Quantis Scope 3 screening tool and other internal methods.
Requesting memberPlease select
Scope of emissionsPlease select
Allocation levelPlease select
Allocation level detail<Not Applicable>
Emissions in metric tonnes of CO2e
Uncertainty (±%)
Major sources of emissions
Verified
CDP Page of 8065
Please select
Allocation methodPlease select
Please explain how you have identified the GHG source, including major limitations to this process and assumptions made
Requesting memberS.C. Johnson & Son, Inc.
Scope of emissionsScope 1
Allocation levelBusiness unit (subsidiary company)
Allocation level detailThis calculation is based on legacy IFF emissions and excludes legacy Frutarom emissions as we work to complete our integration.
Emissions in metric tonnes of CO2e192
Uncertainty (±%)5
Major sources of emissionsIFF operations use energy for heating and cooling of buildings, lighting, refrigeration, generating hot water and steam, process operations and cleaning. IFF obtainedverification for absolute global Scope 1 GHG emissions.
VerifiedNo
Allocation methodAllocation based on the market value of products purchased
Please explain how you have identified the GHG source, including major limitations to this process and assumptions madeEnergy sources were identified according to the global infrastructure and operational systems. Natural gas, purchased electricity, process derived fuels, and purchasedsteam accounted for more than 90% of our global energy consumption in 2019. These are the main energy sources we use to heat and cool our buildings, to generate hotwater and steam; and for refrigeration, process operations and cleaning. Data is collected globally via an internet based system for capturing and calculating GHGemissions. Uncertainty could be due to human error, unit conversions, and estimation methodology. Our Scope 1 and 2 and data have been externally verified by the ERMCVS. Our Scope 3, Fuel- and energy-related activities (not included in Scopes 1 or 2) were calculated based on 100% primary data. The quantity of energy consumed foreach energy type, such as electricity or natural gas, is used as activity data to calculate emissions. Consumption by fuel type is multiplied by emission factors for each ofthe three activities included in this category. Emission factors for upstream emissions of purchased fuels are based on life-cycle analysis software. Emission factors forupstream emissions of purchased electricity are based on life-cycle analysis software for the US, and on UK Defra 2015 Guidelines for other countries. Emission factors forT&D losses are based on EPA’s eGRID database for the US, and on UK Defra 2015 Guidelines for other countries. GWPs are IPCC Fifth Assessment Report (AR5 - 100year). Going forward we will be evaluating data collection methods for other categories of Scope 3 emissions. For emissions from purchased goods and services and capitalgoods, corporate-wide global expense data was obtained from finance. The spend was mapped to corresponding industry sectors and then multiplied by cradle-to-gateemission factors by sector from UK Defra’s "2012 Guidelines to Defra / DECC's GHG Conversion Factors for Company Reporting", Annex 13. Upstream transportation anddistribution includes emissions associated with inbound shipments to our facilities, shipments between our facilities, and outbound shipments from our facilities that we payfor. For waste emissions, total weight of hazardous and non-hazardous waste generated from IFF’s total global production are used as activity data for this calculation.Waste is categorized by type of material and diversion method, including recycling, composting, incineration, and landfilling. The waste-type-specific method, described in"Technical Guidance for Calculating Scope 3 Emissions," is then applied using factors from EPA’s WARM model. For emissions from business travel, travel data is providedby our travel agency and includes global air and rail travel by cabin class and distance threshold for each trip. All these scope 3 emissions were calculated based on 100%primary data. Remaining relevant categories were estimated using the Quantis Scope 3 screening tool and other internal methods.
Requesting memberS.C. Johnson & Son, Inc.
Scope of emissionsScope 2
Allocation levelBusiness unit (subsidiary company)
Allocation level detailThis calculation is based on legacy IFF emissions and excludes legacy Frutarom emissions as we work to complete our integration.
Emissions in metric tonnes of CO2e118
Uncertainty (±%)5
Major sources of emissionsIFF operations use energy for heating and cooling of buildings, lighting, refrigeration, generating hot water and steam, process operations and cleaning. IFF obtainedverification for absolute global Scope 2 GHG emissions.
VerifiedNo
Allocation methodAllocation based on the market value of products purchased
Please explain how you have identified the GHG source, including major limitations to this process and assumptions madeEnergy sources were identified according to the global infrastructure and operational systems. Natural gas, purchased electricity, process derived fuels, and purchasedsteam accounted for more than 90% of our global energy consumption in 2019. These are the main energy sources we use to heat and cool our buildings, to generate hotwater and steam; and for refrigeration, process operations and cleaning. Data is collected globally via an internet based system for capturing and calculating GHGemissions. Uncertainty could be due to human error, unit conversions, and estimation methodology. Our Scope 1 and 2 and data have been externally verified by the ERM
CDP Page of 8066
CVS. Our Scope 3, Fuel- and energy-related activities (not included in Scopes 1 or 2) were calculated based on 100% primary data. The quantity of energy consumed foreach energy type, such as electricity or natural gas, is used as activity data to calculate emissions. Consumption by fuel type is multiplied by emission factors for each ofthe three activities included in this category. Emission factors for upstream emissions of purchased fuels are based on life-cycle analysis software. Emission factors forupstream emissions of purchased electricity are based on life-cycle analysis software for the US, and on UK Defra 2015 Guidelines for other countries. Emission factors forT&D losses are based on EPA’s eGRID database for the US, and on UK Defra 2015 Guidelines for other countries. GWPs are IPCC Fifth Assessment Report (AR5 - 100year). Going forward we will be evaluating data collection methods for other categories of Scope 3 emissions. For emissions from purchased goods and services and capitalgoods, corporate-wide global expense data was obtained from finance. The spend was mapped to corresponding industry sectors and then multiplied by cradle-to-gateemission factors by sector from UK Defra’s "2012 Guidelines to Defra / DECC's GHG Conversion Factors for Company Reporting", Annex 13. Upstream transportation anddistribution includes emissions associated with inbound shipments to our facilities, shipments between our facilities, and outbound shipments from our facilities that we payfor. For waste emissions, total weight of hazardous and non-hazardous waste generated from IFF’s total global production are used as activity data for this calculation.Waste is categorized by type of material and diversion method, including recycling, composting, incineration, and landfilling. The waste-type-specific method, described in"Technical Guidance for Calculating Scope 3 Emissions," is then applied using factors from EPA’s WARM model. For emissions from business travel, travel data is providedby our travel agency and includes global air and rail travel by cabin class and distance threshold for each trip. All these scope 3 emissions were calculated based on 100%primary data. Remaining relevant categories were estimated using the Quantis Scope 3 screening tool and other internal methods.
Requesting memberS.C. Johnson & Son, Inc.
Scope of emissionsScope 3
Allocation levelBusiness unit (subsidiary company)
Allocation level detailThis calculation is based on legacy IFF emissions and excludes legacy Frutarom emissions as we work to complete our integration.
Emissions in metric tonnes of CO2e1718
Uncertainty (±%)10
Major sources of emissionsGHG emissions for scope 3 include upstream emissions from purchased goods and services, capital goods, purchased fuels and electricity, transmission and distributionlosses of purchased electricity and steam, upstream transportation and distribution, the waste generated within our operations, business travel, employee commuting,downstream transportation and distribution, processing of sold products, and end of life treatment of sold products.
VerifiedNo
Allocation methodAllocation based on the market value of products purchased
Please explain how you have identified the GHG source, including major limitations to this process and assumptions madeEnergy sources were identified according to the global infrastructure and operational systems. Natural gas, purchased electricity, process derived fuels, and purchasedsteam accounted for more than 90% of our global energy consumption in 2019. These are the main energy sources we use to heat and cool our buildings, to generate hotwater and steam; and for refrigeration, process operations and cleaning. Data is collected globally via an internet based system for capturing and calculating GHGemissions. Uncertainty could be due to human error, unit conversions, and estimation methodology. Our Scope 1 and 2 and data have been externally verified by the ERMCVS. Our Scope 3, Fuel- and energy-related activities (not included in Scopes 1 or 2) were calculated based on 100% primary data. The quantity of energy consumed foreach energy type, such as electricity or natural gas, is used as activity data to calculate emissions. Consumption by fuel type is multiplied by emission factors for each ofthe three activities included in this category. Emission factors for upstream emissions of purchased fuels are based on life-cycle analysis software. Emission factors forupstream emissions of purchased electricity are based on life-cycle analysis software for the US, and on UK Defra 2015 Guidelines for other countries. Emission factors forT&D losses are based on EPA’s eGRID database for the US, and on UK Defra 2015 Guidelines for other countries. GWPs are IPCC Fifth Assessment Report (AR5 - 100year). Going forward we will be evaluating data collection methods for other categories of Scope 3 emissions. For emissions from purchased goods and services and capitalgoods, corporate-wide global expense data was obtained from finance. The spend was mapped to corresponding industry sectors and then multiplied by cradle-to-gateemission factors by sector from UK Defra’s "2012 Guidelines to Defra / DECC's GHG Conversion Factors for Company Reporting", Annex 13. Upstream transportation anddistribution includes emissions associated with inbound shipments to our facilities, shipments between our facilities, and outbound shipments from our facilities that we payfor. For waste emissions, total weight of hazardous and non-hazardous waste generated from IFF’s total global production are used as activity data for this calculation.Waste is categorized by type of material and diversion method, including recycling, composting, incineration, and landfilling. The waste-type-specific method, described in"Technical Guidance for Calculating Scope 3 Emissions," is then applied using factors from EPA’s WARM model. For emissions from business travel, travel data is providedby our travel agency and includes global air and rail travel by cabin class and distance threshold for each trip. All these scope 3 emissions were calculated based on 100%primary data. Remaining relevant categories were estimated using the Quantis Scope 3 screening tool and other internal methods.
Requesting memberAjinomoto Co.Inc.
Scope of emissionsScope 1
Allocation levelBusiness unit (subsidiary company)
Allocation level detailThis calculation is based on legacy IFF emissions and excludes legacy Frutarom emissions as we work to complete our integration.
Emissions in metric tonnes of CO2e14
Uncertainty (±%)5
Major sources of emissionsIFF operations use energy for heating and cooling of buildings, lighting, refrigeration, generating hot water and steam, process operations and cleaning. IFF obtainedverification for absolute global Scope 1 GHG emissions.
CDP Page of 8067
VerifiedNo
Allocation methodAllocation based on the market value of products purchased
Please explain how you have identified the GHG source, including major limitations to this process and assumptions madeEnergy sources were identified according to the global infrastructure and operational systems. Natural gas, purchased electricity, process derived fuels, and purchasedsteam accounted for more than 90% of our global energy consumption in 2019. These are the main energy sources we use to heat and cool our buildings, to generate hotwater and steam; and for refrigeration, process operations and cleaning. Data is collected globally via an internet based system for capturing and calculating GHGemissions. Uncertainty could be due to human error, unit conversions, and estimation methodology. Our Scope 1 and 2 and data have been externally verified by the ERMCVS. Our Scope 3, Fuel- and energy-related activities (not included in Scopes 1 or 2) were calculated based on 100% primary data. The quantity of energy consumed foreach energy type, such as electricity or natural gas, is used as activity data to calculate emissions. Consumption by fuel type is multiplied by emission factors for each ofthe three activities included in this category. Emission factors for upstream emissions of purchased fuels are based on life-cycle analysis software. Emission factors forupstream emissions of purchased electricity are based on life-cycle analysis software for the US, and on UK Defra 2015 Guidelines for other countries. Emission factors forT&D losses are based on EPA’s eGRID database for the US, and on UK Defra 2015 Guidelines for other countries. GWPs are IPCC Fifth Assessment Report (AR5 - 100year). Going forward we will be evaluating data collection methods for other categories of Scope 3 emissions. For emissions from purchased goods and services and capitalgoods, corporate-wide global expense data was obtained from finance. The spend was mapped to corresponding industry sectors and then multiplied by cradle-to-gateemission factors by sector from UK Defra’s "2012 Guidelines to Defra / DECC's GHG Conversion Factors for Company Reporting", Annex 13. Upstream transportation anddistribution includes emissions associated with inbound shipments to our facilities, shipments between our facilities, and outbound shipments from our facilities that we payfor. For waste emissions, total weight of hazardous and non-hazardous waste generated from IFF’s total global production are used as activity data for this calculation.Waste is categorized by type of material and diversion method, including recycling, composting, incineration, and landfilling. The waste-type-specific method, described in"Technical Guidance for Calculating Scope 3 Emissions," is then applied using factors from EPA’s WARM model. For emissions from business travel, travel data is providedby our travel agency and includes global air and rail travel by cabin class and distance threshold for each trip. All these scope 3 emissions were calculated based on 100%primary data. Remaining relevant categories were estimated using the Quantis Scope 3 screening tool and other internal methods.
Requesting memberAjinomoto Co.Inc.
Scope of emissionsScope 2
Allocation levelBusiness unit (subsidiary company)
Allocation level detailThis calculation is based on legacy IFF emissions and excludes legacy Frutarom emissions as we work to complete our integration.
Emissions in metric tonnes of CO2e9
Uncertainty (±%)5
Major sources of emissionsIFF operations use energy for heating and cooling of buildings, lighting, refrigeration, generating hot water and steam, process operations and cleaning. IFF obtainedverification for absolute global Scope 2 GHG emissions.
VerifiedNo
Allocation methodAllocation based on the market value of products purchased
Please explain how you have identified the GHG source, including major limitations to this process and assumptions madeEnergy sources were identified according to the global infrastructure and operational systems. Natural gas, purchased electricity, process derived fuels, and purchasedsteam accounted for more than 90% of our global energy consumption in 2019. These are the main energy sources we use to heat and cool our buildings, to generate hotwater and steam; and for refrigeration, process operations and cleaning. Data is collected globally via an internet based system for capturing and calculating GHGemissions. Uncertainty could be due to human error, unit conversions, and estimation methodology. Our Scope 1 and 2 and data have been externally verified by the ERMCVS. Our Scope 3, Fuel- and energy-related activities (not included in Scopes 1 or 2) were calculated based on 100% primary data. The quantity of energy consumed foreach energy type, such as electricity or natural gas, is used as activity data to calculate emissions. Consumption by fuel type is multiplied by emission factors for each ofthe three activities included in this category. Emission factors for upstream emissions of purchased fuels are based on life-cycle analysis software. Emission factors forupstream emissions of purchased electricity are based on life-cycle analysis software for the US, and on UK Defra 2015 Guidelines for other countries. Emission factors forT&D losses are based on EPA’s eGRID database for the US, and on UK Defra 2015 Guidelines for other countries. GWPs are IPCC Fifth Assessment Report (AR5 - 100year). Going forward we will be evaluating data collection methods for other categories of Scope 3 emissions. For emissions from purchased goods and services and capitalgoods, corporate-wide global expense data was obtained from finance. The spend was mapped to corresponding industry sectors and then multiplied by cradle-to-gateemission factors by sector from UK Defra’s "2012 Guidelines to Defra / DECC's GHG Conversion Factors for Company Reporting", Annex 13. Upstream transportation anddistribution includes emissions associated with inbound shipments to our facilities, shipments between our facilities, and outbound shipments from our facilities that we payfor. For waste emissions, total weight of hazardous and non-hazardous waste generated from IFF’s total global production are used as activity data for this calculation.Waste is categorized by type of material and diversion method, including recycling, composting, incineration, and landfilling. The waste-type-specific method, described in"Technical Guidance for Calculating Scope 3 Emissions," is then applied using factors from EPA’s WARM model. For emissions from business travel, travel data is providedby our travel agency and includes global air and rail travel by cabin class and distance threshold for each trip. All these scope 3 emissions were calculated based on 100%primary data. Remaining relevant categories were estimated using the Quantis Scope 3 screening tool and other internal methods.
Requesting memberAjinomoto Co.Inc.
Scope of emissionsScope 3
Allocation levelBusiness unit (subsidiary company)
Allocation level detailThis calculation is based on legacy IFF emissions and excludes legacy Frutarom emissions as we work to complete our integration.
CDP Page of 8068
Emissions in metric tonnes of CO2e129
Uncertainty (±%)10
Major sources of emissionsGHG emissions for scope 3 include upstream emissions from purchased goods and services, capital goods, purchased fuels and electricity, transmission and distributionlosses of purchased electricity and steam, upstream transportation and distribution, the waste generated within our operations, business travel, employee commuting,downstream transportation and distribution, processing of sold products, and end of life treatment of sold products.
VerifiedNo
Allocation methodAllocation based on the market value of products purchased
Please explain how you have identified the GHG source, including major limitations to this process and assumptions madeEnergy sources were identified according to the global infrastructure and operational systems. Natural gas, purchased electricity, process derived fuels, and purchasedsteam accounted for more than 90% of our global energy consumption in 2019. These are the main energy sources we use to heat and cool our buildings, to generate hotwater and steam; and for refrigeration, process operations and cleaning. Data is collected globally via an internet based system for capturing and calculating GHGemissions. Uncertainty could be due to human error, unit conversions, and estimation methodology. Our Scope 1 and 2 and data have been externally verified by the ERMCVS. Our Scope 3, Fuel- and energy-related activities (not included in Scopes 1 or 2) were calculated based on 100% primary data. The quantity of energy consumed foreach energy type, such as electricity or natural gas, is used as activity data to calculate emissions. Consumption by fuel type is multiplied by emission factors for each ofthe three activities included in this category. Emission factors for upstream emissions of purchased fuels are based on life-cycle analysis software. Emission factors forupstream emissions of purchased electricity are based on life-cycle analysis software for the US, and on UK Defra 2015 Guidelines for other countries. Emission factors forT&D losses are based on EPA’s eGRID database for the US, and on UK Defra 2015 Guidelines for other countries. GWPs are IPCC Fifth Assessment Report (AR5 - 100year). Going forward we will be evaluating data collection methods for other categories of Scope 3 emissions. For emissions from purchased goods and services and capitalgoods, corporate-wide global expense data was obtained from finance. The spend was mapped to corresponding industry sectors and then multiplied by cradle-to-gateemission factors by sector from UK Defra’s "2012 Guidelines to Defra / DECC's GHG Conversion Factors for Company Reporting", Annex 13. Upstream transportation anddistribution includes emissions associated with inbound shipments to our facilities, shipments between our facilities, and outbound shipments from our facilities that we payfor. For waste emissions, total weight of hazardous and non-hazardous waste generated from IFF’s total global production are used as activity data for this calculation.Waste is categorized by type of material and diversion method, including recycling, composting, incineration, and landfilling. The waste-type-specific method, described in"Technical Guidance for Calculating Scope 3 Emissions," is then applied using factors from EPA’s WARM model. For emissions from business travel, travel data is providedby our travel agency and includes global air and rail travel by cabin class and distance threshold for each trip. All these scope 3 emissions were calculated based on 100%primary data. Remaining relevant categories were estimated using the Quantis Scope 3 screening tool and other internal methods.
SC1.2
(SC1.2) Where published information has been used in completing SC1.1, please provide a reference(s).
Total Global Emissions are calculated using the Greenhouse Gas Protocol. Customer emissions are allocated based on the
market value of products purchased.
SC1.3
(SC1.3) What are the challenges in allocating emissions to different customers, and what would help you to overcome these challenges?
Allocationchallenges
Please explain what would help you overcome these challenges
Diversity ofproduct linesmakes accuratelyaccounting foreachproduct/productline costineffective
Given IFF’s global footprint, multitude of suppliers, and broad range of natural and synthetic raw materials that are sourced from around the world, providing GHG emissions data per finishedproduct is a complex process. That said, we have allocated our global GHG emissions data to our customers according to volume of products purchased and developed models to estimate GHGemissions on a per category and per product basis. Over the last several years we also gained better insight into our Scope 3 emissions and can estimate emissions throughout the product lifecycle. We have insight from our library of lifecycle assessments of fragrance and flavor ingredients and partnered with industry and LCA experts on product specific initiatives. Note that theconclusion from our lifecycle assessments is that our product manufacturing processes produced the fewest carbon emissions compared with raw materials and transport, which contributed thehighest percentage emissions.
SC1.4
(SC1.4) Do you plan to develop your capabilities to allocate emissions to your customers in the future?Yes
SC1.4a
(SC1.4a) Describe how you plan to develop your capabilities.
We have made great advancements over the past few years regarding product specific data, and would be happy to share and partner with you our customers to enhanceour mutual understanding and reduce of GHG emissions throughout the product life cycle. We welcome the opportunity to partner with our customers and share product leveldata throughout the lifecycle, as indicated in SM 4.
CDP Page of 8069
SC2.1
(SC2.1) Please propose any mutually beneficial climate-related projects you could collaborate on with specific CDP Supply Chain members.
Requesting memberAjinomoto Co.Inc.
Group type of projectRelationship sustainability assessment
Type of projectAligning goals to feed into customers targets and ambitions
Emissions targetedActions that would reduce both our own and our customers’ emissions
Estimated timeframe for carbon reductions to be realized1-3 years
Estimated lifetime CO2e savings
Estimated paybackCost/saving neutral
Details of proposalIFF is a leader in circular design and renewable energy. We have the largest solar field and the first and only Wind Turbine in our industry. We also have an in-depth view ofour own footprint as well as the value chain and have an approved Science-based Target. In 2019, we also signed onto be a member of the UNGC Business Ambition for1.5C. From renewable and Natural feedstocks to carbon reducing products, we can partner to help you to achieve your goals. Some opportunities that we presented thisyear for collaboration on climate change include products manufactured with 100 % renewable electricity, partnering on local renewable energy projects, fully traceable andFor Life certified Naturals and Renewable and / or Cradle to Cradle certified fragrances. We welcome the opportunity to partner with you on initiatives that will help tosupport and advance your sustainability goals. And we look forward to our continued partnership to promote more sustainable products throughout your supply chain.Please contact [email protected], VP Global Sustainability to advance these opportunities. For an in-depth overview of our capabilities see http://www.iff.com/sustain.
Requesting memberClorox Company
Group type of projectRelationship sustainability assessment
Type of projectAligning goals to feed into customers targets and ambitions
Emissions targetedActions that would reduce both our own and our customers’ emissions
Estimated timeframe for carbon reductions to be realized1-3 years
Estimated lifetime CO2e savings
Estimated paybackCost/saving neutral
Details of proposalIFF is a leader in circular design and renewable energy. We have the largest solar field and the first and only Wind Turbine in our industry. We also have an in-depth view ofour own footprint as well as the value chain and have an approved Science-based Target. In 2019, we also signed onto be a member of the UNGC Business Ambition for1.5C. From renewable and Natural feedstocks to carbon reducing products, we can partner to help you to achieve your goals. Some opportunities that we presented thisyear for collaboration on climate change include products manufactured with 100 % renewable electricity, partnering on local renewable energy projects, fully traceable andFor Life certified Naturals and Renewable and / or Cradle to Cradle certified fragrances. We welcome the opportunity to partner with you on initiatives that will help tosupport and advance your sustainability goals. And we look forward to our continued partnership to promote more sustainable products throughout your supply chain.Please contact [email protected], VP Global Sustainability to advance these opportunities. For an in-depth overview of our capabilities see http://www.iff.com/sustain.
Requesting memberDiageo Plc
Group type of projectRelationship sustainability assessment
Type of projectAligning goals to feed into customers targets and ambitions
Emissions targetedActions that would reduce both our own and our customers’ emissions
Estimated timeframe for carbon reductions to be realized1-3 years
Estimated lifetime CO2e savings
Estimated paybackCost/saving neutral
Details of proposalIFF is a leader in circular design and renewable energy. We have the largest solar field and the first and only Wind Turbine in our industry. We also have an in-depth view ofour own footprint as well as the value chain and have an approved Science-based Target. In 2019, we also signed onto be a member of the UNGC Business Ambition for1.5C. From renewable and Natural feedstocks to carbon reducing products, we can partner to help you to achieve your goals. Some opportunities that we presented this
CDP Page of 8070
year for collaboration on climate change include products manufactured with 100 % renewable electricity, partnering on local renewable energy projects, fully traceable andFor Life certified Naturals and Renewable and / or Cradle to Cradle certified fragrances. We welcome the opportunity to partner with you on initiatives that will help tosupport and advance your sustainability goals. And we look forward to our continued partnership to promote more sustainable products throughout your supply chain.Please contact [email protected], VP Global Sustainability to advance these opportunities. For an in-depth overview of our capabilities see http://www.iff.com/sustain.
Requesting memberJohnson & Johnson
Group type of projectRelationship sustainability assessment
Type of projectAligning goals to feed into customers targets and ambitions
Emissions targetedActions that would reduce both our own and our customers’ emissions
Estimated timeframe for carbon reductions to be realized1-3 years
Estimated lifetime CO2e savings
Estimated paybackCost/saving neutral
Details of proposalIFF is a leader in circular design and renewable energy. We have the largest solar field and the first and only Wind Turbine in our industry. We also have an in-depth view ofour own footprint as well as the value chain and have an approved Science-based Target. In 2019, we also signed onto be a member of the UNGC Business Ambition for1.5C. From renewable and Natural feedstocks to carbon reducing products, we can partner to help you to achieve your goals. Some opportunities that we presented thisyear for collaboration on climate change include products manufactured with 100 % renewable electricity, partnering on local renewable energy projects, fully traceable andFor Life certified Naturals and Renewable and / or Cradle to Cradle certified fragrances. We welcome the opportunity to partner with you on initiatives that will help tosupport and advance your sustainability goals. And we look forward to our continued partnership to promote more sustainable products throughout your supply chain.Please contact [email protected], VP Global Sustainability to advance these opportunities. For an in-depth overview of our capabilities see http://www.iff.com/sustain.
Requesting memberKAO Corporation
Group type of projectRelationship sustainability assessment
Type of projectAligning goals to feed into customers targets and ambitions
Emissions targetedActions that would reduce both our own and our customers’ emissions
Estimated timeframe for carbon reductions to be realized1-3 years
Estimated lifetime CO2e savings
Estimated paybackCost/saving neutral
Details of proposalIFF is a leader in circular design and renewable energy. We have the largest solar field and the first and only Wind Turbine in our industry. We also have an in-depth view ofour own footprint as well as the value chain and have an approved Science-based Target. In 2019, we also signed onto be a member of the UNGC Business Ambition for1.5C. From renewable and Natural feedstocks to carbon reducing products, we can partner to help you to achieve your goals. Some opportunities that we presented thisyear for collaboration on climate change include products manufactured with 100 % renewable electricity, partnering on local renewable energy projects, fully traceable andFor Life certified Naturals and Renewable and / or Cradle to Cradle certified fragrances. We welcome the opportunity to partner with you on initiatives that will help tosupport and advance your sustainability goals. And we look forward to our continued partnership to promote more sustainable products throughout your supply chain.Please contact [email protected], VP Global Sustainability to advance these opportunities. For an in-depth overview of our capabilities see http://www.iff.com/sustain.
Requesting memberKellogg Company
Group type of projectRelationship sustainability assessment
Type of projectAligning goals to feed into customers targets and ambitions
Emissions targetedActions that would reduce both our own and our customers’ emissions
Estimated timeframe for carbon reductions to be realized1-3 years
Estimated lifetime CO2e savings
Estimated paybackCost/saving neutral
Details of proposalIFF is a leader in circular design and renewable energy. We have the largest solar field and the first and only Wind Turbine in our industry. We also have an in-depth view ofour own footprint as well as the value chain and have an approved Science-based Target. In 2019, we also signed onto be a member of the UNGC Business Ambition for1.5C. From renewable and Natural feedstocks to carbon reducing products, we can partner to help you to achieve your goals. Some opportunities that we presented thisyear for collaboration on climate change include products manufactured with 100 % renewable electricity, partnering on local renewable energy projects, fully traceable and
CDP Page of 8071
For Life certified Naturals and Renewable and / or Cradle to Cradle certified fragrances. We welcome the opportunity to partner with you on initiatives that will help tosupport and advance your sustainability goals. And we look forward to our continued partnership to promote more sustainable products throughout your supply chain.Please contact [email protected], VP Global Sustainability to advance these opportunities. For an in-depth overview of our capabilities see http://www.iff.com/sustain.
Requesting memberL'Oréal
Group type of projectRelationship sustainability assessment
Type of projectAligning goals to feed into customers targets and ambitions
Emissions targetedActions that would reduce both our own and our customers’ emissions
Estimated timeframe for carbon reductions to be realized1-3 years
Estimated lifetime CO2e savings
Estimated paybackCost/saving neutral
Details of proposalIFF is a leader in circular design and renewable energy. We have the largest solar field and the first and only Wind Turbine in our industry. We also have an in-depth view ofour own footprint as well as the value chain and have an approved Science-based Target. In 2019, we also signed onto be a member of the UNGC Business Ambition for1.5C. From renewable and Natural feedstocks to carbon reducing products, we can partner to help you to achieve your goals. Some opportunities that we presented thisyear for collaboration on climate change include products manufactured with 100 % renewable electricity, partnering on local renewable energy projects, fully traceable andFor Life certified Naturals and Renewable and / or Cradle to Cradle certified fragrances. We welcome the opportunity to partner with you on initiatives that will help tosupport and advance your sustainability goals. And we look forward to our continued partnership to promote more sustainable products throughout your supply chain.Please contact [email protected], VP Global Sustainability to advance these opportunities. For an in-depth overview of our capabilities see http://www.iff.com/sustain.
Requesting memberPepsiCo, Inc.
Group type of projectRelationship sustainability assessment
Type of projectAligning goals to feed into customers targets and ambitions
Emissions targetedActions that would reduce both our own and our customers’ emissions
Estimated timeframe for carbon reductions to be realized1-3 years
Estimated lifetime CO2e savings
Estimated paybackCost/saving neutral
Details of proposalIFF is a leader in circular design and renewable energy. We have the largest solar field and the first and only Wind Turbine in our industry. We also have an in-depth view ofour own footprint as well as the value chain and have an approved Science-based Target. In 2019, we also signed onto be a member of the UNGC Business Ambition for1.5C. From renewable and Natural feedstocks to carbon reducing products, we can partner to help you to achieve your goals. Some opportunities that we presented thisyear for collaboration on climate change include products manufactured with 100 % renewable electricity, partnering on local renewable energy projects, fully traceable andFor Life certified Naturals and Renewable and / or Cradle to Cradle certified fragrances. We welcome the opportunity to partner with you on initiatives that will help tosupport and advance your sustainability goals. And we look forward to our continued partnership to promote more sustainable products throughout your supply chain.Please contact [email protected], VP Global Sustainability to advance these opportunities. For an in-depth overview of our capabilities see http://www.iff.com/sustain.
Requesting memberUnilever plc
Group type of projectRelationship sustainability assessment
Type of projectAligning goals to feed into customers targets and ambitions
Emissions targetedActions that would reduce both our own and our customers’ emissions
Estimated timeframe for carbon reductions to be realized1-3 years
Estimated lifetime CO2e savings
Estimated paybackCost/saving neutral
Details of proposalIFF is a leader in circular design and renewable energy. We have the largest solar field and the first and only Wind Turbine in our industry. We also have an in-depth view ofour own footprint as well as the value chain and have an approved Science-based Target. In 2019, we also signed onto be a member of the UNGC Business Ambition for1.5C. From renewable and Natural feedstocks to carbon reducing products, we can partner to help you to achieve your goals. Some opportunities that we presented thisyear for collaboration on climate change include products manufactured with 100 % renewable electricity, partnering on local renewable energy projects, fully traceable andFor Life certified Naturals and Renewable and / or Cradle to Cradle certified fragrances. We welcome the opportunity to partner with you on initiatives that will help to
CDP Page of 8072
support and advance your sustainability goals. And we look forward to our continued partnership to promote more sustainable products throughout your supply chain.Please contact [email protected], VP Global Sustainability to advance these opportunities. For an in-depth overview of our capabilities see http://www.iff.com/sustain.
Requesting memberS.C. Johnson & Son, Inc.
Group type of projectRelationship sustainability assessment
Type of projectAligning goals to feed into customers targets and ambitions
Emissions targetedActions that would reduce both our own and our customers’ emissions
Estimated timeframe for carbon reductions to be realized1-3 years
Estimated lifetime CO2e savings
Estimated paybackCost/saving neutral
Details of proposalIFF is a leader in circular design and renewable energy. We have the largest solar field and the first and only Wind Turbine in our industry. We also have an in-depth view ofour own footprint as well as the value chain and have an approved Science-based Target. In 2019, we also signed onto be a member of the UNGC Business Ambition for1.5C. From renewable and Natural feedstocks to carbon reducing products, we can partner to help you to achieve your goals. Some opportunities that we presented thisyear for collaboration on climate change include products manufactured with 100 % renewable electricity, partnering on local renewable energy projects, fully traceable andFor Life certified Naturals and Renewable and / or Cradle to Cradle certified fragrances. We welcome the opportunity to partner with you on initiatives that will help tosupport and advance your sustainability goals. And we look forward to our continued partnership to promote more sustainable products throughout your supply chain.Please contact [email protected], VP Global Sustainability to advance these opportunities. For an in-depth overview of our capabilities see http://www.iff.com/sustain.
SC2.2
(SC2.2) Have requests or initiatives by CDP Supply Chain members prompted your organization to take organizational-level emissions reduction initiatives?Yes
SC2.2a
(SC2.2a) Specify the requesting member(s) that have driven organizational-level emissions reduction initiatives, and provide information on the initiatives.
Requesting memberClorox Company
Initiative ID2019-ID1
Group type of projectRelationship sustainability assessment
Type of projectAligning goals to feed into customers targets and ambitions
Description of the reduction initiativeOrganizational emissions reductions are being driven by our desire to be more sustainable in this area as well as by our commitment to being a responsible member ofClorox’s supply chain. Multiple energy efficiency and renewable energy reduction initiatives are underway specifically at the locations that provide your products. We areworking towards better understanding of specific product level emissions reductions and can now allocate a percentage of our overall emissions reductions to your supplychain.
Emissions reduction for the reporting year in metric tons of CO2e131
Did you identify this opportunity as part of the CDP supply chain Action Exchange?No
Would you be happy for CDP supply chain members to highlight this work in their external communication?Yes
Requesting memberDiageo Plc
Initiative ID2019-ID2
Group type of projectRelationship sustainability assessment
Type of projectAligning goals to feed into customers targets and ambitions
Description of the reduction initiativeOrganizational emissions reductions are being driven by our desire to be more sustainable in this area as well as by our commitment to being a responsible member of
CDP Page of 8073

Diageo’s supply chain. Multiple energy efficiency and renewable energy reduction initiatives are underway specifically at the locations that provide your products. We areworking towards better understanding of specific product level emissions reductions and can now allocate a percentage of our overall emissions reductions to your supplychain.
Emissions reduction for the reporting year in metric tons of CO2e51
Did you identify this opportunity as part of the CDP supply chain Action Exchange?No
Would you be happy for CDP supply chain members to highlight this work in their external communication?Yes
Requesting memberJohnson & Johnson
Initiative ID2019-ID3
Group type of projectRelationship sustainability assessment
Type of projectAligning goals to feed into customers targets and ambitions
Description of the reduction initiativeOrganizational emissions reductions are being driven by our desire to be more sustainable in this area as well as by our commitment to being a responsible member ofJohonson & Johnson’s supply chain. Multiple energy efficiency and renewable energy reduction initiatives are underway specifically at the locations that provide yourproducts. We are working towards better understanding of specific product level emissions reductions and can now allocate a percentage of our overall emissionsreductions to your supply chain.
Emissions reduction for the reporting year in metric tons of CO2e27
Did you identify this opportunity as part of the CDP supply chain Action Exchange?No
Would you be happy for CDP supply chain members to highlight this work in their external communication?Yes
Requesting memberKAO Corporation
Initiative ID2019-ID4
Group type of projectRelationship sustainability assessment
Type of projectAligning goals to feed into customers targets and ambitions
Description of the reduction initiativeOrganizational emissions reductions are being driven by our desire to be more sustainable in this area as well as by our commitment to being a responsible member ofKao’s supply chain. Multiple energy efficiency and renewable energy reduction initiatives are underway specifically at the locations that provide your products. We areworking towards better understanding of specific product level emissions reductions and can now allocate a percentage of our overall emissions reductions to your supplychain.
Emissions reduction for the reporting year in metric tons of CO2e81
Did you identify this opportunity as part of the CDP supply chain Action Exchange?No
Would you be happy for CDP supply chain members to highlight this work in their external communication?Yes
Requesting memberKellogg Company
Initiative ID2019-ID5
Group type of projectRelationship sustainability assessment
Type of projectAligning goals to feed into customers targets and ambitions
Description of the reduction initiativeOrganizational emissions reductions are being driven by our desire to be more sustainable in this area as well as by our commitment to being a responsible member ofKellogg’s supply chain. Multiple energy efficiency and renewable energy reduction initiatives are underway specifically at the locations that provide your products. We areworking towards better understanding of specific product level emissions reductions and can now allocate a percentage of our overall emissions reductions to your supplychain.
Emissions reduction for the reporting year in metric tons of CO2e63
CDP Page of 8074
Did you identify this opportunity as part of the CDP supply chain Action Exchange?No
Would you be happy for CDP supply chain members to highlight this work in their external communication?Yes
Requesting memberL'Oréal
Initiative ID2019-ID6
Group type of projectRelationship sustainability assessment
Type of projectAligning goals to feed into customers targets and ambitions
Description of the reduction initiativeOrganizational emissions reductions are being driven by our desire to be more sustainable in this area as well as by our commitment to being a responsible member ofL'Oréal's supply chain. Multiple energy efficiency and renewable energy reduction initiatives are underway specifically at the locations that provide your products. We areworking towards better understanding of specific product level emissions reductions and can now allocate a percentage of our overall emissions reductions to your supplychain.
Emissions reduction for the reporting year in metric tons of CO2e297
Did you identify this opportunity as part of the CDP supply chain Action Exchange?No
Would you be happy for CDP supply chain members to highlight this work in their external communication?Yes
Requesting memberPepsiCo, Inc.
Initiative ID2019-ID7
Group type of projectRelationship sustainability assessment
Type of projectAligning goals to feed into customers targets and ambitions
Description of the reduction initiativeOrganizational emissions reductions are being driven by our desire to be more sustainable in this area as well as by our commitment to being a responsible member ofPepsico’s supply chain. Multiple energy efficiency and renewable energy reduction initiatives are underway specifically at the locations that provide your products. We areworking towards better understanding of specific product level emissions reductions and can now allocate a percentage of our overall emissions reductions to your supplychain.
Emissions reduction for the reporting year in metric tons of CO2e882
Did you identify this opportunity as part of the CDP supply chain Action Exchange?No
Would you be happy for CDP supply chain members to highlight this work in their external communication?Yes
Requesting memberUnilever plc
Initiative ID2019-ID8
Group type of projectRelationship sustainability assessment
Type of projectAligning goals to feed into customers targets and ambitions
Description of the reduction initiativeOrganizational emissions reductions are being driven by our desire to be more sustainable in this area as well as by our commitment to being a responsible member ofUnilever’s supply chain. Multiple energy efficiency and renewable energy reduction initiatives are underway specifically at the locations that provide your products. We areworking towards better understanding of specific product level emissions reductions and can now allocate a percentage of our overall emissions reductions to your supplychain.
Emissions reduction for the reporting year in metric tons of CO2e1351
Did you identify this opportunity as part of the CDP supply chain Action Exchange?No
Would you be happy for CDP supply chain members to highlight this work in their external communication?Yes
Requesting member
CDP Page of 8075
S.C. Johnson & Son, Inc.
Initiative ID2018-ID9
Group type of projectRelationship sustainability assessment
Type of projectAligning goals to feed into customers targets and ambitions
Description of the reduction initiativeOrganizational emissions reductions are being driven by our desire to be more sustainable in this area as well as by our commitment to being a responsible member of SCJohnson’s supply chain. Multiple energy efficiency and renewable energy reduction initiatives are underway specifically at the locations that provide your products. We areworking towards better understanding of specific product level emissions reductions and can now allocate a percentage of our overall emissions reductions to your supplychain.
Emissions reduction for the reporting year in metric tons of CO2e24
Did you identify this opportunity as part of the CDP supply chain Action Exchange?No
Would you be happy for CDP supply chain members to highlight this work in their external communication?Yes
Requesting memberAjinomoto Co.Inc.
Initiative ID2019-ID10
Group type of projectRelationship sustainability assessment
Type of projectAligning goals to feed into customers targets and ambitions
Description of the reduction initiativeOrganizational emissions reductions are being driven by our desire to be more sustainable in this area as well as by our commitment to being a responsible member ofAjinomoto’s supply chain. Multiple energy efficiency and renewable energy reduction initiatives are underway specifically at the locations that provide your products. We areworking towards better understanding of specific product level emissions reductions and can now allocate a percentage of our overall emissions reductions to your supplychain.
Emissions reduction for the reporting year in metric tons of CO2e2
Did you identify this opportunity as part of the CDP supply chain Action Exchange?No
Would you be happy for CDP supply chain members to highlight this work in their external communication?Yes
SC3.1
(SC3.1) Do you want to enroll in the 2020-2021 CDP Action Exchange initiative?Yes
SC3.1a
(SC3.1a) Identify which member(s), if any, have motivated you to take part in Action Exchange this year.Please select
SC3.1b
(SC3.1b) Select the types of emissions reduction activities that your company would like support in analyzing or in implementing in the next reporting year.Company policy or behavioral changeEnergy efficiency in buildingsEnergy efficiency in production processesFugitive emissions reductionsGreen project financeLow-carbon energy consumptionLow-carbon energy generationNon-energy industrial process emissions reductionsWaste reduction and material circularity
CDP Page of 8076
SC3.1c
(SC3.1c) As part of Action Exchange, would you like facility level analysis?Yes
SC3.2
(SC3.2) Is your company a participating supplier in CDP’s 2019-2020 Action Exchange initiative?No
SC4.1
(SC4.1) Are you providing product level data for your organization’s goods or services?Yes, I will provide data
SC4.1a
(SC4.1a) Give the overall percentage of total emissions, for all Scopes, that are covered by these products.17
SC4.2a
CDP Page of 8077
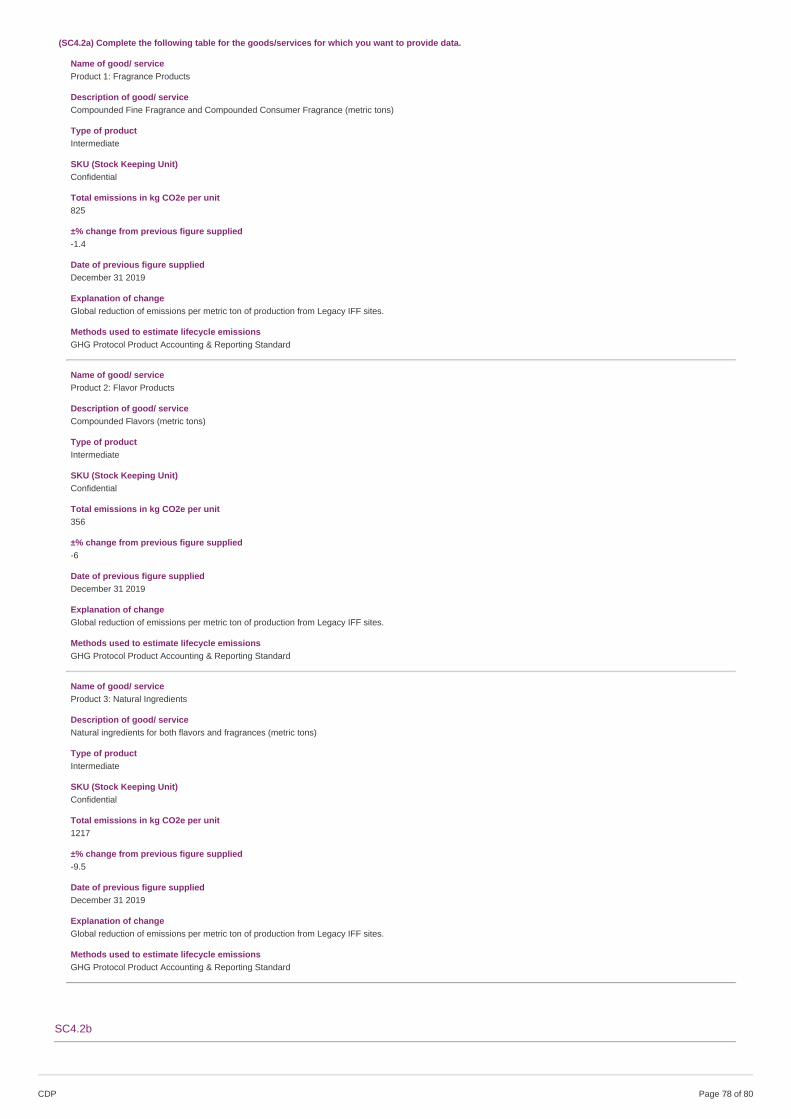
(SC4.2a) Complete the following table for the goods/services for which you want to provide data.
Name of good/ serviceProduct 1: Fragrance Products
Description of good/ serviceCompounded Fine Fragrance and Compounded Consumer Fragrance (metric tons)
Type of productIntermediate
SKU (Stock Keeping Unit)Confidential
Total emissions in kg CO2e per unit825
±% change from previous figure supplied-1.4
Date of previous figure suppliedDecember 31 2019
Explanation of changeGlobal reduction of emissions per metric ton of production from Legacy IFF sites.
Methods used to estimate lifecycle emissionsGHG Protocol Product Accounting & Reporting Standard
Name of good/ serviceProduct 2: Flavor Products
Description of good/ serviceCompounded Flavors (metric tons)
Type of productIntermediate
SKU (Stock Keeping Unit)Confidential
Total emissions in kg CO2e per unit356
±% change from previous figure supplied-6
Date of previous figure suppliedDecember 31 2019
Explanation of changeGlobal reduction of emissions per metric ton of production from Legacy IFF sites.
Methods used to estimate lifecycle emissionsGHG Protocol Product Accounting & Reporting Standard
Name of good/ serviceProduct 3: Natural Ingredients
Description of good/ serviceNatural ingredients for both flavors and fragrances (metric tons)
Type of productIntermediate
SKU (Stock Keeping Unit)Confidential
Total emissions in kg CO2e per unit1217
±% change from previous figure supplied-9.5
Date of previous figure suppliedDecember 31 2019
Explanation of changeGlobal reduction of emissions per metric ton of production from Legacy IFF sites.
Methods used to estimate lifecycle emissionsGHG Protocol Product Accounting & Reporting Standard
SC4.2b
CDP Page of 8078

(SC4.2b) Complete the following table with data for lifecycle stages of your goods and/or services.
Name of good/ serviceProduct 1: Fragrance Products
Please select the scopeScope 1 & 2
Please select the lifecycle stageProduction
Emissions at the lifecycle stage in kg CO2e per unit825
Is this stage under your ownership or control?Yes
Type of data usedPrimary and secondary
Data qualityPrimary data used include natural gas combustion and electricity production. Because readings are obtained from monthly bills and "revenue meters," which are typicallysubject to stringent calibration requirements by local governments, uncertainty level for natural gas quantities and GHG emissions can be assumed as <5%. Emissionsreported as per metric ton of production. Scope 2 emissions use market-based accounting
If you are verifying/assuring this product emission data, please tell us howIt hasn’t been verified at the product level yet, but we are taking steps toward it.
Name of good/ serviceProduct 2: Flavor Products
Please select the scopeScope 1 & 2
Please select the lifecycle stageProduction
Emissions at the lifecycle stage in kg CO2e per unit356
Is this stage under your ownership or control?Yes
Type of data usedPrimary and secondary
Data qualityPrimary data used include natural gas combustion and electricity production. Because readings are obtained from monthly bills and "revenue meters," which are typicallysubject to stringent calibration requirements by local governments, uncertainty level for natural gas quantities and GHG emissions can be assumed as <5%. Emissionsreported as per metric ton of production. Scope 2 emissions use market-based accounting
If you are verifying/assuring this product emission data, please tell us howIt hasn’t been verified at the product level yet, but we are taking steps toward it.
Name of good/ serviceProduct 3: Natural Ingredients
Please select the scopeScope 1 & 2
Please select the lifecycle stageProduction
Emissions at the lifecycle stage in kg CO2e per unit1217
Is this stage under your ownership or control?Yes
Type of data usedPrimary and secondary
Data qualityPrimary data used include natural gas combustion and electricity production. Because readings are obtained from monthly bills and "revenue meters," which are typicallysubject to stringent calibration requirements by local governments, uncertainty level for natural gas quantities and GHG emissions can be assumed as <5%. Emissionsreported as per metric ton of production. Scope 2 emissions use market-based accounting
If you are verifying/assuring this product emission data, please tell us howIt hasn’t been verified at the product level yet, but we are taking steps toward it.
SC4.2c
CDP Page of 8079
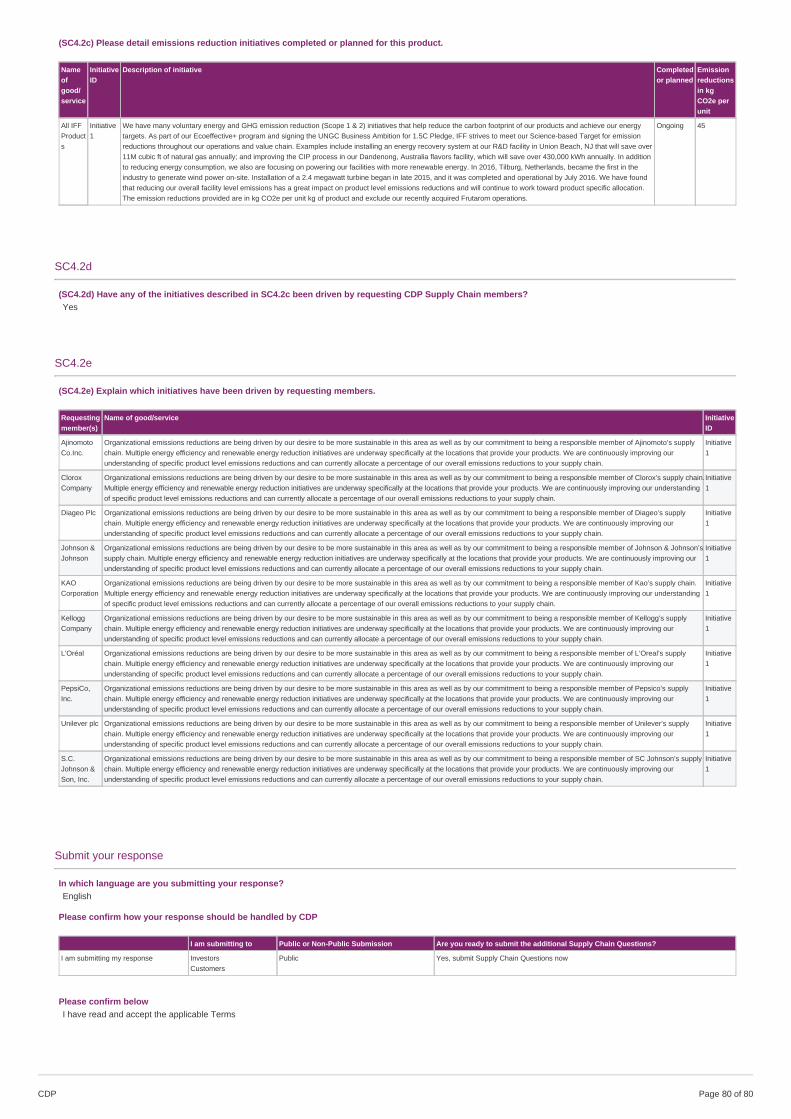
(SC4.2c) Please detail emissions reduction initiatives completed or planned for this product.
Nameofgood/service
InitiativeID
Description of initiative Completedor planned
Emissionreductionsin kgCO2e perunit
All IFFProducts
Initiative1
We have many voluntary energy and GHG emission reduction (Scope 1 & 2) initiatives that help reduce the carbon footprint of our products and achieve our energytargets. As part of our Ecoeffective+ program and signing the UNGC Business Ambition for 1.5C Pledge, IFF strives to meet our Science-based Target for emissionreductions throughout our operations and value chain. Examples include installing an energy recovery system at our R&D facility in Union Beach, NJ that will save over11M cubic ft of natural gas annually; and improving the CIP process in our Dandenong, Australia flavors facility, which will save over 430,000 kWh annually. In additionto reducing energy consumption, we also are focusing on powering our facilities with more renewable energy. In 2016, Tilburg, Netherlands, became the first in theindustry to generate wind power on-site. Installation of a 2.4 megawatt turbine began in late 2015, and it was completed and operational by July 2016. We have foundthat reducing our overall facility level emissions has a great impact on product level emissions reductions and will continue to work toward product specific allocation.The emission reductions provided are in kg CO2e per unit kg of product and exclude our recently acquired Frutarom operations.
Ongoing 45
SC4.2d
(SC4.2d) Have any of the initiatives described in SC4.2c been driven by requesting CDP Supply Chain members?Yes
SC4.2e
(SC4.2e) Explain which initiatives have been driven by requesting members.
Requestingmember(s)
Name of good/service InitiativeID
AjinomotoCo.Inc.
Organizational emissions reductions are being driven by our desire to be more sustainable in this area as well as by our commitment to being a responsible member of Ajinomoto’s supplychain. Multiple energy efficiency and renewable energy reduction initiatives are underway specifically at the locations that provide your products. We are continuously improving ourunderstanding of specific product level emissions reductions and can currently allocate a percentage of our overall emissions reductions to your supply chain.
Initiative1
CloroxCompany
Organizational emissions reductions are being driven by our desire to be more sustainable in this area as well as by our commitment to being a responsible member of Clorox’s supply chain.Multiple energy efficiency and renewable energy reduction initiatives are underway specifically at the locations that provide your products. We are continuously improving our understandingof specific product level emissions reductions and can currently allocate a percentage of our overall emissions reductions to your supply chain.
Initiative1
Diageo Plc Organizational emissions reductions are being driven by our desire to be more sustainable in this area as well as by our commitment to being a responsible member of Diageo’s supplychain. Multiple energy efficiency and renewable energy reduction initiatives are underway specifically at the locations that provide your products. We are continuously improving ourunderstanding of specific product level emissions reductions and can currently allocate a percentage of our overall emissions reductions to your supply chain.
Initiative1
Johnson &Johnson
Organizational emissions reductions are being driven by our desire to be more sustainable in this area as well as by our commitment to being a responsible member of Johnson & Johnson’ssupply chain. Multiple energy efficiency and renewable energy reduction initiatives are underway specifically at the locations that provide your products. We are continuously improving ourunderstanding of specific product level emissions reductions and can currently allocate a percentage of our overall emissions reductions to your supply chain.
Initiative1
KAOCorporation
Organizational emissions reductions are being driven by our desire to be more sustainable in this area as well as by our commitment to being a responsible member of Kao’s supply chain.Multiple energy efficiency and renewable energy reduction initiatives are underway specifically at the locations that provide your products. We are continuously improving our understandingof specific product level emissions reductions and can currently allocate a percentage of our overall emissions reductions to your supply chain.
Initiative1
KelloggCompany
Organizational emissions reductions are being driven by our desire to be more sustainable in this area as well as by our commitment to being a responsible member of Kellogg’s supplychain. Multiple energy efficiency and renewable energy reduction initiatives are underway specifically at the locations that provide your products. We are continuously improving ourunderstanding of specific product level emissions reductions and can currently allocate a percentage of our overall emissions reductions to your supply chain.
Initiative1
L'Oréal Organizational emissions reductions are being driven by our desire to be more sustainable in this area as well as by our commitment to being a responsible member of L’Oreal’s supplychain. Multiple energy efficiency and renewable energy reduction initiatives are underway specifically at the locations that provide your products. We are continuously improving ourunderstanding of specific product level emissions reductions and can currently allocate a percentage of our overall emissions reductions to your supply chain.
Initiative1
PepsiCo,Inc.
Organizational emissions reductions are being driven by our desire to be more sustainable in this area as well as by our commitment to being a responsible member of Pepsico’s supplychain. Multiple energy efficiency and renewable energy reduction initiatives are underway specifically at the locations that provide your products. We are continuously improving ourunderstanding of specific product level emissions reductions and can currently allocate a percentage of our overall emissions reductions to your supply chain.
Initiative1
Unilever plc Organizational emissions reductions are being driven by our desire to be more sustainable in this area as well as by our commitment to being a responsible member of Unilever’s supplychain. Multiple energy efficiency and renewable energy reduction initiatives are underway specifically at the locations that provide your products. We are continuously improving ourunderstanding of specific product level emissions reductions and can currently allocate a percentage of our overall emissions reductions to your supply chain.
Initiative1
S.C.Johnson &Son, Inc.
Organizational emissions reductions are being driven by our desire to be more sustainable in this area as well as by our commitment to being a responsible member of SC Johnson’s supplychain. Multiple energy efficiency and renewable energy reduction initiatives are underway specifically at the locations that provide your products. We are continuously improving ourunderstanding of specific product level emissions reductions and can currently allocate a percentage of our overall emissions reductions to your supply chain.
Initiative1
Submit your response
In which language are you submitting your response?English
Please confirm how your response should be handled by CDP
I am submitting to Public or Non-Public Submission Are you ready to submit the additional Supply Chain Questions?
I am submitting my response InvestorsCustomers
Public Yes, submit Supply Chain Questions now
Please confirm belowI have read and accept the applicable Terms
CDP Page of 8080