Embed Size (px)
Citation preview
International Flavors & Fragrances Inc. - Climate Change 2018
C0. Introduction
C0.1
(C0.1) Give a general description and introduction to your organization.
International Flavors & Fragrances Inc. is a leading global creator of flavors and fragrances for consumer products.
C0.2
(C0.2) State the start and end date of the year for which you are reporting data.
Start date End date Indicate if you are providing emissions data for pastreporting years
Select the number of past reporting years you will be providingemissions data for
Row1
January 12017
December 312017
No <Not Applicable>
Row2
<NotApplicable>
<NotApplicable>
<Not Applicable> <Not Applicable>
Row3
<NotApplicable>
<NotApplicable>
<Not Applicable> <Not Applicable>
Row4
<NotApplicable>
<NotApplicable>
<Not Applicable> <Not Applicable>
C0.3
(C0.3) Select the countries/regions for which you will be supplying data.AustraliaChinaColombiaEgyptFranceIndiaIndonesiaIsraelJapanMexicoNetherlandsRepublic of KoreaRussian FederationSingaporeSouth AfricaSpainThailandTurkeyUnited Kingdom of Great Britain and Northern IrelandUnited States of AmericaViet Nam
CDP Page of 891
C0.4
(C0.4) Select the currency used for all financial information disclosed throughout your response.USD
C0.5
(C0.5) Select the option that describes the reporting boundary for which climate-related impacts on your business are beingreported. Note that this option should align with your consolidation approach to your Scope 1 and Scope 2 greenhouse gasinventory.Operational control
C-CH0.7
(C-CH0.7) Which part of the chemicals value chain does your organization operate in?
Row 1
Bulk organic chemicalsAromatics
Bulk inorganic chemicalsPlease select
Other chemicalsSpecialty chemicalsSpecialty organic chemicals
C1. Governance
C1.1
(C1.1) Is there board-level oversight of climate-related issues within your organization?Yes
C1.1a
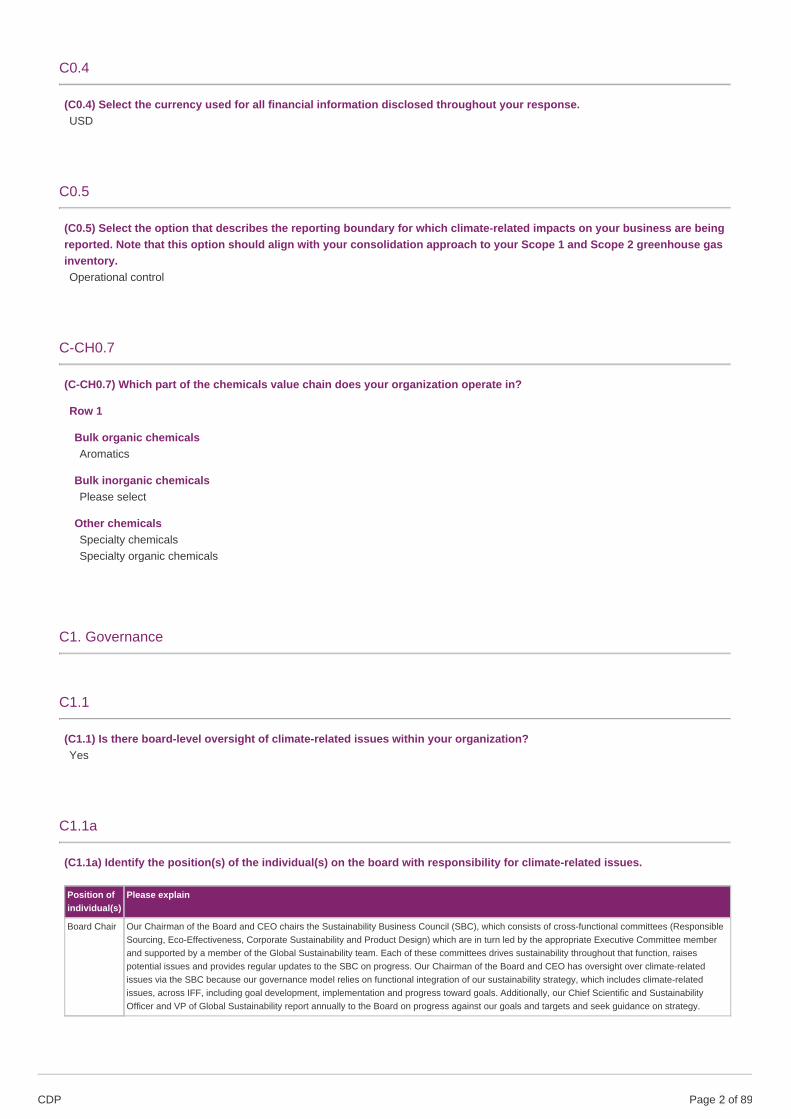
(C1.1a) Identify the position(s) of the individual(s) on the board with responsibility for climate-related issues.
Position ofindividual(s)
Please explain
Board Chair Our Chairman of the Board and CEO chairs the Sustainability Business Council (SBC), which consists of cross-functional committees (ResponsibleSourcing, Eco-Effectiveness, Corporate Sustainability and Product Design) which are in turn led by the appropriate Executive Committee memberand supported by a member of the Global Sustainability team. Each of these committees drives sustainability throughout that function, raisespotential issues and provides regular updates to the SBC on progress. Our Chairman of the Board and CEO has oversight over climate-relatedissues via the SBC because our governance model relies on functional integration of our sustainability strategy, which includes climate-relatedissues, across IFF, including goal development, implementation and progress toward goals. Additionally, our Chief Scientific and SustainabilityOfficer and VP of Global Sustainability report annually to the Board on progress against our goals and targets and seek guidance on strategy.
CDP Page of 892
C1.1b
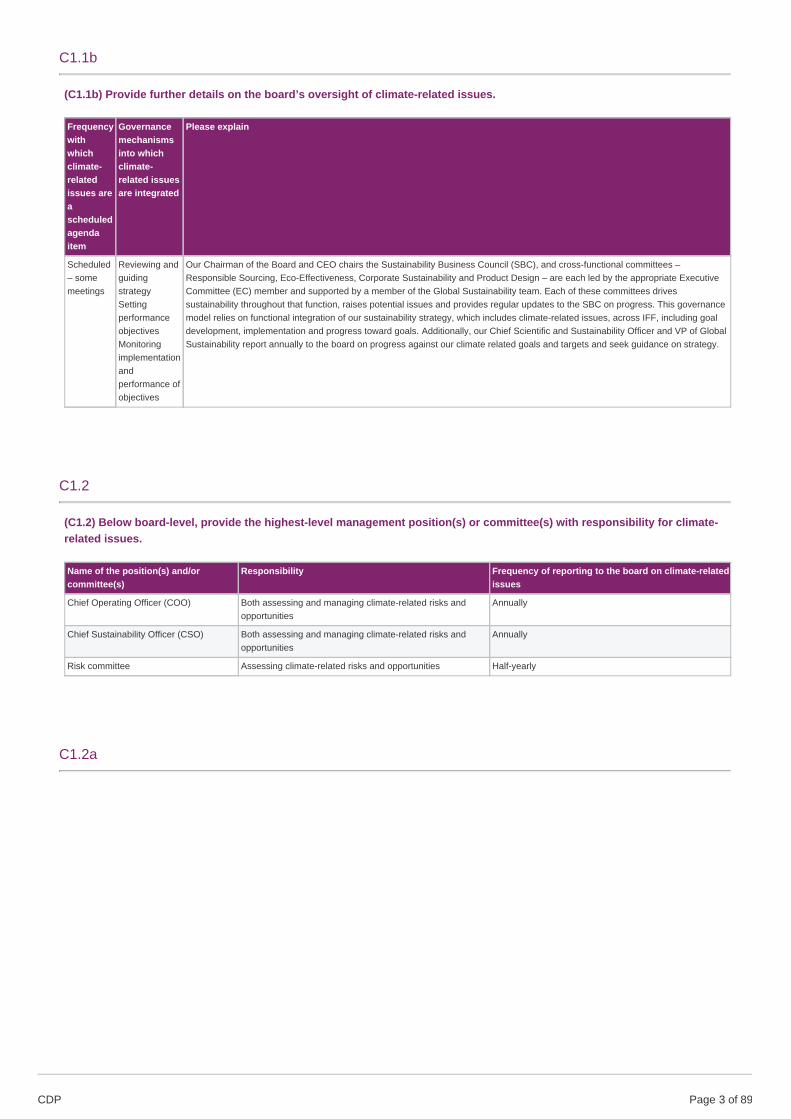
(C1.1b) Provide further details on the board’s oversight of climate-related issues.
Frequencywithwhichclimate-relatedissues areascheduledagendaitem
Governancemechanismsinto whichclimate-related issuesare integrated
Please explain
Scheduled– somemeetings
Reviewing andguidingstrategySettingperformanceobjectivesMonitoringimplementationandperformance ofobjectives
Our Chairman of the Board and CEO chairs the Sustainability Business Council (SBC), and cross-functional committees –Responsible Sourcing, Eco-Effectiveness, Corporate Sustainability and Product Design – are each led by the appropriate ExecutiveCommittee (EC) member and supported by a member of the Global Sustainability team. Each of these committees drivessustainability throughout that function, raises potential issues and provides regular updates to the SBC on progress. This governancemodel relies on functional integration of our sustainability strategy, which includes climate-related issues, across IFF, including goaldevelopment, implementation and progress toward goals. Additionally, our Chief Scientific and Sustainability Officer and VP of GlobalSustainability report annually to the board on progress against our climate related goals and targets and seek guidance on strategy.
C1.2
(C1.2) Below board-level, provide the highest-level management position(s) or committee(s) with responsibility for climate-related issues.
Name of the position(s) and/orcommittee(s)
Responsibility Frequency of reporting to the board on climate-relatedissues
Chief Operating Officer (COO) Both assessing and managing climate-related risks andopportunities
Annually
Chief Sustainability Officer (CSO) Both assessing and managing climate-related risks andopportunities
Annually
Risk committee Assessing climate-related risks and opportunities Half-yearly
C1.2a
CDP Page of 893
(C1.2a) Describe where in the organizational structure this/these position(s) and/or committees lie, what their associatedresponsibilities are, and how climate-related issues are monitored.
The Executive Vice President (EVP) of Operations is the highest level Executive responsible for oversight of operations globally (noteIFF does not have the title of COO). This role reports directly to the Chairman and CEO. This position is responsible for climatechange issues, risks and opportunities in operations and at our facilities. He manages these issues by overseeing the Eco-Effectiveness Leadership Team. The EVP of Operations has responsibility for climate-related issues because of his management ofthe Eco-Effective Leadership Team, which has direct oversight for the achievement of our climate-change related goals.
The Chief Sustainability Officer (CSO) is a key leader of the Sustainable Business Council (SBC), which reviews targets and metricsquarterly. The SBC consists of cross-functional committees (Responsible Sourcing, Eco-Effectiveness, Corporate Sustainability andProduct Design) which are in turn led by the appropriate Executive Committee (EC) member and supported by a member of theGlobal Sustainability team. The CSO has responsibility for climate-related issues because each of these committees drivessustainability throughout that function, raises potential issues and provides regular updates to the SBC on progress. The CSOposition is also charged with driving low-carbon and circular-economy solutions into the R&D process.
These positions and our organization more broadly monitor climate-related issues through engagement with the World BusinessCouncil for Sustainable Development (WBCSD). Our Chairman and CEO, VP of Global Sustainability, and CSO each participate inWBCSD. Our Chairman and CEO was elected to the EC. Our engagement with the WBCSD, which holds forums and climate policygroups that provide information and trends on climate-related issues, is an opportunity to work with influential leaders to monitor theseissues and make positive, lasting changes in society. Additionally, these positions also attend other forums, such as CDP events, tostay abreast of changes on key climate-related issues.
Our Eco-Effectiveness Leadership Team, which is composed of the VP’s of Operations Globally as well as subject matter experts andoperations representatives from each of our regions, drives climate change management in Operations and has implementednumerous projects to enable us to reach our 2017 climate change-related goals and achieve progress towards our 2020 climate-change related goals, which are (normalized per metric ton of production):
• reduce energy use by 20% by 2020 from a 2010 baseline;
• reduce carbon emissions by 25% by 2020 from a 2010 baseline.
In addition, the Global Risk Committee is a management risk committee made up of key members of the Company’s management tointegrate global risk activities (including climate-related issues) and to ensure appropriate prioritization of resources and alignmentacross the Company. The Global Risk Committee is co-chaired by our CFO and EVP General Counsel and Corporate Secretary. TheGlobal Risk Committee meets approximately six times per year to discuss critical risks, critique mitigation plans and review the gapanalyses. The Global Risk Committee has responsibility over climate-related issues because ESG risks are also included in thisprogram based on input from our Global Sustainability Team. The team evaluates for "Failure of climate change mitigation oradoption" and "Facility loss due to extreme weather event".
C1.3
(C1.3) Do you provide incentives for the management of climate-related issues, including the attainment of targets?Yes
C1.3a
(C1.3a) Provide further details on the incentives provided for the management of climate-related issues.
Who is entitled to benefit from these incentives?
CDP Page of 894
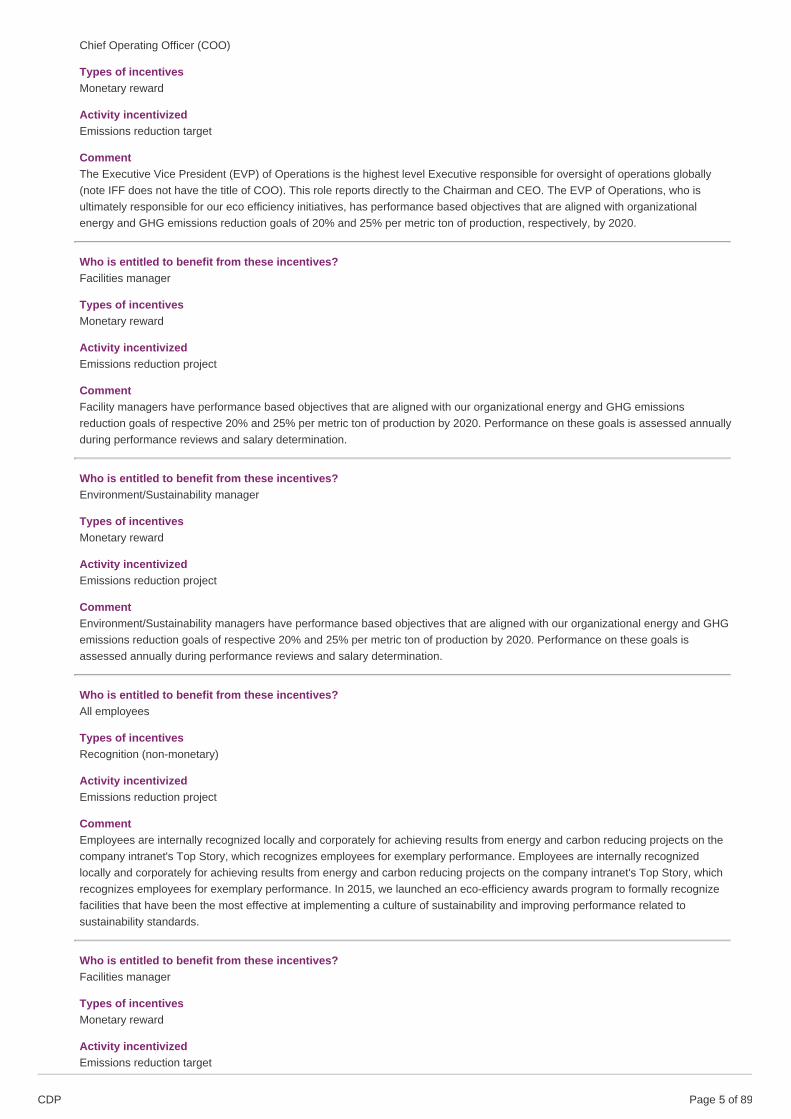
Chief Operating Officer (COO)
Types of incentivesMonetary reward
Activity incentivizedEmissions reduction target
CommentThe Executive Vice President (EVP) of Operations is the highest level Executive responsible for oversight of operations globally(note IFF does not have the title of COO). This role reports directly to the Chairman and CEO. The EVP of Operations, who isultimately responsible for our eco efficiency initiatives, has performance based objectives that are aligned with organizationalenergy and GHG emissions reduction goals of 20% and 25% per metric ton of production, respectively, by 2020.
Who is entitled to benefit from these incentives?Facilities manager
Types of incentivesMonetary reward
Activity incentivizedEmissions reduction project
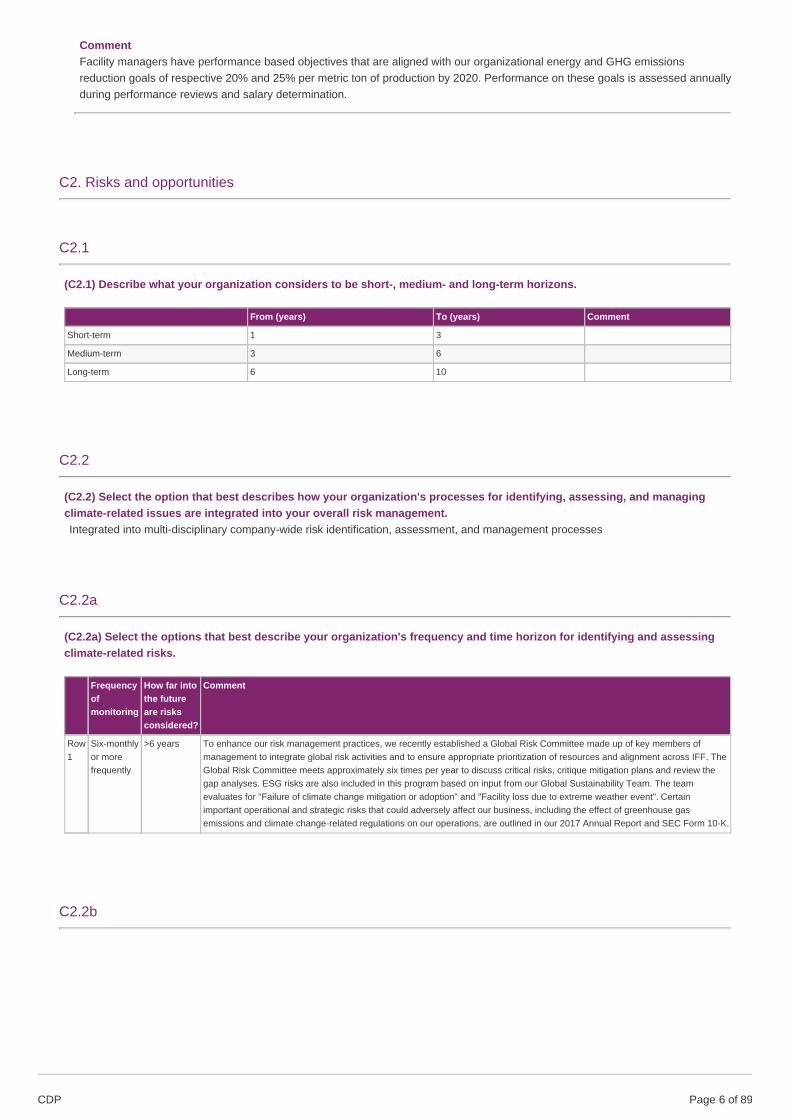
CommentFacility managers have performance based objectives that are aligned with our organizational energy and GHG emissionsreduction goals of respective 20% and 25% per metric ton of production by 2020. Performance on these goals is assessed annuallyduring performance reviews and salary determination.
Who is entitled to benefit from these incentives?Environment/Sustainability manager
Types of incentivesMonetary reward
Activity incentivizedEmissions reduction project
CommentEnvironment/Sustainability managers have performance based objectives that are aligned with our organizational energy and GHGemissions reduction goals of respective 20% and 25% per metric ton of production by 2020. Performance on these goals isassessed annually during performance reviews and salary determination.
Who is entitled to benefit from these incentives?All employees
Types of incentivesRecognition (non-monetary)
Activity incentivizedEmissions reduction project
CommentEmployees are internally recognized locally and corporately for achieving results from energy and carbon reducing projects on thecompany intranet's Top Story, which recognizes employees for exemplary performance. Employees are internally recognizedlocally and corporately for achieving results from energy and carbon reducing projects on the company intranet's Top Story, whichrecognizes employees for exemplary performance. In 2015, we launched an eco-efficiency awards program to formally recognizefacilities that have been the most effective at implementing a culture of sustainability and improving performance related tosustainability standards.
Who is entitled to benefit from these incentives?Facilities manager
Types of incentivesMonetary reward
Activity incentivizedEmissions reduction target
CDP Page of 895
CommentFacility managers have performance based objectives that are aligned with our organizational energy and GHG emissionsreduction goals of respective 20% and 25% per metric ton of production by 2020. Performance on these goals is assessed annuallyduring performance reviews and salary determination.
C2. Risks and opportunities
C2.1
(C2.1) Describe what your organization considers to be short-, medium- and long-term horizons.
From (years) To (years) Comment
Short-term 1 3
Medium-term 3 6
Long-term 6 10
C2.2
(C2.2) Select the option that best describes how your organization's processes for identifying, assessing, and managingclimate-related issues are integrated into your overall risk management.Integrated into multi-disciplinary company-wide risk identification, assessment, and management processes
C2.2a
(C2.2a) Select the options that best describe your organization's frequency and time horizon for identifying and assessingclimate-related risks.
Frequencyofmonitoring
How far intothe futureare risksconsidered?
Comment
Row1
Six-monthlyor morefrequently
>6 years To enhance our risk management practices, we recently established a Global Risk Committee made up of key members ofmanagement to integrate global risk activities and to ensure appropriate prioritization of resources and alignment across IFF. TheGlobal Risk Committee meets approximately six times per year to discuss critical risks, critique mitigation plans and review thegap analyses. ESG risks are also included in this program based on input from our Global Sustainability Team. The teamevaluates for "Failure of climate change mitigation or adoption" and "Facility loss due to extreme weather event". Certainimportant operational and strategic risks that could adversely affect our business, including the effect of greenhouse gasemissions and climate change-related regulations on our operations, are outlined in our 2017 Annual Report and SEC Form 10-K.
C2.2b
CDP Page of 896

(C2.2b) Provide further details on your organization’s process(es) for identifying and assessing climate-related risks.
At the corporate level, IFF’s general approach for identifying and assessing significant risks and opportunities relies on ourmanagement’s evaluation of current events and its expectations regarding future developments. We have a multidisciplinarycompany-wide enterprise risk management program that assesses risks, including sustainability issues and climate change, on ourbusiness and the business of our customers. The Global Risk Committee made up of key members of management oversees thisprogram and integrates global risk activities to ensure appropriate prioritization of resources and alignment across IFF. We semi-annually prepare and review a risk dashboard with senior management and the Board of Directors. When prioritizing risks andopportunities, our strategic pillars are the starting point. However, we also identify natural disasters and other climate-relatedexposures as part of our process. As it relates to prioritization, consideration is also given to the following items: impact; both internaland external influences; our current capability and prior experience in mitigating such risks; and our expectations of the future outlookfor the identified risk. Risks beyond 6 years are considered.
We define 'substantive financial impact' when identifying or assessing climate-related risks as any change that would significantlyaffect our business, operations, revenue or expenditure.
In addition, we conducted a structured materiality analysis to identify the issues of most importance to our company and ourstakeholders, including size, scope and significance of identified risks. The materiality analysis identified several issues that arerelevant to IFF, have global impact and influence product and facility energy and carbon management. We first assessed themateriality of conventional and emerging sustainability and carbon management issues in 2010. We evaluated these issues for theirimportance to our stakeholders, their potential impact on our business and the degree of influence that we had on each issue. Wecontinue to engage with stakeholders, solicit feedback and refine our focus and approach. In 2014, we formally updated ourmateriality work by soliciting feedback from IFF employees, including our Sustainability Steering Team, key customers, academicsand NGOs. This input helped us further refine IFF’s sustainability strategy and reporting. At IFF, we know that our approach tosustainability and carbon management must continually evolve, and we will continue to engage with stakeholders through dialogueon sustainability and materiality.
At the asset level, we have global and regional crisis-management plans and procedures, and we conduct training for members of ourcross-functional global and regional crisis teams. In addition, each IFF facility assesses local risks and has a crisis management plan.Our regional and site level Eco-efficiency champions also play the role of conveying risks detected on the ground up through tocorporate executives, who review risks annually. We also conducted a formalized materiality analysis to identify the issues of mostimportance to our company and our stakeholders.
C2.2c
(C2.2c) Which of the following risk types are considered in your organization's climate-related risk assessments?
Relevance&inclusion
Please explain
Currentregulation
Relevant,alwaysincluded
We operate on a global basis, with manufacturing and sales facilities in the United States, Europe, Africa, the Middle East, Latin Americaand Greater Asia. Any regulation that increases the cost of raw materials or commodities, particularly energy used to operate ourfacilities, has the potential to impact our profit margins and operations. In particular, various current regulatory efforts in environmental(including climate change), health and safety regulations and similar regulations could impact costs for our operations or supply chain. Asa result, current regulations are always included in our climate-related risk assessments. To enhance our risk management practices, werecently established a Global Risk Committee made up of key members of management to integrate global risk activities (includingcybersecurity, compliance, business and crisis management) and to ensure appropriate prioritization of resources and alignment acrossIFF. The Global Risk Committee meets approximately six times per year to discuss critical risks, including current regulation, and thencritique mitigation plans and review the gap analyses. ESG risks are also included in this program based on input from our GlobalSustainability Team. One example of a considered potential risk from current regulation specific to IFF is compliance with environmentalregulations for our Tilburg facility in the Netherlands, which requires annual reporting of energy and carbon emissions. To address this,we developed a plan for reducing energy at this facility. The result of this process was that the risk was determined to not be asubstantive risk for the business. However, new or changes to other environmental regulations could have a material impact on ourbusiness. For additional information, please see our 2017 Annual Report.
CDP Page of 897
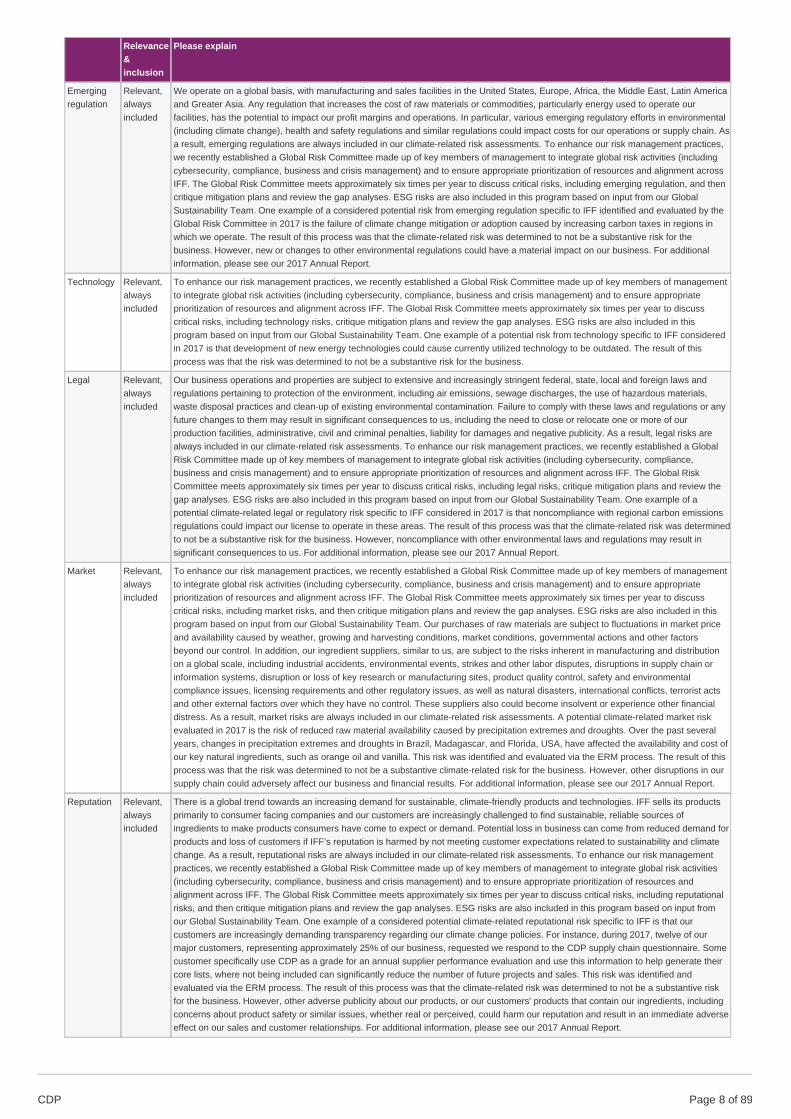
Emergingregulation
Relevant,alwaysincluded
We operate on a global basis, with manufacturing and sales facilities in the United States, Europe, Africa, the Middle East, Latin Americaand Greater Asia. Any regulation that increases the cost of raw materials or commodities, particularly energy used to operate ourfacilities, has the potential to impact our profit margins and operations. In particular, various emerging regulatory efforts in environmental(including climate change), health and safety regulations and similar regulations could impact costs for our operations or supply chain. Asa result, emerging regulations are always included in our climate-related risk assessments. To enhance our risk management practices,we recently established a Global Risk Committee made up of key members of management to integrate global risk activities (includingcybersecurity, compliance, business and crisis management) and to ensure appropriate prioritization of resources and alignment acrossIFF. The Global Risk Committee meets approximately six times per year to discuss critical risks, including emerging regulation, and thencritique mitigation plans and review the gap analyses. ESG risks are also included in this program based on input from our GlobalSustainability Team. One example of a considered potential risk from emerging regulation specific to IFF identified and evaluated by theGlobal Risk Committee in 2017 is the failure of climate change mitigation or adoption caused by increasing carbon taxes in regions inwhich we operate. The result of this process was that the climate-related risk was determined to not be a substantive risk for thebusiness. However, new or changes to other environmental regulations could have a material impact on our business. For additionalinformation, please see our 2017 Annual Report.
Technology Relevant,alwaysincluded
To enhance our risk management practices, we recently established a Global Risk Committee made up of key members of managementto integrate global risk activities (including cybersecurity, compliance, business and crisis management) and to ensure appropriateprioritization of resources and alignment across IFF. The Global Risk Committee meets approximately six times per year to discusscritical risks, including technology risks, critique mitigation plans and review the gap analyses. ESG risks are also included in thisprogram based on input from our Global Sustainability Team. One example of a potential risk from technology specific to IFF consideredin 2017 is that development of new energy technologies could cause currently utilized technology to be outdated. The result of thisprocess was that the risk was determined to not be a substantive risk for the business.
Legal Relevant,alwaysincluded
Our business operations and properties are subject to extensive and increasingly stringent federal, state, local and foreign laws andregulations pertaining to protection of the environment, including air emissions, sewage discharges, the use of hazardous materials,waste disposal practices and clean-up of existing environmental contamination. Failure to comply with these laws and regulations or anyfuture changes to them may result in significant consequences to us, including the need to close or relocate one or more of ourproduction facilities, administrative, civil and criminal penalties, liability for damages and negative publicity. As a result, legal risks arealways included in our climate-related risk assessments. To enhance our risk management practices, we recently established a GlobalRisk Committee made up of key members of management to integrate global risk activities (including cybersecurity, compliance,business and crisis management) and to ensure appropriate prioritization of resources and alignment across IFF. The Global RiskCommittee meets approximately six times per year to discuss critical risks, including legal risks, critique mitigation plans and review thegap analyses. ESG risks are also included in this program based on input from our Global Sustainability Team. One example of apotential climate-related legal or regulatory risk specific to IFF considered in 2017 is that noncompliance with regional carbon emissionsregulations could impact our license to operate in these areas. The result of this process was that the climate-related risk was determinedto not be a substantive risk for the business. However, noncompliance with other environmental laws and regulations may result insignificant consequences to us. For additional information, please see our 2017 Annual Report.
Market Relevant,alwaysincluded
To enhance our risk management practices, we recently established a Global Risk Committee made up of key members of managementto integrate global risk activities (including cybersecurity, compliance, business and crisis management) and to ensure appropriateprioritization of resources and alignment across IFF. The Global Risk Committee meets approximately six times per year to discusscritical risks, including market risks, and then critique mitigation plans and review the gap analyses. ESG risks are also included in thisprogram based on input from our Global Sustainability Team. Our purchases of raw materials are subject to fluctuations in market priceand availability caused by weather, growing and harvesting conditions, market conditions, governmental actions and other factorsbeyond our control. In addition, our ingredient suppliers, similar to us, are subject to the risks inherent in manufacturing and distributionon a global scale, including industrial accidents, environmental events, strikes and other labor disputes, disruptions in supply chain orinformation systems, disruption or loss of key research or manufacturing sites, product quality control, safety and environmentalcompliance issues, licensing requirements and other regulatory issues, as well as natural disasters, international conflicts, terrorist actsand other external factors over which they have no control. These suppliers also could become insolvent or experience other financialdistress. As a result, market risks are always included in our climate-related risk assessments. A potential climate-related market riskevaluated in 2017 is the risk of reduced raw material availability caused by precipitation extremes and droughts. Over the past severalyears, changes in precipitation extremes and droughts in Brazil, Madagascar, and Florida, USA, have affected the availability and cost ofour key natural ingredients, such as orange oil and vanilla. This risk was identified and evaluated via the ERM process. The result of thisprocess was that the risk was determined to not be a substantive climate-related risk for the business. However, other disruptions in oursupply chain could adversely affect our business and financial results. For additional information, please see our 2017 Annual Report.
Reputation Relevant,alwaysincluded
There is a global trend towards an increasing demand for sustainable, climate-friendly products and technologies. IFF sells its productsprimarily to consumer facing companies and our customers are increasingly challenged to find sustainable, reliable sources ofingredients to make products consumers have come to expect or demand. Potential loss in business can come from reduced demand forproducts and loss of customers if IFF’s reputation is harmed by not meeting customer expectations related to sustainability and climatechange. As a result, reputational risks are always included in our climate-related risk assessments. To enhance our risk managementpractices, we recently established a Global Risk Committee made up of key members of management to integrate global risk activities(including cybersecurity, compliance, business and crisis management) and to ensure appropriate prioritization of resources andalignment across IFF. The Global Risk Committee meets approximately six times per year to discuss critical risks, including reputationalrisks, and then critique mitigation plans and review the gap analyses. ESG risks are also included in this program based on input fromour Global Sustainability Team. One example of a considered potential climate-related reputational risk specific to IFF is that ourcustomers are increasingly demanding transparency regarding our climate change policies. For instance, during 2017, twelve of ourmajor customers, representing approximately 25% of our business, requested we respond to the CDP supply chain questionnaire. Somecustomer specifically use CDP as a grade for an annual supplier performance evaluation and use this information to help generate theircore lists, where not being included can significantly reduce the number of future projects and sales. This risk was identified andevaluated via the ERM process. The result of this process was that the climate-related risk was determined to not be a substantive riskfor the business. However, other adverse publicity about our products, or our customers' products that contain our ingredients, includingconcerns about product safety or similar issues, whether real or perceived, could harm our reputation and result in an immediate adverseeffect on our sales and customer relationships. For additional information, please see our 2017 Annual Report.
Relevance&inclusion
Please explain
CDP Page of 898
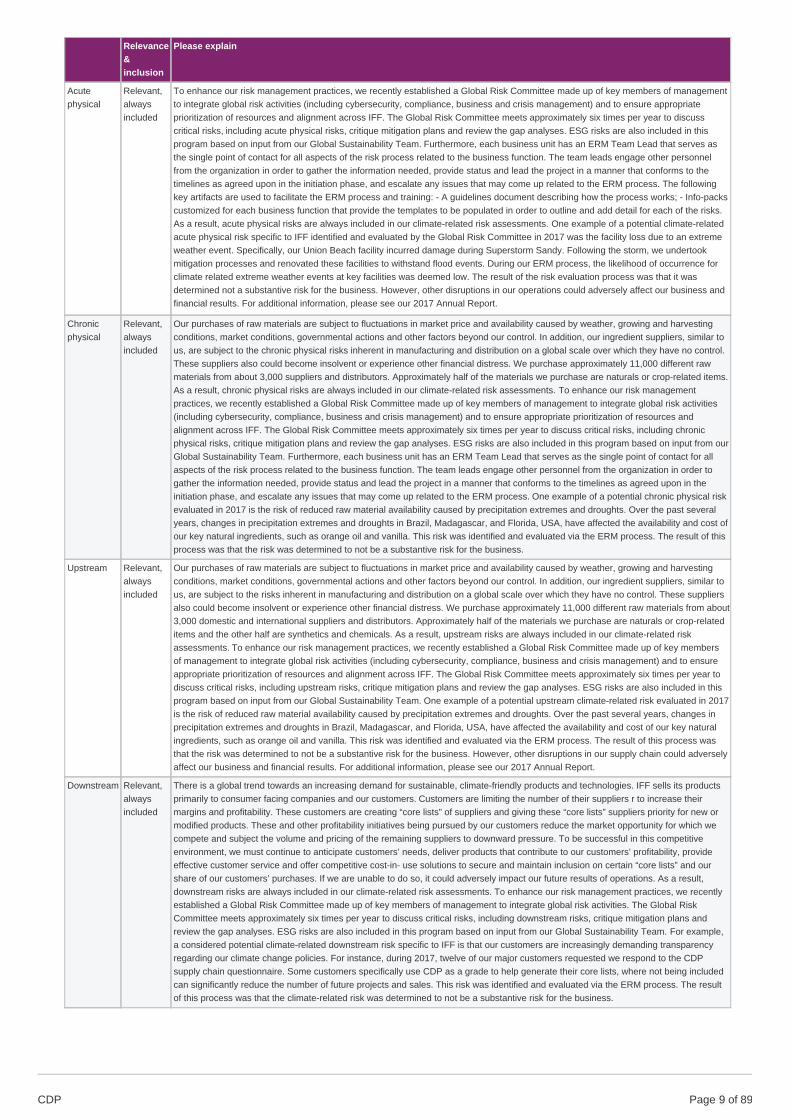
Acutephysical
Relevant,alwaysincluded
To enhance our risk management practices, we recently established a Global Risk Committee made up of key members of managementto integrate global risk activities (including cybersecurity, compliance, business and crisis management) and to ensure appropriateprioritization of resources and alignment across IFF. The Global Risk Committee meets approximately six times per year to discusscritical risks, including acute physical risks, critique mitigation plans and review the gap analyses. ESG risks are also included in thisprogram based on input from our Global Sustainability Team. Furthermore, each business unit has an ERM Team Lead that serves asthe single point of contact for all aspects of the risk process related to the business function. The team leads engage other personnelfrom the organization in order to gather the information needed, provide status and lead the project in a manner that conforms to thetimelines as agreed upon in the initiation phase, and escalate any issues that may come up related to the ERM process. The followingkey artifacts are used to facilitate the ERM process and training: - A guidelines document describing how the process works; - Info-packscustomized for each business function that provide the templates to be populated in order to outline and add detail for each of the risks.As a result, acute physical risks are always included in our climate-related risk assessments. One example of a potential climate-relatedacute physical risk specific to IFF identified and evaluated by the Global Risk Committee in 2017 was the facility loss due to an extremeweather event. Specifically, our Union Beach facility incurred damage during Superstorm Sandy. Following the storm, we undertookmitigation processes and renovated these facilities to withstand flood events. During our ERM process, the likelihood of occurrence forclimate related extreme weather events at key facilities was deemed low. The result of the risk evaluation process was that it wasdetermined not a substantive risk for the business. However, other disruptions in our operations could adversely affect our business andfinancial results. For additional information, please see our 2017 Annual Report.
Chronicphysical
Relevant,alwaysincluded
Our purchases of raw materials are subject to fluctuations in market price and availability caused by weather, growing and harvestingconditions, market conditions, governmental actions and other factors beyond our control. In addition, our ingredient suppliers, similar tous, are subject to the chronic physical risks inherent in manufacturing and distribution on a global scale over which they have no control.These suppliers also could become insolvent or experience other financial distress. We purchase approximately 11,000 different rawmaterials from about 3,000 suppliers and distributors. Approximately half of the materials we purchase are naturals or crop-related items.As a result, chronic physical risks are always included in our climate-related risk assessments. To enhance our risk managementpractices, we recently established a Global Risk Committee made up of key members of management to integrate global risk activities(including cybersecurity, compliance, business and crisis management) and to ensure appropriate prioritization of resources andalignment across IFF. The Global Risk Committee meets approximately six times per year to discuss critical risks, including chronicphysical risks, critique mitigation plans and review the gap analyses. ESG risks are also included in this program based on input from ourGlobal Sustainability Team. Furthermore, each business unit has an ERM Team Lead that serves as the single point of contact for allaspects of the risk process related to the business function. The team leads engage other personnel from the organization in order togather the information needed, provide status and lead the project in a manner that conforms to the timelines as agreed upon in theinitiation phase, and escalate any issues that may come up related to the ERM process. One example of a potential chronic physical riskevaluated in 2017 is the risk of reduced raw material availability caused by precipitation extremes and droughts. Over the past severalyears, changes in precipitation extremes and droughts in Brazil, Madagascar, and Florida, USA, have affected the availability and cost ofour key natural ingredients, such as orange oil and vanilla. This risk was identified and evaluated via the ERM process. The result of thisprocess was that the risk was determined to not be a substantive risk for the business.
Upstream Relevant,alwaysincluded
Our purchases of raw materials are subject to fluctuations in market price and availability caused by weather, growing and harvestingconditions, market conditions, governmental actions and other factors beyond our control. In addition, our ingredient suppliers, similar tous, are subject to the risks inherent in manufacturing and distribution on a global scale over which they have no control. These suppliersalso could become insolvent or experience other financial distress. We purchase approximately 11,000 different raw materials from about3,000 domestic and international suppliers and distributors. Approximately half of the materials we purchase are naturals or crop-relateditems and the other half are synthetics and chemicals. As a result, upstream risks are always included in our climate-related riskassessments. To enhance our risk management practices, we recently established a Global Risk Committee made up of key membersof management to integrate global risk activities (including cybersecurity, compliance, business and crisis management) and to ensureappropriate prioritization of resources and alignment across IFF. The Global Risk Committee meets approximately six times per year todiscuss critical risks, including upstream risks, critique mitigation plans and review the gap analyses. ESG risks are also included in thisprogram based on input from our Global Sustainability Team. One example of a potential upstream climate-related risk evaluated in 2017is the risk of reduced raw material availability caused by precipitation extremes and droughts. Over the past several years, changes inprecipitation extremes and droughts in Brazil, Madagascar, and Florida, USA, have affected the availability and cost of our key naturalingredients, such as orange oil and vanilla. This risk was identified and evaluated via the ERM process. The result of this process wasthat the risk was determined to not be a substantive risk for the business. However, other disruptions in our supply chain could adverselyaffect our business and financial results. For additional information, please see our 2017 Annual Report.
Downstream Relevant,alwaysincluded
There is a global trend towards an increasing demand for sustainable, climate-friendly products and technologies. IFF sells its productsprimarily to consumer facing companies and our customers. Customers are limiting the number of their suppliers r to increase theirmargins and profitability. These customers are creating “core lists” of suppliers and giving these “core lists” suppliers priority for new ormodified products. These and other profitability initiatives being pursued by our customers reduce the market opportunity for which wecompete and subject the volume and pricing of the remaining suppliers to downward pressure. To be successful in this competitiveenvironment, we must continue to anticipate customers’ needs, deliver products that contribute to our customers’ profitability, provideeffective customer service and offer competitive cost-in- use solutions to secure and maintain inclusion on certain “core lists” and ourshare of our customers’ purchases. If we are unable to do so, it could adversely impact our future results of operations. As a result,downstream risks are always included in our climate-related risk assessments. To enhance our risk management practices, we recentlyestablished a Global Risk Committee made up of key members of management to integrate global risk activities. The Global RiskCommittee meets approximately six times per year to discuss critical risks, including downstream risks, critique mitigation plans andreview the gap analyses. ESG risks are also included in this program based on input from our Global Sustainability Team. For example,a considered potential climate-related downstream risk specific to IFF is that our customers are increasingly demanding transparencyregarding our climate change policies. For instance, during 2017, twelve of our major customers requested we respond to the CDPsupply chain questionnaire. Some customers specifically use CDP as a grade to help generate their core lists, where not being includedcan significantly reduce the number of future projects and sales. This risk was identified and evaluated via the ERM process. The resultof this process was that the climate-related risk was determined to not be a substantive risk for the business.
Relevance&inclusion
Please explain
CDP Page of 899

C2.2d
CDP Page of 8910
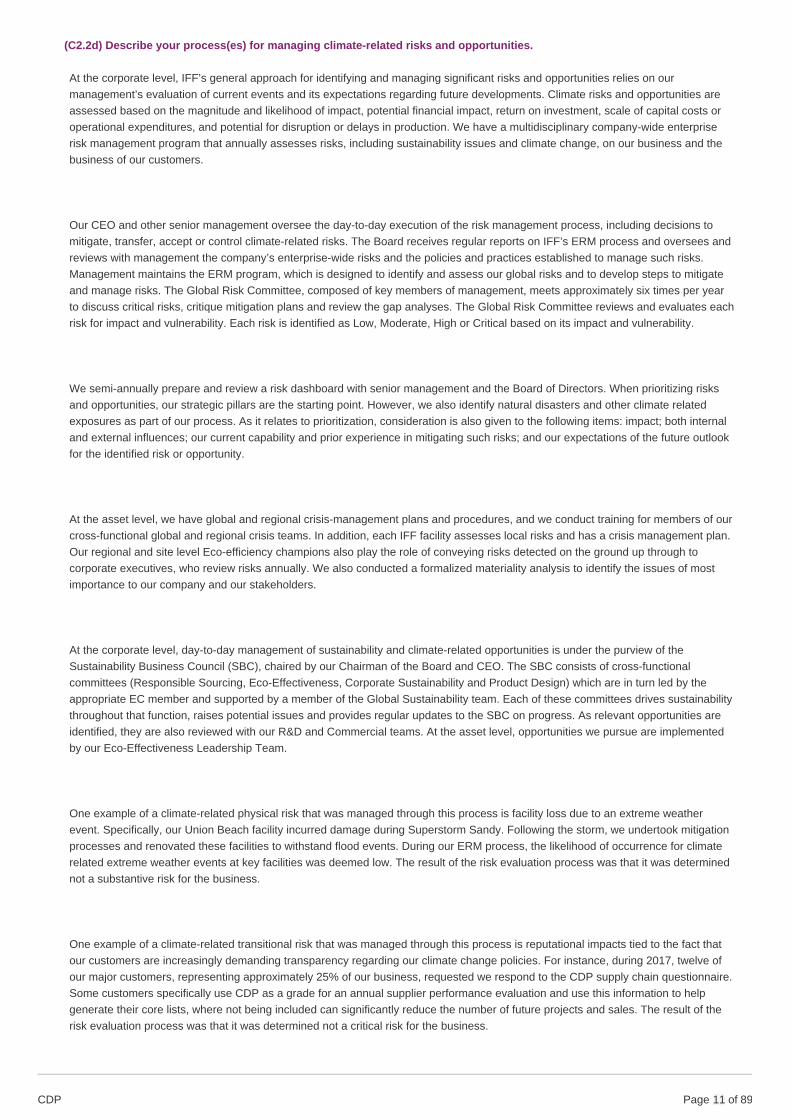
(C2.2d) Describe your process(es) for managing climate-related risks and opportunities.
At the corporate level, IFF’s general approach for identifying and managing significant risks and opportunities relies on ourmanagement’s evaluation of current events and its expectations regarding future developments. Climate risks and opportunities areassessed based on the magnitude and likelihood of impact, potential financial impact, return on investment, scale of capital costs oroperational expenditures, and potential for disruption or delays in production. We have a multidisciplinary company-wide enterpriserisk management program that annually assesses risks, including sustainability issues and climate change, on our business and thebusiness of our customers.
Our CEO and other senior management oversee the day-to-day execution of the risk management process, including decisions tomitigate, transfer, accept or control climate-related risks. The Board receives regular reports on IFF’s ERM process and oversees andreviews with management the company’s enterprise-wide risks and the policies and practices established to manage such risks.Management maintains the ERM program, which is designed to identify and assess our global risks and to develop steps to mitigateand manage risks. The Global Risk Committee, composed of key members of management, meets approximately six times per yearto discuss critical risks, critique mitigation plans and review the gap analyses. The Global Risk Committee reviews and evaluates eachrisk for impact and vulnerability. Each risk is identified as Low, Moderate, High or Critical based on its impact and vulnerability.
We semi-annually prepare and review a risk dashboard with senior management and the Board of Directors. When prioritizing risksand opportunities, our strategic pillars are the starting point. However, we also identify natural disasters and other climate relatedexposures as part of our process. As it relates to prioritization, consideration is also given to the following items: impact; both internaland external influences; our current capability and prior experience in mitigating such risks; and our expectations of the future outlookfor the identified risk or opportunity.
At the asset level, we have global and regional crisis-management plans and procedures, and we conduct training for members of ourcross-functional global and regional crisis teams. In addition, each IFF facility assesses local risks and has a crisis management plan.Our regional and site level Eco-efficiency champions also play the role of conveying risks detected on the ground up through tocorporate executives, who review risks annually. We also conducted a formalized materiality analysis to identify the issues of mostimportance to our company and our stakeholders.
At the corporate level, day-to-day management of sustainability and climate-related opportunities is under the purview of theSustainability Business Council (SBC), chaired by our Chairman of the Board and CEO. The SBC consists of cross-functionalcommittees (Responsible Sourcing, Eco-Effectiveness, Corporate Sustainability and Product Design) which are in turn led by theappropriate EC member and supported by a member of the Global Sustainability team. Each of these committees drives sustainabilitythroughout that function, raises potential issues and provides regular updates to the SBC on progress. As relevant opportunities areidentified, they are also reviewed with our R&D and Commercial teams. At the asset level, opportunities we pursue are implementedby our Eco-Effectiveness Leadership Team.
One example of a climate-related physical risk that was managed through this process is facility loss due to an extreme weatherevent. Specifically, our Union Beach facility incurred damage during Superstorm Sandy. Following the storm, we undertook mitigationprocesses and renovated these facilities to withstand flood events. During our ERM process, the likelihood of occurrence for climaterelated extreme weather events at key facilities was deemed low. The result of the risk evaluation process was that it was determinednot a substantive risk for the business.
One example of a climate-related transitional risk that was managed through this process is reputational impacts tied to the fact thatour customers are increasingly demanding transparency regarding our climate change policies. For instance, during 2017, twelve ofour major customers, representing approximately 25% of our business, requested we respond to the CDP supply chain questionnaire.Some customers specifically use CDP as a grade for an annual supplier performance evaluation and use this information to helpgenerate their core lists, where not being included can significantly reduce the number of future projects and sales. The result of therisk evaluation process was that it was determined not a critical risk for the business.
CDP Page of 8911
C2.3
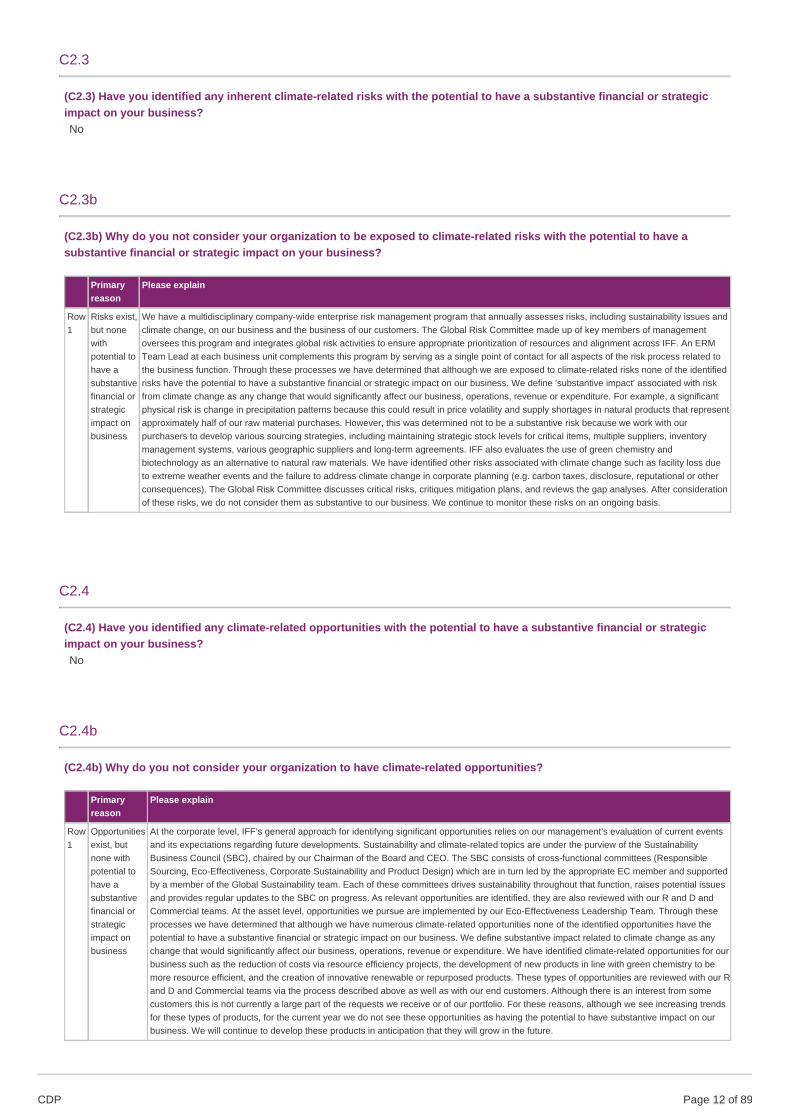
(C2.3) Have you identified any inherent climate-related risks with the potential to have a substantive financial or strategicimpact on your business?No
C2.3b
(C2.3b) Why do you not consider your organization to be exposed to climate-related risks with the potential to have asubstantive financial or strategic impact on your business?
Primaryreason
Please explain
Row1
Risks exist,but nonewithpotential tohave asubstantivefinancial orstrategicimpact onbusiness
We have a multidisciplinary company-wide enterprise risk management program that annually assesses risks, including sustainability issues andclimate change, on our business and the business of our customers. The Global Risk Committee made up of key members of managementoversees this program and integrates global risk activities to ensure appropriate prioritization of resources and alignment across IFF. An ERMTeam Lead at each business unit complements this program by serving as a single point of contact for all aspects of the risk process related tothe business function. Through these processes we have determined that although we are exposed to climate-related risks none of the identifiedrisks have the potential to have a substantive financial or strategic impact on our business. We define 'substantive impact' associated with riskfrom climate change as any change that would significantly affect our business, operations, revenue or expenditure. For example, a significantphysical risk is change in precipitation patterns because this could result in price volatility and supply shortages in natural products that representapproximately half of our raw material purchases. However, this was determined not to be a substantive risk because we work with ourpurchasers to develop various sourcing strategies, including maintaining strategic stock levels for critical items, multiple suppliers, inventorymanagement systems, various geographic suppliers and long-term agreements. IFF also evaluates the use of green chemistry andbiotechnology as an alternative to natural raw materials. We have identified other risks associated with climate change such as facility loss dueto extreme weather events and the failure to address climate change in corporate planning (e.g. carbon taxes, disclosure, reputational or otherconsequences). The Global Risk Committee discusses critical risks, critiques mitigation plans, and reviews the gap analyses. After considerationof these risks, we do not consider them as substantive to our business. We continue to monitor these risks on an ongoing basis.
C2.4
(C2.4) Have you identified any climate-related opportunities with the potential to have a substantive financial or strategicimpact on your business?No
C2.4b
(C2.4b) Why do you not consider your organization to have climate-related opportunities?
Primaryreason
Please explain
Row1
Opportunitiesexist, butnone withpotential tohave asubstantivefinancial orstrategicimpact onbusiness
At the corporate level, IFF’s general approach for identifying significant opportunities relies on our management’s evaluation of current eventsand its expectations regarding future developments. Sustainability and climate-related topics are under the purview of the SustainabilityBusiness Council (SBC), chaired by our Chairman of the Board and CEO. The SBC consists of cross-functional committees (ResponsibleSourcing, Eco-Effectiveness, Corporate Sustainability and Product Design) which are in turn led by the appropriate EC member and supportedby a member of the Global Sustainability team. Each of these committees drives sustainability throughout that function, raises potential issuesand provides regular updates to the SBC on progress. As relevant opportunities are identified, they are also reviewed with our R and D andCommercial teams. At the asset level, opportunities we pursue are implemented by our Eco-Effectiveness Leadership Team. Through theseprocesses we have determined that although we have numerous climate-related opportunities none of the identified opportunities have thepotential to have a substantive financial or strategic impact on our business. We define substantive impact related to climate change as anychange that would significantly affect our business, operations, revenue or expenditure. We have identified climate-related opportunities for ourbusiness such as the reduction of costs via resource efficiency projects, the development of new products in line with green chemistry to bemore resource efficient, and the creation of innovative renewable or repurposed products. These types of opportunities are reviewed with our Rand D and Commercial teams via the process described above as well as with our end customers. Although there is an interest from somecustomers this is not currently a large part of the requests we receive or of our portfolio. For these reasons, although we see increasing trendsfor these types of products, for the current year we do not see these opportunities as having the potential to have substantive impact on ourbusiness. We will continue to develop these products in anticipation that they will grow in the future.
CDP Page of 8912
C2.5
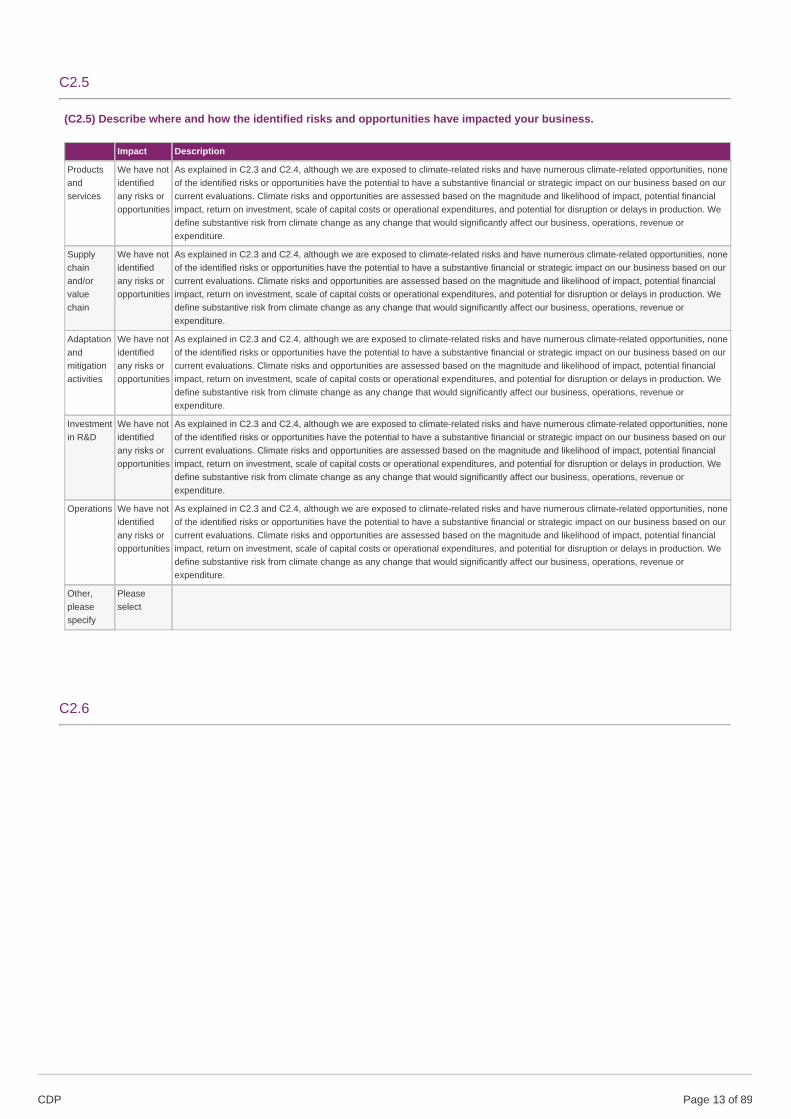
(C2.5) Describe where and how the identified risks and opportunities have impacted your business.
Impact Description
Productsandservices
We have notidentifiedany risks oropportunities
As explained in C2.3 and C2.4, although we are exposed to climate-related risks and have numerous climate-related opportunities, noneof the identified risks or opportunities have the potential to have a substantive financial or strategic impact on our business based on ourcurrent evaluations. Climate risks and opportunities are assessed based on the magnitude and likelihood of impact, potential financialimpact, return on investment, scale of capital costs or operational expenditures, and potential for disruption or delays in production. Wedefine substantive risk from climate change as any change that would significantly affect our business, operations, revenue orexpenditure.
Supplychainand/orvaluechain
We have notidentifiedany risks oropportunities
As explained in C2.3 and C2.4, although we are exposed to climate-related risks and have numerous climate-related opportunities, noneof the identified risks or opportunities have the potential to have a substantive financial or strategic impact on our business based on ourcurrent evaluations. Climate risks and opportunities are assessed based on the magnitude and likelihood of impact, potential financialimpact, return on investment, scale of capital costs or operational expenditures, and potential for disruption or delays in production. Wedefine substantive risk from climate change as any change that would significantly affect our business, operations, revenue orexpenditure.
Adaptationandmitigationactivities
We have notidentifiedany risks oropportunities
As explained in C2.3 and C2.4, although we are exposed to climate-related risks and have numerous climate-related opportunities, noneof the identified risks or opportunities have the potential to have a substantive financial or strategic impact on our business based on ourcurrent evaluations. Climate risks and opportunities are assessed based on the magnitude and likelihood of impact, potential financialimpact, return on investment, scale of capital costs or operational expenditures, and potential for disruption or delays in production. Wedefine substantive risk from climate change as any change that would significantly affect our business, operations, revenue orexpenditure.
Investmentin R&D
We have notidentifiedany risks oropportunities
As explained in C2.3 and C2.4, although we are exposed to climate-related risks and have numerous climate-related opportunities, noneof the identified risks or opportunities have the potential to have a substantive financial or strategic impact on our business based on ourcurrent evaluations. Climate risks and opportunities are assessed based on the magnitude and likelihood of impact, potential financialimpact, return on investment, scale of capital costs or operational expenditures, and potential for disruption or delays in production. Wedefine substantive risk from climate change as any change that would significantly affect our business, operations, revenue orexpenditure.
Operations We have notidentifiedany risks oropportunities
As explained in C2.3 and C2.4, although we are exposed to climate-related risks and have numerous climate-related opportunities, noneof the identified risks or opportunities have the potential to have a substantive financial or strategic impact on our business based on ourcurrent evaluations. Climate risks and opportunities are assessed based on the magnitude and likelihood of impact, potential financialimpact, return on investment, scale of capital costs or operational expenditures, and potential for disruption or delays in production. Wedefine substantive risk from climate change as any change that would significantly affect our business, operations, revenue orexpenditure.
Other,pleasespecify
Pleaseselect
C2.6
CDP Page of 8913
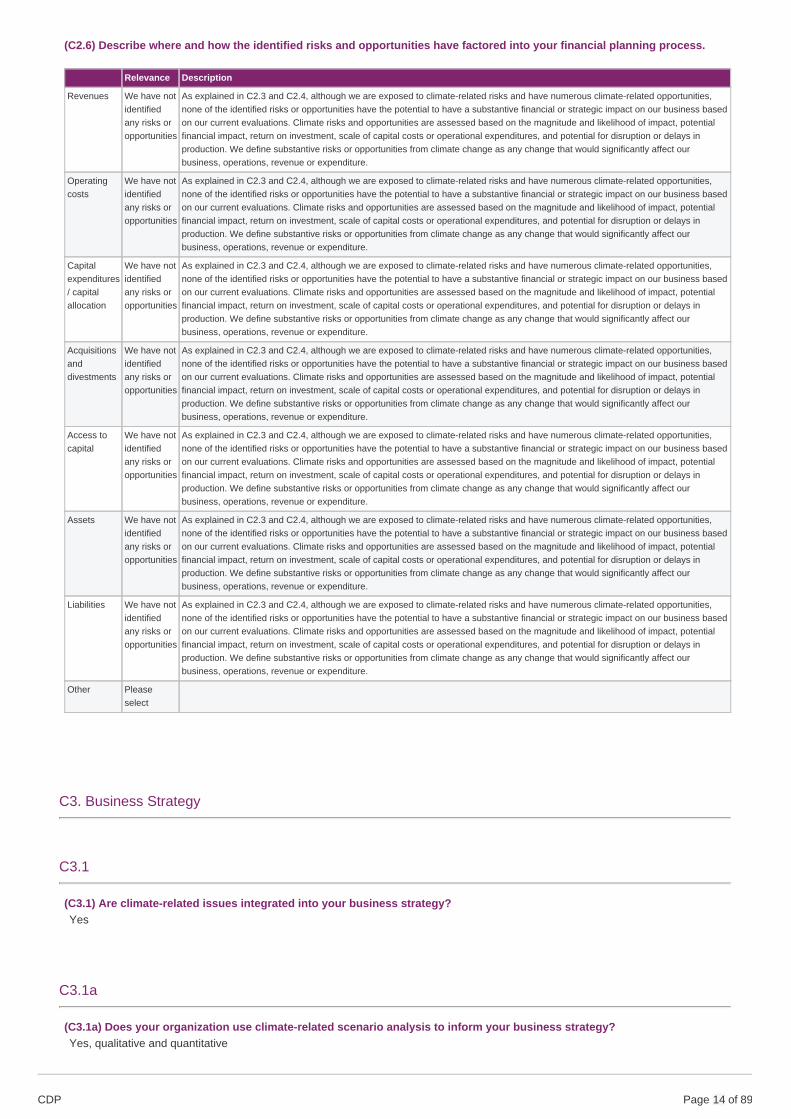
(C2.6) Describe where and how the identified risks and opportunities have factored into your financial planning process.
Relevance Description
Revenues We have notidentifiedany risks oropportunities
As explained in C2.3 and C2.4, although we are exposed to climate-related risks and have numerous climate-related opportunities,none of the identified risks or opportunities have the potential to have a substantive financial or strategic impact on our business basedon our current evaluations. Climate risks and opportunities are assessed based on the magnitude and likelihood of impact, potentialfinancial impact, return on investment, scale of capital costs or operational expenditures, and potential for disruption or delays inproduction. We define substantive risks or opportunities from climate change as any change that would significantly affect ourbusiness, operations, revenue or expenditure.
Operatingcosts
We have notidentifiedany risks oropportunities
As explained in C2.3 and C2.4, although we are exposed to climate-related risks and have numerous climate-related opportunities,none of the identified risks or opportunities have the potential to have a substantive financial or strategic impact on our business basedon our current evaluations. Climate risks and opportunities are assessed based on the magnitude and likelihood of impact, potentialfinancial impact, return on investment, scale of capital costs or operational expenditures, and potential for disruption or delays inproduction. We define substantive risks or opportunities from climate change as any change that would significantly affect ourbusiness, operations, revenue or expenditure.
Capitalexpenditures/ capitalallocation
We have notidentifiedany risks oropportunities
As explained in C2.3 and C2.4, although we are exposed to climate-related risks and have numerous climate-related opportunities,none of the identified risks or opportunities have the potential to have a substantive financial or strategic impact on our business basedon our current evaluations. Climate risks and opportunities are assessed based on the magnitude and likelihood of impact, potentialfinancial impact, return on investment, scale of capital costs or operational expenditures, and potential for disruption or delays inproduction. We define substantive risks or opportunities from climate change as any change that would significantly affect ourbusiness, operations, revenue or expenditure.
Acquisitionsanddivestments
We have notidentifiedany risks oropportunities
As explained in C2.3 and C2.4, although we are exposed to climate-related risks and have numerous climate-related opportunities,none of the identified risks or opportunities have the potential to have a substantive financial or strategic impact on our business basedon our current evaluations. Climate risks and opportunities are assessed based on the magnitude and likelihood of impact, potentialfinancial impact, return on investment, scale of capital costs or operational expenditures, and potential for disruption or delays inproduction. We define substantive risks or opportunities from climate change as any change that would significantly affect ourbusiness, operations, revenue or expenditure.
Access tocapital
We have notidentifiedany risks oropportunities
As explained in C2.3 and C2.4, although we are exposed to climate-related risks and have numerous climate-related opportunities,none of the identified risks or opportunities have the potential to have a substantive financial or strategic impact on our business basedon our current evaluations. Climate risks and opportunities are assessed based on the magnitude and likelihood of impact, potentialfinancial impact, return on investment, scale of capital costs or operational expenditures, and potential for disruption or delays inproduction. We define substantive risks or opportunities from climate change as any change that would significantly affect ourbusiness, operations, revenue or expenditure.
Assets We have notidentifiedany risks oropportunities
As explained in C2.3 and C2.4, although we are exposed to climate-related risks and have numerous climate-related opportunities,none of the identified risks or opportunities have the potential to have a substantive financial or strategic impact on our business basedon our current evaluations. Climate risks and opportunities are assessed based on the magnitude and likelihood of impact, potentialfinancial impact, return on investment, scale of capital costs or operational expenditures, and potential for disruption or delays inproduction. We define substantive risks or opportunities from climate change as any change that would significantly affect ourbusiness, operations, revenue or expenditure.
Liabilities We have notidentifiedany risks oropportunities
As explained in C2.3 and C2.4, although we are exposed to climate-related risks and have numerous climate-related opportunities,none of the identified risks or opportunities have the potential to have a substantive financial or strategic impact on our business basedon our current evaluations. Climate risks and opportunities are assessed based on the magnitude and likelihood of impact, potentialfinancial impact, return on investment, scale of capital costs or operational expenditures, and potential for disruption or delays inproduction. We define substantive risks or opportunities from climate change as any change that would significantly affect ourbusiness, operations, revenue or expenditure.
Other Pleaseselect
C3. Business Strategy
C3.1
(C3.1) Are climate-related issues integrated into your business strategy?Yes
C3.1a
(C3.1a) Does your organization use climate-related scenario analysis to inform your business strategy?Yes, qualitative and quantitative
CDP Page of 8914
C-AC3.1b/C-CE3.1b/C-CH3.1b/C-CO3.1b/C-EU3.1b/C-FB3.1b/C-MM3.1b/C-OG3.1b/C-PF3.1b/C-ST3.1b/C-TO3.1b/C-TS3.1b)
(C-AC3.1b/C-CE3.1b/C-CH3.1b/C-CO3.1b/C-EU3.1b/C-FB3.1b/C-MM3.1b/C-OG3.1b/C-PF3.1b/C-ST3.1b/C-TO3.1b/C-TS3.1b)Indicate whether your organization has developed a low-carbon transition plan to support the long-term business strategy.Yes
C3.1c
(C3.1c) Explain how climate-related issues are integrated into your business objectives and strategy.
i. How the business strategy has been influenced: Sustainability and climate change management is an enabler of our Vision 2020corporate business strategy. As we strengthen our innovation platform, we continuously work to design high quality and sustainableproducts that our customers trust. We do this through green chemistry and with a secure and ethical supply chain. Climate change-related issues such as energy efficiency influence our decisions regarding the design, building, operation and maintenance of ourfacilities and equipment. Our Sustainability Business Council and Eco-efficiency Team meet at regular intervals throughout the yearregarding IFF’s Sustainability Strategy, to define objectives, assess risks, and perform reviews of our performance against our 2020GHG emissions and energy reduction targets of 25% and 20%, normalized to production. Our Eco-efficiency Team meets with ourmanufacturing facilities several times a year to drive GHG emissions and energy reduction and to review the site’s performanceagainst our targets. To meet these goals, IFF invests in energy efficiency, green chemistry, and carbon reduction initiatives. During2017, we continued to enhance our governance model to manage eco-efficiency. This includes institutionalizing a method by whichfacilities can propose improvement projects to reduce waste, water use, and energy consumption.
ii. Our new sustainability strategy focuses on using circular economy to address climate change. For us, the strategy shows thatincreasing eco-effectiveness in carbon is as fundamental to being Earth-friendly as it is to reducing costs. The grand opening of ouron-site wind turbine in Tilburg— the first in the industry—is a working example of how our positive principles support those goals.
The strategy is incorporated into the overall business strategy, which is linked to and exemplified by our SBTi approved emissionsreduction target of 30% absolute scope 1 and 2 emissions by 2025.
iii. The most substantial business decisions made with climate change as a factor during 2017 were:
• the allocation of funds for specific climate change projects to reduce emissions, corporate tracking of those projects for progress,increased purchases of renewable energy credits (RECs), as well as Guarantees of Origin (GO) green electricity in Europe.
• Climate change was included in the decision to fund 23 projects to reduce greenhouse gas emissions by over 6,000 metric tons ofCO2e.
The decision to support these solutions was influenced by our commitment to transition to a low-carbon economy.
iv. Climate change aspects that have influenced the strategy: Climate change-related issues such as energy efficiency influence ourdecisions regarding the design, building, operation and maintenance of our facilities and equipment. We recognize that regulatoryefforts related to climate change may increase the cost of raw materials as well as energy used. Induced changes in naturalresources due to climate change may also affect the availability and price of ingredients used in the manufacture of our products. Tolessen the impact of energy costs, we are pursuing energy efficiency and reduction programs as well as increasing our use ofrenewable energy. To mitigate sourcing-related risks, we are diversifying our sourcing strategy, maintaining strategic stock levels,and developing flavors and fragrances using biotechnology. In addition to responding to potential risks, IFF is seeking opportunities inmarket shifts created by climate change. We find that climate change response is driving innovation, efficiency improvements and thedevelopment of new products, such as concentrated laundry detergent, to meet changing consumer needs.
v. IFF’s short-term strategy includes a 1-2 year outlook. The most important changes which have occurred include:
• Enhancements were made of our global web-based software application to track energy use and cost and to measure operationalimprovements on a more granular level. Reporting was enhanced to pinpoint areas of opportunity for climate-related projects.
• Implementation of energy efficiency initiatives to enable us to meet our corporate goals to reduce energy u se by 20% and GHGemissions by 25% by 2020 from a 2010 baseline, normalized to production. For example, funds were allocated specifically for carbonreduction. Major projects approved in 2016 as a result of this process include a boiler efficiency upgrade in New Jersey that will save
CDP Page of 8915
approximately 3600 GJ in natural gas.
• Formalization of our climate change governance structure and the Eco-efficiency Team through the appointment of Regional Eco-Efficiency Champions and a Lead Eco-efficiency Champion. They will drive progress on climate change goals at the regional leveland help facilities create action plans to achieve GHG emissions and energy reduction goals.
vi. IFF’s long-term strategy includes a 5-10 year outlook. The most important changes which have occurred include: Throughincreased awareness of climate change megatrends within our customers and supply chain, this subject has risen in awareness andhas been dovetailed into the IFF business strategy. We have integrated climate change thinking and actions into key carbon intensiveparts of our business, thereby influencing the execution of these strategies. In 2016, a prime example of how this thinking wasinstitutionalized into our strategy and actions was the increase of purchased Green-e certified renewable energy credits (RECs) aswell as Guarantees of Origin (GO) green electricity in Europe.
vii. How this is gaining you strategic advantage: Sustainability and climate change management is an enabler of IFF's Vision 2020corporate business strategy, We continuously work to design innovative, high-quality and sustainable products that enhance ourcustomers’ brands. We do this through green chemistry and with a secure and ethical supply chain. We have incorporated theprinciples of green design, construction and manufacturing processes at our new facilities. Our mission to maximize our portfolio hasus working to increase eco-efficiency today by creating less waste and using less water and energy, and in the future as we createnew products. All of these actions increase our efficiency and improve our products in pursuit of a strategic advantage.
viii. We formally support the climate change agreement that emerged from the UN Climate Change Conference (COP21) in Paris aswell as the 10 Principles of the UN Global Compact. The agreement is further evidence that consumers are increasingly calling forproducts that are environmentally and socially responsible, with health and well-being as central elements.
C3.1d
(C3.1d) Provide details of your organization’s use of climate-related scenario analysis.
Climate-relatedscenarios
Details
RCP 2.6 Several years ago, IFF launched an enterprise-wide risk management (ERM) effort designed to provide the ability to pro-actively manage businessrisks. The current ERM does not include 2°C scenario analysis, but we used climate-related scenario analysis to determine our science-based target(SBT) that was approved by the Science-Based Targets initiative (SBTi) and a pathway for achieving the target. This scenario analysis utilized theRepresentative Concentration Pathway (RCP) 2.6, which is the low emissions scenario pathway from the IPCC Fifth Assessment Report. We identifiedthis scenario via the SBTi guidance and Science-based Target Setting Manual, which lists the scenario as appropriate for setting SBT. For our analysis,we used the RCP2.6 subcategory that keeps overshoot to under 0.4W/m2, and which requires a 49% to 72% absolute emissions reduction by 2050from 2010 levels to stay under 2°C. For our modeling, we used the high-end input of 72% reduction. We considered the timeline through 2050 butfocused our goal-setting analysis on the period of 2025 to 2030. These timelines are relevant to our organization because IFF has a 129-year historyand we plan to support the wellbeing of our consumers, the health of our planet and the integrity of our business well into the future. Since RPC 2.6considers all global anthropogenic emissions, we considered all areas of our business covering our total Scope 1 and 2 emissions from globaloperations as part of the analysis. We assumed a compound year-on-year reduction pathway of 2.3% and performed a sensitivity analysis on theeffectiveness and impacts of different routes to target achievement. The primary result of the scenario analysis was the setting of our SBT commitmentto reduce absolute Scope 1 and 2 GHG emissions 30% across all operations globally by 2025 based on a 2015 base year. IFF additionally committedto working with our suppliers (representing 70% of its supply chain emissions) so that they set their own science-based reduction targets and reportannual emissions by 2025. The target will be reported and publicized externally via a press release, social media posts, as well as included on theSBTi website. The results of the scenario analysis and our resulting SBT influence our business objectives and strategy through our decisions regardingrenewable energy procurement and the design, building, operation and maintenance of our facilities and equipment to achieve greater energyefficiency. We recognize that regulatory efforts related to climate change may increase the cost of raw materials as well as energy used. Inducedchanges in natural resources due to climate change may also affect the availability and price of ingredients used in the manufacture of our products. Tolessen the impact of energy costs, we are pursuing energy efficiency and reduction programs as well as increasing our use of renewable energy. Tomitigate sourcing-related risks, we are diversifying our sourcing strategy, maintaining strategic stock levels, and developing flavors and fragrances usingbiotechnology. In 2017, a prime example of how the results of the scenario analysis and this thinking directly influenced our business objectives andstrategy was the increase of purchased renewable electricity at key sites in the US and Europe. We recognize that renewable energy will play a keyrole in both achieving our SBT and a sustainable future, and we are continually working to purchase greater amounts of renewable electricity for ouroperations. Through increased awareness of climate change megatrends within our customers and supply chain, this subject has risen in awarenessand has been dovetailed into the IFF business strategy. We have integrated climate change thinking and actions into key carbon-intensive parts of ourbusiness, thereby influencing the execution of these strategies.
C-AC3.1e/C-CE3.1e/C-CH3.1e/C-CO3.1e/C-EU3.1e/C-FB3.1e/C-MM3.1e/C-OG3.1e/C-PF3.1e/C-ST3.1e/C-TO3.1e/C-TS3.1e
CDP Page of 8916
(C-AC3.1e/C-CE3.1e/C-CH3.1e/C-CO3.1e/C-EU3.1e/C-FB3.1e/C-MM3.1e/C-OG3.1e/C-PF3.1e/C-ST3.1e/C-TO3.1e/C-TS3.1e)Disclose details of your organization’s low-carbon transition plan.
Climate change-related issues such as energy efficiency influence our decisions regarding the design, building, operation andmaintenance of our facilities and equipment. We recognize that regulatory efforts related to climate change may increase the cost ofraw materials as well as energy used. Induced changes in natural resources due to climate change may also affect the availabilityand price of ingredients used in the manufacture of our products. To lessen the impact of energy costs, we are pursuing energyefficiency and reduction programs as well as increasing our use of renewable energy. To mitigate sourcing-related risks, we arediversifying our sourcing strategy, maintaining strategic stock levels, and developing flavors and fragrances using biotechnology. Inaddition to responding to potential risks, IFF is seeking opportunities in market shifts created by climate change. We find that climatechange response is driving innovation, efficiency improvements and the development of new products, such as concentrated laundrydetergent, to meet changing consumer needs.
Through increased awareness of climate change megatrends within our customers and supply chain, this subject has risen inawareness and has been dovetailed into the IFF business strategy. We have integrated climate change thinking and actions into keycarbon-intensive parts of our business, thereby influencing the execution of these strategies. In 2017, a prime example of how thisthinking was institutionalized into our strategy and actions was the increase of purchased Green-e certified renewable energy credits(RECs) as well as Guarantees of Origin (GO) green electricity in Europe.
International Flavors & Fragrances, Inc. has committed to reduce absolute scope 1 and 2 GHG emissions 30% by 2025, from a 2015base-year. This is an approved Science-Based Target. International Flavors & Fragrances, Inc. In support of this emissions target, asa member of RE100 we will target 100% renewable electricity and will have 75% renewable electricity by 2025. The major challengefor us in achieving these targets will be market maturity for some of our facilities
C4. Targets and performance
C4.1
(C4.1) Did you have an emissions target that was active in the reporting year?Both absolute and intensity targets
C4.1a
CDP Page of 8917
(C4.1a) Provide details of your absolute emissions target(s) and progress made against those targets.
Target reference numberAbs 1
ScopeScope 1 +2 (market-based)
% emissions in Scope100
% reduction from base year30
Base year2015
Start year2017
Base year emissions covered by target (metric tons CO2e)246761
Target year2025
Is this a science-based target?Yes, this target has been approved as science-based by the Science-Based Targets initiative
% achieved (emissions)16
Target statusUnderway
Please explainThe Science Based Target initiative (SBTi) independently assesses and approves companies’ targets to help determine a pathwayfor reducing companies’ emissions in line with the Paris Climate Agreement’s goal of limiting global warming to well below 2°Cabove pre-industrial levels. By 2025, IFF will strive to reduce absolute GHG emissions by 30% and encourage suppliers to set theirown science-based reduction targets and report annual emissions. IFF also commits to working with its suppliers (representing70% of its supply chain emissions) so that they set their own science-based reduction targets and report annual emissions by2025.
C4.1b
CDP Page of 8918
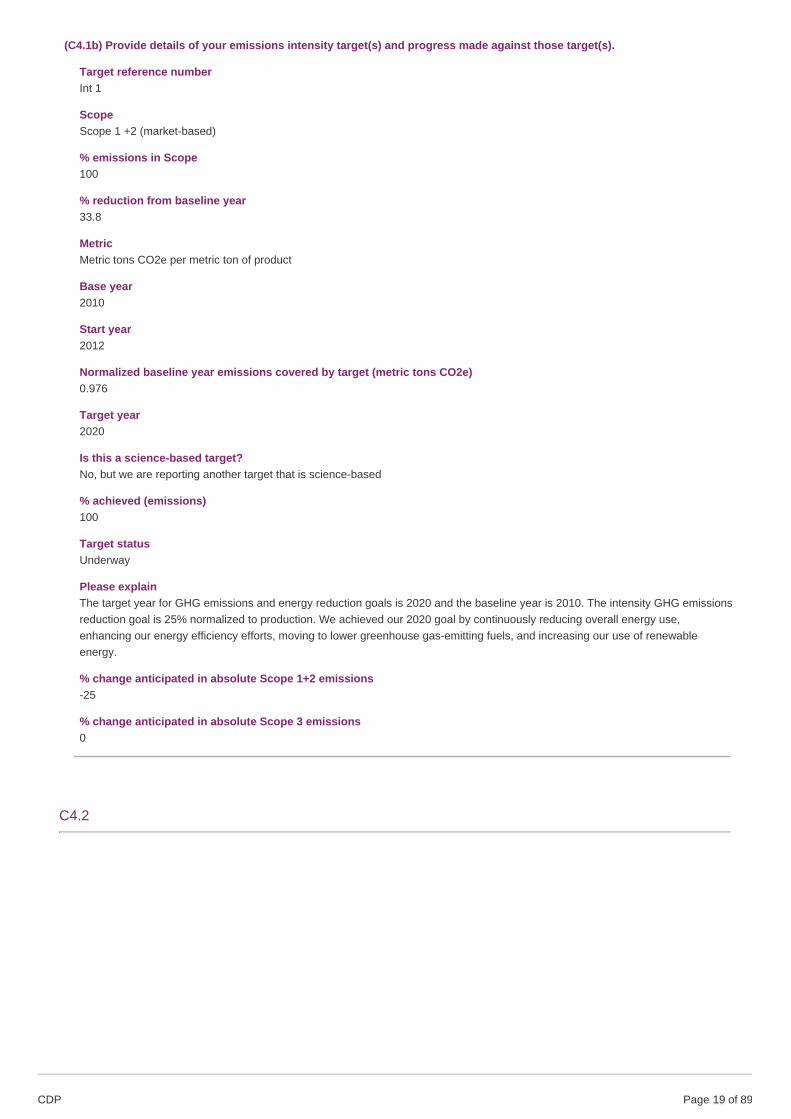
(C4.1b) Provide details of your emissions intensity target(s) and progress made against those target(s).
Target reference numberInt 1
ScopeScope 1 +2 (market-based)
% emissions in Scope100
% reduction from baseline year33.8
MetricMetric tons CO2e per metric ton of product
Base year2010
Start year2012
Normalized baseline year emissions covered by target (metric tons CO2e)0.976
Target year2020
Is this a science-based target?No, but we are reporting another target that is science-based
% achieved (emissions)100
Target statusUnderway
Please explainThe target year for GHG emissions and energy reduction goals is 2020 and the baseline year is 2010. The intensity GHG emissionsreduction goal is 25% normalized to production. We achieved our 2020 goal by continuously reducing overall energy use,enhancing our energy efficiency efforts, moving to lower greenhouse gas-emitting fuels, and increasing our use of renewableenergy.
% change anticipated in absolute Scope 1+2 emissions-25
% change anticipated in absolute Scope 3 emissions0
C4.2
CDP Page of 8919
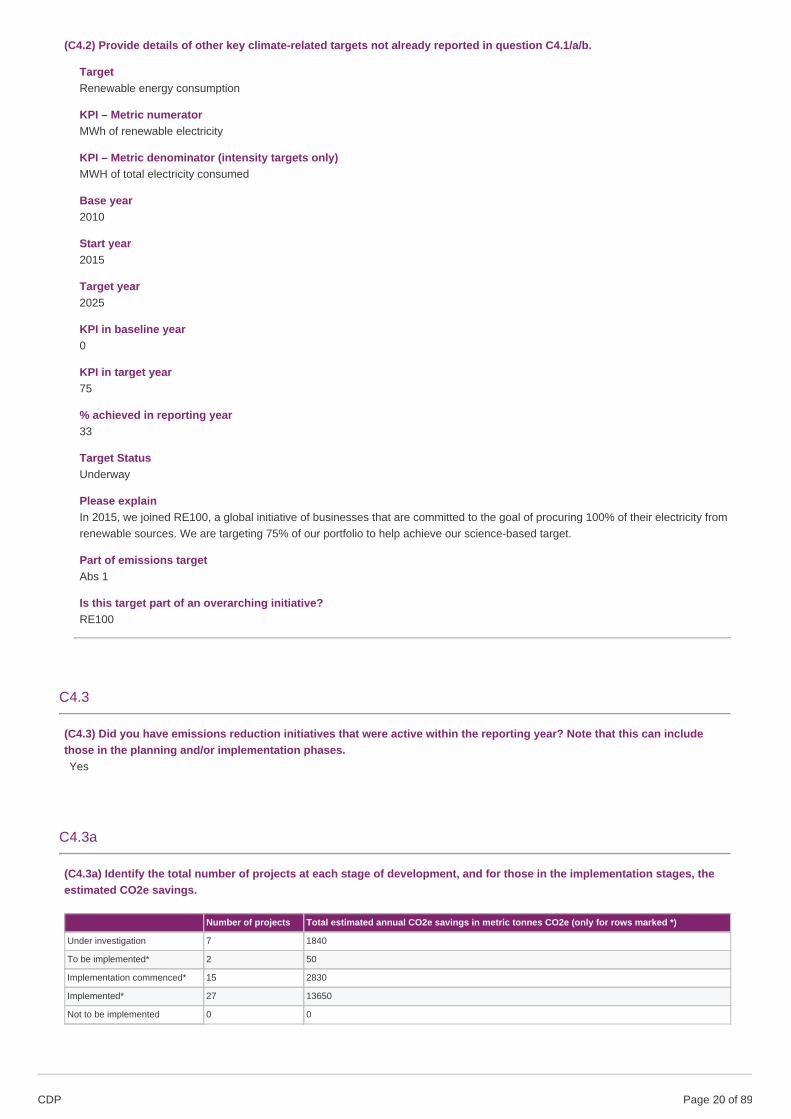
(C4.2) Provide details of other key climate-related targets not already reported in question C4.1/a/b.
TargetRenewable energy consumption
KPI – Metric numeratorMWh of renewable electricity
KPI – Metric denominator (intensity targets only)MWH of total electricity consumed
Base year2010
Start year2015
Target year2025
KPI in baseline year0
KPI in target year75
% achieved in reporting year33
Target StatusUnderway
Please explainIn 2015, we joined RE100, a global initiative of businesses that are committed to the goal of procuring 100% of their electricity fromrenewable sources. We are targeting 75% of our portfolio to help achieve our science-based target.
Part of emissions targetAbs 1
Is this target part of an overarching initiative?RE100
C4.3
(C4.3) Did you have emissions reduction initiatives that were active within the reporting year? Note that this can includethose in the planning and/or implementation phases.Yes
C4.3a
(C4.3a) Identify the total number of projects at each stage of development, and for those in the implementation stages, theestimated CO2e savings.
Number of projects Total estimated annual CO2e savings in metric tonnes CO2e (only for rows marked *)
Under investigation 7 1840
To be implemented* 2 50
Implementation commenced* 15 2830
Implemented* 27 13650
Not to be implemented 0 0
CDP Page of 8920
C4.3b
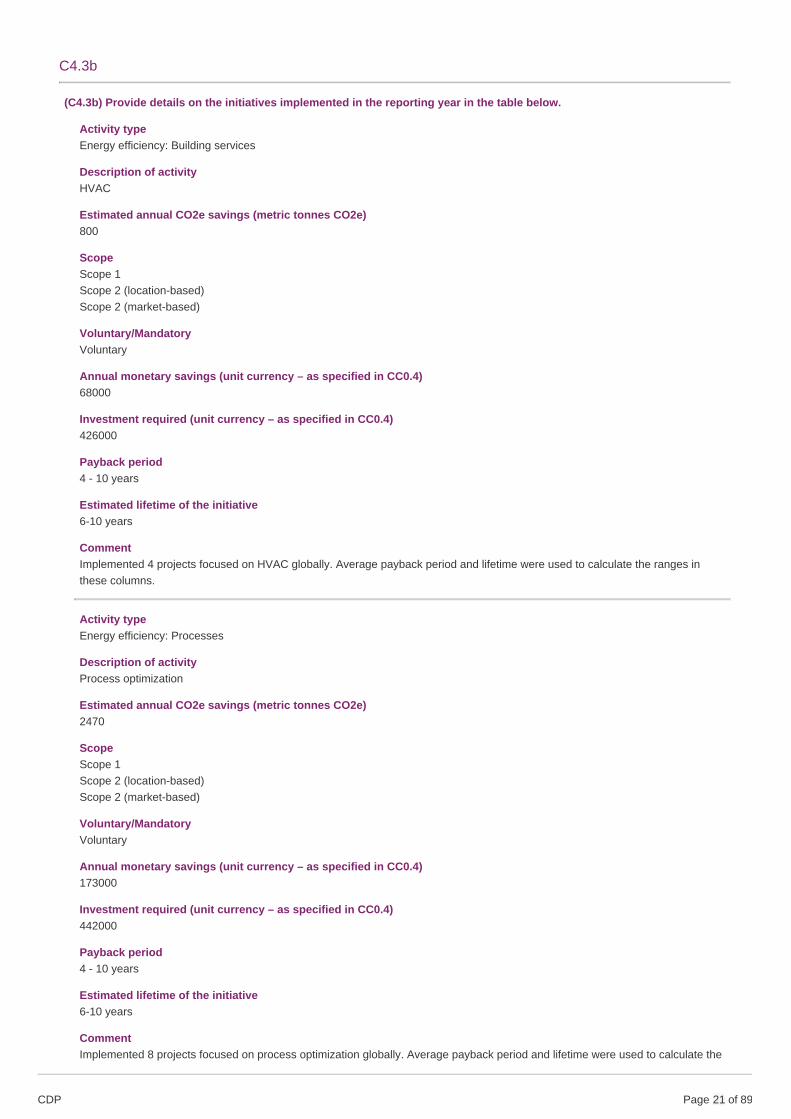
(C4.3b) Provide details on the initiatives implemented in the reporting year in the table below.
Activity typeEnergy efficiency: Building services
Description of activityHVAC
Estimated annual CO2e savings (metric tonnes CO2e)800
ScopeScope 1Scope 2 (location-based)Scope 2 (market-based)
Voluntary/MandatoryVoluntary
Annual monetary savings (unit currency – as specified in CC0.4)68000
Investment required (unit currency – as specified in CC0.4)426000
Payback period4 - 10 years
Estimated lifetime of the initiative6-10 years
CommentImplemented 4 projects focused on HVAC globally. Average payback period and lifetime were used to calculate the ranges inthese columns.
Activity typeEnergy efficiency: Processes
Description of activityProcess optimization
Estimated annual CO2e savings (metric tonnes CO2e)2470
ScopeScope 1Scope 2 (location-based)Scope 2 (market-based)
Voluntary/MandatoryVoluntary
Annual monetary savings (unit currency – as specified in CC0.4)173000
Investment required (unit currency – as specified in CC0.4)442000
Payback period4 - 10 years
Estimated lifetime of the initiative6-10 years
CommentImplemented 8 projects focused on process optimization globally. Average payback period and lifetime were used to calculate the
CDP Page of 8921
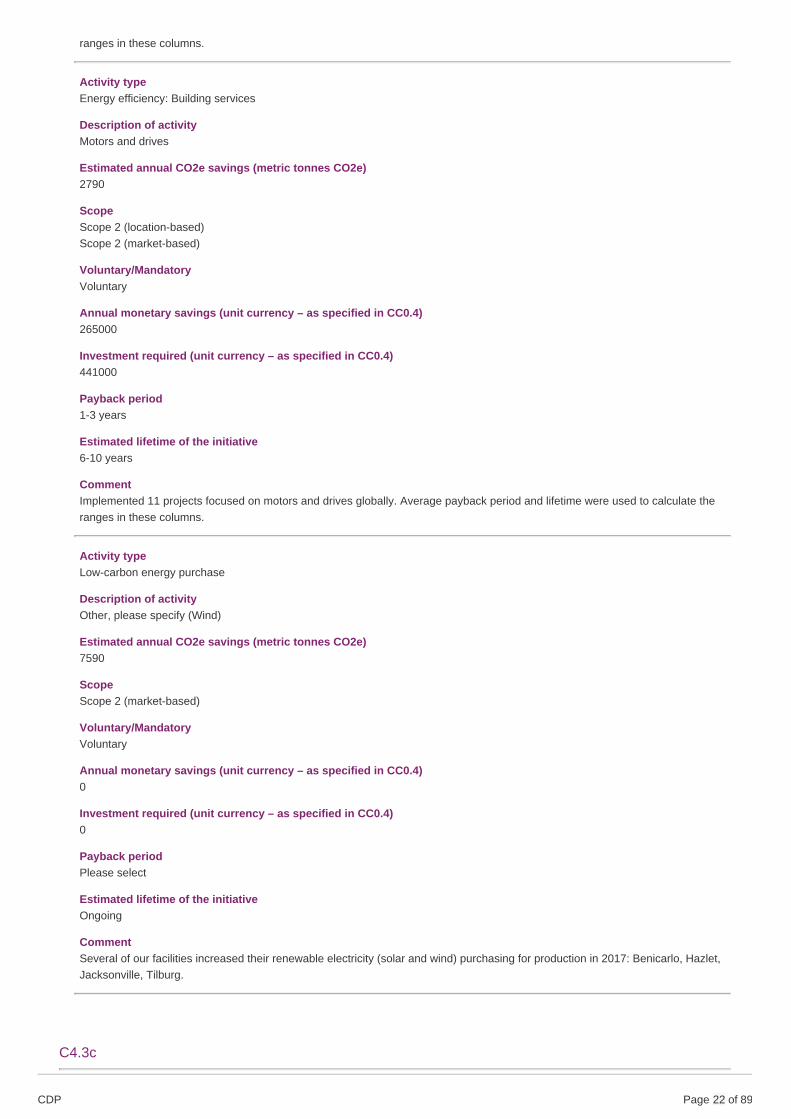
ranges in these columns.
Activity typeEnergy efficiency: Building services
Description of activityMotors and drives
Estimated annual CO2e savings (metric tonnes CO2e)2790
ScopeScope 2 (location-based)Scope 2 (market-based)
Voluntary/MandatoryVoluntary
Annual monetary savings (unit currency – as specified in CC0.4)265000
Investment required (unit currency – as specified in CC0.4)441000
Payback period1-3 years
Estimated lifetime of the initiative6-10 years
CommentImplemented 11 projects focused on motors and drives globally. Average payback period and lifetime were used to calculate theranges in these columns.
Activity typeLow-carbon energy purchase
Description of activityOther, please specify (Wind)
Estimated annual CO2e savings (metric tonnes CO2e)7590
ScopeScope 2 (market-based)
Voluntary/MandatoryVoluntary
Annual monetary savings (unit currency – as specified in CC0.4)0
Investment required (unit currency – as specified in CC0.4)0
Payback periodPlease select
Estimated lifetime of the initiativeOngoing
CommentSeveral of our facilities increased their renewable electricity (solar and wind) purchasing for production in 2017: Benicarlo, Hazlet,Jacksonville, Tilburg.
C4.3c
CDP Page of 8922

(C4.3c) What methods do you use to drive investment in emissions reduction activities?
Method Comment
Financial optimizationcalculations
IFF requires that energy reduction projects have a clear return on investment and also takes into consideration the environmental andsocial benefits of these projects, ensuring projects adhere to the triple bottom line of sustainability.
Internalincentives/recognitionprograms
IFF has corporate goals to reduce energy use by 20% and GHG emissions by 25% by 2020, normalized to production. In 2016, these goalswere cascaded to each of our facilities and included in the performance management goals of plant manager. These goals were achieved in2017, and looking forward IFF has set an approved Science-Based Target. For its SBTi-approved Science-Based Target, IFF commits toreduce absolute scope 1 and 2 GHG emissions 30% by 2025, from a 2015 base-year. IFF also commits to working with its suppliers(representing 70% of its supply chain emissions) so that they set their own science-based reduction targets and report annual emissions by2025.
C4.5
(C4.5) Do you classify any of your existing goods and/or services as low-carbon products or do they enable a third party toavoid GHG emissions?Yes
C4.5a
(C4.5a) Provide details of your products and/or services that you classify as low-carbon products or that enable a third partyto avoid GHG emissions.
Level of aggregationGroup of products
Description of product/Group of productsSeveral of our facilities use renewable electricity (solar and wind) for production: Benicarlo, Hazlet, Jacksonville, Tilburg. All of theproducts made at these facilities are considered low-carbon products and contribute to the transition to a low carbon economy.
Are these low-carbon product(s) or do they enable avoided emissions?Low-carbon product
Taxonomy, project or methodology used to classify product(s) as low-carbon or to calculate avoided emissionsEvaluating the carbon-reducing impacts of ICT
% revenue from low carbon product(s) in the reporting year36
CommentSeveral of our facilities use 100% renewable electricity (solar and wind) for production: Benicarlo, Hazlet, Jacksonville, Tilburg. Allof the products made at these facilities are made with renewable electricity and are thus considered low-carbon products; as such,these contribute to the transition to a low carbon economy.
C5. Emissions methodology
C5.1
CDP Page of 8923
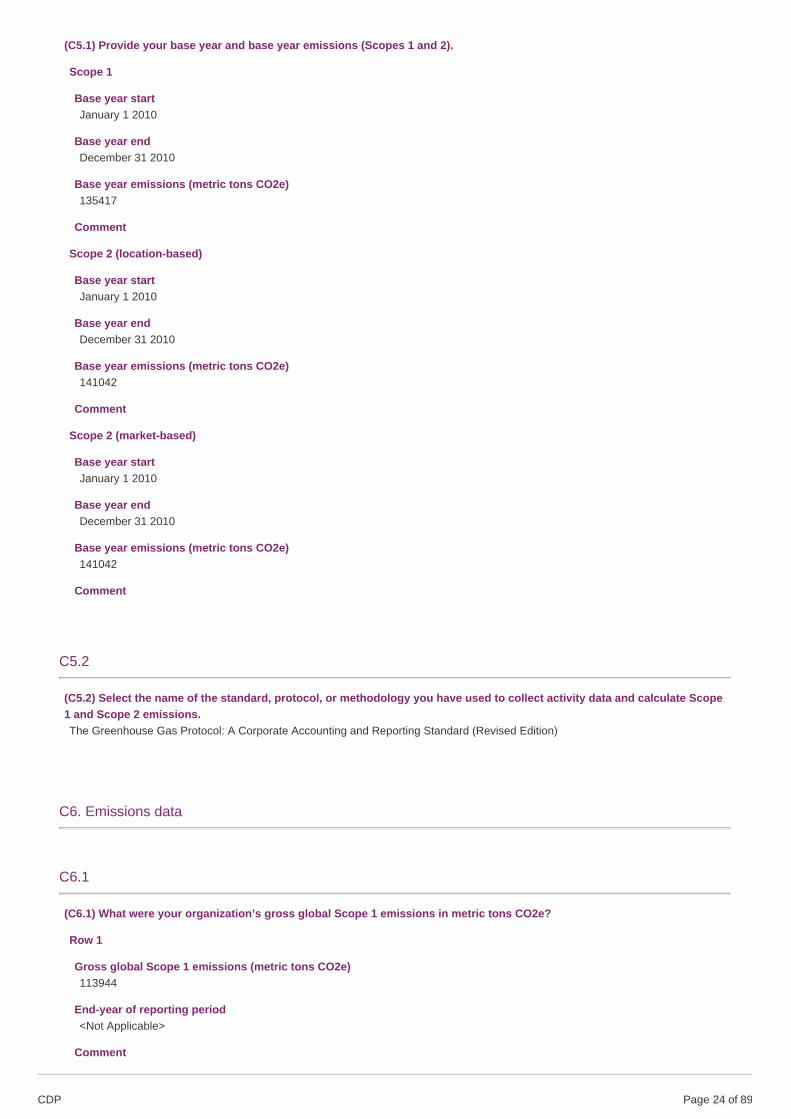
(C5.1) Provide your base year and base year emissions (Scopes 1 and 2).
Scope 1
Base year startJanuary 1 2010
Base year endDecember 31 2010
Base year emissions (metric tons CO2e)135417
Comment
Scope 2 (location-based)
Base year startJanuary 1 2010
Base year endDecember 31 2010
Base year emissions (metric tons CO2e)141042
Comment
Scope 2 (market-based)
Base year startJanuary 1 2010
Base year endDecember 31 2010
Base year emissions (metric tons CO2e)141042
Comment
C5.2
(C5.2) Select the name of the standard, protocol, or methodology you have used to collect activity data and calculate Scope1 and Scope 2 emissions.The Greenhouse Gas Protocol: A Corporate Accounting and Reporting Standard (Revised Edition)
C6. Emissions data
C6.1
(C6.1) What were your organization’s gross global Scope 1 emissions in metric tons CO2e?
Row 1
Gross global Scope 1 emissions (metric tons CO2e)113944
End-year of reporting period<Not Applicable>
Comment
CDP Page of 8924
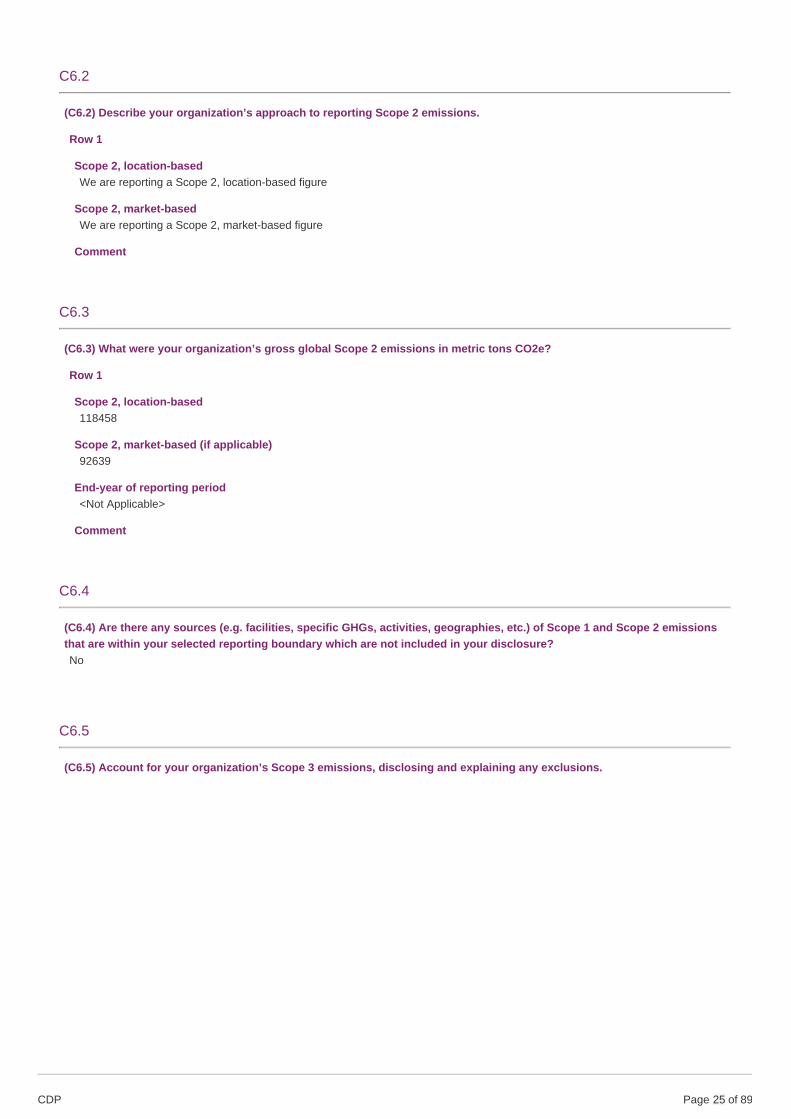
C6.2
(C6.2) Describe your organization’s approach to reporting Scope 2 emissions.
Row 1
Scope 2, location-basedWe are reporting a Scope 2, location-based figure
Scope 2, market-basedWe are reporting a Scope 2, market-based figure
Comment
C6.3
(C6.3) What were your organization’s gross global Scope 2 emissions in metric tons CO2e?
Row 1
Scope 2, location-based118458
Scope 2, market-based (if applicable)92639
End-year of reporting period<Not Applicable>
Comment
C6.4
(C6.4) Are there any sources (e.g. facilities, specific GHGs, activities, geographies, etc.) of Scope 1 and Scope 2 emissionsthat are within your selected reporting boundary which are not included in your disclosure?No
C6.5
(C6.5) Account for your organization’s Scope 3 emissions, disclosing and explaining any exclusions.
CDP Page of 8925
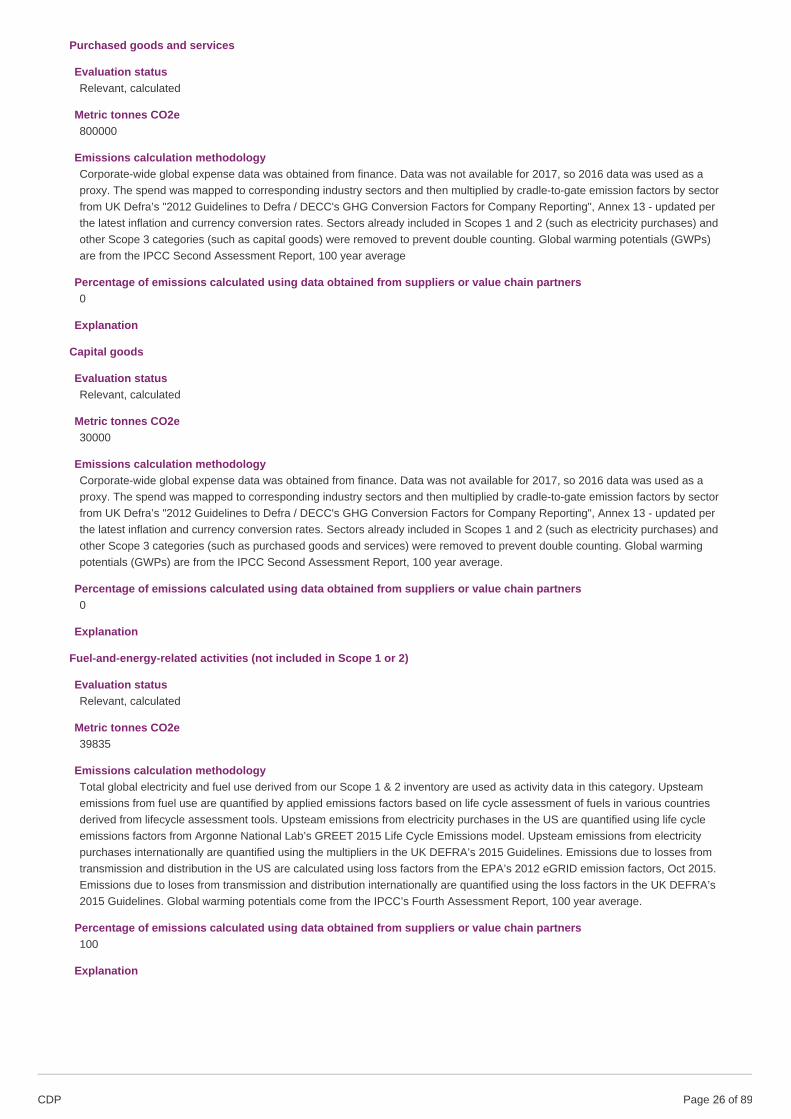
Purchased goods and services
Evaluation statusRelevant, calculated
Metric tonnes CO2e800000
Emissions calculation methodologyCorporate-wide global expense data was obtained from finance. Data was not available for 2017, so 2016 data was used as aproxy. The spend was mapped to corresponding industry sectors and then multiplied by cradle-to-gate emission factors by sectorfrom UK Defra’s "2012 Guidelines to Defra / DECC's GHG Conversion Factors for Company Reporting", Annex 13 - updated perthe latest inflation and currency conversion rates. Sectors already included in Scopes 1 and 2 (such as electricity purchases) andother Scope 3 categories (such as capital goods) were removed to prevent double counting. Global warming potentials (GWPs)are from the IPCC Second Assessment Report, 100 year average
Percentage of emissions calculated using data obtained from suppliers or value chain partners0
Explanation
Capital goods
Evaluation statusRelevant, calculated
Metric tonnes CO2e30000
Emissions calculation methodologyCorporate-wide global expense data was obtained from finance. Data was not available for 2017, so 2016 data was used as aproxy. The spend was mapped to corresponding industry sectors and then multiplied by cradle-to-gate emission factors by sectorfrom UK Defra’s "2012 Guidelines to Defra / DECC's GHG Conversion Factors for Company Reporting", Annex 13 - updated perthe latest inflation and currency conversion rates. Sectors already included in Scopes 1 and 2 (such as electricity purchases) andother Scope 3 categories (such as purchased goods and services) were removed to prevent double counting. Global warmingpotentials (GWPs) are from the IPCC Second Assessment Report, 100 year average.
Percentage of emissions calculated using data obtained from suppliers or value chain partners0
Explanation
Fuel-and-energy-related activities (not included in Scope 1 or 2)
Evaluation statusRelevant, calculated
Metric tonnes CO2e39835
Emissions calculation methodologyTotal global electricity and fuel use derived from our Scope 1 & 2 inventory are used as activity data in this category. Upsteamemissions from fuel use are quantified by applied emissions factors based on life cycle assessment of fuels in various countriesderived from lifecycle assessment tools. Upsteam emissions from electricity purchases in the US are quantified using life cycleemissions factors from Argonne National Lab’s GREET 2015 Life Cycle Emissions model. Upsteam emissions from electricitypurchases internationally are quantified using the multipliers in the UK DEFRA’s 2015 Guidelines. Emissions due to losses fromtransmission and distribution in the US are calculated using loss factors from the EPA’s 2012 eGRID emission factors, Oct 2015.Emissions due to loses from transmission and distribution internationally are quantified using the loss factors in the UK DEFRA’s2015 Guidelines. Global warming potentials come from the IPCC’s Fourth Assessment Report, 100 year average.
Percentage of emissions calculated using data obtained from suppliers or value chain partners100
Explanation
CDP Page of 8926
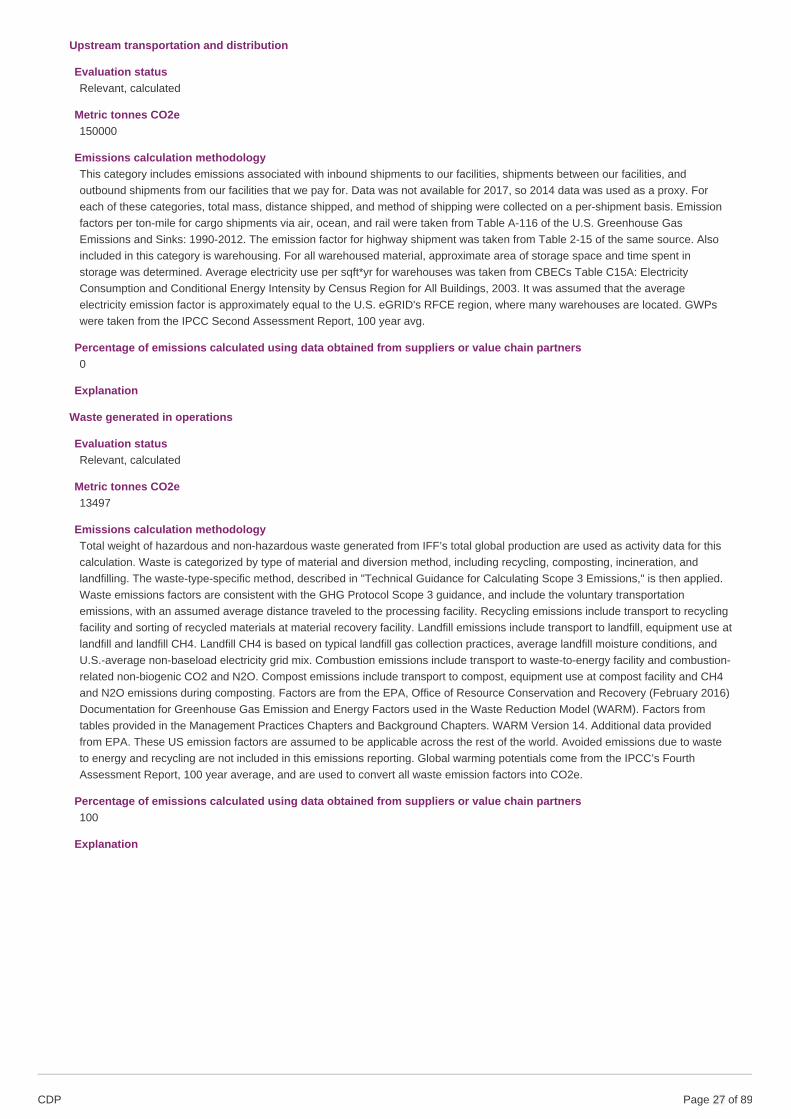
Upstream transportation and distribution
Evaluation statusRelevant, calculated
Metric tonnes CO2e150000
Emissions calculation methodologyThis category includes emissions associated with inbound shipments to our facilities, shipments between our facilities, andoutbound shipments from our facilities that we pay for. Data was not available for 2017, so 2014 data was used as a proxy. Foreach of these categories, total mass, distance shipped, and method of shipping were collected on a per-shipment basis. Emissionfactors per ton-mile for cargo shipments via air, ocean, and rail were taken from Table A-116 of the U.S. Greenhouse GasEmissions and Sinks: 1990-2012. The emission factor for highway shipment was taken from Table 2-15 of the same source. Alsoincluded in this category is warehousing. For all warehoused material, approximate area of storage space and time spent instorage was determined. Average electricity use per sqft*yr for warehouses was taken from CBECs Table C15A: ElectricityConsumption and Conditional Energy Intensity by Census Region for All Buildings, 2003. It was assumed that the averageelectricity emission factor is approximately equal to the U.S. eGRID's RFCE region, where many warehouses are located. GWPswere taken from the IPCC Second Assessment Report, 100 year avg.
Percentage of emissions calculated using data obtained from suppliers or value chain partners0
Explanation
Waste generated in operations
Evaluation statusRelevant, calculated
Metric tonnes CO2e13497
Emissions calculation methodologyTotal weight of hazardous and non-hazardous waste generated from IFF’s total global production are used as activity data for thiscalculation. Waste is categorized by type of material and diversion method, including recycling, composting, incineration, andlandfilling. The waste-type-specific method, described in "Technical Guidance for Calculating Scope 3 Emissions," is then applied.Waste emissions factors are consistent with the GHG Protocol Scope 3 guidance, and include the voluntary transportationemissions, with an assumed average distance traveled to the processing facility. Recycling emissions include transport to recyclingfacility and sorting of recycled materials at material recovery facility. Landfill emissions include transport to landfill, equipment use atlandfill and landfill CH4. Landfill CH4 is based on typical landfill gas collection practices, average landfill moisture conditions, andU.S.-average non-baseload electricity grid mix. Combustion emissions include transport to waste-to-energy facility and combustion-related non-biogenic CO2 and N2O. Compost emissions include transport to compost, equipment use at compost facility and CH4and N2O emissions during composting. Factors are from the EPA, Office of Resource Conservation and Recovery (February 2016)Documentation for Greenhouse Gas Emission and Energy Factors used in the Waste Reduction Model (WARM). Factors fromtables provided in the Management Practices Chapters and Background Chapters. WARM Version 14. Additional data providedfrom EPA. These US emission factors are assumed to be applicable across the rest of the world. Avoided emissions due to wasteto energy and recycling are not included in this emissions reporting. Global warming potentials come from the IPCC’s FourthAssessment Report, 100 year average, and are used to convert all waste emission factors into CO2e.
Percentage of emissions calculated using data obtained from suppliers or value chain partners100
Explanation
CDP Page of 8927
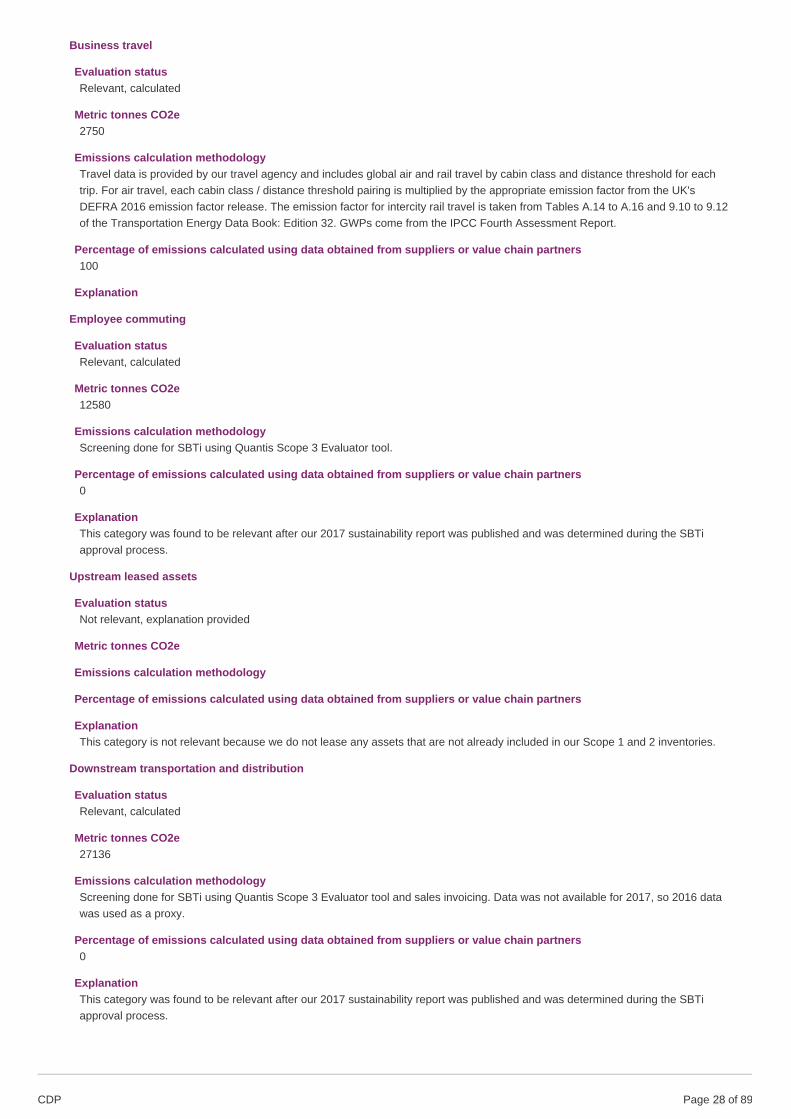
Business travel
Evaluation statusRelevant, calculated
Metric tonnes CO2e2750
Emissions calculation methodologyTravel data is provided by our travel agency and includes global air and rail travel by cabin class and distance threshold for eachtrip. For air travel, each cabin class / distance threshold pairing is multiplied by the appropriate emission factor from the UK'sDEFRA 2016 emission factor release. The emission factor for intercity rail travel is taken from Tables A.14 to A.16 and 9.10 to 9.12of the Transportation Energy Data Book: Edition 32. GWPs come from the IPCC Fourth Assessment Report.
Percentage of emissions calculated using data obtained from suppliers or value chain partners100
Explanation
Employee commuting
Evaluation statusRelevant, calculated
Metric tonnes CO2e12580
Emissions calculation methodologyScreening done for SBTi using Quantis Scope 3 Evaluator tool.
Percentage of emissions calculated using data obtained from suppliers or value chain partners0
ExplanationThis category was found to be relevant after our 2017 sustainability report was published and was determined during the SBTiapproval process.
Upstream leased assets
Evaluation statusNot relevant, explanation provided
Metric tonnes CO2e
Emissions calculation methodology
Percentage of emissions calculated using data obtained from suppliers or value chain partners
ExplanationThis category is not relevant because we do not lease any assets that are not already included in our Scope 1 and 2 inventories.
Downstream transportation and distribution
Evaluation statusRelevant, calculated
Metric tonnes CO2e27136
Emissions calculation methodologyScreening done for SBTi using Quantis Scope 3 Evaluator tool and sales invoicing. Data was not available for 2017, so 2016 datawas used as a proxy.
Percentage of emissions calculated using data obtained from suppliers or value chain partners0
ExplanationThis category was found to be relevant after our 2017 sustainability report was published and was determined during the SBTiapproval process.
CDP Page of 8928
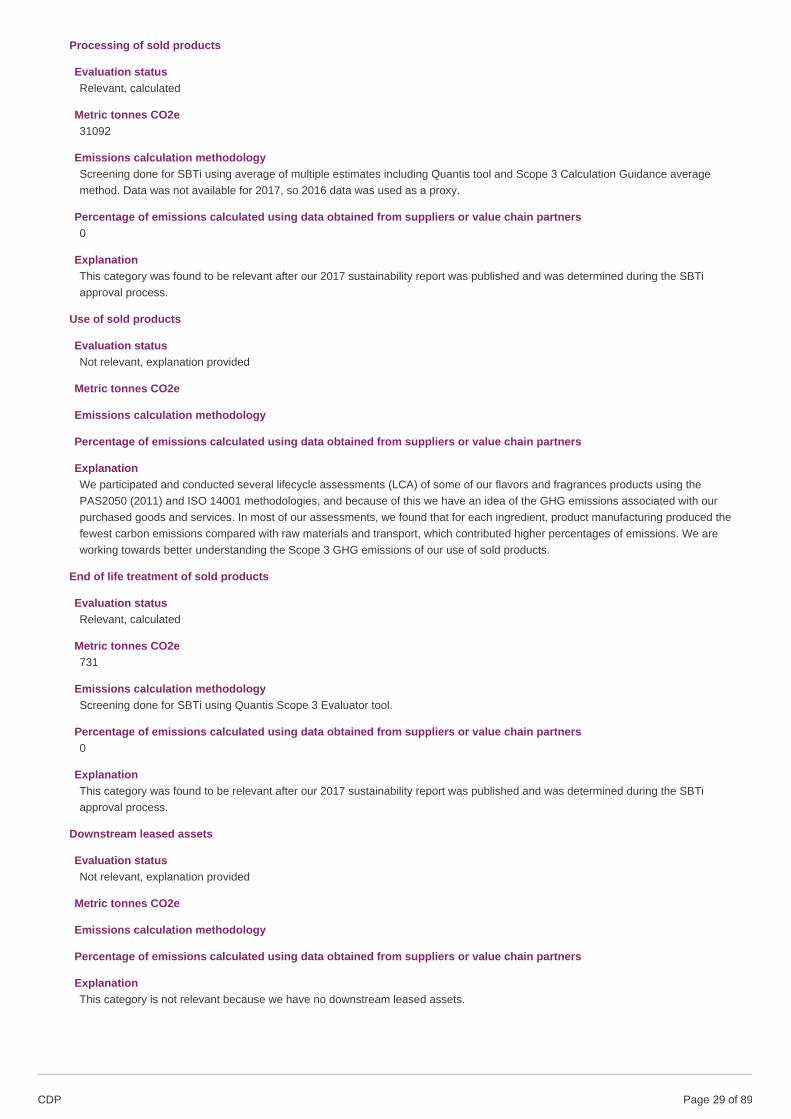
Processing of sold products
Evaluation statusRelevant, calculated
Metric tonnes CO2e31092
Emissions calculation methodologyScreening done for SBTi using average of multiple estimates including Quantis tool and Scope 3 Calculation Guidance averagemethod. Data was not available for 2017, so 2016 data was used as a proxy.
Percentage of emissions calculated using data obtained from suppliers or value chain partners0
ExplanationThis category was found to be relevant after our 2017 sustainability report was published and was determined during the SBTiapproval process.
Use of sold products
Evaluation statusNot relevant, explanation provided
Metric tonnes CO2e
Emissions calculation methodology
Percentage of emissions calculated using data obtained from suppliers or value chain partners
ExplanationWe participated and conducted several lifecycle assessments (LCA) of some of our flavors and fragrances products using thePAS2050 (2011) and ISO 14001 methodologies, and because of this we have an idea of the GHG emissions associated with ourpurchased goods and services. In most of our assessments, we found that for each ingredient, product manufacturing produced thefewest carbon emissions compared with raw materials and transport, which contributed higher percentages of emissions. We areworking towards better understanding the Scope 3 GHG emissions of our use of sold products.
End of life treatment of sold products
Evaluation statusRelevant, calculated
Metric tonnes CO2e731
Emissions calculation methodologyScreening done for SBTi using Quantis Scope 3 Evaluator tool.
Percentage of emissions calculated using data obtained from suppliers or value chain partners0
ExplanationThis category was found to be relevant after our 2017 sustainability report was published and was determined during the SBTiapproval process.
Downstream leased assets
Evaluation statusNot relevant, explanation provided
Metric tonnes CO2e
Emissions calculation methodology
Percentage of emissions calculated using data obtained from suppliers or value chain partners
ExplanationThis category is not relevant because we have no downstream leased assets.
CDP Page of 8929
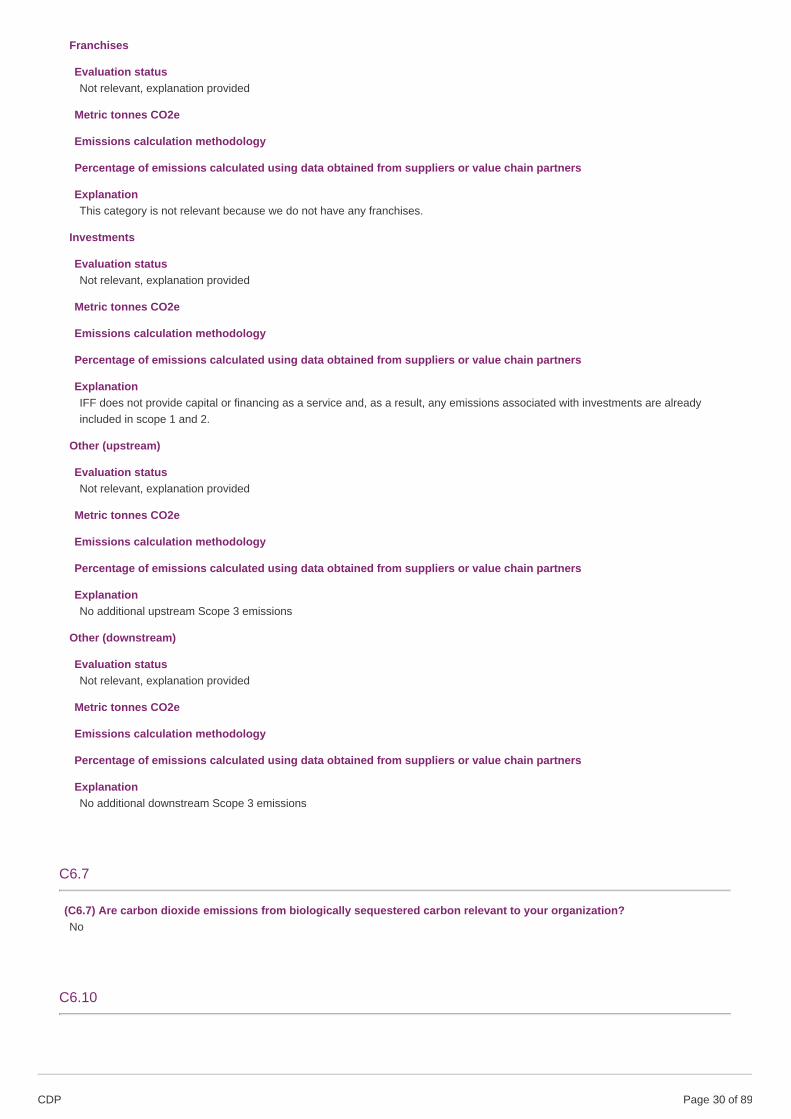
Franchises
Evaluation statusNot relevant, explanation provided
Metric tonnes CO2e
Emissions calculation methodology
Percentage of emissions calculated using data obtained from suppliers or value chain partners
ExplanationThis category is not relevant because we do not have any franchises.
Investments
Evaluation statusNot relevant, explanation provided
Metric tonnes CO2e
Emissions calculation methodology
Percentage of emissions calculated using data obtained from suppliers or value chain partners
ExplanationIFF does not provide capital or financing as a service and, as a result, any emissions associated with investments are alreadyincluded in scope 1 and 2.
Other (upstream)
Evaluation statusNot relevant, explanation provided
Metric tonnes CO2e
Emissions calculation methodology
Percentage of emissions calculated using data obtained from suppliers or value chain partners
ExplanationNo additional upstream Scope 3 emissions
Other (downstream)
Evaluation statusNot relevant, explanation provided
Metric tonnes CO2e
Emissions calculation methodology
Percentage of emissions calculated using data obtained from suppliers or value chain partners
ExplanationNo additional downstream Scope 3 emissions
C6.7
(C6.7) Are carbon dioxide emissions from biologically sequestered carbon relevant to your organization?No
C6.10
CDP Page of 8930
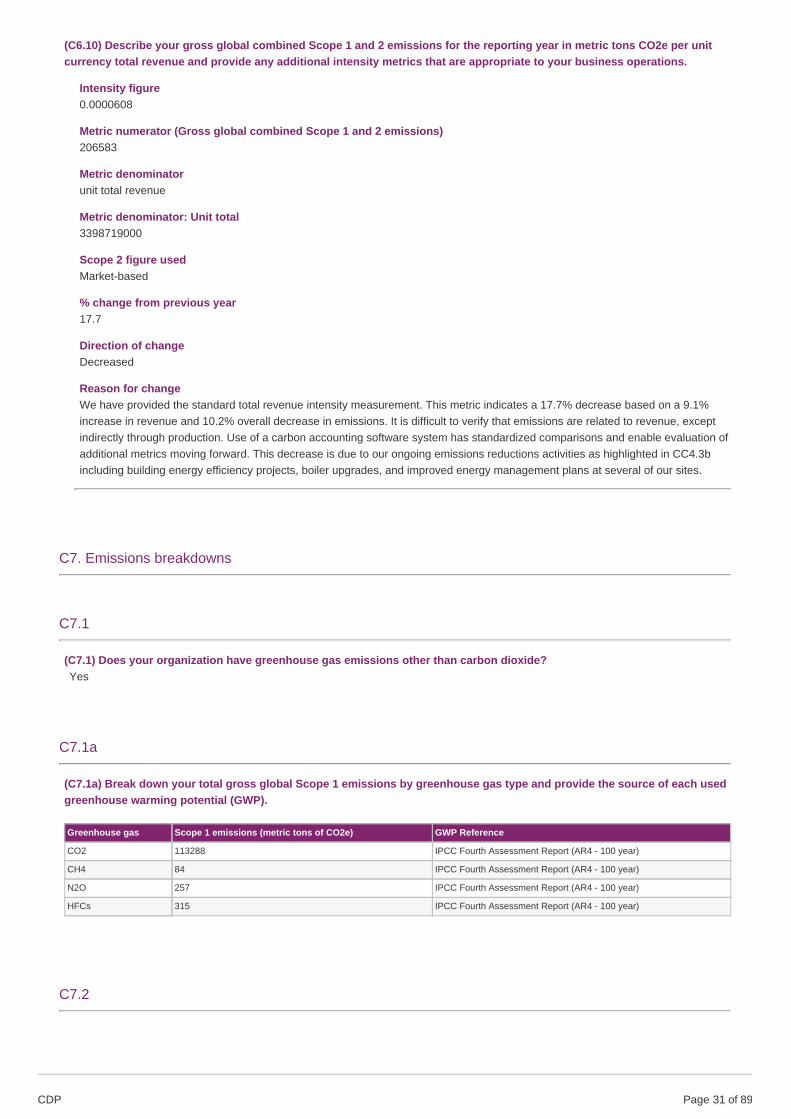
(C6.10) Describe your gross global combined Scope 1 and 2 emissions for the reporting year in metric tons CO2e per unitcurrency total revenue and provide any additional intensity metrics that are appropriate to your business operations.
Intensity figure0.0000608
Metric numerator (Gross global combined Scope 1 and 2 emissions)206583
Metric denominatorunit total revenue
Metric denominator: Unit total3398719000
Scope 2 figure usedMarket-based
% change from previous year17.7
Direction of changeDecreased
Reason for changeWe have provided the standard total revenue intensity measurement. This metric indicates a 17.7% decrease based on a 9.1%increase in revenue and 10.2% overall decrease in emissions. It is difficult to verify that emissions are related to revenue, exceptindirectly through production. Use of a carbon accounting software system has standardized comparisons and enable evaluation ofadditional metrics moving forward. This decrease is due to our ongoing emissions reductions activities as highlighted in CC4.3bincluding building energy efficiency projects, boiler upgrades, and improved energy management plans at several of our sites.
C7. Emissions breakdowns
C7.1
(C7.1) Does your organization have greenhouse gas emissions other than carbon dioxide?Yes
C7.1a
(C7.1a) Break down your total gross global Scope 1 emissions by greenhouse gas type and provide the source of each usedgreenhouse warming potential (GWP).
Greenhouse gas Scope 1 emissions (metric tons of CO2e) GWP Reference
CO2 113288 IPCC Fourth Assessment Report (AR4 - 100 year)
CH4 84 IPCC Fourth Assessment Report (AR4 - 100 year)
N2O 257 IPCC Fourth Assessment Report (AR4 - 100 year)
HFCs 315 IPCC Fourth Assessment Report (AR4 - 100 year)
C7.2
CDP Page of 8931
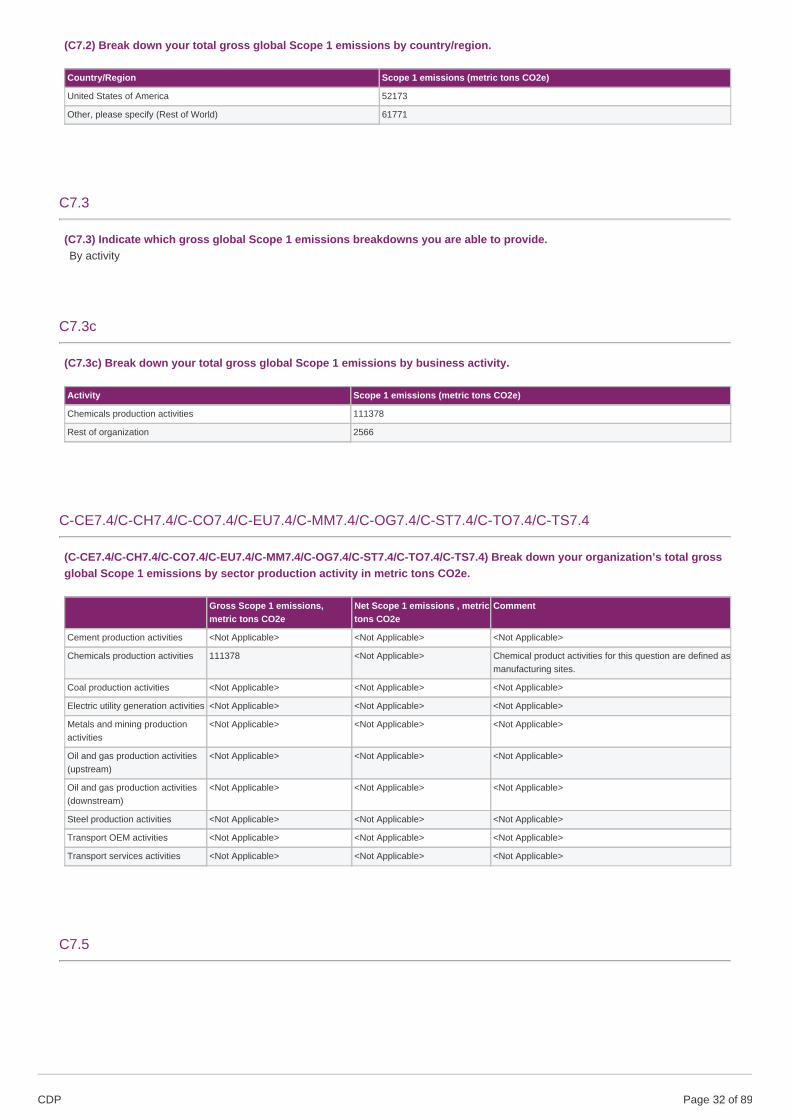
(C7.2) Break down your total gross global Scope 1 emissions by country/region.
Country/Region Scope 1 emissions (metric tons CO2e)
United States of America 52173
Other, please specify (Rest of World) 61771
C7.3
(C7.3) Indicate which gross global Scope 1 emissions breakdowns you are able to provide.By activity
C7.3c
(C7.3c) Break down your total gross global Scope 1 emissions by business activity.
Activity Scope 1 emissions (metric tons CO2e)
Chemicals production activities 111378
Rest of organization 2566
C-CE7.4/C-CH7.4/C-CO7.4/C-EU7.4/C-MM7.4/C-OG7.4/C-ST7.4/C-TO7.4/C-TS7.4
(C-CE7.4/C-CH7.4/C-CO7.4/C-EU7.4/C-MM7.4/C-OG7.4/C-ST7.4/C-TO7.4/C-TS7.4) Break down your organization’s total grossglobal Scope 1 emissions by sector production activity in metric tons CO2e.
Gross Scope 1 emissions,metric tons CO2e
Net Scope 1 emissions , metrictons CO2e
Comment
Cement production activities <Not Applicable> <Not Applicable> <Not Applicable>
Chemicals production activities 111378 <Not Applicable> Chemical product activities for this question are defined asmanufacturing sites.
Coal production activities <Not Applicable> <Not Applicable> <Not Applicable>
Electric utility generation activities <Not Applicable> <Not Applicable> <Not Applicable>
Metals and mining productionactivities
<Not Applicable> <Not Applicable> <Not Applicable>
Oil and gas production activities(upstream)
<Not Applicable> <Not Applicable> <Not Applicable>
Oil and gas production activities(downstream)
<Not Applicable> <Not Applicable> <Not Applicable>
Steel production activities <Not Applicable> <Not Applicable> <Not Applicable>
Transport OEM activities <Not Applicable> <Not Applicable> <Not Applicable>
Transport services activities <Not Applicable> <Not Applicable> <Not Applicable>
C7.5
CDP Page of 8932
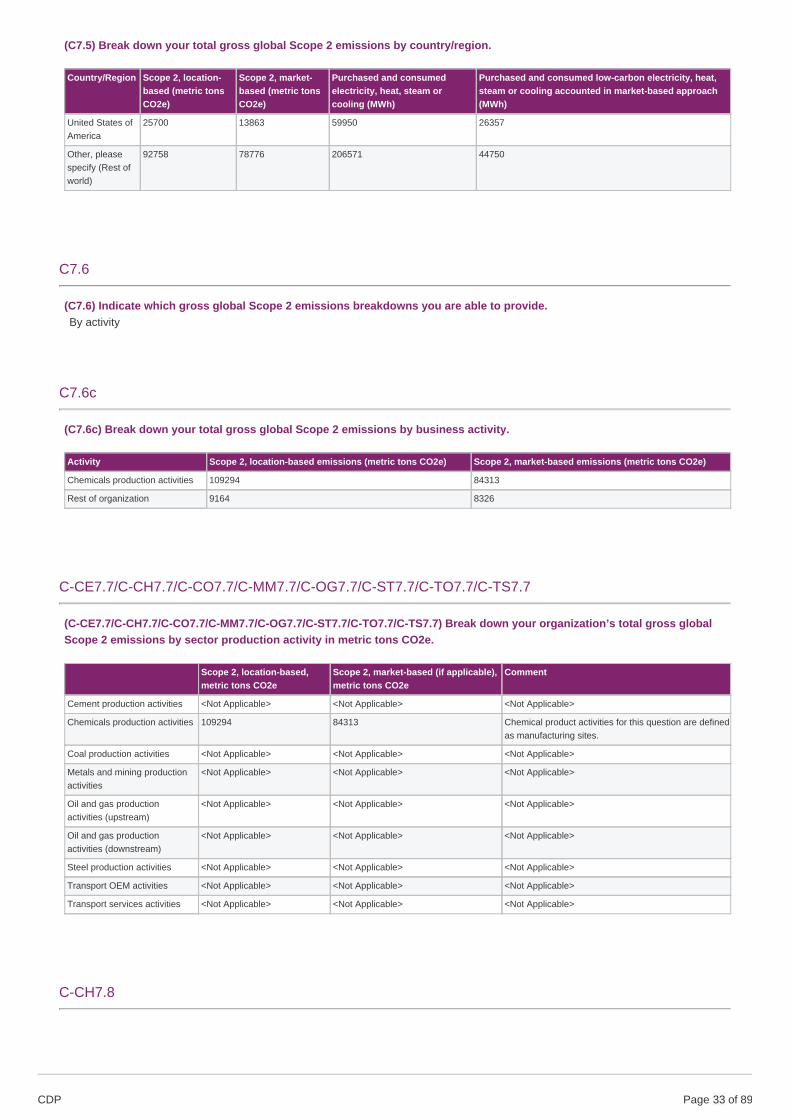
(C7.5) Break down your total gross global Scope 2 emissions by country/region.
Country/Region Scope 2, location-based (metric tonsCO2e)
Scope 2, market-based (metric tonsCO2e)
Purchased and consumedelectricity, heat, steam orcooling (MWh)
Purchased and consumed low-carbon electricity, heat,steam or cooling accounted in market-based approach(MWh)
United States ofAmerica
25700 13863 59950 26357
Other, pleasespecify (Rest ofworld)
92758 78776 206571 44750
C7.6
(C7.6) Indicate which gross global Scope 2 emissions breakdowns you are able to provide.By activity
C7.6c
(C7.6c) Break down your total gross global Scope 2 emissions by business activity.
Activity Scope 2, location-based emissions (metric tons CO2e) Scope 2, market-based emissions (metric tons CO2e)
Chemicals production activities 109294 84313
Rest of organization 9164 8326
C-CE7.7/C-CH7.7/C-CO7.7/C-MM7.7/C-OG7.7/C-ST7.7/C-TO7.7/C-TS7.7
(C-CE7.7/C-CH7.7/C-CO7.7/C-MM7.7/C-OG7.7/C-ST7.7/C-TO7.7/C-TS7.7) Break down your organization’s total gross globalScope 2 emissions by sector production activity in metric tons CO2e.
Scope 2, location-based,metric tons CO2e
Scope 2, market-based (if applicable),metric tons CO2e
Comment
Cement production activities <Not Applicable> <Not Applicable> <Not Applicable>
Chemicals production activities 109294 84313 Chemical product activities for this question are definedas manufacturing sites.
Coal production activities <Not Applicable> <Not Applicable> <Not Applicable>
Metals and mining productionactivities
<Not Applicable> <Not Applicable> <Not Applicable>
Oil and gas productionactivities (upstream)
<Not Applicable> <Not Applicable> <Not Applicable>
Oil and gas productionactivities (downstream)
<Not Applicable> <Not Applicable> <Not Applicable>
Steel production activities <Not Applicable> <Not Applicable> <Not Applicable>
Transport OEM activities <Not Applicable> <Not Applicable> <Not Applicable>
Transport services activities <Not Applicable> <Not Applicable> <Not Applicable>
C-CH7.8
CDP Page of 8933
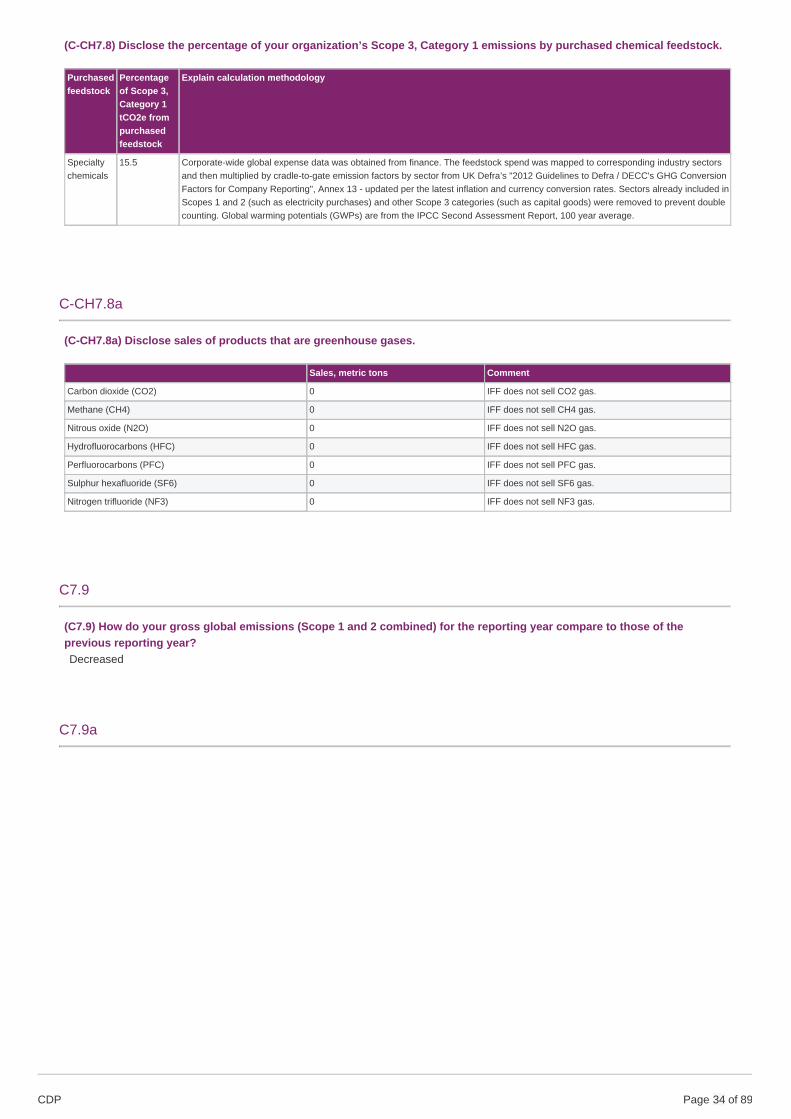
(C-CH7.8) Disclose the percentage of your organization’s Scope 3, Category 1 emissions by purchased chemical feedstock.
Purchasedfeedstock
Percentageof Scope 3,Category 1tCO2e frompurchasedfeedstock
Explain calculation methodology
Specialtychemicals
15.5 Corporate-wide global expense data was obtained from finance. The feedstock spend was mapped to corresponding industry sectorsand then multiplied by cradle-to-gate emission factors by sector from UK Defra’s "2012 Guidelines to Defra / DECC's GHG ConversionFactors for Company Reporting", Annex 13 - updated per the latest inflation and currency conversion rates. Sectors already included inScopes 1 and 2 (such as electricity purchases) and other Scope 3 categories (such as capital goods) were removed to prevent doublecounting. Global warming potentials (GWPs) are from the IPCC Second Assessment Report, 100 year average.
C-CH7.8a
(C-CH7.8a) Disclose sales of products that are greenhouse gases.
Sales, metric tons Comment
Carbon dioxide (CO2) 0 IFF does not sell CO2 gas.
Methane (CH4) 0 IFF does not sell CH4 gas.
Nitrous oxide (N2O) 0 IFF does not sell N2O gas.
Hydrofluorocarbons (HFC) 0 IFF does not sell HFC gas.
Perfluorocarbons (PFC) 0 IFF does not sell PFC gas.
Sulphur hexafluoride (SF6) 0 IFF does not sell SF6 gas.
Nitrogen trifluoride (NF3) 0 IFF does not sell NF3 gas.
C7.9
(C7.9) How do your gross global emissions (Scope 1 and 2 combined) for the reporting year compare to those of theprevious reporting year?Decreased
C7.9a
CDP Page of 8934
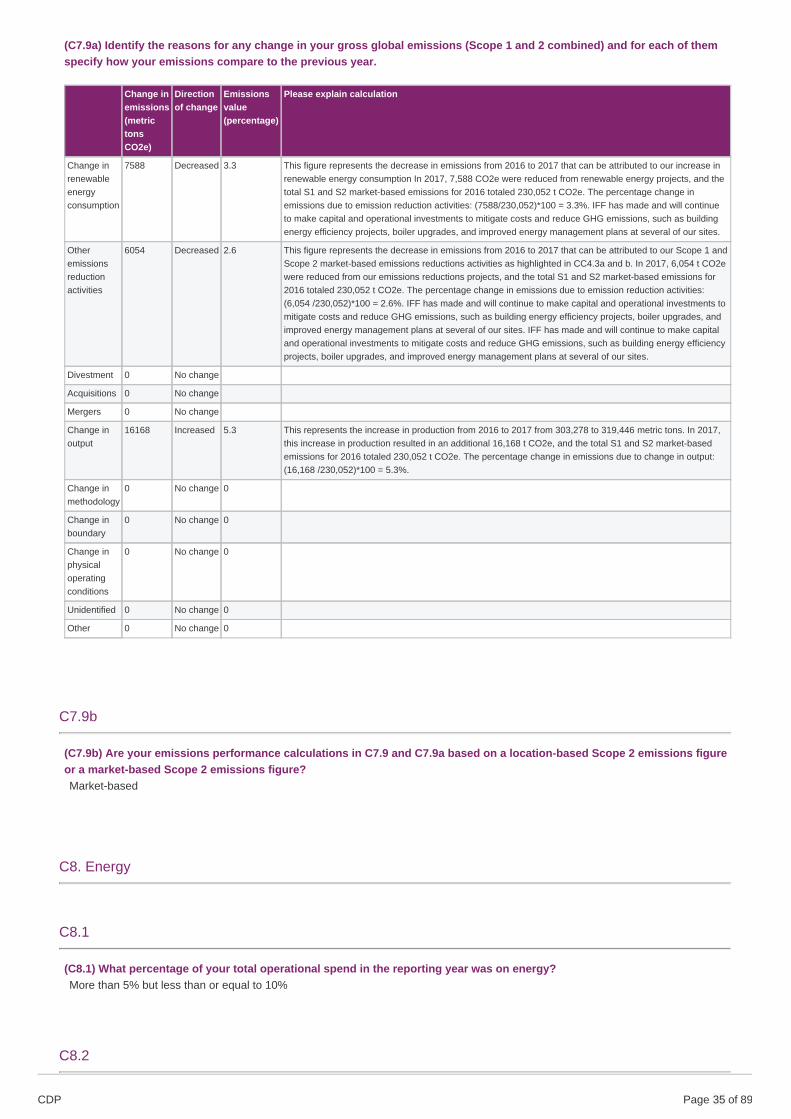
(C7.9a) Identify the reasons for any change in your gross global emissions (Scope 1 and 2 combined) and for each of themspecify how your emissions compare to the previous year.
Change inemissions(metrictonsCO2e)
Directionof change
Emissionsvalue(percentage)
Please explain calculation
Change inrenewableenergyconsumption
7588 Decreased 3.3 This figure represents the decrease in emissions from 2016 to 2017 that can be attributed to our increase inrenewable energy consumption In 2017, 7,588 CO2e were reduced from renewable energy projects, and thetotal S1 and S2 market-based emissions for 2016 totaled 230,052 t CO2e. The percentage change inemissions due to emission reduction activities: (7588/230,052)*100 = 3.3%. IFF has made and will continueto make capital and operational investments to mitigate costs and reduce GHG emissions, such as buildingenergy efficiency projects, boiler upgrades, and improved energy management plans at several of our sites.
Otheremissionsreductionactivities
6054 Decreased 2.6 This figure represents the decrease in emissions from 2016 to 2017 that can be attributed to our Scope 1 andScope 2 market-based emissions reductions activities as highlighted in CC4.3a and b. In 2017, 6,054 t CO2ewere reduced from our emissions reductions projects, and the total S1 and S2 market-based emissions for2016 totaled 230,052 t CO2e. The percentage change in emissions due to emission reduction activities:(6,054 /230,052)*100 = 2.6%. IFF has made and will continue to make capital and operational investments tomitigate costs and reduce GHG emissions, such as building energy efficiency projects, boiler upgrades, andimproved energy management plans at several of our sites. IFF has made and will continue to make capitaland operational investments to mitigate costs and reduce GHG emissions, such as building energy efficiencyprojects, boiler upgrades, and improved energy management plans at several of our sites.
Divestment 0 No change
Acquisitions 0 No change
Mergers 0 No change
Change inoutput
16168 Increased 5.3 This represents the increase in production from 2016 to 2017 from 303,278 to 319,446 metric tons. In 2017,this increase in production resulted in an additional 16,168 t CO2e, and the total S1 and S2 market-basedemissions for 2016 totaled 230,052 t CO2e. The percentage change in emissions due to change in output:(16,168 /230,052)*100 = 5.3%.
Change inmethodology
0 No change 0
Change inboundary
0 No change 0
Change inphysicaloperatingconditions
0 No change 0
Unidentified 0 No change 0
Other 0 No change 0
C7.9b
(C7.9b) Are your emissions performance calculations in C7.9 and C7.9a based on a location-based Scope 2 emissions figureor a market-based Scope 2 emissions figure?Market-based
C8. Energy
C8.1
(C8.1) What percentage of your total operational spend in the reporting year was on energy?More than 5% but less than or equal to 10%
C8.2
CDP Page of 8935
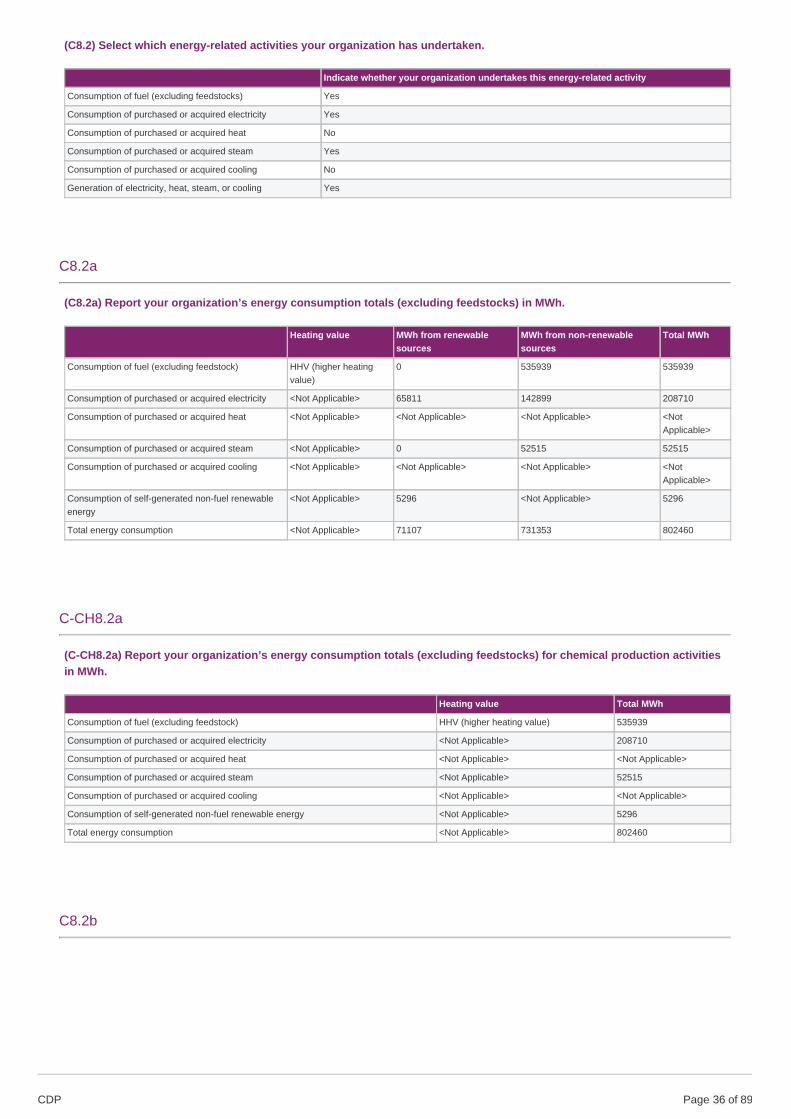
(C8.2) Select which energy-related activities your organization has undertaken.
Indicate whether your organization undertakes this energy-related activity
Consumption of fuel (excluding feedstocks) Yes
Consumption of purchased or acquired electricity Yes
Consumption of purchased or acquired heat No
Consumption of purchased or acquired steam Yes
Consumption of purchased or acquired cooling No
Generation of electricity, heat, steam, or cooling Yes
C8.2a
(C8.2a) Report your organization’s energy consumption totals (excluding feedstocks) in MWh.
Heating value MWh from renewablesources
MWh from non-renewablesources
Total MWh
Consumption of fuel (excluding feedstock) HHV (higher heatingvalue)
0 535939 535939
Consumption of purchased or acquired electricity <Not Applicable> 65811 142899 208710
Consumption of purchased or acquired heat <Not Applicable> <Not Applicable> <Not Applicable> <NotApplicable>
Consumption of purchased or acquired steam <Not Applicable> 0 52515 52515
Consumption of purchased or acquired cooling <Not Applicable> <Not Applicable> <Not Applicable> <NotApplicable>
Consumption of self-generated non-fuel renewableenergy
<Not Applicable> 5296 <Not Applicable> 5296
Total energy consumption <Not Applicable> 71107 731353 802460
C-CH8.2a
(C-CH8.2a) Report your organization’s energy consumption totals (excluding feedstocks) for chemical production activitiesin MWh.
Heating value Total MWh
Consumption of fuel (excluding feedstock) HHV (higher heating value) 535939
Consumption of purchased or acquired electricity <Not Applicable> 208710
Consumption of purchased or acquired heat <Not Applicable> <Not Applicable>
Consumption of purchased or acquired steam <Not Applicable> 52515
Consumption of purchased or acquired cooling <Not Applicable> <Not Applicable>
Consumption of self-generated non-fuel renewable energy <Not Applicable> 5296
Total energy consumption <Not Applicable> 802460
C8.2b
CDP Page of 8936
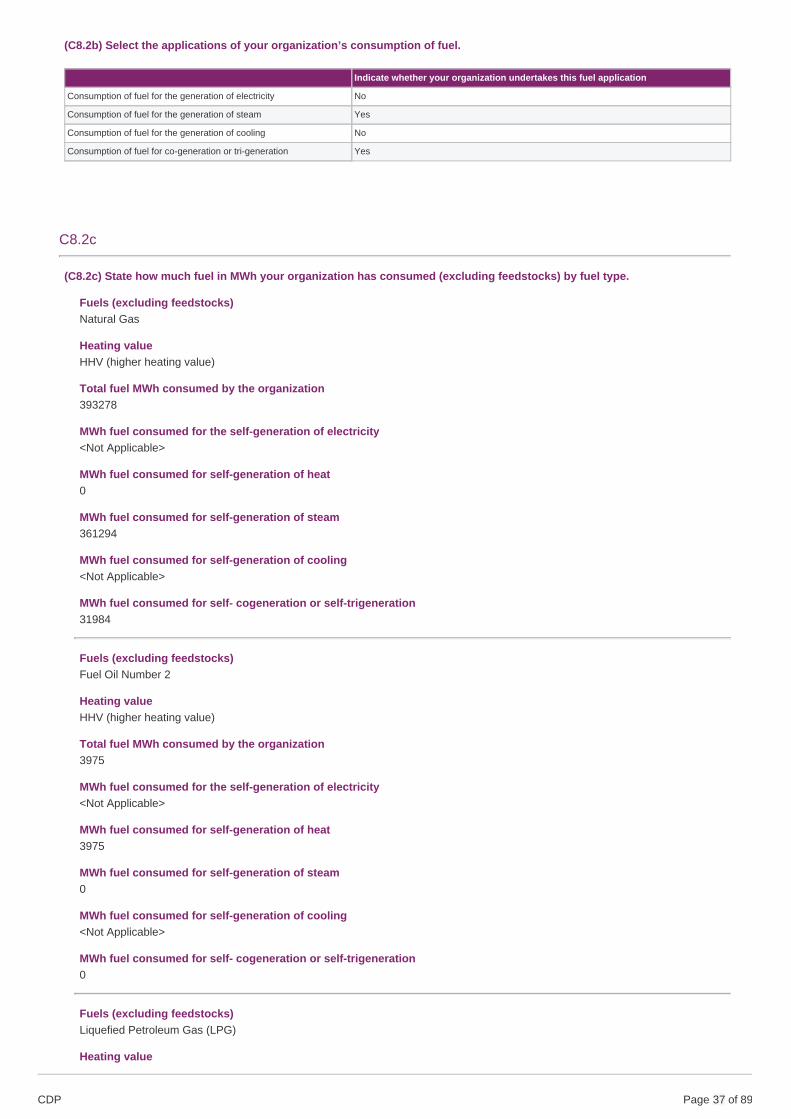
(C8.2b) Select the applications of your organization’s consumption of fuel.
Indicate whether your organization undertakes this fuel application
Consumption of fuel for the generation of electricity No
Consumption of fuel for the generation of steam Yes
Consumption of fuel for the generation of cooling No
Consumption of fuel for co-generation or tri-generation Yes
C8.2c
(C8.2c) State how much fuel in MWh your organization has consumed (excluding feedstocks) by fuel type.
Fuels (excluding feedstocks)Natural Gas
Heating valueHHV (higher heating value)
Total fuel MWh consumed by the organization393278
MWh fuel consumed for the self-generation of electricity<Not Applicable>
MWh fuel consumed for self-generation of heat0
MWh fuel consumed for self-generation of steam361294
MWh fuel consumed for self-generation of cooling<Not Applicable>
MWh fuel consumed for self- cogeneration or self-trigeneration31984
Fuels (excluding feedstocks)Fuel Oil Number 2
Heating valueHHV (higher heating value)
Total fuel MWh consumed by the organization3975
MWh fuel consumed for the self-generation of electricity<Not Applicable>
MWh fuel consumed for self-generation of heat3975
MWh fuel consumed for self-generation of steam0
MWh fuel consumed for self-generation of cooling<Not Applicable>
MWh fuel consumed for self- cogeneration or self-trigeneration0
Fuels (excluding feedstocks)Liquefied Petroleum Gas (LPG)
Heating value
CDP Page of 8937
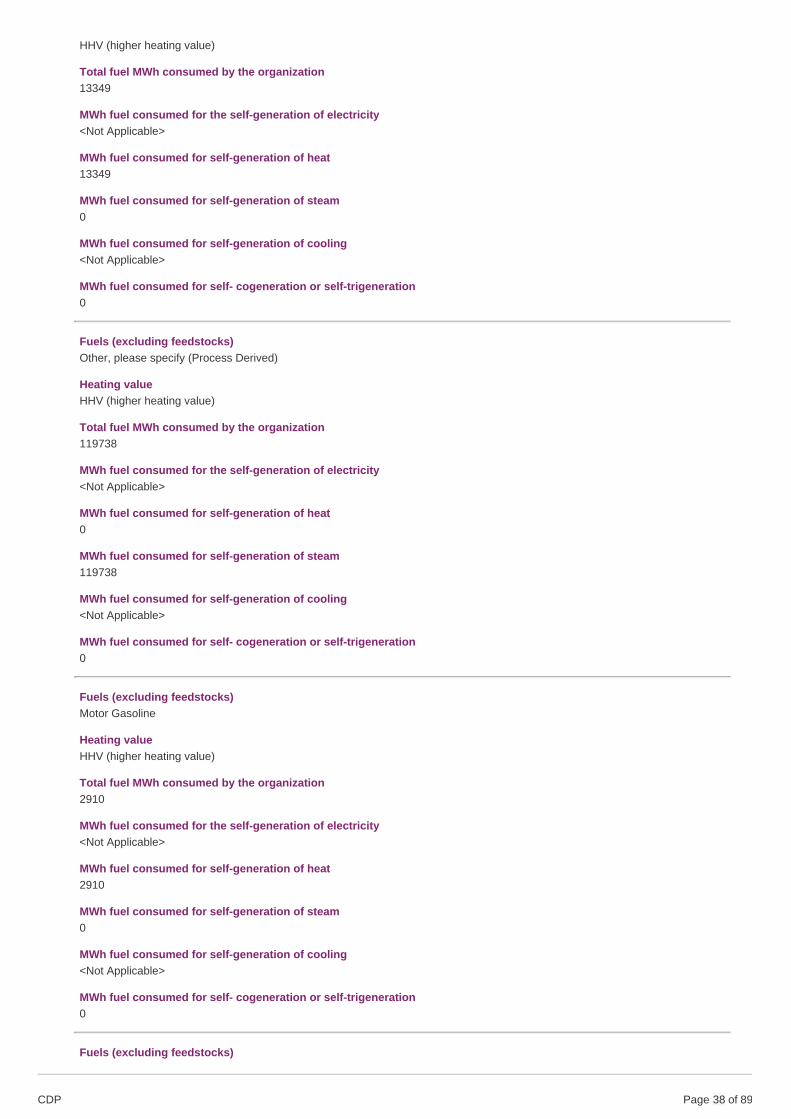
HHV (higher heating value)
Total fuel MWh consumed by the organization13349
MWh fuel consumed for the self-generation of electricity<Not Applicable>
MWh fuel consumed for self-generation of heat13349
MWh fuel consumed for self-generation of steam0
MWh fuel consumed for self-generation of cooling<Not Applicable>
MWh fuel consumed for self- cogeneration or self-trigeneration0
Fuels (excluding feedstocks)Other, please specify (Process Derived)
Heating valueHHV (higher heating value)
Total fuel MWh consumed by the organization119738
MWh fuel consumed for the self-generation of electricity<Not Applicable>
MWh fuel consumed for self-generation of heat0
MWh fuel consumed for self-generation of steam119738
MWh fuel consumed for self-generation of cooling<Not Applicable>
MWh fuel consumed for self- cogeneration or self-trigeneration0
Fuels (excluding feedstocks)Motor Gasoline
Heating valueHHV (higher heating value)
Total fuel MWh consumed by the organization2910
MWh fuel consumed for the self-generation of electricity<Not Applicable>
MWh fuel consumed for self-generation of heat2910
MWh fuel consumed for self-generation of steam0
MWh fuel consumed for self-generation of cooling<Not Applicable>
MWh fuel consumed for self- cogeneration or self-trigeneration0
Fuels (excluding feedstocks)
CDP Page of 8938

Diesel
Heating valueHHV (higher heating value)
Total fuel MWh consumed by the organization2689
MWh fuel consumed for the self-generation of electricity<Not Applicable>
MWh fuel consumed for self-generation of heat2689
MWh fuel consumed for self-generation of steam0
MWh fuel consumed for self-generation of cooling<Not Applicable>
MWh fuel consumed for self- cogeneration or self-trigeneration0
C8.2d
(C8.2d) List the average emission factors of the fuels reported in C8.2c.
Diesel
Emission factor0.25381
Unitmetric tons CO2e per MWh
Emission factor sourceU.S. EPA Center for Corporate Climate Leadership. Center for Corporate Climate Leadership GHG Emission Factors Hub.November 2015, v2.
CommentFactor is weighted average of different vehicle types incorporating assumptions of 5 miles per gallon for fork-lifts, 10 mpg for heavyduty vehicles and medium trucks, and 15 mpg for light trucks
Fuel Oil Number 2
Emission factor0.25886
Unitmetric tons CO2e per MWh
Emission factor sourceU.S. EPA Center for Corporate Climate Leadership. Center for Corporate Climate Leadership GHG Emission Factors Hub.November 2015, v2. Table 1.
Comment
CDP Page of 8939
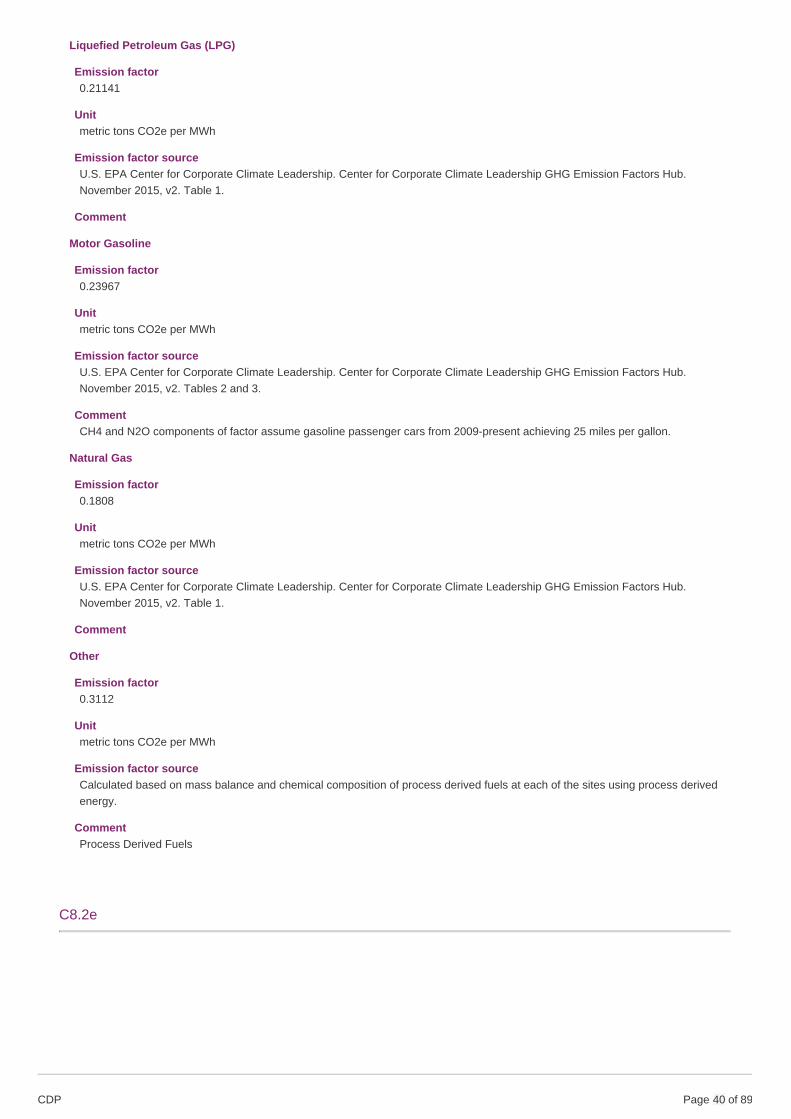
Liquefied Petroleum Gas (LPG)
Emission factor0.21141
Unitmetric tons CO2e per MWh
Emission factor sourceU.S. EPA Center for Corporate Climate Leadership. Center for Corporate Climate Leadership GHG Emission Factors Hub.November 2015, v2. Table 1.
Comment
Motor Gasoline
Emission factor0.23967
Unitmetric tons CO2e per MWh
Emission factor sourceU.S. EPA Center for Corporate Climate Leadership. Center for Corporate Climate Leadership GHG Emission Factors Hub.November 2015, v2. Tables 2 and 3.
CommentCH4 and N2O components of factor assume gasoline passenger cars from 2009-present achieving 25 miles per gallon.
Natural Gas
Emission factor0.1808
Unitmetric tons CO2e per MWh
Emission factor sourceU.S. EPA Center for Corporate Climate Leadership. Center for Corporate Climate Leadership GHG Emission Factors Hub.November 2015, v2. Table 1.
Comment
Other
Emission factor0.3112
Unitmetric tons CO2e per MWh
Emission factor sourceCalculated based on mass balance and chemical composition of process derived fuels at each of the sites using process derivedenergy.
CommentProcess Derived Fuels
C8.2e
CDP Page of 8940

(C8.2e) Provide details on the electricity, heat, steam, and cooling your organization has generated and consumed in thereporting year.
Total Grossgeneration (MWh)
Generation that is consumed by theorganization (MWh)
Gross generation fromrenewable sources (MWh)
Generation from renewable sources that isconsumed by the organization (MWh)
Electricity 5296 5296 5296 5296
Heat 0 0 0 0
Steam 0 0 0 0
Cooling 0 0 0 0
C-CH8.2e
(C-CH8.2e) Provide details on electricity, heat, steam, and cooling your organization has generated and consumed forchemical production activities.
Total gross generation (MWh) inside chemicals sector boundary Generation that is consumed (MWh) inside chemicals sector boundary
Electricity 5296 5296
Heat 0 0
Steam 0 0
Cooling 0 0
C8.2f
(C8.2f) Provide details on the electricity, heat, steam and/or cooling amounts that were accounted for at a low-carbonemission factor in the market-based Scope 2 figure reported in C6.3.
Basis for applying a low-carbon emission factorEnergy attribute certificates, Renewable Energy Certificates (RECs)
Low-carbon technology typeWind
MWh consumed associated with low-carbon electricity, heat, steam or cooling11107
Emission factor (in units of metric tons CO2e per MWh)0
CommentAt our Hazlet and Ottens sites in the US, we are supplied with 100% renewable green power through the purchase of RenewableEnergy Credits.
Basis for applying a low-carbon emission factorEnergy attribute certificates, Renewable Energy Certificates (RECs)
Low-carbon technology typeSolar PV
MWh consumed associated with low-carbon electricity, heat, steam or cooling15250
Emission factor (in units of metric tons CO2e per MWh)0
CommentAt our Jacksonville site in the US, we are supplied with renewable green power through the purchase of Renewable Energy Credits.
Basis for applying a low-carbon emission factor
CDP Page of 8941
Energy attribute certificates, Guarantees of Origin
Low-carbon technology typeWind
MWh consumed associated with low-carbon electricity, heat, steam or cooling13056
Emission factor (in units of metric tons CO2e per MWh)0
CommentAt our Tilburg and Hilversum sites in the Netherlands, we are supplied with 100% renewable green power through the purchase ofGuarantees of Origin.
Basis for applying a low-carbon emission factorEnergy attribute certificates, Guarantees of Origin
Low-carbon technology typeWind
MWh consumed associated with low-carbon electricity, heat, steam or cooling26398
Emission factor (in units of metric tons CO2e per MWh)0
CommentAt our Benicarlo site in Spain, we are supplied with 100% renewable green power through the purchase of Guarantees of Origin
Basis for applying a low-carbon emission factorPower Purchase Agreement (PPA) without energy attribute certificates
Low-carbon technology typeWind
MWh consumed associated with low-carbon electricity, heat, steam or cooling5296
Emission factor (in units of metric tons CO2e per MWh)0
CommentOur Tilburg site in the Netherlands is partially supplied with renewable electricity via an onsite windmill. Direct procurement contractwith a grid-connected generator or Power Purchase Agreement (PPA), where electricity attribute certificates do not exist or are notrequired for a usage claim.
C-CH8.3
CDP Page of 8942
(C-CH8.3) Disclose details on your organization’s consumption of feedstocks for chemical production activities.
FeedstocksSolid biomass
Total consumption76000
Total consumption unitmetric tons
Inherent carbon dioxide emission factor of feedstock, metric tons CO2 per consumption unit0
Heating value of feedstock, MWh per consumption unit5.65
Heating valueHHV
CommentThis includes all plant-based feedstocks used in our manufacturing.
C-CH8.3a
(C-CH8.3a) State the percentage, by mass, of primary resource from which your chemical feedstocks derive.
Percentage of total chemical feedstock (%)
Oil 0
Natural Gas 0
Coal 0
Biomass 39
Waste 0
Fossil fuel (where coal, gas, oil cannot be distinguished) 61
Unknown source or unable to disaggregate 0
C9. Additional metrics
C9.1
(C9.1) Provide any additional climate-related metrics relevant to your business.
C-CH9.3a
CDP Page of 8943
(C-CH9.3a) Provide details on your organization’s chemical products.
Output productSpecialty chemicals
Production (metric tons)300000
Capacity (metric tons)300000
Direct emissions intensity (metric tons CO2e per metric ton of product)0.357
Electricity intensity (MWh per metric ton of product)0.669
Steam intensity (MWh per metric ton of product)0.164
Steam/ heat recovered (MWh per metric ton of product)0
CommentThis intensity metric is tracked at a site-level and aggregated for a corporate total. The intensity value is tracked annually and partof our emissions and energy reduction targets. This intensity covers all products and reflects energy and emissions reductionefforts.
C-CH9.6
(C-CH9.6) Disclose your organization’s low-carbon investments for chemical production activities.
Investment start dateJanuary 1 2017
Investment end dateDecember 31 2017
Investment areaProducts
Technology areaOther, please specify (Renewable Energy: Wind)
Investment maturityLarge scale commercial deployment
Investment figure0
Low-carbon investment percentage81 - 100%
Please explainSeveral of our facilities use renewable electricity (wind) for production: Benicarlo, Hazlet, Jacksonville, Tilburg. The renewableenergy is acquired through RECs and GoOs. All of the products made at these facilities are considered low-carbon products andcontribute to the transition to a low carbon economy.
C10. Verification
C10.1
CDP Page of 8944

(C10.1) Indicate the verification/assurance status that applies to your reported emissions.
Verification/assurance status
Scope 1 Third-party verification or assurance process in place
Scope 2 (location-based or market-based) Third-party verification or assurance process in place
Scope 3 Third-party verification or assurance process in place
C10.1a
(C10.1a) Provide further details of the verification/assurance undertaken for your Scope 1 and/or Scope 2 emissions andattach the relevant statements.
ScopeScope 1
Verification or assurance cycle in placeAnnual process
Status in the current reporting yearComplete
Type of verification or assuranceLimited assurance
Attach the statementERM CVS 2017 CDP Assurance Statement IFF_FINAL31Jul2018.pdf
Page/ section reference1
Relevant standardISAE3000
Proportion of reported emissions verified (%)100
ScopeScope 2 location-based
Verification or assurance cycle in placeAnnual process
Status in the current reporting yearComplete
Type of verification or assuranceLimited assurance
Attach the statementERM CVS 2017 CDP Assurance Statement IFF_FINAL31Jul2018.pdf
Page/ section reference1
Relevant standardISAE3000
Proportion of reported emissions verified (%)100
ScopeScope 2 market-based
CDP Page of 8945
Verification or assurance cycle in placeAnnual process
Status in the current reporting yearComplete
Type of verification or assuranceLimited assurance
Attach the statementERM CVS 2017 CDP Assurance Statement IFF_FINAL31Jul2018.pdf
Page/ section reference1
Relevant standardISAE3000
Proportion of reported emissions verified (%)100
C10.1b
(C10.1b) Provide further details of the verification/assurance undertaken for your Scope 3 emissions and attach the relevantstatements.
ScopeScope 3- at least one applicable category
Verification or assurance cycle in placeAnnual process
Status in the current reporting yearComplete
Attach the statementERM CVS 2017 CDP Assurance Statement IFF_FINAL31Jul2018.pdf
Page/section reference1
Relevant standardISAE3000
C10.2
(C10.2) Do you verify any climate-related information reported in your CDP disclosure other than the emissions figuresreported in C6.1, C6.3, and C6.5?Yes
C10.2a
CDP Page of 8946
(C10.2a) Which data points within your CDP disclosure have been verified, and which verification standards were used?
Disclosuremoduleverificationrelates to
Data verified Verificationstandard
Please explain
C6. Emissionsdata
Year on yearchange inemissions (Scope1 and 2)
ISAE3000 IFF verifies its emissions data annually for year on year change in emissions (both scope 1 and scope 2). This isan organization wide verification and is part of our sustainability reporting process. The verification also helpsIFFmonitor and report on progress towards our SBTi approved emissions reduction target.
C11. Carbon pricing
C11.1
(C11.1) Are any of your operations or activities regulated by a carbon pricing system (i.e. ETS, Cap & Trade or Carbon Tax)?No, and we do not anticipate being regulated in the next three years
C11.2
(C11.2) Has your organization originated or purchased any project-based carbon credits within the reporting period?No
C11.3
(C11.3) Does your organization use an internal price on carbon?Yes
C11.3a
CDP Page of 8947
(C11.3a) Provide details of how your organization uses an internal price on carbon.
Objective for implementing an internal carbon priceDrive energy efficiencyDrive low-carbon investmentIdentify and seize low-carbon opportunities
GHG ScopeScope 1Scope 2
ApplicationIFF has a formalized capital project approval process to promote energy efficiency projects and low-carbon solutions. If a projectcan claim environmental benefits in terms of energy, water, and hazardous waste, this is taken into consideration along withtraditional ROI calculations. By integrating sustainability criteria into project evaluation frameworks, we can show additionalenvironmental value from investments which are then taken into consideration for internal hurdle rates. This process helps us tovalue and implement carbon-reducing solutions. This process is applied at the corporate level and is applicable to all regions andbusiness units. Based on 2017 projects, we calculated that the shadow price was equivalent to approximately $30 per metric ton ofCO2e. We will explore framing this internally as an "internal carbon price" going forward, including applying the ICP to the ROI foreach project.
Actual price(s) used (Currency /metric ton)30
Variance of price(s) usedUniform pricing that is applied throughout the company independent of geography, business unit, or type of decision. It will beupdated annually as proposed projects will change each year.
Type of internal carbon priceShadow price
Impact & implicationThe carbon price will help IFF transition to low-carbon economy by emphasizing the need for a proper carbon managementstrategy. We expect it to help drive energy efficiency, drive low-carbon investment, and identify and seize low-carbon opportunities.Using the shadow carbon price, IFF approved 7 additional projects in 2017 to save an additional 2,911 metric tons of CO2e peryear.
C12. Engagement
C12.1
(C12.1) Do you engage with your value chain on climate-related issues?Yes, our suppliersYes, our customers
C12.1a
CDP Page of 8948
(C12.1a) Provide details of your climate-related supplier engagement strategy.
Type of engagementEngagement & incentivization (changing supplier behavior)
Details of engagementRun an engagement campaign to educate suppliers about climate change
% of suppliers by number1.2
% total procurement spend (direct and indirect)48
% Scope 3 emissions as reported in C6.560
Rationale for the coverage of your engagementOur supplier engagement strategy is based around the Scope 3 component of our SBTi-approved science-based target, whichcommitted to working with our suppliers (representing 70% of its supply chain emissions) so that they set their own science-basedreduction targets and report annual emissions by 2025. The coverage of this target prioritizes IFF’s engagement not on a vaguelydefined list of “key suppliers” but rather on the absolute emissions of all suppliers, which will maximize the science-based target’simpact. The target’s requirement of suppliers to report emission reduction progress will not only encourage progress on GHGemissions management but also allow measurement of absolute emissions reductions.
Impact of engagement, including measures of successIFF’s science-based target was recently approved by SBTi. As we move toward our target, the impact of engagement will includesupplier GHG emissions reductions and/or improved climate change strategies including target setting. Based on an estimatedaverage absolute emissions reduction of 15% per supplier involved in achieving the goal, we anticipate the absolute emissionsimpact will be 100,000 tCO2e per year (a 10.5% reduction in IFF’s total scope 3 emissions). Success will be measured by percentof suppliers engaged, with a target to have 70% of supply chain emissions set their own science-based reduction targets and reportannual emissions by 2025.
CommentOur engagement of suppliers for our approved science-based target will primarily be through CDP Supply Chain.
C12.1b
(C12.1b) Give details of your climate-related engagement strategy with your customers.
Type of engagementEducation/information sharing
Details of engagementRun an engagement campaign to education customers about your climate change performance and strategy
Size of engagement25
% Scope 3 emissions as reported in C6.51
Please explain the rationale for selecting this group of customers and scope of engagementThe sustainability of our customers, their brands and their products is key to our strategy. Our customers are increasinglychallenged to find sustainable, reliable sources of ingredients to make products consumers have come to expect or demand. Withso many pressing needs, we prioritize and adopt only those initiatives that are right for us, our customers and our communities. Weengage with our customers both proactively and on an as needed basis. The measure of success is the customer scorecard. Forinstance, during 2017, twelve of our major customers, representing approximately 25% of our business, requested we respond tothe CDP supply chain questionnaire. Our rationale for the scope of this engagement is that focusing on our largest customersprovides the largest opportunity for impact and engaging through CDP Supply Chain is an established mechanism for educationand information sharing.
Impact of engagement, including measures of successIFF engages its customers through CDP supply chain, which is included on customers’ scorecards evaluating IFF’s sustainabilitystrategy and performance. The impact of engagement via CDP supply chain could include customers reducing use-phase GHG
CDP Page of 8949
emissions, increasing renewable energy procurement, or selecting our low carbon products because of the focus on these in ourdisclosure process. We conduct customer-specific monitoring to measure success, which we measure by monitoring our rating inperformance scorecards of our customers and our presence on their core lists. Our CDP Climate Change score is often factoredinto these scorecards. Some customers specifically use CDP as a grade for an annual supplier performance evaluation and usethis information to help generate their core lists, where not being included can significantly reduce the number of future projects andsales. A positive score on customer scorecards and our inclusion on their core lists are our key measures of success. In 2017, allperformance ratings received were positive (100% satisfied customers among those providing performance ratings).
Type of engagementCollaboration & innovation
Details of engagementRun a campaign to encourage innovation to reduce climate change impacts
Size of engagement25
% Scope 3 emissions as reported in C6.51
Please explain the rationale for selecting this group of customers and scope of engagementThe sustainability of our customers, their brands and their products is key to our strategy. Our customers are increasinglychallenged to find sustainable, reliable sources of ingredients to make products consumers have come to expect or demand. Withso many pressing needs, we prioritize and adopt only those initiatives that are right for us, our customers and our communities. Weengage with our customers both proactively and on an as needed basis. The measure of success is the customer scorecard. Forinstance, during 2017, twelve of our major customers, representing approximately 25% of our business, requested we respond tothe CDP supply chain questionnaire. Our rationale for the scope of this engagement is that focusing on our largest customersprovides the largest opportunity for impact and engaging through CDP Supply Chain is an established mechanism for educationand information sharing.
Impact of engagement, including measures of successIFF engages its customers through CDP supply chain, which is included on customers’ scorecards evaluating IFF’s sustainabilitystrategy and performance. The impact of engagement via CDP supply chain could include customers reducing use-phase GHGemissions, increasing renewable energy procurement, or selecting our low carbon products because of the focus on these in ourdisclosure process. We conduct customer-specific monitoring to measure success, which we measure by monitoring our rating inperformance scorecards of our customers and our presence on their core lists. Our CDP Climate Change score is often factoredinto these scorecards. Some customers specifically use CDP as a grade for an annual supplier performance evaluation and usethis information to help generate their core lists, where not being included can significantly reduce the number of future projects andsales. A positive score on customer scorecards and our inclusion on their core lists are our key measures of success. In 2017, allperformance ratings received were positive (100% satisfied customers among those providing performance ratings).
C12.3
(C12.3) Do you engage in activities that could either directly or indirectly influence public policy on climate-related issuesthrough any of the following?Trade associationsOther
C12.3b
(C12.3b) Are you on the board of any trade associations or do you provide funding beyond membership?Yes
C12.3c
CDP Page of 8950
(C12.3c) Enter the details of those trade associations that are likely to take a position on climate change legislation.
Trade associationInternational Fragrance Association (IFRA)
Is your position on climate change consistent with theirs?Consistent
Please explain the trade association’s positionThe fragrance industry’s creativity is built on a sound understanding of human behavior and attitudes. In common purpose with itscustomers and consumers the industry seeks to be at the forefront of what is environmentally sound, socially acceptable andeconomically viable, including climate change. Through initiatives in energy and water conservation, emission and waste reductionand education and community relations projects it continues to invest in improving the sustainability of its harvest of raw materials,its processing of essential oils and its manufacture of fragrance blends.
How have you, or are you attempting to, influence the position?IFF is on the board of and supports IFRA’s sustainability policies. International Fragrance Association (IFRA) works closely with theResearch Institute for Fragrance Materials (RIFM) to develop standards on fragrance material usage. In 2011, IFF partnered withthe Research Institute for Fragrance Materials (RIFM) to develop a lifecycle assessment methodology for measuring andcommunicating product sustainability.
Trade associationNatural Resources Stewardship Circle (NRSC)
Is your position on climate change consistent with theirs?Consistent
Please explain the trade association’s positionThe NRSC works to promote the responsible and ethical management of natural resources used in the beauty, cosmetics,fragrance, and flavor industries. NRSC members have pledged their personal commitment to creating a positive impact on thesourcing of natural ingredients.
How have you, or are you attempting to, influence the position?IFF also serves on the board of the Natural Resources Stewardship Circle, where it supports the NRSC’s sustainability initiatives,such as the vetiver root oil project in Haiti. IFF is working with the NRSC and other members to preserve the biodiversity of thevetiver supply chain and to develop cooperative, sustainable fair-trade projects with the local communities and farmers who growthis crop. Vetiver farmers in Haiti are encouraged through the program to take necessary steps to fight erosion to ensure soil fertilityis preserved by implementing erosion control structures or by using sustainable harvesting techniques.
Trade associationWBCSD
Is your position on climate change consistent with theirs?Consistent
Please explain the trade association’s positionThe WBCSD is a CEO-led organization of forward-thinking companies that galvanizes the global business community to create asustainable future for business, society and the environment.
How have you, or are you attempting to, influence the position?Our Chairman and CEO was elected to the Executive Committee of the World Business Council for Sustainable Development(WBCSD). This is an opportunity to work with influential leaders to make positive, lasting changes in society. IFF’s participation inthis organization is another way we can help leave the world a better place for generations to come.
C12.3e
CDP Page of 8951
(C12.3e) Provide details of the other engagement activities that you undertake.
IFF recently became a member of the World Business Council for Sustainable Development (WBCSD), which is a CEO-ledorganization of companies that galvanize the global business community to create a sustainable future for business, society, and theenvironment; a triple bottom approach that aligns with IFF’s sustainability strategy. We specifically engaged as both a company andindividual. Our Vice President of Global Sustainability is the liaison delegate to our CEO within the organization. He personally attendsand participates in climate change workgroups on both policy and climate mitigation measures. We participate in and advocate thelow carbon technologies partnership initiative of the WBCSD and support their position on COP 21 as well as the position of the CDPon the Road to Paris.
IFF also serves on the board of the Natural Resources Stewardship Circle, which is a non-profit organization that works to promotethe responsible and ethical management of natural resources used in the beauty, cosmetics, fragrance, and flavor industries. NRSCmembers have pledged their personal commitment to creating a positive impact on the sourcing of natural ingredients. For example,vetiver farmers in Haiti are encouraged through the program to take necessary steps to fight erosion to ensure soil fertility ispreserved by implementing erosion control structures or by using sustainable harvesting techniques.
IFF is a founding member of the International Fragrance Association (IFRA), the official representative body of the fragrances industryworldwide, with the main purpose of ensuring the safety of fragrance materials. IFF participated in an IFRA working group to developsector-specific approach to GHG emissions calculation for the fragrances and flavors industry.
IFF has a long association with the Research Institute for Fragrance Materials and partnered with them to conduct a life-cycleanalysis of popular fragrance materials to determine their overall sustainability. RIFM’s purpose is to gather and analyze scientificdata, engage in testing and evaluation, distribute information, cooperate with official agencies and to encourage uniform safetystandards related to the use of fragrance ingredients. The RIFM Database of flavor and fragrance materials is the largest availableworldwide, classifying more than 5000 materials. The database is available online, 24/7, by subscription. RIFM's Database alsohouses an online collection of Flavor/Fragrance Ingredient Data Sheets (FFIDS) from 1985-present. FFIDSs are issued to assist withcompliance for U.S. OSHA's Hazard Communication Standards and the European Commission's Dangerous Substances Directives.
IFF is also a member of the American Cleaning Institute (ACI), the Home of the U.S. Cleaning Products Industry™, representingproducers of household, industrial, and institutional cleaning products, their ingredients and finished packaging; oleochemicalproducers; and chemical distributors to the cleaning product industry. IFF annually participates in the ACI’s Sustainability MetricsProgram. IFF also joined the ACI’s Charter for Sustainable Cleaning, a voluntary lifecycle-based framework that promotes a commonindustry approach to sharing and reporting best practices for sustainability. Companies participating in the Charter demonstrate theircommitment to continuous improvement of key aspects of sustainability across all stages of the cleaning product supply chain.
IFF is a member of the International Organization of the Flavor Industry (IOFI), which is a non-profit organization that represents theinterest of the global flavor industry and its partners by providing leadership in safety, scientific and regulatory matters. One of IOFI’skey objectives is “Organizational Sustainability and Growth: Increase IOFI's global representation and, in partnership with memberassociations, prepare the association for future challenges with adequate resources and reserves.”
IFF is also a member of the Flavor and Extract Manufacturers Association (FEMA), the oldest and largest national association of theflavor industry and is engaged principally in activities which ensure a substantial supply of safe flavor materials.
C12.3f
CDP Page of 8952
(C12.3f) What processes do you have in place to ensure that all of your direct and indirect activities that influence policy areconsistent with your overall climate change strategy?
By supporting the works of external entities, such as industry associations and other organizations, we are able to monitor currentand/or pending climate change legislation that may impact our business globally. IFF’s Vice President of Global Sustainability alongwith the Sustainability Business Council, which is comprised of cross-functional business leaders, review all policies related toclimate change to provide consistent alignment with our sustainability and business strategies.
Our process for ensuring engagement is consistent across different geographies and markets starts with the Sustainability BusinessCouncil. In addition to reviewing policies with the VP of Global Sustainability to ensure alignment with our sustainability principles andbusiness objectives, members of this council are also frequently our representatives on or liaisons with trade organizations. Theyengage policymakers directly at a high level and relay information back to the VP of Global Sustainability to ensure consistency.
At the local level, Green Team core members interact with local officials to comply with regulatory frameworks and leverage ISO14001 to help foster a working relationship with regulators to ensure they are updated with changing legislation. ISO 14001 isrecertified every 3 years. The Green Team members report back to the Eco-Effectiveness Leadership Team, who report to the VP ofGlobal Sustainability to maintain consistency and alignment with corporate policy engagement and strategy.
C12.4
(C12.4) Have you published information about your organization’s response to climate change and GHG emissionsperformance for this reporting year in places other than in your CDP response? If so, please attach the publication(s).
PublicationIn mainstream reports
StatusComplete
Attach the documentIFF Annual Report 2017.pdf
Content elementsGovernanceStrategyRisks & opportunities
PublicationIn voluntary sustainability report
StatusComplete
Attach the documentFINAL 2017 IFF Sustainability Report.pdf
Content elementsGovernanceStrategyRisks & opportunitiesEmissions figuresEmission targetsOther metrics
C14. Signoff
C-FI
CDP Page of 8953
(C-FI) Use this field to provide any additional information or context that you feel is relevant to your organization's response.Please note that this field is optional and is not scored.
C14.1
(C14.1) Provide details for the person that has signed off (approved) your CDP climate change response.
Job title Corresponding job category
Row 1 Executive VP and Chief Financial Officer Chief Financial Officer (CFO)
SC. Supply chain module
SC0.0
(SC0.0) If you would like to do so, please provide a separate introduction to this module.
SC0.1
(SC0.1) What is your company’s annual revenue for the stated reporting period?
Annual Revenue
Row 1 3398719000
SC0.2
(SC0.2) Do you have an ISIN for your company that you would be willing to share with CDP?No
SC1.1
(SC1.1) Allocate your emissions to your customers listed below according to the goods or services you have sold them inthis reporting period.
Requesting memberAbbott Laboratories
Scope of emissionsScope 1
Emissions in metric tonnes of CO2e134
Uncertainty (±%)5
Major sources of emissionsIFF operations use energy for heating and cooling of buildings, lighting, refrigeration, generating hot water and steam, processoperations and cleaning. IFF obtained verification for absolute global Scope 1 GHG emissions.
CDP Page of 8954
VerifiedNo
Allocation methodAllocation based on the market value of products purchased
Please explain how you have identified the GHG source, including major limitations to this process and assumptionsmadeEnergy sources were identified according to the global infrastructure and operational systems. Natural gas, purchased electricity,process derived fuels, and purchased steam accounted for more than 90% of our global energy consumption in 2017. These arethe main energy sources we use to heat and cool our buildings, to generate hot water and steam; and for refrigeration, processoperations and cleaning. Data is collected globally via an internet based system for capturing and calculating GHG emissions.Uncertainty could be due to human error, unit conversions, and estimation methodology. Our Scope 1, 2 and 3 data have beenexternally verified by the ERM CVS. Our Scope 3, Fuel- and energy-related activities (not included in Scopes 1 or 2) werecalculated based on 100% primary data. The quantity of energy consumed for each energy type, such as electricity or natural gas,is used as activity data to calculate emissions. Consumption by fuel type is multiplied by emission factors for each of the threeactivities included in this category. Emission factors for upstream emissions of purchased fuels are based on life-cycle analysissoftware. Emission factors for upstream emissions of purchased electricity are based on life-cycle analysis software for the US, andon UK Defra 2013 Guidelines for other countries. Emission factors for T&D losses are based on EPA’s eGRID database for the US,and on UK Defra 2013 Guidelines for other countries. GWPs are IPCC Second Assessment Report (SAR - 100 year). Goingforward we will be evaluating data collection methods for other categories of Scope 3 emissions. For emissions from purchasedgoods and services and capital goods, corporate-wide global expense data was obtained from finance. The spend was mapped tocorresponding industry sectors and then multiplied by cradle-to-gate emission factors by sector from UK Defra’s "2012 Guidelinesto Defra / DECC's GHG Conversion Factors for Company Reporting", Annex 13. Upstream transportation and distribution includesemissions associated with inbound shipments to our facilities, shipments between our facilities, and outbound shipments from ourfacilities that we pay for. Emissions generated by waste was calculated from the landfilling of hazardous waste generated fromIFF’s total global production. It is assumed that 20% of the waste in landfilled, while the other 80% is incinerated. For emissionsfrom business travel, travel data is provided by our travel agency and includes global air and rail travel by cabin class and distancethreshold for each trip. All scope 3 emissions were calculated based on 100% primary data.
Requesting memberAbbott Laboratories
Scope of emissionsScope 2
Emissions in metric tonnes of CO2e109
Uncertainty (±%)5
Major sources of emissionsIFF operations use energy for heating and cooling of buildings, lighting, refrigeration, generating hot water and steam, processoperations and cleaning. IFF obtained verification for absolute global Scope 2 GHG emissions.
VerifiedNo
Allocation methodAllocation based on the market value of products purchased
Please explain how you have identified the GHG source, including major limitations to this process and assumptionsmadeEnergy sources were identified according to the global infrastructure and operational systems. Natural gas, purchased electricity,process derived fuels, and purchased steam accounted for more than 90% of our global energy consumption in 2017. These arethe main energy sources we use to heat and cool our buildings, to generate hot water and steam; and for refrigeration, processoperations and cleaning. Data is collected globally via an internet based system for capturing and calculating GHG emissions.Uncertainty could be due to human error, unit conversions, and estimation methodology. Our Scope 1, 2 and 3 data have beenexternally verified by the ERM CVS. Our Scope 3, Fuel- and energy-related activities (not included in Scopes 1 or 2) werecalculated based on 100% primary data. The quantity of energy consumed for each energy type, such as electricity or natural gas,is used as activity data to calculate emissions. Consumption by fuel type is multiplied by emission factors for each of the threeactivities included in this category. Emission factors for upstream emissions of purchased fuels are based on life-cycle analysissoftware. Emission factors for upstream emissions of purchased electricity are based on life-cycle analysis software for the US, andon UK Defra 2013 Guidelines for other countries. Emission factors for T&D losses are based on EPA’s eGRID database for the US,and on UK Defra 2013 Guidelines for other countries. GWPs are IPCC Second Assessment Report (SAR - 100 year). Going
CDP Page of 8955
forward we will be evaluating data collection methods for other categories of Scope 3 emissions. For emissions from purchasedgoods and services and capital goods, corporate-wide global expense data was obtained from finance. The spend was mapped tocorresponding industry sectors and then multiplied by cradle-to-gate emission factors by sector from UK Defra’s "2012 Guidelinesto Defra / DECC's GHG Conversion Factors for Company Reporting", Annex 13. Upstream transportation and distribution includesemissions associated with inbound shipments to our facilities, shipments between our facilities, and outbound shipments from ourfacilities that we pay for. Emissions generated by waste was calculated from the landfilling of hazardous waste generated fromIFF’s total global production. It is assumed that 20% of the waste in landfilled, while the other 80% is incinerated. For emissionsfrom business travel, travel data is provided by our travel agency and includes global air and rail travel by cabin class and distancethreshold for each trip. All scope 3 emissions were calculated based on 100% primary data.
Requesting memberAbbott Laboratories
Scope of emissionsScope 3
Emissions in metric tonnes of CO2e1305
Uncertainty (±%)5
Major sources of emissionsGHG emissions for scope 3 include upstream emissions from purchased goods and services, capital goods, purchased fuels andelectricity, transmission and distribution losses of purchased electricity and steam, transportation and distribution, as well as frombusiness travel and the waste generated within our operations. IFF obtained verification for absolute Scope 3, Fuel- and energy-related activities (not included in Scopes 1 or 2) GHG emissions.
VerifiedNo
Allocation methodAllocation based on the market value of products purchased
Please explain how you have identified the GHG source, including major limitations to this process and assumptionsmadeEnergy sources were identified according to the global infrastructure and operational systems. Natural gas, purchased electricity,process derived fuels, and purchased steam accounted for more than 90% of our global energy consumption in 2017. These arethe main energy sources we use to heat and cool our buildings, to generate hot water and steam; and for refrigeration, processoperations and cleaning. Data is collected globally via an internet based system for capturing and calculating GHG emissions.Uncertainty could be due to human error, unit conversions, and estimation methodology. Our Scope 1, 2 and 3 data have beenexternally verified by the ERM CVS. Our Scope 3, Fuel- and energy-related activities (not included in Scopes 1 or 2) werecalculated based on 100% primary data. The quantity of energy consumed for each energy type, such as electricity or natural gas,is used as activity data to calculate emissions. Consumption by fuel type is multiplied by emission factors for each of the threeactivities included in this category. Emission factors for upstream emissions of purchased fuels are based on life-cycle analysissoftware. Emission factors for upstream emissions of purchased electricity are based on life-cycle analysis software for the US, andon UK Defra 2013 Guidelines for other countries. Emission factors for T&D losses are based on EPA’s eGRID database for the US,and on UK Defra 2013 Guidelines for other countries. GWPs are IPCC Second Assessment Report (SAR - 100 year). Goingforward we will be evaluating data collection methods for other categories of Scope 3 emissions. For emissions from purchasedgoods and services and capital goods, corporate-wide global expense data was obtained from finance. The spend was mapped tocorresponding industry sectors and then multiplied by cradle-to-gate emission factors by sector from UK Defra’s "2012 Guidelinesto Defra / DECC's GHG Conversion Factors for Company Reporting", Annex 13. Upstream transportation and distribution includesemissions associated with inbound shipments to our facilities, shipments between our facilities, and outbound shipments from ourfacilities that we pay for. Emissions generated by waste was calculated from the landfilling of hazardous waste generated fromIFF’s total global production. It is assumed that 20% of the waste in landfilled, while the other 80% is incinerated. For emissionsfrom business travel, travel data is provided by our travel agency and includes global air and rail travel by cabin class and distancethreshold for each trip. All scope 3 emissions were calculated based on 100% primary data.
Requesting memberAmbev S.A
Scope of emissionsScope 1
Emissions in metric tonnes of CO2e436
CDP Page of 8956

Uncertainty (±%)5
Major sources of emissionsIFF operations use energy for heating and cooling of buildings, lighting, refrigeration, generating hot water and steam, processoperations and cleaning. IFF obtained verification for absolute global Scope 1 GHG emissions.
VerifiedNo
Allocation methodAllocation based on the market value of products purchased
Please explain how you have identified the GHG source, including major limitations to this process and assumptionsmadeEnergy sources were identified according to the global infrastructure and operational systems. Natural gas, purchased electricity,process derived fuels, and purchased steam accounted for more than 90% of our global energy consumption in 2017. These arethe main energy sources we use to heat and cool our buildings, to generate hot water and steam; and for refrigeration, processoperations and cleaning. Data is collected globally via an internet based system for capturing and calculating GHG emissions.Uncertainty could be due to human error, unit conversions, and estimation methodology. Our Scope 1, 2 and 3 data have beenexternally verified by the ERM CVS. Our Scope 3, Fuel- and energy-related activities (not included in Scopes 1 or 2) werecalculated based on 100% primary data. The quantity of energy consumed for each energy type, such as electricity or natural gas,is used as activity data to calculate emissions. Consumption by fuel type is multiplied by emission factors for each of the threeactivities included in this category. Emission factors for upstream emissions of purchased fuels are based on life-cycle analysissoftware. Emission factors for upstream emissions of purchased electricity are based on life-cycle analysis software for the US, andon UK Defra 2013 Guidelines for other countries. Emission factors for T&D losses are based on EPA’s eGRID database for the US,and on UK Defra 2013 Guidelines for other countries. GWPs are IPCC Second Assessment Report (SAR - 100 year). Goingforward we will be evaluating data collection methods for other categories of Scope 3 emissions. For emissions from purchasedgoods and services and capital goods, corporate-wide global expense data was obtained from finance. The spend was mapped tocorresponding industry sectors and then multiplied by cradle-to-gate emission factors by sector from UK Defra’s "2012 Guidelinesto Defra / DECC's GHG Conversion Factors for Company Reporting", Annex 13. Upstream transportation and distribution includesemissions associated with inbound shipments to our facilities, shipments between our facilities, and outbound shipments from ourfacilities that we pay for. Emissions generated by waste was calculated from the landfilling of hazardous waste generated fromIFF’s total global production. It is assumed that 20% of the waste in landfilled, while the other 80% is incinerated. For emissionsfrom business travel, travel data is provided by our travel agency and includes global air and rail travel by cabin class and distancethreshold for each trip. All scope 3 emissions were calculated based on 100% primary data.
Requesting memberAmbev S.A
Scope of emissionsScope 2
Emissions in metric tonnes of CO2e354
Uncertainty (±%)5
Major sources of emissionsIFF operations use energy for heating and cooling of buildings, lighting, refrigeration, generating hot water and steam, processoperations and cleaning. IFF obtained verification for absolute global Scope 2 GHG emissions.
VerifiedNo
Allocation methodAllocation based on the market value of products purchased
Please explain how you have identified the GHG source, including major limitations to this process and assumptionsmadeEnergy sources were identified according to the global infrastructure and operational systems. Natural gas, purchased electricity,process derived fuels, and purchased steam accounted for more than 90% of our global energy consumption in 2017. These arethe main energy sources we use to heat and cool our buildings, to generate hot water and steam; and for refrigeration, processoperations and cleaning. Data is collected globally via an internet based system for capturing and calculating GHG emissions.Uncertainty could be due to human error, unit conversions, and estimation methodology. Our Scope 1, 2 and 3 data have beenexternally verified by the ERM CVS. Our Scope 3, Fuel- and energy-related activities (not included in Scopes 1 or 2) were
CDP Page of 8957
calculated based on 100% primary data. The quantity of energy consumed for each energy type, such as electricity or natural gas,is used as activity data to calculate emissions. Consumption by fuel type is multiplied by emission factors for each of the threeactivities included in this category. Emission factors for upstream emissions of purchased fuels are based on life-cycle analysissoftware. Emission factors for upstream emissions of purchased electricity are based on life-cycle analysis software for the US, andon UK Defra 2013 Guidelines for other countries. Emission factors for T&D losses are based on EPA’s eGRID database for the US,and on UK Defra 2013 Guidelines for other countries. GWPs are IPCC Second Assessment Report (SAR - 100 year). Goingforward we will be evaluating data collection methods for other categories of Scope 3 emissions. For emissions from purchasedgoods and services and capital goods, corporate-wide global expense data was obtained from finance. The spend was mapped tocorresponding industry sectors and then multiplied by cradle-to-gate emission factors by sector from UK Defra’s "2012 Guidelinesto Defra / DECC's GHG Conversion Factors for Company Reporting", Annex 13. Upstream transportation and distribution includesemissions associated with inbound shipments to our facilities, shipments between our facilities, and outbound shipments from ourfacilities that we pay for. Emissions generated by waste was calculated from the landfilling of hazardous waste generated fromIFF’s total global production. It is assumed that 20% of the waste in landfilled, while the other 80% is incinerated. For emissionsfrom business travel, travel data is provided by our travel agency and includes global air and rail travel by cabin class and distancethreshold for each trip. All scope 3 emissions were calculated based on 100% primary data.
Requesting memberAmbev S.A
Scope of emissionsScope 3
Emissions in metric tonnes of CO2e4240
Uncertainty (±%)5
Major sources of emissionsGHG emissions for scope 3 include upstream emissions from purchased goods and services, capital goods, purchased fuels andelectricity, transmission and distribution losses of purchased electricity and steam, transportation and distribution, as well as frombusiness travel and the waste generated within our operations. IFF obtained verification for absolute Scope 3, Fuel- and energy-related activities (not included in Scopes 1 or 2) GHG emissions.
VerifiedNo
Allocation methodAllocation based on the market value of products purchased
Please explain how you have identified the GHG source, including major limitations to this process and assumptionsmadeEnergy sources were identified according to the global infrastructure and operational systems. Natural gas, purchased electricity,process derived fuels, and purchased steam accounted for more than 90% of our global energy consumption in 2017. These arethe main energy sources we use to heat and cool our buildings, to generate hot water and steam; and for refrigeration, processoperations and cleaning. Data is collected globally via an internet based system for capturing and calculating GHG emissions.Uncertainty could be due to human error, unit conversions, and estimation methodology. Our Scope 1, 2 and 3 data have beenexternally verified by the ERM CVS. Our Scope 3, Fuel- and energy-related activities (not included in Scopes 1 or 2) werecalculated based on 100% primary data. The quantity of energy consumed for each energy type, such as electricity or natural gas,is used as activity data to calculate emissions. Consumption by fuel type is multiplied by emission factors for each of the threeactivities included in this category. Emission factors for upstream emissions of purchased fuels are based on life-cycle analysissoftware. Emission factors for upstream emissions of purchased electricity are based on life-cycle analysis software for the US, andon UK Defra 2013 Guidelines for other countries. Emission factors for T&D losses are based on EPA’s eGRID database for the US,and on UK Defra 2013 Guidelines for other countries. GWPs are IPCC Second Assessment Report (SAR - 100 year). Goingforward we will be evaluating data collection methods for other categories of Scope 3 emissions. For emissions from purchasedgoods and services and capital goods, corporate-wide global expense data was obtained from finance. The spend was mapped tocorresponding industry sectors and then multiplied by cradle-to-gate emission factors by sector from UK Defra’s "2012 Guidelinesto Defra / DECC's GHG Conversion Factors for Company Reporting", Annex 13. Upstream transportation and distribution includesemissions associated with inbound shipments to our facilities, shipments between our facilities, and outbound shipments from ourfacilities that we pay for. Emissions generated by waste was calculated from the landfilling of hazardous waste generated fromIFF’s total global production. It is assumed that 20% of the waste in landfilled, while the other 80% is incinerated. For emissionsfrom business travel, travel data is provided by our travel agency and includes global air and rail travel by cabin class and distancethreshold for each trip. All scope 3 emissions were calculated based on 100% primary data.
Requesting member
CDP Page of 8958
Colgate Palmolive Company
Scope of emissionsScope 1
Emissions in metric tonnes of CO2e3151
Uncertainty (±%)5
Major sources of emissionsIFF operations use energy for heating and cooling of buildings, lighting, refrigeration, generating hot water and steam, processoperations and cleaning. IFF obtained verification for absolute global Scope 1 GHG emissions.
VerifiedNo
Allocation methodAllocation based on the market value of products purchased
Please explain how you have identified the GHG source, including major limitations to this process and assumptionsmadeEnergy sources were identified according to the global infrastructure and operational systems. Natural gas, purchased electricity,process derived fuels, and purchased steam accounted for more than 90% of our global energy consumption in 2017. These arethe main energy sources we use to heat and cool our buildings, to generate hot water and steam; and for refrigeration, processoperations and cleaning. Data is collected globally via an internet based system for capturing and calculating GHG emissions.Uncertainty could be due to human error, unit conversions, and estimation methodology. Our Scope 1, 2 and 3 data have beenexternally verified by the ERM CVS. Our Scope 3, Fuel- and energy-related activities (not included in Scopes 1 or 2) werecalculated based on 100% primary data. The quantity of energy consumed for each energy type, such as electricity or natural gas,is used as activity data to calculate emissions. Consumption by fuel type is multiplied by emission factors for each of the threeactivities included in this category. Emission factors for upstream emissions of purchased fuels are based on life-cycle analysissoftware. Emission factors for upstream emissions of purchased electricity are based on life-cycle analysis software for the US, andon UK Defra 2013 Guidelines for other countries. Emission factors for T&D losses are based on EPA’s eGRID database for the US,and on UK Defra 2013 Guidelines for other countries. GWPs are IPCC Second Assessment Report (SAR - 100 year). Goingforward we will be evaluating data collection methods for other categories of Scope 3 emissions. For emissions from purchasedgoods and services and capital goods, corporate-wide global expense data was obtained from finance. The spend was mapped tocorresponding industry sectors and then multiplied by cradle-to-gate emission factors by sector from UK Defra’s "2012 Guidelinesto Defra / DECC's GHG Conversion Factors for Company Reporting", Annex 13. Upstream transportation and distribution includesemissions associated with inbound shipments to our facilities, shipments between our facilities, and outbound shipments from ourfacilities that we pay for. Emissions generated by waste was calculated from the landfilling of hazardous waste generated fromIFF’s total global production. It is assumed that 20% of the waste in landfilled, while the other 80% is incinerated. For emissionsfrom business travel, travel data is provided by our travel agency and includes global air and rail travel by cabin class and distancethreshold for each trip. All scope 3 emissions were calculated based on 100% primary data.
Requesting memberColgate Palmolive Company
Scope of emissionsScope 2
Emissions in metric tonnes of CO2e2562
Uncertainty (±%)5
Major sources of emissionsIFF operations use energy for heating and cooling of buildings, lighting, refrigeration, generating hot water and steam, processoperations and cleaning. IFF obtained verification for absolute global Scope 2 GHG emissions.
VerifiedNo
Allocation methodAllocation based on the market value of products purchased
CDP Page of 8959
Please explain how you have identified the GHG source, including major limitations to this process and assumptionsmadeEnergy sources were identified according to the global infrastructure and operational systems. Natural gas, purchased electricity,process derived fuels, and purchased steam accounted for more than 90% of our global energy consumption in 2017. These arethe main energy sources we use to heat and cool our buildings, to generate hot water and steam; and for refrigeration, processoperations and cleaning. Data is collected globally via an internet based system for capturing and calculating GHG emissions.Uncertainty could be due to human error, unit conversions, and estimation methodology. Our Scope 1, 2 and 3 data have beenexternally verified by the ERM CVS. Our Scope 3, Fuel- and energy-related activities (not included in Scopes 1 or 2) werecalculated based on 100% primary data. The quantity of energy consumed for each energy type, such as electricity or natural gas,is used as activity data to calculate emissions. Consumption by fuel type is multiplied by emission factors for each of the threeactivities included in this category. Emission factors for upstream emissions of purchased fuels are based on life-cycle analysissoftware. Emission factors for upstream emissions of purchased electricity are based on life-cycle analysis software for the US, andon UK Defra 2013 Guidelines for other countries. Emission factors for T&D losses are based on EPA’s eGRID database for the US,and on UK Defra 2013 Guidelines for other countries. GWPs are IPCC Second Assessment Report (SAR - 100 year). Goingforward we will be evaluating data collection methods for other categories of Scope 3 emissions. For emissions from purchasedgoods and services and capital goods, corporate-wide global expense data was obtained from finance. The spend was mapped tocorresponding industry sectors and then multiplied by cradle-to-gate emission factors by sector from UK Defra’s "2012 Guidelinesto Defra / DECC's GHG Conversion Factors for Company Reporting", Annex 13. Upstream transportation and distribution includesemissions associated with inbound shipments to our facilities, shipments between our facilities, and outbound shipments from ourfacilities that we pay for. Emissions generated by waste was calculated from the landfilling of hazardous waste generated fromIFF’s total global production. It is assumed that 20% of the waste in landfilled, while the other 80% is incinerated. For emissionsfrom business travel, travel data is provided by our travel agency and includes global air and rail travel by cabin class and distancethreshold for each trip. All scope 3 emissions were calculated based on 100% primary data.
Requesting memberColgate Palmolive Company
Scope of emissionsScope 3
Emissions in metric tonnes of CO2e30656
Uncertainty (±%)5
Major sources of emissionsGHG emissions for scope 3 include upstream emissions from purchased goods and services, capital goods, purchased fuels andelectricity, transmission and distribution losses of purchased electricity and steam, transportation and distribution, as well as frombusiness travel and the waste generated within our operations. IFF obtained verification for absolute Scope 3, Fuel- and energy-related activities (not included in Scopes 1 or 2) GHG emissions.
VerifiedNo
Allocation methodAllocation based on the market value of products purchased
Please explain how you have identified the GHG source, including major limitations to this process and assumptionsmadeEnergy sources were identified according to the global infrastructure and operational systems. Natural gas, purchased electricity,process derived fuels, and purchased steam accounted for more than 90% of our global energy consumption in 2017. These arethe main energy sources we use to heat and cool our buildings, to generate hot water and steam; and for refrigeration, processoperations and cleaning. Data is collected globally via an internet based system for capturing and calculating GHG emissions.Uncertainty could be due to human error, unit conversions, and estimation methodology. Our Scope 1, 2 and 3 data have beenexternally verified by the ERM CVS. Our Scope 3, Fuel- and energy-related activities (not included in Scopes 1 or 2) werecalculated based on 100% primary data. The quantity of energy consumed for each energy type, such as electricity or natural gas,is used as activity data to calculate emissions. Consumption by fuel type is multiplied by emission factors for each of the threeactivities included in this category. Emission factors for upstream emissions of purchased fuels are based on life-cycle analysissoftware. Emission factors for upstream emissions of purchased electricity are based on life-cycle analysis software for the US, andon UK Defra 2013 Guidelines for other countries. Emission factors for T&D losses are based on EPA’s eGRID database for the US,and on UK Defra 2013 Guidelines for other countries. GWPs are IPCC Second Assessment Report (SAR - 100 year). Goingforward we will be evaluating data collection methods for other categories of Scope 3 emissions. For emissions from purchasedgoods and services and capital goods, corporate-wide global expense data was obtained from finance. The spend was mapped tocorresponding industry sectors and then multiplied by cradle-to-gate emission factors by sector from UK Defra’s "2012 Guidelines
CDP Page of 8960
to Defra / DECC's GHG Conversion Factors for Company Reporting", Annex 13. Upstream transportation and distribution includesemissions associated with inbound shipments to our facilities, shipments between our facilities, and outbound shipments from ourfacilities that we pay for. Emissions generated by waste was calculated from the landfilling of hazardous waste generated fromIFF’s total global production. It is assumed that 20% of the waste in landfilled, while the other 80% is incinerated. For emissionsfrom business travel, travel data is provided by our travel agency and includes global air and rail travel by cabin class and distancethreshold for each trip. All scope 3 emissions were calculated based on 100% primary data.
Requesting memberDiageo Plc
Scope of emissionsScope 1
Emissions in metric tonnes of CO2e436
Uncertainty (±%)5
Major sources of emissionsIFF operations use energy for heating and cooling of buildings, lighting, refrigeration, generating hot water and steam, processoperations and cleaning. IFF obtained verification for absolute global Scope 1 GHG emissions.
VerifiedNo
Allocation methodAllocation based on the market value of products purchased
Please explain how you have identified the GHG source, including major limitations to this process and assumptionsmadeEnergy sources were identified according to the global infrastructure and operational systems. Natural gas, purchased electricity,process derived fuels, and purchased steam accounted for more than 90% of our global energy consumption in 2017. These arethe main energy sources we use to heat and cool our buildings, to generate hot water and steam; and for refrigeration, processoperations and cleaning. Data is collected globally via an internet based system for capturing and calculating GHG emissions.Uncertainty could be due to human error, unit conversions, and estimation methodology. Our Scope 1, 2 and 3 data have beenexternally verified by the ERM CVS. Our Scope 3, Fuel- and energy-related activities (not included in Scopes 1 or 2) werecalculated based on 100% primary data. The quantity of energy consumed for each energy type, such as electricity or natural gas,is used as activity data to calculate emissions. Consumption by fuel type is multiplied by emission factors for each of the threeactivities included in this category. Emission factors for upstream emissions of purchased fuels are based on life-cycle analysissoftware. Emission factors for upstream emissions of purchased electricity are based on life-cycle analysis software for the US, andon UK Defra 2013 Guidelines for other countries. Emission factors for T&D losses are based on EPA’s eGRID database for the US,and on UK Defra 2013 Guidelines for other countries. GWPs are IPCC Second Assessment Report (SAR - 100 year). Goingforward we will be evaluating data collection methods for other categories of Scope 3 emissions. For emissions from purchasedgoods and services and capital goods, corporate-wide global expense data was obtained from finance. The spend was mapped tocorresponding industry sectors and then multiplied by cradle-to-gate emission factors by sector from UK Defra’s "2012 Guidelinesto Defra / DECC's GHG Conversion Factors for Company Reporting", Annex 13. Upstream transportation and distribution includesemissions associated with inbound shipments to our facilities, shipments between our facilities, and outbound shipments from ourfacilities that we pay for. Emissions generated by waste was calculated from the landfilling of hazardous waste generated fromIFF’s total global production. It is assumed that 20% of the waste in landfilled, while the other 80% is incinerated. For emissionsfrom business travel, travel data is provided by our travel agency and includes global air and rail travel by cabin class and distancethreshold for each trip. All scope 3 emissions were calculated based on 100% primary data.
Requesting memberDiageo Plc
Scope of emissionsScope 2
Emissions in metric tonnes of CO2e354
Uncertainty (±%)5
Major sources of emissionsIFF operations use energy for heating and cooling of buildings, lighting, refrigeration, generating hot water and steam, process
CDP Page of 8961
operations and cleaning. IFF obtained verification for absolute global Scope 2 GHG emissions.
VerifiedNo
Allocation methodAllocation based on the market value of products purchased
Please explain how you have identified the GHG source, including major limitations to this process and assumptionsmadeEnergy sources were identified according to the global infrastructure and operational systems. Natural gas, purchased electricity,process derived fuels, and purchased steam accounted for more than 90% of our global energy consumption in 2017. These arethe main energy sources we use to heat and cool our buildings, to generate hot water and steam; and for refrigeration, processoperations and cleaning. Data is collected globally via an internet based system for capturing and calculating GHG emissions.Uncertainty could be due to human error, unit conversions, and estimation methodology. Our Scope 1, 2 and 3 data have beenexternally verified by the ERM CVS. Our Scope 3, Fuel- and energy-related activities (not included in Scopes 1 or 2) werecalculated based on 100% primary data. The quantity of energy consumed for each energy type, such as electricity or natural gas,is used as activity data to calculate emissions. Consumption by fuel type is multiplied by emission factors for each of the threeactivities included in this category. Emission factors for upstream emissions of purchased fuels are based on life-cycle analysissoftware. Emission factors for upstream emissions of purchased electricity are based on life-cycle analysis software for the US, andon UK Defra 2013 Guidelines for other countries. Emission factors for T&D losses are based on EPA’s eGRID database for the US,and on UK Defra 2013 Guidelines for other countries. GWPs are IPCC Second Assessment Report (SAR - 100 year). Goingforward we will be evaluating data collection methods for other categories of Scope 3 emissions. For emissions from purchasedgoods and services and capital goods, corporate-wide global expense data was obtained from finance. The spend was mapped tocorresponding industry sectors and then multiplied by cradle-to-gate emission factors by sector from UK Defra’s "2012 Guidelinesto Defra / DECC's GHG Conversion Factors for Company Reporting", Annex 13. Upstream transportation and distribution includesemissions associated with inbound shipments to our facilities, shipments between our facilities, and outbound shipments from ourfacilities that we pay for. Emissions generated by waste was calculated from the landfilling of hazardous waste generated fromIFF’s total global production. It is assumed that 20% of the waste in landfilled, while the other 80% is incinerated. For emissionsfrom business travel, travel data is provided by our travel agency and includes global air and rail travel by cabin class and distancethreshold for each trip. All scope 3 emissions were calculated based on 100% primary data.
Requesting memberDiageo Plc
Scope of emissionsScope 3
Emissions in metric tonnes of CO2e4240
Uncertainty (±%)5
Major sources of emissions
VerifiedNo
Allocation methodAllocation based on the market value of products purchased
Please explain how you have identified the GHG source, including major limitations to this process and assumptionsmadeEnergy sources were identified according to the global infrastructure and operational systems. Natural gas, purchased electricity,process derived fuels, and purchased steam accounted for more than 90% of our global energy consumption in 2017. These arethe main energy sources we use to heat and cool our buildings, to generate hot water and steam; and for refrigeration, processoperations and cleaning. Data is collected globally via an internet based system for capturing and calculating GHG emissions.Uncertainty could be due to human error, unit conversions, and estimation methodology. Our Scope 1, 2 and 3 data have beenexternally verified by the ERM CVS. Our Scope 3, Fuel- and energy-related activities (not included in Scopes 1 or 2) werecalculated based on 100% primary data. The quantity of energy consumed for each energy type, such as electricity or natural gas,is used as activity data to calculate emissions. Consumption by fuel type is multiplied by emission factors for each of the threeactivities included in this category. Emission factors for upstream emissions of purchased fuels are based on life-cycle analysissoftware. Emission factors for upstream emissions of purchased electricity are based on life-cycle analysis software for the US, andon UK Defra 2013 Guidelines for other countries. Emission factors for T&D losses are based on EPA’s eGRID database for the US,and on UK Defra 2013 Guidelines for other countries. GWPs are IPCC Second Assessment Report (SAR - 100 year). Going
CDP Page of 8962
forward we will be evaluating data collection methods for other categories of Scope 3 emissions. For emissions from purchasedgoods and services and capital goods, corporate-wide global expense data was obtained from finance. The spend was mapped tocorresponding industry sectors and then multiplied by cradle-to-gate emission factors by sector from UK Defra’s "2012 Guidelinesto Defra / DECC's GHG Conversion Factors for Company Reporting", Annex 13. Upstream transportation and distribution includesemissions associated with inbound shipments to our facilities, shipments between our facilities, and outbound shipments from ourfacilities that we pay for. Emissions generated by waste was calculated from the landfilling of hazardous waste generated fromIFF’s total global production. It is assumed that 20% of the waste in landfilled, while the other 80% is incinerated. For emissionsfrom business travel, travel data is provided by our travel agency and includes global air and rail travel by cabin class and distancethreshold for each trip. All scope 3 emissions were calculated based on 100% primary data.
Requesting memberKAO Corporation
Scope of emissionsScope 1
Emissions in metric tonnes of CO2e570
Uncertainty (±%)5
Major sources of emissionsIFF operations use energy for heating and cooling of buildings, lighting, refrigeration, generating hot water and steam, processoperations and cleaning. IFF obtained verification for absolute global Scope 1 GHG emissions.
VerifiedNo
Allocation methodAllocation based on the market value of products purchased
Please explain how you have identified the GHG source, including major limitations to this process and assumptionsmadeEnergy sources were identified according to the global infrastructure and operational systems. Natural gas, purchased electricity,process derived fuels, and purchased steam accounted for more than 90% of our global energy consumption in 2017. These arethe main energy sources we use to heat and cool our buildings, to generate hot water and steam; and for refrigeration, processoperations and cleaning. Data is collected globally via an internet based system for capturing and calculating GHG emissions.Uncertainty could be due to human error, unit conversions, and estimation methodology. Our Scope 1, 2 and 3 data have beenexternally verified by the ERM CVS. Our Scope 3, Fuel- and energy-related activities (not included in Scopes 1 or 2) werecalculated based on 100% primary data. The quantity of energy consumed for each energy type, such as electricity or natural gas,is used as activity data to calculate emissions. Consumption by fuel type is multiplied by emission factors for each of the threeactivities included in this category. Emission factors for upstream emissions of purchased fuels are based on life-cycle analysissoftware. Emission factors for upstream emissions of purchased electricity are based on life-cycle analysis software for the US, andon UK Defra 2013 Guidelines for other countries. Emission factors for T&D losses are based on EPA’s eGRID database for the US,and on UK Defra 2013 Guidelines for other countries. GWPs are IPCC Second Assessment Report (SAR - 100 year). Goingforward we will be evaluating data collection methods for other categories of Scope 3 emissions. For emissions from purchasedgoods and services and capital goods, corporate-wide global expense data was obtained from finance. The spend was mapped tocorresponding industry sectors and then multiplied by cradle-to-gate emission factors by sector from UK Defra’s "2012 Guidelinesto Defra / DECC's GHG Conversion Factors for Company Reporting", Annex 13. Upstream transportation and distribution includesemissions associated with inbound shipments to our facilities, shipments between our facilities, and outbound shipments from ourfacilities that we pay for. Emissions generated by waste was calculated from the landfilling of hazardous waste generated fromIFF’s total global production. It is assumed that 20% of the waste in landfilled, while the other 80% is incinerated. For emissionsfrom business travel, travel data is provided by our travel agency and includes global air and rail travel by cabin class and distancethreshold for each trip. All scope 3 emissions were calculated based on 100% primary data.
Requesting memberKAO Corporation
Scope of emissionsScope 2
Emissions in metric tonnes of CO2e463
Uncertainty (±%)
CDP Page of 8963
5
Major sources of emissionsIFF operations use energy for heating and cooling of buildings, lighting, refrigeration, generating hot water and steam, processoperations and cleaning. IFF obtained verification for absolute global Scope 2 GHG emissions.
VerifiedNo
Allocation methodAllocation based on the market value of products purchased
Please explain how you have identified the GHG source, including major limitations to this process and assumptionsmadeEnergy sources were identified according to the global infrastructure and operational systems. Natural gas, purchased electricity,process derived fuels, and purchased steam accounted for more than 90% of our global energy consumption in 2017. These arethe main energy sources we use to heat and cool our buildings, to generate hot water and steam; and for refrigeration, processoperations and cleaning. Data is collected globally via an internet based system for capturing and calculating GHG emissions.Uncertainty could be due to human error, unit conversions, and estimation methodology. Our Scope 1, 2 and 3 data have beenexternally verified by the ERM CVS. Our Scope 3, Fuel- and energy-related activities (not included in Scopes 1 or 2) werecalculated based on 100% primary data. The quantity of energy consumed for each energy type, such as electricity or natural gas,is used as activity data to calculate emissions. Consumption by fuel type is multiplied by emission factors for each of the threeactivities included in this category. Emission factors for upstream emissions of purchased fuels are based on life-cycle analysissoftware. Emission factors for upstream emissions of purchased electricity are based on life-cycle analysis software for the US, andon UK Defra 2013 Guidelines for other countries. Emission factors for T&D losses are based on EPA’s eGRID database for the US,and on UK Defra 2013 Guidelines for other countries. GWPs are IPCC Second Assessment Report (SAR - 100 year). Goingforward we will be evaluating data collection methods for other categories of Scope 3 emissions. For emissions from purchasedgoods and services and capital goods, corporate-wide global expense data was obtained from finance. The spend was mapped tocorresponding industry sectors and then multiplied by cradle-to-gate emission factors by sector from UK Defra’s "2012 Guidelinesto Defra / DECC's GHG Conversion Factors for Company Reporting", Annex 13. Upstream transportation and distribution includesemissions associated with inbound shipments to our facilities, shipments between our facilities, and outbound shipments from ourfacilities that we pay for. Emissions generated by waste was calculated from the landfilling of hazardous waste generated fromIFF’s total global production. It is assumed that 20% of the waste in landfilled, while the other 80% is incinerated. For emissionsfrom business travel, travel data is provided by our travel agency and includes global air and rail travel by cabin class and distancethreshold for each trip. All scope 3 emissions were calculated based on 100% primary data.
Requesting memberKAO Corporation
Scope of emissionsScope 3
Emissions in metric tonnes of CO2e5544
Uncertainty (±%)5
Major sources of emissionsGHG emissions for scope 3 include upstream emissions from purchased goods and services, capital goods, purchased fuels andelectricity, transmission and distribution losses of purchased electricity and steam, transportation and distribution, as well as frombusiness travel and the waste generated within our operations. IFF obtained verification for absolute Scope 3, Fuel- and energy-related activities (not included in Scopes 1 or 2) GHG emissions.
VerifiedNo
Allocation methodAllocation based on the market value of products purchased
Please explain how you have identified the GHG source, including major limitations to this process and assumptionsmadeEnergy sources were identified according to the global infrastructure and operational systems. Natural gas, purchased electricity,process derived fuels, and purchased steam accounted for more than 90% of our global energy consumption in 2017. These arethe main energy sources we use to heat and cool our buildings, to generate hot water and steam; and for refrigeration, processoperations and cleaning. Data is collected globally via an internet based system for capturing and calculating GHG emissions.Uncertainty could be due to human error, unit conversions, and estimation methodology. Our Scope 1, 2 and 3 data have been
CDP Page of 8964
externally verified by the ERM CVS. Our Scope 3, Fuel- and energy-related activities (not included in Scopes 1 or 2) werecalculated based on 100% primary data. The quantity of energy consumed for each energy type, such as electricity or natural gas,is used as activity data to calculate emissions. Consumption by fuel type is multiplied by emission factors for each of the threeactivities included in this category. Emission factors for upstream emissions of purchased fuels are based on life-cycle analysissoftware. Emission factors for upstream emissions of purchased electricity are based on life-cycle analysis software for the US, andon UK Defra 2013 Guidelines for other countries. Emission factors for T&D losses are based on EPA’s eGRID database for the US,and on UK Defra 2013 Guidelines for other countries. GWPs are IPCC Second Assessment Report (SAR - 100 year). Goingforward we will be evaluating data collection methods for other categories of Scope 3 emissions. For emissions from purchasedgoods and services and capital goods, corporate-wide global expense data was obtained from finance. The spend was mapped tocorresponding industry sectors and then multiplied by cradle-to-gate emission factors by sector from UK Defra’s "2012 Guidelinesto Defra / DECC's GHG Conversion Factors for Company Reporting", Annex 13. Upstream transportation and distribution includesemissions associated with inbound shipments to our facilities, shipments between our facilities, and outbound shipments from ourfacilities that we pay for. Emissions generated by waste was calculated from the landfilling of hazardous waste generated fromIFF’s total global production. It is assumed that 20% of the waste in landfilled, while the other 80% is incinerated. For emissionsfrom business travel, travel data is provided by our travel agency and includes global air and rail travel by cabin class and distancethreshold for each trip. All scope 3 emissions were calculated based on 100% primary data.
Requesting memberKellogg Company
Scope of emissionsScope 1
Emissions in metric tonnes of CO2e603
Uncertainty (±%)5
Major sources of emissionsIFF operations use energy for heating and cooling of buildings, lighting, refrigeration, generating hot water and steam, processoperations and cleaning. IFF obtained verification for absolute global Scope 1 GHG emissions.
VerifiedNo
Allocation methodAllocation based on the market value of products purchased
Please explain how you have identified the GHG source, including major limitations to this process and assumptionsmadeEnergy sources were identified according to the global infrastructure and operational systems. Natural gas, purchased electricity,process derived fuels, and purchased steam accounted for more than 90% of our global energy consumption in 2017. These arethe main energy sources we use to heat and cool our buildings, to generate hot water and steam; and for refrigeration, processoperations and cleaning. Data is collected globally via an internet based system for capturing and calculating GHG emissions.Uncertainty could be due to human error, unit conversions, and estimation methodology. Our Scope 1, 2 and 3 data have beenexternally verified by the ERM CVS. Our Scope 3, Fuel- and energy-related activities (not included in Scopes 1 or 2) werecalculated based on 100% primary data. The quantity of energy consumed for each energy type, such as electricity or natural gas,is used as activity data to calculate emissions. Consumption by fuel type is multiplied by emission factors for each of the threeactivities included in this category. Emission factors for upstream emissions of purchased fuels are based on life-cycle analysissoftware. Emission factors for upstream emissions of purchased electricity are based on life-cycle analysis software for the US, andon UK Defra 2013 Guidelines for other countries. Emission factors for T&D losses are based on EPA’s eGRID database for the US,and on UK Defra 2013 Guidelines for other countries. GWPs are IPCC Second Assessment Report (SAR - 100 year). Goingforward we will be evaluating data collection methods for other categories of Scope 3 emissions. For emissions from purchasedgoods and services and capital goods, corporate-wide global expense data was obtained from finance. The spend was mapped tocorresponding industry sectors and then multiplied by cradle-to-gate emission factors by sector from UK Defra’s "2012 Guidelinesto Defra / DECC's GHG Conversion Factors for Company Reporting", Annex 13. Upstream transportation and distribution includesemissions associated with inbound shipments to our facilities, shipments between our facilities, and outbound shipments from ourfacilities that we pay for. Emissions generated by waste was calculated from the landfilling of hazardous waste generated fromIFF’s total global production. It is assumed that 20% of the waste in landfilled, while the other 80% is incinerated. For emissionsfrom business travel, travel data is provided by our travel agency and includes global air and rail travel by cabin class and distancethreshold for each trip. All scope 3 emissions were calculated based on 100% primary data.
Requesting memberKellogg Company
CDP Page of 8965
Scope of emissionsScope 2
Emissions in metric tonnes of CO2e491
Uncertainty (±%)5
Major sources of emissionsIFF operations use energy for heating and cooling of buildings, lighting, refrigeration, generating hot water and steam, processoperations and cleaning. IFF obtained verification for absolute global Scope 2 GHG emissions.
VerifiedNo
Allocation methodAllocation based on the market value of products purchased
Please explain how you have identified the GHG source, including major limitations to this process and assumptionsmadeEnergy sources were identified according to the global infrastructure and operational systems. Natural gas, purchased electricity,process derived fuels, and purchased steam accounted for more than 90% of our global energy consumption in 2017. These arethe main energy sources we use to heat and cool our buildings, to generate hot water and steam; and for refrigeration, processoperations and cleaning. Data is collected globally via an internet based system for capturing and calculating GHG emissions.Uncertainty could be due to human error, unit conversions, and estimation methodology. Our Scope 1, 2 and 3 data have beenexternally verified by the ERM CVS. Our Scope 3, Fuel- and energy-related activities (not included in Scopes 1 or 2) werecalculated based on 100% primary data. The quantity of energy consumed for each energy type, such as electricity or natural gas,is used as activity data to calculate emissions. Consumption by fuel type is multiplied by emission factors for each of the threeactivities included in this category. Emission factors for upstream emissions of purchased fuels are based on life-cycle analysissoftware. Emission factors for upstream emissions of purchased electricity are based on life-cycle analysis software for the US, andon UK Defra 2013 Guidelines for other countries. Emission factors for T&D losses are based on EPA’s eGRID database for the US,and on UK Defra 2013 Guidelines for other countries. GWPs are IPCC Second Assessment Report (SAR - 100 year). Goingforward we will be evaluating data collection methods for other categories of Scope 3 emissions. For emissions from purchasedgoods and services and capital goods, corporate-wide global expense data was obtained from finance. The spend was mapped tocorresponding industry sectors and then multiplied by cradle-to-gate emission factors by sector from UK Defra’s "2012 Guidelinesto Defra / DECC's GHG Conversion Factors for Company Reporting", Annex 13. Upstream transportation and distribution includesemissions associated with inbound shipments to our facilities, shipments between our facilities, and outbound shipments from ourfacilities that we pay for. Emissions generated by waste was calculated from the landfilling of hazardous waste generated fromIFF’s total global production. It is assumed that 20% of the waste in landfilled, while the other 80% is incinerated. For emissionsfrom business travel, travel data is provided by our travel agency and includes global air and rail travel by cabin class and distancethreshold for each trip. All scope 3 emissions were calculated based on 100% primary data.
Requesting memberKellogg Company
Scope of emissionsScope 3
Emissions in metric tonnes of CO2e5870
Uncertainty (±%)5
Major sources of emissionsGHG emissions for scope 3 include upstream emissions from purchased goods and services, capital goods, purchased fuels andelectricity, transmission and distribution losses of purchased electricity and steam, transportation and distribution, as well as frombusiness travel and the waste generated within our operations. IFF obtained verification for absolute Scope 3, Fuel- and energy-related activities (not included in Scopes 1 or 2) GHG emissions.
VerifiedNo
Allocation methodAllocation based on the market value of products purchased
CDP Page of 8966
Please explain how you have identified the GHG source, including major limitations to this process and assumptionsmadeEnergy sources were identified according to the global infrastructure and operational systems. Natural gas, purchased electricity,process derived fuels, and purchased steam accounted for more than 90% of our global energy consumption in 2017. These arethe main energy sources we use to heat and cool our buildings, to generate hot water and steam; and for refrigeration, processoperations and cleaning. Data is collected globally via an internet based system for capturing and calculating GHG emissions.Uncertainty could be due to human error, unit conversions, and estimation methodology. Our Scope 1, 2 and 3 data have beenexternally verified by the ERM CVS. Our Scope 3, Fuel- and energy-related activities (not included in Scopes 1 or 2) werecalculated based on 100% primary data. The quantity of energy consumed for each energy type, such as electricity or natural gas,is used as activity data to calculate emissions. Consumption by fuel type is multiplied by emission factors for each of the threeactivities included in this category. Emission factors for upstream emissions of purchased fuels are based on life-cycle analysissoftware. Emission factors for upstream emissions of purchased electricity are based on life-cycle analysis software for the US, andon UK Defra 2013 Guidelines for other countries. Emission factors for T&D losses are based on EPA’s eGRID database for the US,and on UK Defra 2013 Guidelines for other countries. GWPs are IPCC Second Assessment Report (SAR - 100 year). Goingforward we will be evaluating data collection methods for other categories of Scope 3 emissions. For emissions from purchasedgoods and services and capital goods, corporate-wide global expense data was obtained from finance. The spend was mapped tocorresponding industry sectors and then multiplied by cradle-to-gate emission factors by sector from UK Defra’s "2012 Guidelinesto Defra / DECC's GHG Conversion Factors for Company Reporting", Annex 13. Upstream transportation and distribution includesemissions associated with inbound shipments to our facilities, shipments between our facilities, and outbound shipments from ourfacilities that we pay for. Emissions generated by waste was calculated from the landfilling of hazardous waste generated fromIFF’s total global production. It is assumed that 20% of the waste in landfilled, while the other 80% is incinerated. For emissionsfrom business travel, travel data is provided by our travel agency and includes global air and rail travel by cabin class and distancethreshold for each trip. All scope 3 emissions were calculated based on 100% primary data.
Requesting memberL'Oréal
Scope of emissionsScope 1
Emissions in metric tonnes of CO2e2112
Uncertainty (±%)5
Major sources of emissionsIFF operations use energy for heating and cooling of buildings, lighting, refrigeration, generating hot water and steam, processoperations and cleaning. IFF obtained verification for absolute global Scope 1 GHG emissions.
VerifiedNo
Allocation methodAllocation based on the market value of products purchased
Please explain how you have identified the GHG source, including major limitations to this process and assumptionsmadeEnergy sources were identified according to the global infrastructure and operational systems. Natural gas, purchased electricity,process derived fuels, and purchased steam accounted for more than 90% of our global energy consumption in 2017. These arethe main energy sources we use to heat and cool our buildings, to generate hot water and steam; and for refrigeration, processoperations and cleaning. Data is collected globally via an internet based system for capturing and calculating GHG emissions.Uncertainty could be due to human error, unit conversions, and estimation methodology. Our Scope 1, 2 and 3 data have beenexternally verified by the ERM CVS. Our Scope 3, Fuel- and energy-related activities (not included in Scopes 1 or 2) werecalculated based on 100% primary data. The quantity of energy consumed for each energy type, such as electricity or natural gas,is used as activity data to calculate emissions. Consumption by fuel type is multiplied by emission factors for each of the threeactivities included in this category. Emission factors for upstream emissions of purchased fuels are based on life-cycle analysissoftware. Emission factors for upstream emissions of purchased electricity are based on life-cycle analysis software for the US, andon UK Defra 2013 Guidelines for other countries. Emission factors for T&D losses are based on EPA’s eGRID database for the US,and on UK Defra 2013 Guidelines for other countries. GWPs are IPCC Second Assessment Report (SAR - 100 year). Goingforward we will be evaluating data collection methods for other categories of Scope 3 emissions. For emissions from purchasedgoods and services and capital goods, corporate-wide global expense data was obtained from finance. The spend was mapped tocorresponding industry sectors and then multiplied by cradle-to-gate emission factors by sector from UK Defra’s "2012 Guidelinesto Defra / DECC's GHG Conversion Factors for Company Reporting", Annex 13. Upstream transportation and distribution includesemissions associated with inbound shipments to our facilities, shipments between our facilities, and outbound shipments from our
CDP Page of 8967
facilities that we pay for. Emissions generated by waste was calculated from the landfilling of hazardous waste generated fromIFF’s total global production. It is assumed that 20% of the waste in landfilled, while the other 80% is incinerated. For emissionsfrom business travel, travel data is provided by our travel agency and includes global air and rail travel by cabin class and distancethreshold for each trip. All scope 3 emissions were calculated based on 100% primary data.
Requesting memberL'Oréal
Scope of emissionsScope 2
Emissions in metric tonnes of CO2e1717
Uncertainty (±%)5
Major sources of emissionsIFF operations use energy for heating and cooling of buildings, lighting, refrigeration, generating hot water and steam, processoperations and cleaning. IFF obtained verification for absolute global Scope 2 GHG emissions.
VerifiedNo
Allocation methodAllocation based on the market value of products purchased
Please explain how you have identified the GHG source, including major limitations to this process and assumptionsmadeEnergy sources were identified according to the global infrastructure and operational systems. Natural gas, purchased electricity,process derived fuels, and purchased steam accounted for more than 90% of our global energy consumption in 2017. These arethe main energy sources we use to heat and cool our buildings, to generate hot water and steam; and for refrigeration, processoperations and cleaning. Data is collected globally via an internet based system for capturing and calculating GHG emissions.Uncertainty could be due to human error, unit conversions, and estimation methodology. Our Scope 1, 2 and 3 data have beenexternally verified by the ERM CVS. Our Scope 3, Fuel- and energy-related activities (not included in Scopes 1 or 2) werecalculated based on 100% primary data. The quantity of energy consumed for each energy type, such as electricity or natural gas,is used as activity data to calculate emissions. Consumption by fuel type is multiplied by emission factors for each of the threeactivities included in this category. Emission factors for upstream emissions of purchased fuels are based on life-cycle analysissoftware. Emission factors for upstream emissions of purchased electricity are based on life-cycle analysis software for the US, andon UK Defra 2013 Guidelines for other countries. Emission factors for T&D losses are based on EPA’s eGRID database for the US,and on UK Defra 2013 Guidelines for other countries. GWPs are IPCC Second Assessment Report (SAR - 100 year). Goingforward we will be evaluating data collection methods for other categories of Scope 3 emissions. For emissions from purchasedgoods and services and capital goods, corporate-wide global expense data was obtained from finance. The spend was mapped tocorresponding industry sectors and then multiplied by cradle-to-gate emission factors by sector from UK Defra’s "2012 Guidelinesto Defra / DECC's GHG Conversion Factors for Company Reporting", Annex 13. Upstream transportation and distribution includesemissions associated with inbound shipments to our facilities, shipments between our facilities, and outbound shipments from ourfacilities that we pay for. Emissions generated by waste was calculated from the landfilling of hazardous waste generated fromIFF’s total global production. It is assumed that 20% of the waste in landfilled, while the other 80% is incinerated. For emissionsfrom business travel, travel data is provided by our travel agency and includes global air and rail travel by cabin class and distancethreshold for each trip. All scope 3 emissions were calculated based on 100% primary data.
Requesting memberL'Oréal
Scope of emissionsScope 3
Emissions in metric tonnes of CO2e20546
Uncertainty (±%)5
Major sources of emissionsGHG emissions for scope 3 include upstream emissions from purchased goods and services, capital goods, purchased fuels andelectricity, transmission and distribution losses of purchased electricity and steam, transportation and distribution, as well as frombusiness travel and the waste generated within our operations. IFF obtained verification for absolute Scope 3, Fuel- and energy-
CDP Page of 8968
related activities (not included in Scopes 1 or 2) GHG emissions.
VerifiedNo
Allocation methodAllocation based on the market value of products purchased
Please explain how you have identified the GHG source, including major limitations to this process and assumptionsmadeEnergy sources were identified according to the global infrastructure and operational systems. Natural gas, purchased electricity,process derived fuels, and purchased steam accounted for more than 90% of our global energy consumption in 2017. These arethe main energy sources we use to heat and cool our buildings, to generate hot water and steam; and for refrigeration, processoperations and cleaning. Data is collected globally via an internet based system for capturing and calculating GHG emissions.Uncertainty could be due to human error, unit conversions, and estimation methodology. Our Scope 1, 2 and 3 data have beenexternally verified by the ERM CVS. Our Scope 3, Fuel- and energy-related activities (not included in Scopes 1 or 2) werecalculated based on 100% primary data. The quantity of energy consumed for each energy type, such as electricity or natural gas,is used as activity data to calculate emissions. Consumption by fuel type is multiplied by emission factors for each of the threeactivities included in this category. Emission factors for upstream emissions of purchased fuels are based on life-cycle analysissoftware. Emission factors for upstream emissions of purchased electricity are based on life-cycle analysis software for the US, andon UK Defra 2013 Guidelines for other countries. Emission factors for T&D losses are based on EPA’s eGRID database for the US,and on UK Defra 2013 Guidelines for other countries. GWPs are IPCC Second Assessment Report (SAR - 100 year). Goingforward we will be evaluating data collection methods for other categories of Scope 3 emissions. For emissions from purchasedgoods and services and capital goods, corporate-wide global expense data was obtained from finance. The spend was mapped tocorresponding industry sectors and then multiplied by cradle-to-gate emission factors by sector from UK Defra’s "2012 Guidelinesto Defra / DECC's GHG Conversion Factors for Company Reporting", Annex 13. Upstream transportation and distribution includesemissions associated with inbound shipments to our facilities, shipments between our facilities, and outbound shipments from ourfacilities that we pay for. Emissions generated by waste was calculated from the landfilling of hazardous waste generated fromIFF’s total global production. It is assumed that 20% of the waste in landfilled, while the other 80% is incinerated. For emissionsfrom business travel, travel data is provided by our travel agency and includes global air and rail travel by cabin class and distancethreshold for each trip. All scope 3 emissions were calculated based on 100% primary data.
Requesting memberPepsiCo, Inc.
Scope of emissionsScope 1
Emissions in metric tonnes of CO2e6638
Uncertainty (±%)5
Major sources of emissionsIFF operations use energy for heating and cooling of buildings, lighting, refrigeration, generating hot water and steam, processoperations and cleaning. IFF obtained verification for absolute global Scope 1 GHG emissions.
VerifiedNo
Allocation methodAllocation based on the market value of products purchased
Please explain how you have identified the GHG source, including major limitations to this process and assumptionsmadeEnergy sources were identified according to the global infrastructure and operational systems. Natural gas, purchased electricity,process derived fuels, and purchased steam accounted for more than 90% of our global energy consumption in 2017. These arethe main energy sources we use to heat and cool our buildings, to generate hot water and steam; and for refrigeration, processoperations and cleaning. Data is collected globally via an internet based system for capturing and calculating GHG emissions.Uncertainty could be due to human error, unit conversions, and estimation methodology. Our Scope 1, 2 and 3 data have beenexternally verified by the ERM CVS. Our Scope 3, Fuel- and energy-related activities (not included in Scopes 1 or 2) werecalculated based on 100% primary data. The quantity of energy consumed for each energy type, such as electricity or natural gas,is used as activity data to calculate emissions. Consumption by fuel type is multiplied by emission factors for each of the threeactivities included in this category. Emission factors for upstream emissions of purchased fuels are based on life-cycle analysissoftware. Emission factors for upstream emissions of purchased electricity are based on life-cycle analysis software for the US, and
CDP Page of 8969
on UK Defra 2013 Guidelines for other countries. Emission factors for T&D losses are based on EPA’s eGRID database for the US,and on UK Defra 2013 Guidelines for other countries. GWPs are IPCC Second Assessment Report (SAR - 100 year). Goingforward we will be evaluating data collection methods for other categories of Scope 3 emissions. For emissions from purchasedgoods and services and capital goods, corporate-wide global expense data was obtained from finance. The spend was mapped tocorresponding industry sectors and then multiplied by cradle-to-gate emission factors by sector from UK Defra’s "2012 Guidelinesto Defra / DECC's GHG Conversion Factors for Company Reporting", Annex 13. Upstream transportation and distribution includesemissions associated with inbound shipments to our facilities, shipments between our facilities, and outbound shipments from ourfacilities that we pay for. Emissions generated by waste was calculated from the landfilling of hazardous waste generated fromIFF’s total global production. It is assumed that 20% of the waste in landfilled, while the other 80% is incinerated. For emissionsfrom business travel, travel data is provided by our travel agency and includes global air and rail travel by cabin class and distancethreshold for each trip. All scope 3 emissions were calculated based on 100% primary data.
Requesting memberPepsiCo, Inc.
Scope of emissionsScope 2
Emissions in metric tonnes of CO2e5397
Uncertainty (±%)5
Major sources of emissionsIFF operations use energy for heating and cooling of buildings, lighting, refrigeration, generating hot water and steam, processoperations and cleaning. IFF obtained verification for absolute global Scope 2 GHG emissions.
VerifiedNo
Allocation methodAllocation based on the market value of products purchased
Please explain how you have identified the GHG source, including major limitations to this process and assumptionsmadeEnergy sources were identified according to the global infrastructure and operational systems. Natural gas, purchased electricity,process derived fuels, and purchased steam accounted for more than 90% of our global energy consumption in 2017. These arethe main energy sources we use to heat and cool our buildings, to generate hot water and steam; and for refrigeration, processoperations and cleaning. Data is collected globally via an internet based system for capturing and calculating GHG emissions.Uncertainty could be due to human error, unit conversions, and estimation methodology. Our Scope 1, 2 and 3 data have beenexternally verified by the ERM CVS. Our Scope 3, Fuel- and energy-related activities (not included in Scopes 1 or 2) werecalculated based on 100% primary data. The quantity of energy consumed for each energy type, such as electricity or natural gas,is used as activity data to calculate emissions. Consumption by fuel type is multiplied by emission factors for each of the threeactivities included in this category. Emission factors for upstream emissions of purchased fuels are based on life-cycle analysissoftware. Emission factors for upstream emissions of purchased electricity are based on life-cycle analysis software for the US, andon UK Defra 2013 Guidelines for other countries. Emission factors for T&D losses are based on EPA’s eGRID database for the US,and on UK Defra 2013 Guidelines for other countries. GWPs are IPCC Second Assessment Report (SAR - 100 year). Goingforward we will be evaluating data collection methods for other categories of Scope 3 emissions. For emissions from purchasedgoods and services and capital goods, corporate-wide global expense data was obtained from finance. The spend was mapped tocorresponding industry sectors and then multiplied by cradle-to-gate emission factors by sector from UK Defra’s "2012 Guidelinesto Defra / DECC's GHG Conversion Factors for Company Reporting", Annex 13. Upstream transportation and distribution includesemissions associated with inbound shipments to our facilities, shipments between our facilities, and outbound shipments from ourfacilities that we pay for. Emissions generated by waste was calculated from the landfilling of hazardous waste generated fromIFF’s total global production. It is assumed that 20% of the waste in landfilled, while the other 80% is incinerated. For emissionsfrom business travel, travel data is provided by our travel agency and includes global air and rail travel by cabin class and distancethreshold for each trip. All scope 3 emissions were calculated based on 100% primary data.
Requesting memberPepsiCo, Inc.
Scope of emissionsScope 3
Emissions in metric tonnes of CO2e64574
CDP Page of 8970
Uncertainty (±%)5
Major sources of emissionsGHG emissions for scope 3 include upstream emissions from purchased goods and services, capital goods, purchased fuels andelectricity, transmission and distribution losses of purchased electricity and steam, transportation and distribution, as well as frombusiness travel and the waste generated within our operations. IFF obtained verification for absolute Scope 3, Fuel- and energy-related activities (not included in Scopes 1 or 2) GHG emissions.
VerifiedNo
Allocation methodAllocation based on the market value of products purchased
Please explain how you have identified the GHG source, including major limitations to this process and assumptionsmadeEnergy sources were identified according to the global infrastructure and operational systems. Natural gas, purchased electricity,process derived fuels, and purchased steam accounted for more than 90% of our global energy consumption in 2017. These arethe main energy sources we use to heat and cool our buildings, to generate hot water and steam; and for refrigeration, processoperations and cleaning. Data is collected globally via an internet based system for capturing and calculating GHG emissions.Uncertainty could be due to human error, unit conversions, and estimation methodology. Our Scope 1, 2 and 3 data have beenexternally verified by the ERM CVS. Our Scope 3, Fuel- and energy-related activities (not included in Scopes 1 or 2) werecalculated based on 100% primary data. The quantity of energy consumed for each energy type, such as electricity or natural gas,is used as activity data to calculate emissions. Consumption by fuel type is multiplied by emission factors for each of the threeactivities included in this category. Emission factors for upstream emissions of purchased fuels are based on life-cycle analysissoftware. Emission factors for upstream emissions of purchased electricity are based on life-cycle analysis software for the US, andon UK Defra 2013 Guidelines for other countries. Emission factors for T&D losses are based on EPA’s eGRID database for the US,and on UK Defra 2013 Guidelines for other countries. GWPs are IPCC Second Assessment Report (SAR - 100 year). Goingforward we will be evaluating data collection methods for other categories of Scope 3 emissions. For emissions from purchasedgoods and services and capital goods, corporate-wide global expense data was obtained from finance. The spend was mapped tocorresponding industry sectors and then multiplied by cradle-to-gate emission factors by sector from UK Defra’s "2012 Guidelinesto Defra / DECC's GHG Conversion Factors for Company Reporting", Annex 13. Upstream transportation and distribution includesemissions associated with inbound shipments to our facilities, shipments between our facilities, and outbound shipments from ourfacilities that we pay for. Emissions generated by waste was calculated from the landfilling of hazardous waste generated fromIFF’s total global production. It is assumed that 20% of the waste in landfilled, while the other 80% is incinerated. For emissionsfrom business travel, travel data is provided by our travel agency and includes global air and rail travel by cabin class and distancethreshold for each trip. All scope 3 emissions were calculated based on 100% primary data.
Requesting memberS.C. Johnson & Son, Inc.
Scope of emissionsScope 1
Emissions in metric tonnes of CO2e235
Uncertainty (±%)5
Major sources of emissionsIFF operations use energy for heating and cooling of buildings, lighting, refrigeration, generating hot water and steam, processoperations and cleaning. IFF obtained verification for absolute global Scope 1 GHG emissions.
VerifiedNo
Allocation methodAllocation based on the market value of products purchased
Please explain how you have identified the GHG source, including major limitations to this process and assumptionsmadeEnergy sources were identified according to the global infrastructure and operational systems. Natural gas, purchased electricity,process derived fuels, and purchased steam accounted for more than 90% of our global energy consumption in 2017. These arethe main energy sources we use to heat and cool our buildings, to generate hot water and steam; and for refrigeration, processoperations and cleaning. Data is collected globally via an internet based system for capturing and calculating GHG emissions.
CDP Page of 8971
Uncertainty could be due to human error, unit conversions, and estimation methodology. Our Scope 1, 2 and 3 data have beenexternally verified by the ERM CVS. Our Scope 3, Fuel- and energy-related activities (not included in Scopes 1 or 2) werecalculated based on 100% primary data. The quantity of energy consumed for each energy type, such as electricity or natural gas,is used as activity data to calculate emissions. Consumption by fuel type is multiplied by emission factors for each of the threeactivities included in this category. Emission factors for upstream emissions of purchased fuels are based on life-cycle analysissoftware. Emission factors for upstream emissions of purchased electricity are based on life-cycle analysis software for the US, andon UK Defra 2013 Guidelines for other countries. Emission factors for T&D losses are based on EPA’s eGRID database for the US,and on UK Defra 2013 Guidelines for other countries. GWPs are IPCC Second Assessment Report (SAR - 100 year). Goingforward we will be evaluating data collection methods for other categories of Scope 3 emissions. For emissions from purchasedgoods and services and capital goods, corporate-wide global expense data was obtained from finance. The spend was mapped tocorresponding industry sectors and then multiplied by cradle-to-gate emission factors by sector from UK Defra’s "2012 Guidelinesto Defra / DECC's GHG Conversion Factors for Company Reporting", Annex 13. Upstream transportation and distribution includesemissions associated with inbound shipments to our facilities, shipments between our facilities, and outbound shipments from ourfacilities that we pay for. Emissions generated by waste was calculated from the landfilling of hazardous waste generated fromIFF’s total global production. It is assumed that 20% of the waste in landfilled, while the other 80% is incinerated. For emissionsfrom business travel, travel data is provided by our travel agency and includes global air and rail travel by cabin class and distancethreshold for each trip. All scope 3 emissions were calculated based on 100% primary data.
Requesting memberS.C. Johnson & Son, Inc.
Scope of emissionsScope 2
Emissions in metric tonnes of CO2e191
Uncertainty (±%)5
Major sources of emissionsIFF operations use energy for heating and cooling of buildings, lighting, refrigeration, generating hot water and steam, processoperations and cleaning. IFF obtained verification for absolute global Scope 2 GHG emissions.
VerifiedNo
Allocation methodAllocation based on the market value of products purchased
Please explain how you have identified the GHG source, including major limitations to this process and assumptionsmadeEnergy sources were identified according to the global infrastructure and operational systems. Natural gas, purchased electricity,process derived fuels, and purchased steam accounted for more than 90% of our global energy consumption in 2017. These arethe main energy sources we use to heat and cool our buildings, to generate hot water and steam; and for refrigeration, processoperations and cleaning. Data is collected globally via an internet based system for capturing and calculating GHG emissions.Uncertainty could be due to human error, unit conversions, and estimation methodology. Our Scope 1, 2 and 3 data have beenexternally verified by the ERM CVS. Our Scope 3, Fuel- and energy-related activities (not included in Scopes 1 or 2) werecalculated based on 100% primary data. The quantity of energy consumed for each energy type, such as electricity or natural gas,is used as activity data to calculate emissions. Consumption by fuel type is multiplied by emission factors for each of the threeactivities included in this category. Emission factors for upstream emissions of purchased fuels are based on life-cycle analysissoftware. Emission factors for upstream emissions of purchased electricity are based on life-cycle analysis software for the US, andon UK Defra 2013 Guidelines for other countries. Emission factors for T&D losses are based on EPA’s eGRID database for the US,and on UK Defra 2013 Guidelines for other countries. GWPs are IPCC Second Assessment Report (SAR - 100 year). Goingforward we will be evaluating data collection methods for other categories of Scope 3 emissions. For emissions from purchasedgoods and services and capital goods, corporate-wide global expense data was obtained from finance. The spend was mapped tocorresponding industry sectors and then multiplied by cradle-to-gate emission factors by sector from UK Defra’s "2012 Guidelinesto Defra / DECC's GHG Conversion Factors for Company Reporting", Annex 13. Upstream transportation and distribution includesemissions associated with inbound shipments to our facilities, shipments between our facilities, and outbound shipments from ourfacilities that we pay for. Emissions generated by waste was calculated from the landfilling of hazardous waste generated fromIFF’s total global production. It is assumed that 20% of the waste in landfilled, while the other 80% is incinerated. For emissionsfrom business travel, travel data is provided by our travel agency and includes global air and rail travel by cabin class and distancethreshold for each trip. All scope 3 emissions were calculated based on 100% primary data.
Requesting member
CDP Page of 8972
S.C. Johnson & Son, Inc.
Scope of emissionsScope 3
Emissions in metric tonnes of CO2e2283
Uncertainty (±%)5
Major sources of emissionsGHG emissions for scope 3 include upstream emissions from purchased goods and services, capital goods, purchased fuels andelectricity, transmission and distribution losses of purchased electricity and steam, transportation and distribution, as well as frombusiness travel and the waste generated within our operations. IFF obtained verification for absolute Scope 3, Fuel- and energy-related activities (not included in Scopes 1 or 2) GHG emissions.
VerifiedNo
Allocation methodAllocation based on the market value of products purchased
Please explain how you have identified the GHG source, including major limitations to this process and assumptionsmadeEnergy sources were identified according to the global infrastructure and operational systems. Natural gas, purchased electricity,process derived fuels, and purchased steam accounted for more than 90% of our global energy consumption in 2017. These arethe main energy sources we use to heat and cool our buildings, to generate hot water and steam; and for refrigeration, processoperations and cleaning. Data is collected globally via an internet based system for capturing and calculating GHG emissions.Uncertainty could be due to human error, unit conversions, and estimation methodology. Our Scope 1, 2 and 3 data have beenexternally verified by the ERM CVS. Our Scope 3, Fuel- and energy-related activities (not included in Scopes 1 or 2) werecalculated based on 100% primary data. The quantity of energy consumed for each energy type, such as electricity or natural gas,is used as activity data to calculate emissions. Consumption by fuel type is multiplied by emission factors for each of the threeactivities included in this category. Emission factors for upstream emissions of purchased fuels are based on life-cycle analysissoftware. Emission factors for upstream emissions of purchased electricity are based on life-cycle analysis software for the US, andon UK Defra 2013 Guidelines for other countries. Emission factors for T&D losses are based on EPA’s eGRID database for the US,and on UK Defra 2013 Guidelines for other countries. GWPs are IPCC Second Assessment Report (SAR - 100 year). Goingforward we will be evaluating data collection methods for other categories of Scope 3 emissions. For emissions from purchasedgoods and services and capital goods, corporate-wide global expense data was obtained from finance. The spend was mapped tocorresponding industry sectors and then multiplied by cradle-to-gate emission factors by sector from UK Defra’s "2012 Guidelinesto Defra / DECC's GHG Conversion Factors for Company Reporting", Annex 13. Upstream transportation and distribution includesemissions associated with inbound shipments to our facilities, shipments between our facilities, and outbound shipments from ourfacilities that we pay for. Emissions generated by waste was calculated from the landfilling of hazardous waste generated fromIFF’s total global production. It is assumed that 20% of the waste in landfilled, while the other 80% is incinerated. For emissionsfrom business travel, travel data is provided by our travel agency and includes global air and rail travel by cabin class and distancethreshold for each trip. All scope 3 emissions were calculated based on 100% primary data.
Requesting memberUnilever plc
Scope of emissionsScope 1
Emissions in metric tonnes of CO2e12036
Uncertainty (±%)5
Major sources of emissionsIFF operations use energy for heating and cooling of buildings, lighting, refrigeration, generating hot water and steam, processoperations and cleaning. IFF obtained verification for absolute global Scope 1 GHG emissions.
VerifiedNo
Allocation methodAllocation based on the market value of products purchased
CDP Page of 8973
Please explain how you have identified the GHG source, including major limitations to this process and assumptionsmadeEnergy sources were identified according to the global infrastructure and operational systems. Natural gas, purchased electricity,process derived fuels, and purchased steam accounted for more than 90% of our global energy consumption in 2017. These arethe main energy sources we use to heat and cool our buildings, to generate hot water and steam; and for refrigeration, processoperations and cleaning. Data is collected globally via an internet based system for capturing and calculating GHG emissions.Uncertainty could be due to human error, unit conversions, and estimation methodology. Our Scope 1, 2 and 3 data have beenexternally verified by the ERM CVS. Our Scope 3, Fuel- and energy-related activities (not included in Scopes 1 or 2) werecalculated based on 100% primary data. The quantity of energy consumed for each energy type, such as electricity or natural gas,is used as activity data to calculate emissions. Consumption by fuel type is multiplied by emission factors for each of the threeactivities included in this category. Emission factors for upstream emissions of purchased fuels are based on life-cycle analysissoftware. Emission factors for upstream emissions of purchased electricity are based on life-cycle analysis software for the US, andon UK Defra 2013 Guidelines for other countries. Emission factors for T&D losses are based on EPA’s eGRID database for the US,and on UK Defra 2013 Guidelines for other countries. GWPs are IPCC Second Assessment Report (SAR - 100 year). Goingforward we will be evaluating data collection methods for other categories of Scope 3 emissions. For emissions from purchasedgoods and services and capital goods, corporate-wide global expense data was obtained from finance. The spend was mapped tocorresponding industry sectors and then multiplied by cradle-to-gate emission factors by sector from UK Defra’s "2012 Guidelinesto Defra / DECC's GHG Conversion Factors for Company Reporting", Annex 13. Upstream transportation and distribution includesemissions associated with inbound shipments to our facilities, shipments between our facilities, and outbound shipments from ourfacilities that we pay for. Emissions generated by waste was calculated from the landfilling of hazardous waste generated fromIFF’s total global production. It is assumed that 20% of the waste in landfilled, while the other 80% is incinerated. For emissionsfrom business travel, travel data is provided by our travel agency and includes global air and rail travel by cabin class and distancethreshold for each trip. All scope 3 emissions were calculated based on 100% primary data.
Requesting memberUnilever plc
Scope of emissionsScope 2
Emissions in metric tonnes of CO2e9785
Uncertainty (±%)5
Major sources of emissionsIFF operations use energy for heating and cooling of buildings, lighting, refrigeration, generating hot water and steam, processoperations and cleaning. IFF obtained verification for absolute global Scope 2 GHG emissions.
VerifiedNo
Allocation methodAllocation based on the market value of products purchased
Please explain how you have identified the GHG source, including major limitations to this process and assumptionsmadeEnergy sources were identified according to the global infrastructure and operational systems. Natural gas, purchased electricity,process derived fuels, and purchased steam accounted for more than 90% of our global energy consumption in 2017. These arethe main energy sources we use to heat and cool our buildings, to generate hot water and steam; and for refrigeration, processoperations and cleaning. Data is collected globally via an internet based system for capturing and calculating GHG emissions.Uncertainty could be due to human error, unit conversions, and estimation methodology. Our Scope 1, 2 and 3 data have beenexternally verified by the ERM CVS. Our Scope 3, Fuel- and energy-related activities (not included in Scopes 1 or 2) werecalculated based on 100% primary data. The quantity of energy consumed for each energy type, such as electricity or natural gas,is used as activity data to calculate emissions. Consumption by fuel type is multiplied by emission factors for each of the threeactivities included in this category. Emission factors for upstream emissions of purchased fuels are based on life-cycle analysissoftware. Emission factors for upstream emissions of purchased electricity are based on life-cycle analysis software for the US, andon UK Defra 2013 Guidelines for other countries. Emission factors for T&D losses are based on EPA’s eGRID database for the US,and on UK Defra 2013 Guidelines for other countries. GWPs are IPCC Second Assessment Report (SAR - 100 year). Goingforward we will be evaluating data collection methods for other categories of Scope 3 emissions. For emissions from purchasedgoods and services and capital goods, corporate-wide global expense data was obtained from finance. The spend was mapped tocorresponding industry sectors and then multiplied by cradle-to-gate emission factors by sector from UK Defra’s "2012 Guidelinesto Defra / DECC's GHG Conversion Factors for Company Reporting", Annex 13. Upstream transportation and distribution includesemissions associated with inbound shipments to our facilities, shipments between our facilities, and outbound shipments from our
CDP Page of 8974
facilities that we pay for. Emissions generated by waste was calculated from the landfilling of hazardous waste generated fromIFF’s total global production. It is assumed that 20% of the waste in landfilled, while the other 80% is incinerated. For emissionsfrom business travel, travel data is provided by our travel agency and includes global air and rail travel by cabin class and distancethreshold for each trip. All scope 3 emissions were calculated based on 100% primary data.
Requesting memberUnilever plc
Scope of emissionsScope 3
Emissions in metric tonnes of CO2e11701
Uncertainty (±%)5
Major sources of emissionsGHG emissions for scope 3 include upstream emissions from purchased goods and services, capital goods, purchased fuels andelectricity, transmission and distribution losses of purchased electricity and steam, transportation and distribution, as well as frombusiness travel and the waste generated within our operations. IFF obtained verification for absolute Scope 3, Fuel- and energy-related activities (not included in Scopes 1 or 2) GHG emissions.
VerifiedNo
Allocation methodAllocation based on the market value of products purchased
Please explain how you have identified the GHG source, including major limitations to this process and assumptionsmadeEnergy sources were identified according to the global infrastructure and operational systems. Natural gas, purchased electricity,process derived fuels, and purchased steam accounted for more than 90% of our global energy consumption in 2017. These arethe main energy sources we use to heat and cool our buildings, to generate hot water and steam; and for refrigeration, processoperations and cleaning. Data is collected globally via an internet based system for capturing and calculating GHG emissions.Uncertainty could be due to human error, unit conversions, and estimation methodology. Our Scope 1, 2 and 3 data have beenexternally verified by the ERM CVS. Our Scope 3, Fuel- and energy-related activities (not included in Scopes 1 or 2) werecalculated based on 100% primary data. The quantity of energy consumed for each energy type, such as electricity or natural gas,is used as activity data to calculate emissions. Consumption by fuel type is multiplied by emission factors for each of the threeactivities included in this category. Emission factors for upstream emissions of purchased fuels are based on life-cycle analysissoftware. Emission factors for upstream emissions of purchased electricity are based on life-cycle analysis software for the US, andon UK Defra 2013 Guidelines for other countries. Emission factors for T&D losses are based on EPA’s eGRID database for the US,and on UK Defra 2013 Guidelines for other countries. GWPs are IPCC Second Assessment Report (SAR - 100 year). Goingforward we will be evaluating data collection methods for other categories of Scope 3 emissions. For emissions from purchasedgoods and services and capital goods, corporate-wide global expense data was obtained from finance. The spend was mapped tocorresponding industry sectors and then multiplied by cradle-to-gate emission factors by sector from UK Defra’s "2012 Guidelinesto Defra / DECC's GHG Conversion Factors for Company Reporting", Annex 13. Upstream transportation and distribution includesemissions associated with inbound shipments to our facilities, shipments between our facilities, and outbound shipments from ourfacilities that we pay for. Emissions generated by waste was calculated from the landfilling of hazardous waste generated fromIFF’s total global production. It is assumed that 20% of the waste in landfilled, while the other 80% is incinerated. For emissionsfrom business travel, travel data is provided by our travel agency and includes global air and rail travel by cabin class and distancethreshold for each trip. All scope 3 emissions were calculated based on 100% primary data.
SC1.2
(SC1.2) Where published information has been used in completing SC1.1, please provide a reference(s).
Total Global Emissions are calculated using the Greenhouse Gas Protocol. Customer emissions are allocated based on themarket value of products purchased.
CDP Page of 8975
SC1.3
(SC1.3) What are the challenges in allocating emissions to different customers, and what would help you to overcome thesechallenges?
Allocationchallenges
Please explain what would help you overcome these challenges
Diversity ofproduct linesmakesaccuratelyaccounting foreachproduct/productline costineffective
Given IFF’s global footprint, multitude of suppliers, and broad range of natural and synthetic raw materials that are sourced from around the world,providing GHG emissions data per finished product is a complex process. That said, we have allocated our global GHG emissions data to ourcustomers according to volume of products purchased and developed models to estimate GHG emissions on a per category and per productbasis. This year we also gained better insight into our Scope 3 emissions and can estimate emissions throughout the product life cycle. We haveinsight from our library of lifecycle assessments of fragrance and flavor ingredients and partnered with industry and LCA experts on productspecific initiatives. Note that the conclusion from our lifecycle assessments is that our product manufacturing processes produced the fewestcarbon emissions compared with raw materials and transport, which contributed the highest percentage emissions.
SC1.4
(SC1.4) Do you plan to develop your capabilities to allocate emissions to your customers in the future?Yes
SC1.4a
(SC1.4a) Describe how you plan to develop your capabilities.
We have made great advancements over the past few years regarding product specific data, and would be happy to share andpartner with you our customers to enhance our mutual understanding and reduce of GHG emissions throughout the product lifecycle. We welcome the opportunity to partner with our customers and share product level data throughout the lifecycle, asindicated in SM 4.
SC2.1
(SC2.1) Please propose any mutually beneficial climate-related projects you could collaborate on with specific CDP SupplyChain members.
Requesting memberAbbott Laboratories
Group type of projectRelationship sustainability assessment
Type of projectAligning goals to feed into customers targets and ambitions
Emissions targetedActions that would reduce both our own and our customers’ emissions
Estimated timeframe for carbon reductions to be realized1-3 years
Estimated lifetime CO2e savings
Estimated paybackCost/saving neutral
CDP Page of 8976
Details of proposalIFF is a leader in circular design and renewable energy. We have the largest solar field and the first and only Wind Turbine in ourindustry. We also have an in-depth view of our own footprint as well as the value chain. From renewable and Natural feedstocks tocarbon reducing products, we can partner to help you to achieve your goals. Some opportunities that we presented this year forcollaboration on climate change include products manufactured with 100 % renewable electricity, partnering on local renewableenergy projects, fully traceable and For Life certified Naturals and Renewable and / or Cradle to Cradle certified fragrances. Wewelcome the opportunity to partner with you on initiatives that will help to support and advance your sustainability goals. And welook forward to our continued partnership to promote more sustainable products throughout your supply chain. Please [email protected], VP Global Sustainability to advance these opportunities. For an in-depth overview of our capabilities seehttp://www.iff.com/sustain.
Requesting memberAmbev S.A
Group type of projectRelationship sustainability assessment
Type of projectAligning goals to feed into customers targets and ambitions
Emissions targetedActions that would reduce both our own and our customers’ emissions
Estimated timeframe for carbon reductions to be realized1-3 years
Estimated lifetime CO2e savings
Estimated paybackCost/saving neutral
Details of proposalIFF is a leader in circular design and renewable energy. We have the largest solar field and the first and only Wind Turbine in ourindustry. We also have an in-depth view of our own footprint as well as the value chain. From renewable and Natural feedstocks tocarbon reducing products, we can partner to help you to achieve your goals. Some opportunities that we presented this year forcollaboration on climate change include products manufactured with 100 % renewable electricity, partnering on local renewableenergy projects, fully traceable and For Life certified Naturals and Renewable and / or Cradle to Cradle certified fragrances. Wewelcome the opportunity to partner with you on initiatives that will help to support and advance your sustainability goals. And welook forward to our continued partnership to promote more sustainable products throughout your supply chain. Please [email protected], VP Global Sustainability to advance these opportunities. For an in-depth overview of our capabilities seehttp://www.iff.com/sustain.
Requesting memberColgate Palmolive Company
Group type of projectRelationship sustainability assessment
Type of projectAligning goals to feed into customers targets and ambitions
Emissions targetedActions that would reduce both our own and our customers’ emissions
Estimated timeframe for carbon reductions to be realized1-3 years
Estimated lifetime CO2e savings
Estimated paybackCost/saving neutral
Details of proposalIFF is a leader in circular design and renewable energy. We have the largest solar field and the first and only Wind Turbine in ourindustry. We also have an in-depth view of our own footprint as well as the value chain. From renewable and Natural feedstocks tocarbon reducing products, we can partner to help you to achieve your goals. Some opportunities that we presented this year forcollaboration on climate change include products manufactured with 100 % renewable electricity, partnering on local renewableenergy projects, fully traceable and For Life certified Naturals and Renewable and / or Cradle to Cradle certified fragrances. We
CDP Page of 8977
welcome the opportunity to partner with you on initiatives that will help to support and advance your sustainability goals. And welook forward to our continued partnership to promote more sustainable products throughout your supply chain. Please [email protected], VP Global Sustainability to advance these opportunities. For an in-depth overview of our capabilities seehttp://www.iff.com/sustain.
Requesting memberDiageo Plc
Group type of projectRelationship sustainability assessment
Type of projectAligning goals to feed into customers targets and ambitions
Emissions targetedActions that would reduce both our own and our customers’ emissions
Estimated timeframe for carbon reductions to be realized1-3 years
Estimated lifetime CO2e savings
Estimated paybackCost/saving neutral
Details of proposalIFF is a leader in circular design and renewable energy. We have the largest solar field and the first and only Wind Turbine in ourindustry. We also have an in-depth view of our own footprint as well as the value chain. From renewable and Natural feedstocks tocarbon reducing products, we can partner to help you to achieve your goals. Some opportunities that we presented this year forcollaboration on climate change include products manufactured with 100 % renewable electricity, partnering on local renewableenergy projects, fully traceable and For Life certified Naturals and Renewable and / or Cradle to Cradle certified fragrances. Wewelcome the opportunity to partner with you on initiatives that will help to support and advance your sustainability goals. And welook forward to our continued partnership to promote more sustainable products throughout your supply chain. Please [email protected], VP Global Sustainability to advance these opportunities. For an in-depth overview of our capabilities seehttp://www.iff.com/sustain.
Requesting memberKAO Corporation
Group type of projectRelationship sustainability assessment
Type of projectAligning goals to feed into customers targets and ambitions
Emissions targetedActions that would reduce both our own and our customers’ emissions
Estimated timeframe for carbon reductions to be realized1-3 years
Estimated lifetime CO2e savings
Estimated paybackCost/saving neutral
Details of proposalIFF is a leader in circular design and renewable energy. We have the largest solar field and the first and only Wind Turbine in ourindustry. We also have an in-depth view of our own footprint as well as the value chain. From renewable and Natural feedstocks tocarbon reducing products, we can partner to help you to achieve your goals. Some opportunities that we presented this year forcollaboration on climate change include products manufactured with 100 % renewable electricity, partnering on local renewableenergy projects, fully traceable and For Life certified Naturals and Renewable and / or Cradle to Cradle certified fragrances. Wewelcome the opportunity to partner with you on initiatives that will help to support and advance your sustainability goals. And welook forward to our continued partnership to promote more sustainable products throughout your supply chain. Please [email protected], VP Global Sustainability to advance these opportunities. For an in-depth overview of our capabilities seehttp://www.iff.com/sustain.
CDP Page of 8978
Requesting memberKellogg Company
Group type of projectRelationship sustainability assessment
Type of projectAligning goals to feed into customers targets and ambitions
Emissions targetedActions that would reduce both our own and our customers’ emissions
Estimated timeframe for carbon reductions to be realized1-3 years
Estimated lifetime CO2e savings
Estimated paybackCost/saving neutral
Details of proposalIFF is a leader in circular design and renewable energy. We have the largest solar field and the first and only Wind Turbine in ourindustry. We also have an in-depth view of our own footprint as well as the value chain. From renewable and Natural feedstocks tocarbon reducing products, we can partner to help you to achieve your goals. Some opportunities that we presented this year forcollaboration on climate change include products manufactured with 100 % renewable electricity, partnering on local renewableenergy projects, fully traceable and For Life certified Naturals and Renewable and / or Cradle to Cradle certified fragrances. Wewelcome the opportunity to partner with you on initiatives that will help to support and advance your sustainability goals. And welook forward to our continued partnership to promote more sustainable products throughout your supply chain. Please [email protected], VP Global Sustainability to advance these opportunities. For an in-depth overview of our capabilities seehttp://www.iff.com/sustain.
Requesting memberL'Oréal
Group type of projectRelationship sustainability assessment
Type of projectAligning goals to feed into customers targets and ambitions
Emissions targetedActions that would reduce both our own and our customers’ emissions
Estimated timeframe for carbon reductions to be realized1-3 years
Estimated lifetime CO2e savings
Estimated payback3-5 years
Details of proposalIFF is a leader in circular design and renewable energy. We have the largest solar field and the first and only Wind Turbine in ourindustry. We also have an in-depth view of our own footprint as well as the value chain. From renewable and Natural feedstocks tocarbon reducing products, we can partner to help you to achieve your goals. Some opportunities that we presented this year forcollaboration on climate change include products manufactured with 100 % renewable electricity, partnering on local renewableenergy projects, fully traceable and For Life certified Naturals and Renewable and / or Cradle to Cradle certified fragrances. Wewelcome the opportunity to partner with you on initiatives that will help to support and advance your sustainability goals. And welook forward to our continued partnership to promote more sustainable products throughout your supply chain. Please [email protected], VP Global Sustainability to advance these opportunities. For an in-depth overview of our capabilities seehttp://www.iff.com/sustain.
Requesting memberPepsiCo, Inc.
Group type of projectRelationship sustainability assessment
CDP Page of 8979
Type of projectAligning goals to feed into customers targets and ambitions
Emissions targetedActions that would reduce both our own and our customers’ emissions
Estimated timeframe for carbon reductions to be realized1-3 years
Estimated lifetime CO2e savings
Estimated paybackCost/saving neutral
Details of proposalIFF is a leader in circular design and renewable energy. We have the largest solar field and the first and only Wind Turbine in ourindustry. We also have an in-depth view of our own footprint as well as the value chain. From renewable and Natural feedstocks tocarbon reducing products, we can partner to help you to achieve your goals. Some opportunities that we presented this year forcollaboration on climate change include products manufactured with 100 % renewable electricity, partnering on local renewableenergy projects, fully traceable and For Life certified Naturals and Renewable and / or Cradle to Cradle certified fragrances. Wewelcome the opportunity to partner with you on initiatives that will help to support and advance your sustainability goals. And welook forward to our continued partnership to promote more sustainable products throughout your supply chain. Please [email protected], VP Global Sustainability to advance these opportunities. For an in-depth overview of our capabilities seehttp://www.iff.com/sustain.
Requesting memberS.C. Johnson & Son, Inc.
Group type of projectRelationship sustainability assessment
Type of projectAligning goals to feed into customers targets and ambitions
Emissions targetedActions that would reduce both our own and our customers’ emissions
Estimated timeframe for carbon reductions to be realized1-3 years
Estimated lifetime CO2e savings
Estimated paybackCost/saving neutral
Details of proposalIFF is a leader in circular design and renewable energy. We have the largest solar field and the first and only Wind Turbine in ourindustry. We also have an in-depth view of our own footprint as well as the value chain. From renewable and Natural feedstocks tocarbon reducing products, we can partner to help you to achieve your goals. Some opportunities that we presented this year forcollaboration on climate change include products manufactured with 100 % renewable electricity, partnering on local renewableenergy projects, fully traceable and For Life certified Naturals and Renewable and / or Cradle to Cradle certified fragrances. Wewelcome the opportunity to partner with you on initiatives that will help to support and advance your sustainability goals. And welook forward to our continued partnership to promote more sustainable products throughout your supply chain. Please [email protected], VP Global Sustainability to advance these opportunities. For an in-depth overview of our capabilities seehttp://www.iff.com/sustain.
Requesting memberUnilever plc
Group type of projectRelationship sustainability assessment
Type of projectAligning goals to feed into customers targets and ambitions
Emissions targetedActions that would reduce both our own and our customers’ emissions
CDP Page of 8980
Estimated timeframe for carbon reductions to be realized1-3 years
Estimated lifetime CO2e savings
Estimated paybackCost/saving neutral
Details of proposalIFF is a leader in circular design and renewable energy. We have the largest solar field and the first and only Wind Turbine in ourindustry. We also have an in-depth view of our own footprint as well as the value chain. From renewable and Natural feedstocks tocarbon reducing products, we can partner to help you to achieve your goals. Some opportunities that we presented this year forcollaboration on climate change include products manufactured with 100 % renewable electricity, partnering on local renewableenergy projects, fully traceable and For Life certified Naturals and Renewable and / or Cradle to Cradle certified fragrances. Wewelcome the opportunity to partner with you on initiatives that will help to support and advance your sustainability goals. And welook forward to our continued partnership to promote more sustainable products throughout your supply chain. Please [email protected], VP Global Sustainability to advance these opportunities. For an in-depth overview of our capabilities seehttp://www.iff.com/sustain.
SC2.2
(SC2.2) Have requests or initiatives by CDP Supply Chain members prompted your organization to take organizational-levelemissions reduction initiatives?Yes
SC2.2a
(SC2.2a) Specify the requesting member(s) that have driven organizational-level emissions reduction initiatives, and provideinformation on the initiatives.
Requesting memberAbbott Laboratories
Initiative ID2017-ID1
Group type of projectRelationship sustainability assessment
Type of projectAligning goals to feed into customers targets and ambitions
Description of the reduction initiativeOrganizational emissions reductions are being driven by our desire to be more sustainable in this area as well as by ourcommitment to being a responsible member of Abbott's supply chain. Multiple energy efficiency and renewable energy reductioninitiatives are underway specifically at the locations that provide your products. We are working towards better understanding ofspecific product level emissions reductions and can now allocate a percentage of our overall emissions reductions to your supplychain.
Emissions reduction for the reporting year in metric tons of CO2e16
Did you identify this opportunity as part of the CDP supply chain Action Exchange?No
Would you be happy for CDP supply chain members to highlight this work in their external communication?Yes
Requesting memberAmbev S.A
Initiative ID
CDP Page of 8981
2017-ID2
Group type of projectRelationship sustainability assessment
Type of projectAligning goals to feed into customers targets and ambitions
Description of the reduction initiativeOrganizational emissions reductions are being driven by our desire to be more sustainable in this area as well as by ourcommitment to being a responsible member of Ambev's supply chain. Multiple energy efficiency and renewable energy reductioninitiatives are underway specifically at the locations that provide your products. We are working towards better understanding ofspecific product level emissions reductions and can now allocate a percentage of our overall emissions reductions to your supplychain.
Emissions reduction for the reporting year in metric tons of CO2e52
Did you identify this opportunity as part of the CDP supply chain Action Exchange?No
Would you be happy for CDP supply chain members to highlight this work in their external communication?Yes
Requesting memberColgate Palmolive Company
Initiative ID2017-ID3
Group type of projectRelationship sustainability assessment
Type of projectAligning goals to feed into customers targets and ambitions
Description of the reduction initiativeOrganizational emissions reductions are being driven by our desire to be more sustainable in this area as well as by ourcommitment to being a responsible member of Colgate Palmolive’s supply chain. Multiple energy efficiency and renewable energyreduction initiatives are underway specifically at the locations that provide your products. We are working towards betterunderstanding of specific product level emissions reductions and can now allocate a percentage of our overall emissionsreductions to your supply chain.
Emissions reduction for the reporting year in metric tons of CO2e378
Did you identify this opportunity as part of the CDP supply chain Action Exchange?No
Would you be happy for CDP supply chain members to highlight this work in their external communication?Yes
Requesting memberDiageo Plc
Initiative ID2017-ID4
Group type of projectRelationship sustainability assessment
Type of projectAligning goals to feed into customers targets and ambitions
Description of the reduction initiativeOrganizational emissions reductions are being driven by our desire to be more sustainable in this area as well as by ourcommitment to being a responsible member of Diageo’s supply chain. Multiple energy efficiency and renewable energy reductioninitiatives are underway specifically at the locations that provide your products. We are working towards better understanding ofspecific product level emissions reductions and can now allocate a percentage of our overall emissions reductions to your supply
CDP Page of 8982

chain.
Emissions reduction for the reporting year in metric tons of CO2e52
Did you identify this opportunity as part of the CDP supply chain Action Exchange?No
Would you be happy for CDP supply chain members to highlight this work in their external communication?Yes
Requesting memberKAO Corporation
Initiative ID2017-ID5
Group type of projectRelationship sustainability assessment
Type of projectAligning goals to feed into customers targets and ambitions
Description of the reduction initiativeOrganizational emissions reductions are being driven by our desire to be more sustainable in this area as well as by ourcommitment to being a responsible member of Kao’s supply chain. Multiple energy efficiency and renewable energy reductioninitiatives are underway specifically at the locations that provide your products. We are working towards better understanding ofspecific product level emissions reductions and can now allocate a percentage of our overall emissions reductions to your supplychain.
Emissions reduction for the reporting year in metric tons of CO2e68
Did you identify this opportunity as part of the CDP supply chain Action Exchange?No
Would you be happy for CDP supply chain members to highlight this work in their external communication?Yes
Requesting memberKellogg Company
Initiative ID2017-ID6
Group type of projectRelationship sustainability assessment
Type of projectAligning goals to feed into customers targets and ambitions
Description of the reduction initiativeOrganizational emissions reductions are being driven by our desire to be more sustainable in this area as well as by ourcommitment to being a responsible member of Kellogg's supply chain. Multiple energy efficiency and renewable energy reductioninitiatives are underway specifically at the locations that provide your products. We are working towards better understanding ofspecific product level emissions reductions and can now allocate a percentage of our overall emissions reductions to your supplychain.
Emissions reduction for the reporting year in metric tons of CO2e72
Did you identify this opportunity as part of the CDP supply chain Action Exchange?No
Would you be happy for CDP supply chain members to highlight this work in their external communication?Yes
Requesting member
CDP Page of 8983
L'Oréal
Initiative ID2017-ID7
Group type of projectRelationship sustainability assessment
Type of projectAligning goals to feed into customers targets and ambitions
Description of the reduction initiativeOrganizational emissions reductions are being driven by our desire to be more sustainable in this area as well as by ourcommitment to being a responsible member of L’Oreals supply chain. Multiple energy efficiency and renewable energy reductioninitiatives are underway specifically at the locations that provide your products. We are working towards better understanding ofspecific product level emissions reductions and can now allocate a percentage of our overall emissions reductions to your supplychain.
Emissions reduction for the reporting year in metric tons of CO2e253
Did you identify this opportunity as part of the CDP supply chain Action Exchange?No
Would you be happy for CDP supply chain members to highlight this work in their external communication?Yes
Requesting memberPepsiCo, Inc.
Initiative ID2017-ID8
Group type of projectRelationship sustainability assessment
Type of projectAligning goals to feed into customers targets and ambitions
Description of the reduction initiativeOrganizational emissions reductions are being driven by our desire to be more sustainable in this area as well as by ourcommitment to being a responsible member of PepsiCo’s supply chain. Multiple energy efficiency and renewable energy reductioninitiatives are underway specifically at the locations that provide your products. We are working towards better understanding ofspecific product level emissions reductions and can now allocate a percentage of our overall emissions reductions to your supplychain.
Emissions reduction for the reporting year in metric tons of CO2e795
Did you identify this opportunity as part of the CDP supply chain Action Exchange?No
Would you be happy for CDP supply chain members to highlight this work in their external communication?Yes
Requesting memberS.C. Johnson & Son, Inc.
Initiative ID2017-ID9
Group type of projectRelationship sustainability assessment
Type of projectAligning goals to feed into customers targets and ambitions
Description of the reduction initiativeOrganizational emissions reductions are being driven by our desire to be more sustainable in this area as well as by our
CDP Page of 8984
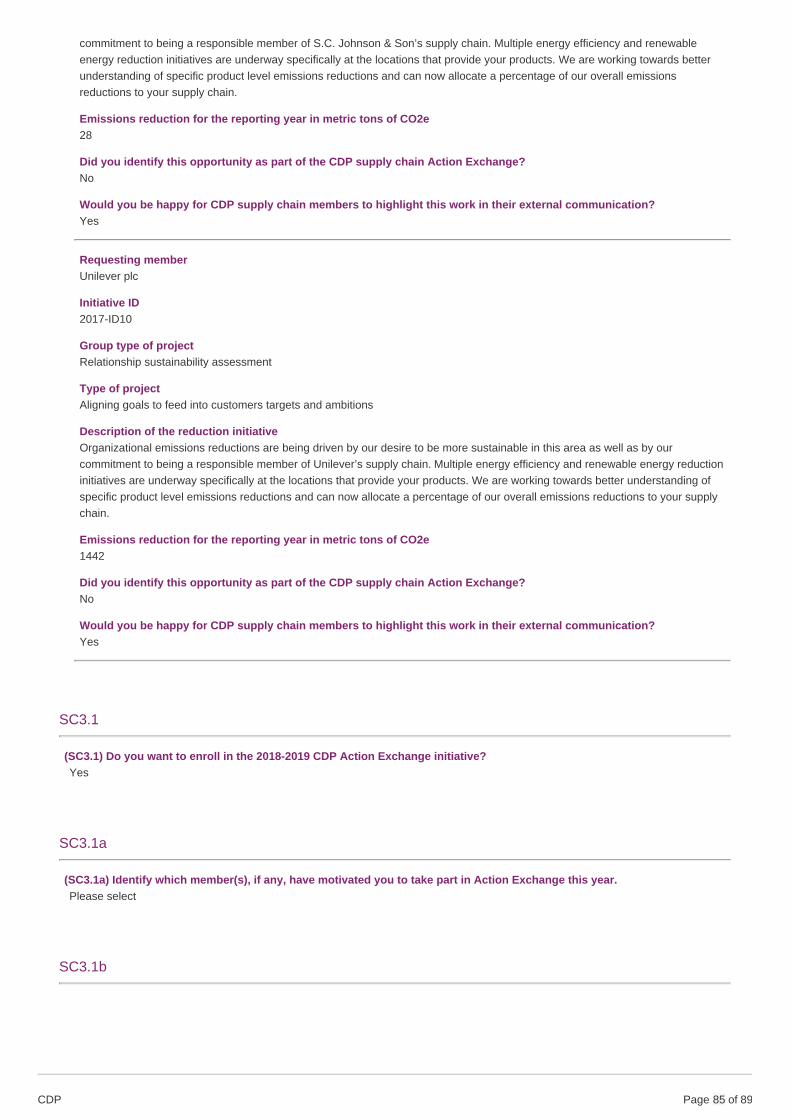
commitment to being a responsible member of S.C. Johnson & Son’s supply chain. Multiple energy efficiency and renewableenergy reduction initiatives are underway specifically at the locations that provide your products. We are working towards betterunderstanding of specific product level emissions reductions and can now allocate a percentage of our overall emissionsreductions to your supply chain.
Emissions reduction for the reporting year in metric tons of CO2e28
Did you identify this opportunity as part of the CDP supply chain Action Exchange?No
Would you be happy for CDP supply chain members to highlight this work in their external communication?Yes
Requesting memberUnilever plc
Initiative ID2017-ID10
Group type of projectRelationship sustainability assessment
Type of projectAligning goals to feed into customers targets and ambitions
Description of the reduction initiativeOrganizational emissions reductions are being driven by our desire to be more sustainable in this area as well as by ourcommitment to being a responsible member of Unilever’s supply chain. Multiple energy efficiency and renewable energy reductioninitiatives are underway specifically at the locations that provide your products. We are working towards better understanding ofspecific product level emissions reductions and can now allocate a percentage of our overall emissions reductions to your supplychain.
Emissions reduction for the reporting year in metric tons of CO2e1442
Did you identify this opportunity as part of the CDP supply chain Action Exchange?No
Would you be happy for CDP supply chain members to highlight this work in their external communication?Yes
SC3.1
(SC3.1) Do you want to enroll in the 2018-2019 CDP Action Exchange initiative?Yes
SC3.1a
(SC3.1a) Identify which member(s), if any, have motivated you to take part in Action Exchange this year.Please select
SC3.1b
CDP Page of 8985
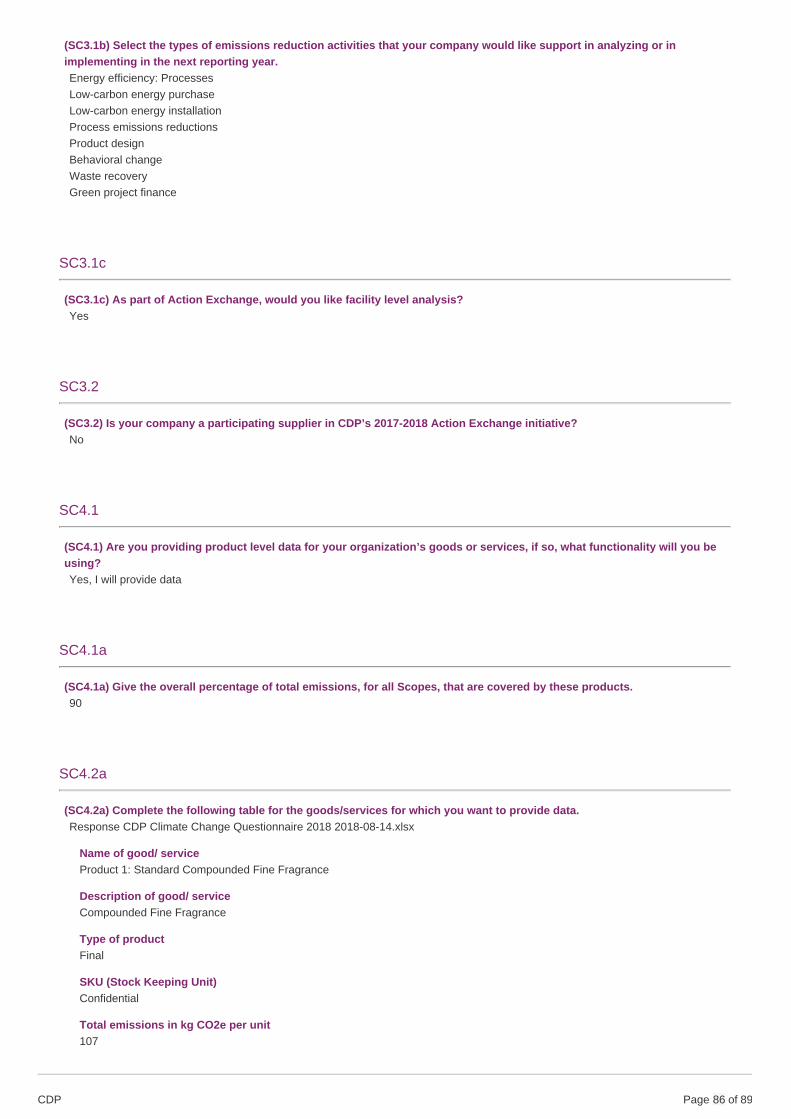
(SC3.1b) Select the types of emissions reduction activities that your company would like support in analyzing or inimplementing in the next reporting year.Energy efficiency: ProcessesLow-carbon energy purchaseLow-carbon energy installationProcess emissions reductionsProduct designBehavioral changeWaste recoveryGreen project finance
SC3.1c
(SC3.1c) As part of Action Exchange, would you like facility level analysis?Yes
SC3.2
(SC3.2) Is your company a participating supplier in CDP’s 2017-2018 Action Exchange initiative?No
SC4.1
(SC4.1) Are you providing product level data for your organization’s goods or services, if so, what functionality will you beusing?Yes, I will provide data
SC4.1a
(SC4.1a) Give the overall percentage of total emissions, for all Scopes, that are covered by these products.90
SC4.2a
(SC4.2a) Complete the following table for the goods/services for which you want to provide data.Response CDP Climate Change Questionnaire 2018 2018-08-14.xlsx
Name of good/ serviceProduct 1: Standard Compounded Fine Fragrance
Description of good/ serviceCompounded Fine Fragrance
Type of productFinal
SKU (Stock Keeping Unit)Confidential
Total emissions in kg CO2e per unit107
CDP Page of 8986
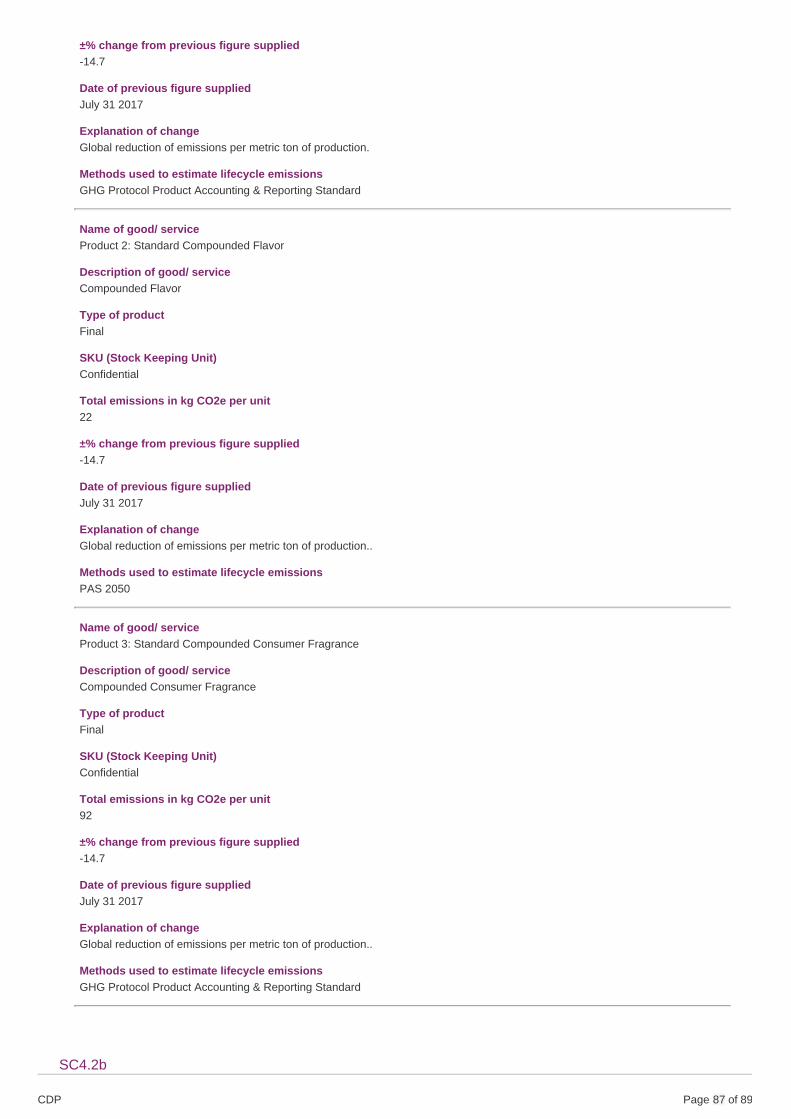
±% change from previous figure supplied-14.7
Date of previous figure suppliedJuly 31 2017
Explanation of changeGlobal reduction of emissions per metric ton of production.
Methods used to estimate lifecycle emissionsGHG Protocol Product Accounting & Reporting Standard
Name of good/ serviceProduct 2: Standard Compounded Flavor
Description of good/ serviceCompounded Flavor
Type of productFinal
SKU (Stock Keeping Unit)Confidential
Total emissions in kg CO2e per unit22
±% change from previous figure supplied-14.7
Date of previous figure suppliedJuly 31 2017
Explanation of changeGlobal reduction of emissions per metric ton of production..
Methods used to estimate lifecycle emissionsPAS 2050
Name of good/ serviceProduct 3: Standard Compounded Consumer Fragrance
Description of good/ serviceCompounded Consumer Fragrance
Type of productFinal
SKU (Stock Keeping Unit)Confidential
Total emissions in kg CO2e per unit92
±% change from previous figure supplied-14.7
Date of previous figure suppliedJuly 31 2017
Explanation of changeGlobal reduction of emissions per metric ton of production..
Methods used to estimate lifecycle emissionsGHG Protocol Product Accounting & Reporting Standard
SC4.2b
CDP Page of 8987

(SC4.2b) Complete the following table with data for lifecycle stages of your goods and/or services.
Name of good/ serviceProduct 1: Standard Compounded Fragrance
Please select the scopeScope 1 & 2
Please select the lifecycle stageProduction
Emissions at the lifecycle stage in kg CO2e per unit107
Is this stage under your ownership or control?Yes
Type of data usedPrimary and secondary
Data qualityPrimary data used include natural gas combustion and electricity production. Because readings are obtained from monthly bills and"revenue meters," which are typically subject to stringent calibration requirements by local governments, uncertainty level fornatural gas quantities and GHG emissions can be assumed as <5%. Emissions reported as per metric ton of production.
If you are verifying/assuring this product emission data, please tell us howIt hasn’t been verified at the product level yet, but we are taking steps toward it.
Name of good/ serviceProduct 2: Standard Compounded Flavor
Please select the scopeScope 1 & 2
Please select the lifecycle stageProduction
Emissions at the lifecycle stage in kg CO2e per unit22
Is this stage under your ownership or control?Yes
Type of data usedPrimary and secondary
Data qualityThe PAS 2050 guide states that the product carbon footprint can only be regarded as an estimate. Inevitably, there will beinaccuracies in standard emission factors used, data collected, knowledge gaps filled by assumptions and global warmingpotentials used. The uncertainty levels can be assumed to be <5%. Emissions reported as per metric ton of production.
If you are verifying/assuring this product emission data, please tell us howIt hasn’t been verified at the product level yet, but we are taking steps toward it.
Name of good/ serviceProduct 3: Standard Compounded Consumer Fragrance
Please select the scopeScope 1 & 2
Please select the lifecycle stageProduction
Emissions at the lifecycle stage in kg CO2e per unit92
Is this stage under your ownership or control?Yes
CDP Page of 8988
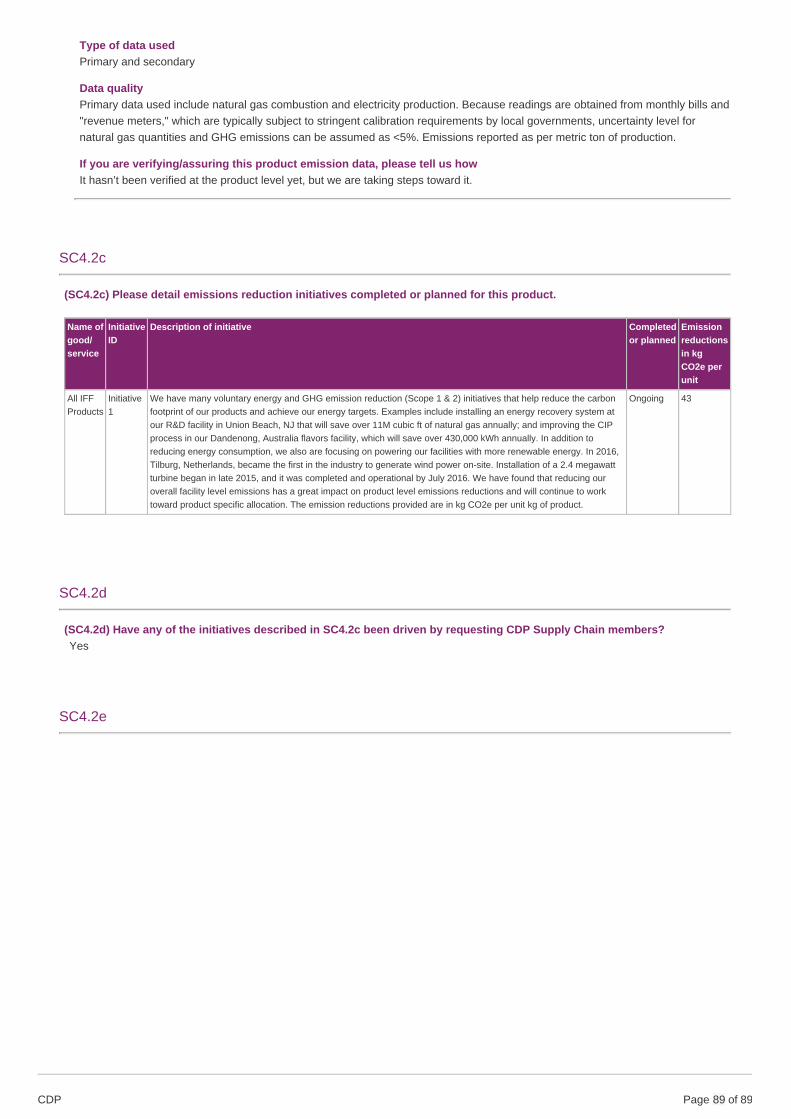
Type of data usedPrimary and secondary
Data qualityPrimary data used include natural gas combustion and electricity production. Because readings are obtained from monthly bills and"revenue meters," which are typically subject to stringent calibration requirements by local governments, uncertainty level fornatural gas quantities and GHG emissions can be assumed as <5%. Emissions reported as per metric ton of production.
If you are verifying/assuring this product emission data, please tell us howIt hasn’t been verified at the product level yet, but we are taking steps toward it.
SC4.2c
(SC4.2c) Please detail emissions reduction initiatives completed or planned for this product.
Name ofgood/service
InitiativeID
Description of initiative Completedor planned
Emissionreductionsin kgCO2e perunit
All IFFProducts
Initiative1
We have many voluntary energy and GHG emission reduction (Scope 1 & 2) initiatives that help reduce the carbonfootprint of our products and achieve our energy targets. Examples include installing an energy recovery system atour R&D facility in Union Beach, NJ that will save over 11M cubic ft of natural gas annually; and improving the CIPprocess in our Dandenong, Australia flavors facility, which will save over 430,000 kWh annually. In addition toreducing energy consumption, we also are focusing on powering our facilities with more renewable energy. In 2016,Tilburg, Netherlands, became the first in the industry to generate wind power on-site. Installation of a 2.4 megawattturbine began in late 2015, and it was completed and operational by July 2016. We have found that reducing ouroverall facility level emissions has a great impact on product level emissions reductions and will continue to worktoward product specific allocation. The emission reductions provided are in kg CO2e per unit kg of product.
Ongoing 43
SC4.2d
(SC4.2d) Have any of the initiatives described in SC4.2c been driven by requesting CDP Supply Chain members?Yes
SC4.2e
CDP Page of 8989

(SC4.2e) Explain which initiatives have been driven by requesting members.
Requestingmember(s)
Name of good/service InitiativeID
AbbottLaboratories
Organizational emissions reductions are being driven by our desire to be more sustainable in this area as well as by our commitment tobeing a responsible member of Abbott's supply chain. Multiple energy efficiency and renewable energy reduction initiatives are underwayspecifically at the locations that provide your products. We are continuously improving our understanding of specific product level emissionsreductions and can currently allocate a percentage of our overall emissions reductions to your supply chain.
Initiative1
Ambev S.A Organizational emissions reductions are being driven by our desire to be more sustainable in this area as well as by our commitment tobeing a responsible member of Abbott's supply chain. Multiple energy efficiency and renewable energy reduction initiatives are underwayspecifically at the locations that provide your products. We are continuously improving our understanding of specific product level emissionsreductions and can currently allocate a percentage of our overall emissions reductions to your supply chain.
Initiative1
ColgatePalmoliveCompany
Organizational emissions reductions are being driven by our desire to be more sustainable in this area as well as by our commitment tobeing a responsible member of Abbott's supply chain. Multiple energy efficiency and renewable energy reduction initiatives are underwayspecifically at the locations that provide your products. We are continuously improving our understanding of specific product level emissionsreductions and can currently allocate a percentage of our overall emissions reductions to your supply chain.
Initiative1
Diageo Plc Organizational emissions reductions are being driven by our desire to be more sustainable in this area as well as by our commitment tobeing a responsible member of Abbott's supply chain. Multiple energy efficiency and renewable energy reduction initiatives are underwayspecifically at the locations that provide your products. We are continuously improving our understanding of specific product level emissionsreductions and can currently allocate a percentage of our overall emissions reductions to your supply chain.
Initiative1
KAOCorporation
Organizational emissions reductions are being driven by our desire to be more sustainable in this area as well as by our commitment tobeing a responsible member of Abbott's supply chain. Multiple energy efficiency and renewable energy reduction initiatives are underwayspecifically at the locations that provide your products. We are continuously improving our understanding of specific product level emissionsreductions and can currently allocate a percentage of our overall emissions reductions to your supply chain.
Initiative1
KelloggCompany
Organizational emissions reductions are being driven by our desire to be more sustainable in this area as well as by our commitment tobeing a responsible member of Abbott's supply chain. Multiple energy efficiency and renewable energy reduction initiatives are underwayspecifically at the locations that provide your products. We are continuously improving our understanding of specific product level emissionsreductions and can currently allocate a percentage of our overall emissions reductions to your supply chain.
Initiative1
L'Oréal Organizational emissions reductions are being driven by our desire to be more sustainable in this area as well as by our commitment tobeing a responsible member of Abbott's supply chain. Multiple energy efficiency and renewable energy reduction initiatives are underwayspecifically at the locations that provide your products. We are continuously improving our understanding of specific product level emissionsreductions and can currently allocate a percentage of our overall emissions reductions to your supply chain.
Initiative1
PepsiCo,Inc.
Organizational emissions reductions are being driven by our desire to be more sustainable in this area as well as by our commitment tobeing a responsible member of Abbott's supply chain. Multiple energy efficiency and renewable energy reduction initiatives are underwayspecifically at the locations that provide your products. We are continuously improving our understanding of specific product level emissionsreductions and can currently allocate a percentage of our overall emissions reductions to your supply chain.
Initiative1
S.C.Johnson &Son, Inc.
Organizational emissions reductions are being driven by our desire to be more sustainable in this area as well as by our commitment tobeing a responsible member of Abbott's supply chain. Multiple energy efficiency and renewable energy reduction initiatives are underwayspecifically at the locations that provide your products. We are continuously improving our understanding of specific product level emissionsreductions and can currently allocate a percentage of our overall emissions reductions to your supply chain.
Initiative1
Unilever plc Organizational emissions reductions are being driven by our desire to be more sustainable in this area as well as by our commitment tobeing a responsible member of Abbott's supply chain. Multiple energy efficiency and renewable energy reduction initiatives are underwayspecifically at the locations that provide your products. We are continuously improving our understanding of specific product level emissionsreductions and can currently allocate a percentage of our overall emissions reductions to your supply chain.
Initiative1
Submit your response
In which language are you submitting your response?English
Please confirm how your response should be handled by CDP
Public or Non-Public Submission I am submitting to Are you ready to submit the additional Supply Chain Questions?
I am submitting my response Public InvestorsCustomers
Yes, submit Supply Chain Questions now
Please confirm belowI have read and accept the applicable Terms