Embed Size (px)
Citation preview
MONTHLY GAS SURVEY
I E A S T A T I S T I C S
Next Release: 13 June 2014
Energy Data CentreMonthly Oil and Gas Statistics
With data up to:
February 2014
MONTHLY NATURAL GAS SURVEY - 1
CONTENTS
TABLE 1 Natural Gas Balances in OECD Regions and Countries 3 - 8
TABLE 2 Gross Imports (Entries) of Natural Gas (Pipeline and LNG): 9 - 12
Total OECD, OECD Americas, OECD Asia Oceania, OECD Europe
TABLE 3 Gross Imports (Entries) of LNG: 13 - 16
Total OECD, OECD Americas, OECD Asia Oceania, OECD Europe
TABLE 4 Gross Exports (Exits) of Natural Gas (Pipeline and LNG): 17
Total OECD and OECD Regions
TABLE 5 Gross Exports (Exits) of LNG: 18
Total OECD and OECD Regions
GRAPHS Gross Consumption of Natural Gas by OECD Region 19
Indigenous Production of Natural Gas by OECD Region
APPENDIX Geographical Notes 20
NOTES
ESTIMATED DATA
Due to the absence of official data, the following data have been estimated:
Israel January 2010 to February 2014
© OECD/IEA, 2014 INTERNATIONAL ENERGY AGENCY
MONTHLY NATURAL GAS SURVEY - 2
COUNTRY NOTES
Chile Chile is reporting stock levels of the country’s LNG terminals as of January 2013. Therefore, there is a break in stock levels between December 2012 and January 2013.
Germany Germany is reporting stock levels as of January 2013. Therefore, there is a break in stock levels between December 2012 and January 2013.German imports and exports of natural gas represent ultimate origins and destinations with partial transit.
Iceland There is no natural gas data for Iceland, as there is neither production nor consumption.
Israel The statistical data for Israel are supplied by and under the responsibility of the relevant Israeli authorities. The use of such data by the OECD is without prejudice to the status of the Golan Heights, East Jerusalem and Israeli settlements in the West Bank under the terms of international law.
The stocks level information is not available at this time. Revisions are pending.
Information based on data published by the Ministry of Energy and Water Resources as well as the Central Bureau of Statistics.
Norway Norway is reporting stock levels as of January 2013. Therefore, there is a break in stock levels between December 2012 and January 2013.
© OECD/IEA, 2014 INTERNATIONAL ENERGY AGENCY
MONTHLY NATURAL GAS SURVEY - 3
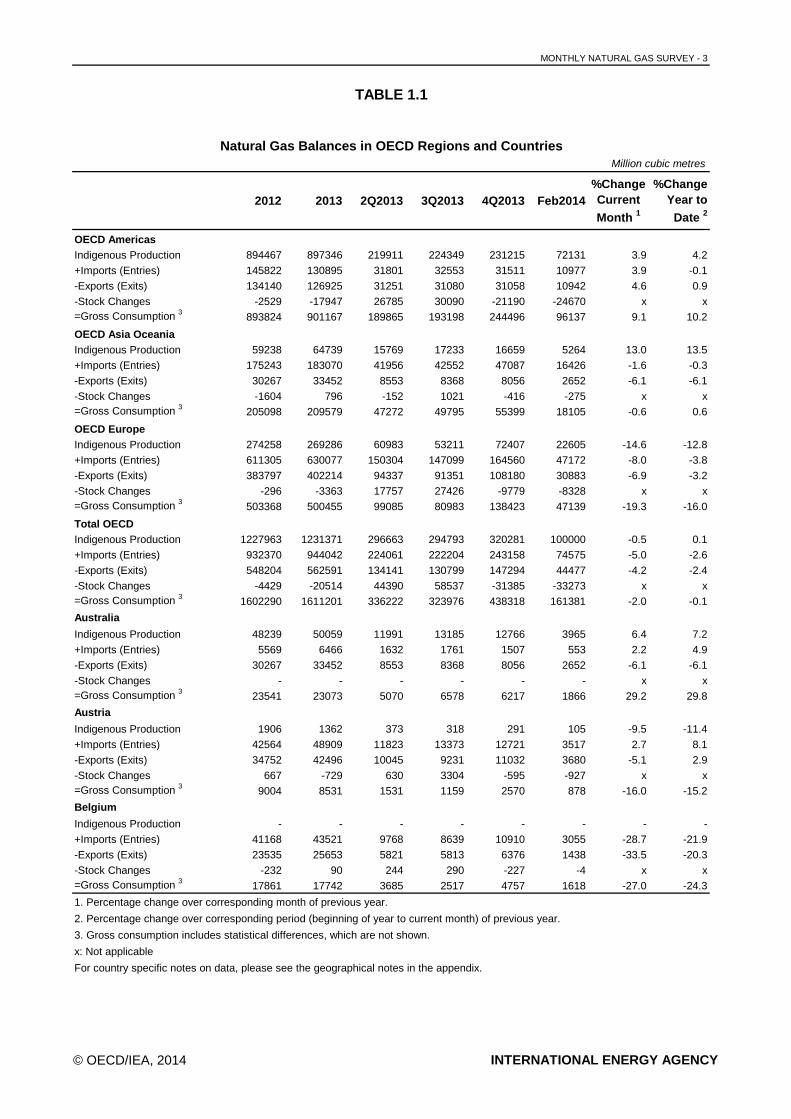
TABLE 1.1
Natural Gas Balances in OECD Regions and CountriesMillion cubic metres
2012 2013 2Q2013 3Q2013 4Q2013 Feb2014%Change Current
Month 1
%Change Year to
Date 2
OECD AmericasIndigenous Production 894467 897346 219911 224349 231215 72131 3.9 4.2
+Imports (Entries) 145822 130895 31801 32553 31511 10977 3.9 -0.1
-Exports (Exits) 134140 126925 31251 31080 31058 10942 4.6 0.9
-Stock Changes -2529 -17947 26785 30090 -21190 -24670 x x=Gross Consumption 3 893824 901167 189865 193198 244496 96137 9.1 10.2
OECD Asia OceaniaIndigenous Production 59238 64739 15769 17233 16659 5264 13.0 13.5
+Imports (Entries) 175243 183070 41956 42552 47087 16426 -1.6 -0.3
-Exports (Exits) 30267 33452 8553 8368 8056 2652 -6.1 -6.1
-Stock Changes -1604 796 -152 1021 -416 -275 x x=Gross Consumption 3 205098 209579 47272 49795 55399 18105 -0.6 0.6
OECD Europe Indigenous Production 274258 269286 60983 53211 72407 22605 -14.6 -12.8
+Imports (Entries) 611305 630077 150304 147099 164560 47172 -8.0 -3.8
-Exports (Exits) 383797 402214 94337 91351 108180 30883 -6.9 -3.2
-Stock Changes -296 -3363 17757 27426 -9779 -8328 x x=Gross Consumption 3 503368 500455 99085 80983 138423 47139 -19.3 -16.0
Total OECD Indigenous Production 1227963 1231371 296663 294793 320281 100000 -0.5 0.1
+Imports (Entries) 932370 944042 224061 222204 243158 74575 -5.0 -2.6
-Exports (Exits) 548204 562591 134141 130799 147294 44477 -4.2 -2.4
-Stock Changes -4429 -20514 44390 58537 -31385 -33273 x x=Gross Consumption 3 1602290 1611201 336222 323976 438318 161381 -2.0 -0.1
Australia
Indigenous Production 48239 50059 11991 13185 12766 3965 6.4 7.2
+Imports (Entries) 5569 6466 1632 1761 1507 553 2.2 4.9
-Exports (Exits) 30267 33452 8553 8368 8056 2652 -6.1 -6.1
-Stock Changes - - - - - - x x=Gross Consumption 3 23541 23073 5070 6578 6217 1866 29.2 29.8
Austria
Indigenous Production 1906 1362 373 318 291 105 -9.5 -11.4
+Imports (Entries) 42564 48909 11823 13373 12721 3517 2.7 8.1
-Exports (Exits) 34752 42496 10045 9231 11032 3680 -5.1 2.9
-Stock Changes 667 -729 630 3304 -595 -927 x x=Gross Consumption 3 9004 8531 1531 1159 2570 878 -16.0 -15.2
Belgium
Indigenous Production - - - - - - - -
+Imports (Entries) 41168 43521 9768 8639 10910 3055 -28.7 -21.9
-Exports (Exits) 23535 25653 5821 5813 6376 1438 -33.5 -20.3
-Stock Changes -232 90 244 290 -227 -4 x x=Gross Consumption 3 17861 17742 3685 2517 4757 1618 -27.0 -24.3
1. Percentage change over corresponding month of previous year.
2. Percentage change over corresponding period (beginning of year to current month) of previous year.
3. Gross consumption includes statistical differences, which are not shown.
x: Not applicable
For country specific notes on data, please see the geographical notes in the appendix.
© OECD/IEA, 2014 INTERNATIONAL ENERGY AGENCY
MONTHLY NATURAL GAS SURVEY - 4
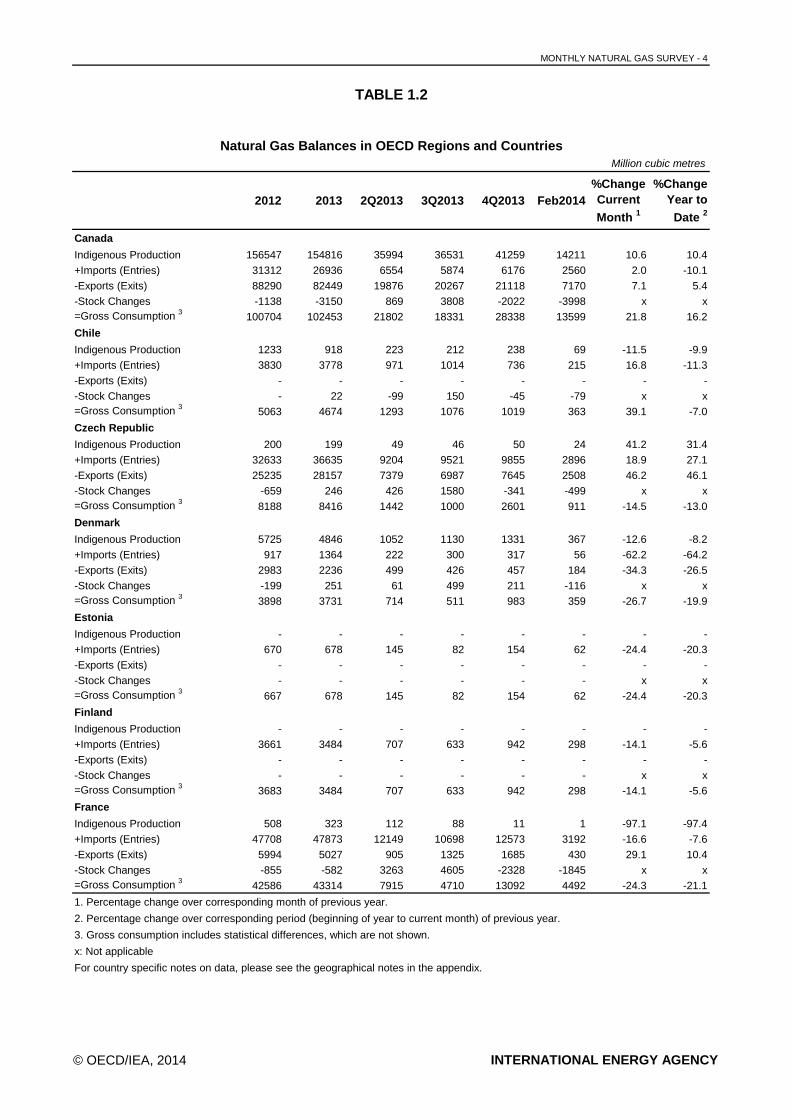
TABLE 1.2
Natural Gas Balances in OECD Regions and CountriesMillion cubic metres
2012 2013 2Q2013 3Q2013 4Q2013 Feb2014%Change Current
Month 1
%Change Year to
Date 2
Canada
Indigenous Production 156547 154816 35994 36531 41259 14211 10.6 10.4
+Imports (Entries) 31312 26936 6554 5874 6176 2560 2.0 -10.1
-Exports (Exits) 88290 82449 19876 20267 21118 7170 7.1 5.4
-Stock Changes -1138 -3150 869 3808 -2022 -3998 x x=Gross Consumption 3 100704 102453 21802 18331 28338 13599 21.8 16.2
Chile
Indigenous Production 1233 918 223 212 238 69 -11.5 -9.9
+Imports (Entries) 3830 3778 971 1014 736 215 16.8 -11.3
-Exports (Exits) - - - - - - - -
-Stock Changes - 22 -99 150 -45 -79 x x=Gross Consumption 3 5063 4674 1293 1076 1019 363 39.1 -7.0
Czech Republic
Indigenous Production 200 199 49 46 50 24 41.2 31.4
+Imports (Entries) 32633 36635 9204 9521 9855 2896 18.9 27.1
-Exports (Exits) 25235 28157 7379 6987 7645 2508 46.2 46.1
-Stock Changes -659 246 426 1580 -341 -499 x x=Gross Consumption 3 8188 8416 1442 1000 2601 911 -14.5 -13.0
Denmark
Indigenous Production 5725 4846 1052 1130 1331 367 -12.6 -8.2
+Imports (Entries) 917 1364 222 300 317 56 -62.2 -64.2
-Exports (Exits) 2983 2236 499 426 457 184 -34.3 -26.5
-Stock Changes -199 251 61 499 211 -116 x x=Gross Consumption 3 3898 3731 714 511 983 359 -26.7 -19.9
Estonia
Indigenous Production - - - - - - - -
+Imports (Entries) 670 678 145 82 154 62 -24.4 -20.3
-Exports (Exits) - - - - - - - -
-Stock Changes - - - - - - x x=Gross Consumption 3 667 678 145 82 154 62 -24.4 -20.3
Finland
Indigenous Production - - - - - - - -
+Imports (Entries) 3661 3484 707 633 942 298 -14.1 -5.6
-Exports (Exits) - - - - - - - -
-Stock Changes - - - - - - x x=Gross Consumption 3 3683 3484 707 633 942 298 -14.1 -5.6
France
Indigenous Production 508 323 112 88 11 1 -97.1 -97.4
+Imports (Entries) 47708 47873 12149 10698 12573 3192 -16.6 -7.6
-Exports (Exits) 5994 5027 905 1325 1685 430 29.1 10.4
-Stock Changes -855 -582 3263 4605 -2328 -1845 x x=Gross Consumption 3 42586 43314 7915 4710 13092 4492 -24.3 -21.1
1. Percentage change over corresponding month of previous year.
2. Percentage change over corresponding period (beginning of year to current month) of previous year.
3. Gross consumption includes statistical differences, which are not shown.
x: Not applicable
For country specific notes on data, please see the geographical notes in the appendix.
© OECD/IEA, 2014 INTERNATIONAL ENERGY AGENCY
MONTHLY NATURAL GAS SURVEY - 5
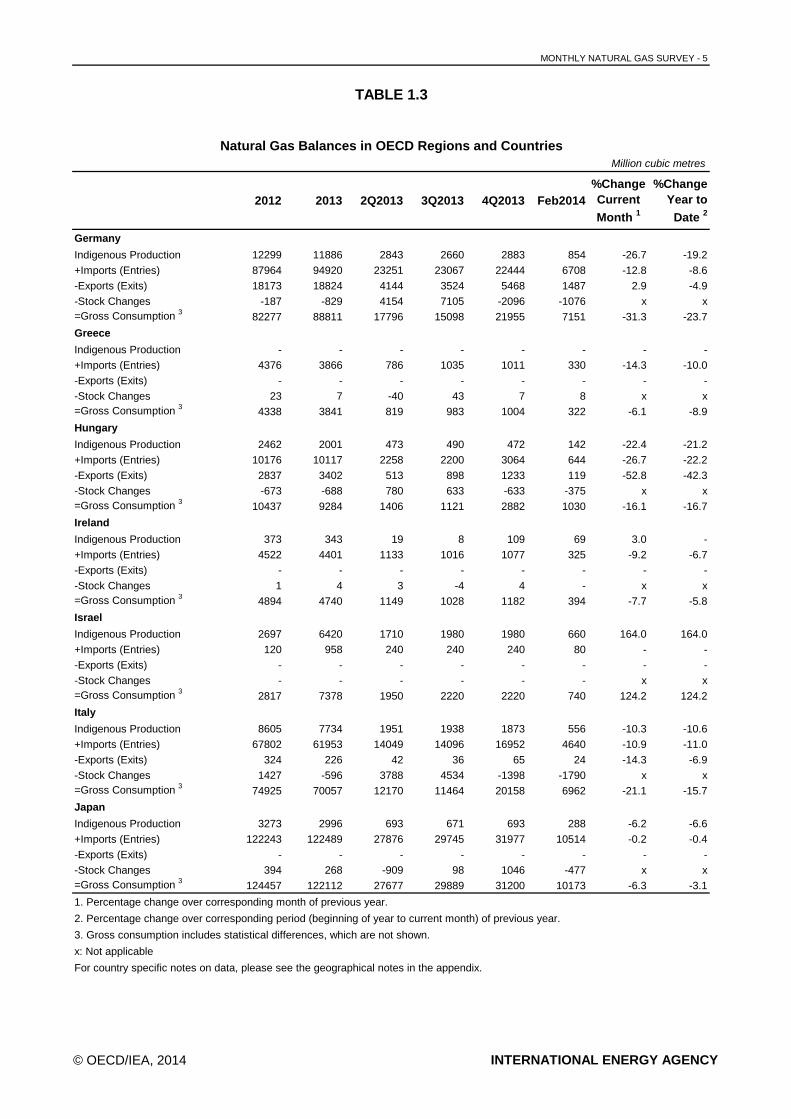
TABLE 1.3
Natural Gas Balances in OECD Regions and CountriesMillion cubic metres
2012 2013 2Q2013 3Q2013 4Q2013 Feb2014%Change Current
Month 1
%Change Year to
Date 2
Germany
Indigenous Production 12299 11886 2843 2660 2883 854 -26.7 -19.2
+Imports (Entries) 87964 94920 23251 23067 22444 6708 -12.8 -8.6
-Exports (Exits) 18173 18824 4144 3524 5468 1487 2.9 -4.9
-Stock Changes -187 -829 4154 7105 -2096 -1076 x x=Gross Consumption 3 82277 88811 17796 15098 21955 7151 -31.3 -23.7
Greece
Indigenous Production - - - - - - - -
+Imports (Entries) 4376 3866 786 1035 1011 330 -14.3 -10.0
-Exports (Exits) - - - - - - - -
-Stock Changes 23 7 -40 43 7 8 x x=Gross Consumption 3 4338 3841 819 983 1004 322 -6.1 -8.9
Hungary
Indigenous Production 2462 2001 473 490 472 142 -22.4 -21.2
+Imports (Entries) 10176 10117 2258 2200 3064 644 -26.7 -22.2
-Exports (Exits) 2837 3402 513 898 1233 119 -52.8 -42.3
-Stock Changes -673 -688 780 633 -633 -375 x x=Gross Consumption 3 10437 9284 1406 1121 2882 1030 -16.1 -16.7
Ireland
Indigenous Production 373 343 19 8 109 69 3.0 -
+Imports (Entries) 4522 4401 1133 1016 1077 325 -9.2 -6.7
-Exports (Exits) - - - - - - - -
-Stock Changes 1 4 3 -4 4 - x x=Gross Consumption 3 4894 4740 1149 1028 1182 394 -7.7 -5.8
Israel
Indigenous Production 2697 6420 1710 1980 1980 660 164.0 164.0
+Imports (Entries) 120 958 240 240 240 80 - -
-Exports (Exits) - - - - - - - -
-Stock Changes - - - - - - x x=Gross Consumption 3 2817 7378 1950 2220 2220 740 124.2 124.2
Italy
Indigenous Production 8605 7734 1951 1938 1873 556 -10.3 -10.6
+Imports (Entries) 67802 61953 14049 14096 16952 4640 -10.9 -11.0
-Exports (Exits) 324 226 42 36 65 24 -14.3 -6.9
-Stock Changes 1427 -596 3788 4534 -1398 -1790 x x=Gross Consumption 3 74925 70057 12170 11464 20158 6962 -21.1 -15.7
Japan
Indigenous Production 3273 2996 693 671 693 288 -6.2 -6.6
+Imports (Entries) 122243 122489 27876 29745 31977 10514 -0.2 -0.4
-Exports (Exits) - - - - - - - -
-Stock Changes 394 268 -909 98 1046 -477 x x=Gross Consumption 3 124457 122112 27677 29889 31200 10173 -6.3 -3.1
1. Percentage change over corresponding month of previous year.
2. Percentage change over corresponding period (beginning of year to current month) of previous year.
3. Gross consumption includes statistical differences, which are not shown.
x: Not applicable
For country specific notes on data, please see the geographical notes in the appendix.
© OECD/IEA, 2014 INTERNATIONAL ENERGY AGENCY
MONTHLY NATURAL GAS SURVEY - 6
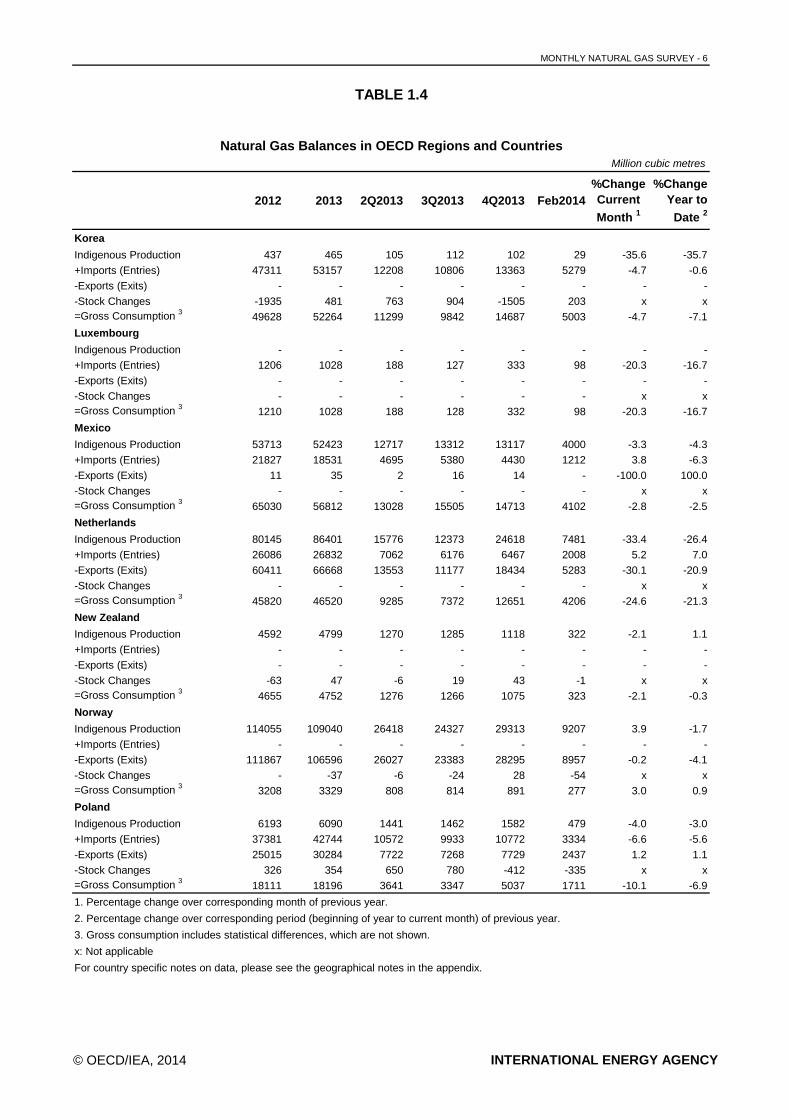
TABLE 1.4
Natural Gas Balances in OECD Regions and CountriesMillion cubic metres
2012 2013 2Q2013 3Q2013 4Q2013 Feb2014%Change Current
Month 1
%Change Year to
Date 2
Korea
Indigenous Production 437 465 105 112 102 29 -35.6 -35.7
+Imports (Entries) 47311 53157 12208 10806 13363 5279 -4.7 -0.6
-Exports (Exits) - - - - - - - -
-Stock Changes -1935 481 763 904 -1505 203 x x=Gross Consumption 3 49628 52264 11299 9842 14687 5003 -4.7 -7.1
Luxembourg
Indigenous Production - - - - - - - -
+Imports (Entries) 1206 1028 188 127 333 98 -20.3 -16.7
-Exports (Exits) - - - - - - - -
-Stock Changes - - - - - - x x=Gross Consumption 3 1210 1028 188 128 332 98 -20.3 -16.7
Mexico
Indigenous Production 53713 52423 12717 13312 13117 4000 -3.3 -4.3
+Imports (Entries) 21827 18531 4695 5380 4430 1212 3.8 -6.3
-Exports (Exits) 11 35 2 16 14 - -100.0 100.0
-Stock Changes - - - - - - x x=Gross Consumption 3 65030 56812 13028 15505 14713 4102 -2.8 -2.5
Netherlands
Indigenous Production 80145 86401 15776 12373 24618 7481 -33.4 -26.4
+Imports (Entries) 26086 26832 7062 6176 6467 2008 5.2 7.0
-Exports (Exits) 60411 66668 13553 11177 18434 5283 -30.1 -20.9
-Stock Changes - - - - - - x x=Gross Consumption 3 45820 46520 9285 7372 12651 4206 -24.6 -21.3
New Zealand
Indigenous Production 4592 4799 1270 1285 1118 322 -2.1 1.1
+Imports (Entries) - - - - - - - -
-Exports (Exits) - - - - - - - -
-Stock Changes -63 47 -6 19 43 -1 x x=Gross Consumption 3 4655 4752 1276 1266 1075 323 -2.1 -0.3
Norway
Indigenous Production 114055 109040 26418 24327 29313 9207 3.9 -1.7
+Imports (Entries) - - - - - - - -
-Exports (Exits) 111867 106596 26027 23383 28295 8957 -0.2 -4.1
-Stock Changes - -37 -6 -24 28 -54 x x=Gross Consumption 3 3208 3329 808 814 891 277 3.0 0.9
Poland
Indigenous Production 6193 6090 1441 1462 1582 479 -4.0 -3.0
+Imports (Entries) 37381 42744 10572 9933 10772 3334 -6.6 -5.6
-Exports (Exits) 25015 30284 7722 7268 7729 2437 1.2 1.1
-Stock Changes 326 354 650 780 -412 -335 x x=Gross Consumption 3 18111 18196 3641 3347 5037 1711 -10.1 -6.9
1. Percentage change over corresponding month of previous year.
2. Percentage change over corresponding period (beginning of year to current month) of previous year.
3. Gross consumption includes statistical differences, which are not shown.
x: Not applicable
For country specific notes on data, please see the geographical notes in the appendix.
© OECD/IEA, 2014 INTERNATIONAL ENERGY AGENCY
MONTHLY NATURAL GAS SURVEY - 7
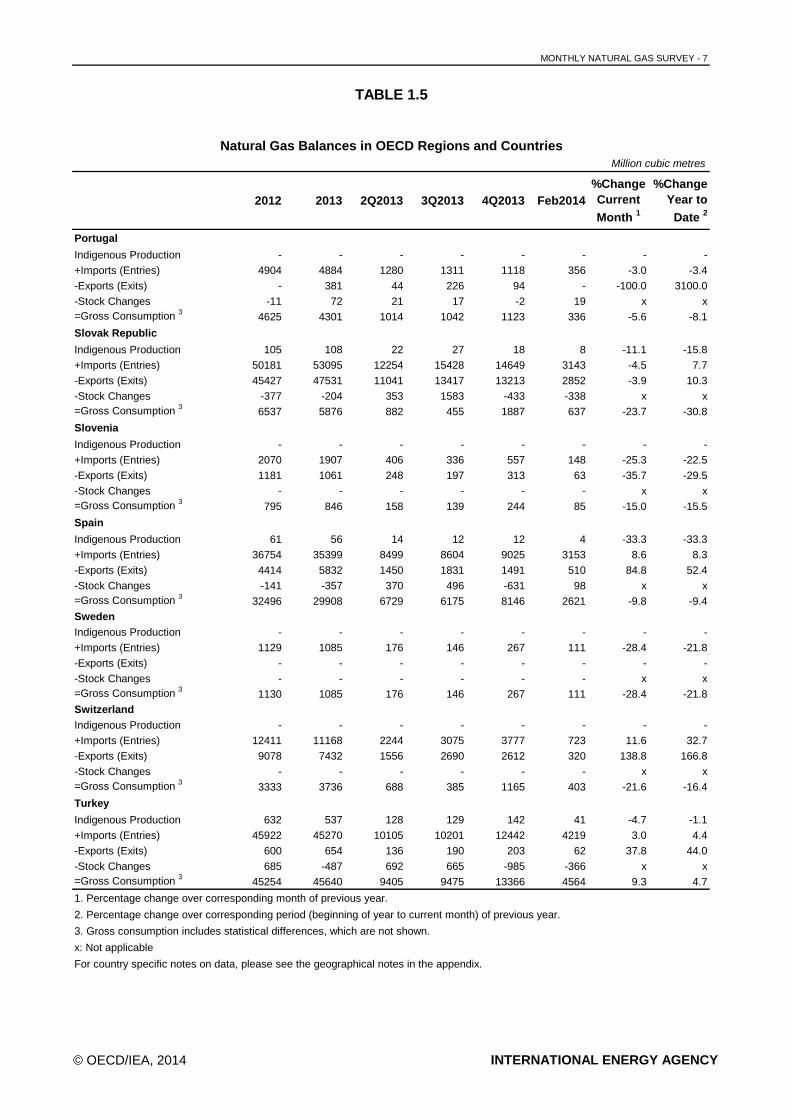
TABLE 1.5
Natural Gas Balances in OECD Regions and CountriesMillion cubic metres
2012 2013 2Q2013 3Q2013 4Q2013 Feb2014%Change Current
Month 1
%Change Year to
Date 2
Portugal
Indigenous Production - - - - - - - -
+Imports (Entries) 4904 4884 1280 1311 1118 356 -3.0 -3.4
-Exports (Exits) - 381 44 226 94 - -100.0 3100.0
-Stock Changes -11 72 21 17 -2 19 x x=Gross Consumption 3 4625 4301 1014 1042 1123 336 -5.6 -8.1
Slovak Republic
Indigenous Production 105 108 22 27 18 8 -11.1 -15.8
+Imports (Entries) 50181 53095 12254 15428 14649 3143 -4.5 7.7
-Exports (Exits) 45427 47531 11041 13417 13213 2852 -3.9 10.3
-Stock Changes -377 -204 353 1583 -433 -338 x x=Gross Consumption 3 6537 5876 882 455 1887 637 -23.7 -30.8
Slovenia
Indigenous Production - - - - - - - -
+Imports (Entries) 2070 1907 406 336 557 148 -25.3 -22.5
-Exports (Exits) 1181 1061 248 197 313 63 -35.7 -29.5
-Stock Changes - - - - - - x x=Gross Consumption 3 795 846 158 139 244 85 -15.0 -15.5
Spain
Indigenous Production 61 56 14 12 12 4 -33.3 -33.3
+Imports (Entries) 36754 35399 8499 8604 9025 3153 8.6 8.3
-Exports (Exits) 4414 5832 1450 1831 1491 510 84.8 52.4
-Stock Changes -141 -357 370 496 -631 98 x x=Gross Consumption 3 32496 29908 6729 6175 8146 2621 -9.8 -9.4SwedenIndigenous Production - - - - - - - -
+Imports (Entries) 1129 1085 176 146 267 111 -28.4 -21.8
-Exports (Exits) - - - - - - - -
-Stock Changes - - - - - - x x=Gross Consumption 3 1130 1085 176 146 267 111 -28.4 -21.8SwitzerlandIndigenous Production - - - - - - - -
+Imports (Entries) 12411 11168 2244 3075 3777 723 11.6 32.7
-Exports (Exits) 9078 7432 1556 2690 2612 320 138.8 166.8
-Stock Changes - - - - - - x x=Gross Consumption 3 3333 3736 688 385 1165 403 -21.6 -16.4
Turkey
Indigenous Production 632 537 128 129 142 41 -4.7 -1.1
+Imports (Entries) 45922 45270 10105 10201 12442 4219 3.0 4.4
-Exports (Exits) 600 654 136 190 203 62 37.8 44.0
-Stock Changes 685 -487 692 665 -985 -366 x x=Gross Consumption 3 45254 45640 9405 9475 13366 4564 9.3 4.7
1. Percentage change over corresponding month of previous year.
2. Percentage change over corresponding period (beginning of year to current month) of previous year.
3. Gross consumption includes statistical differences, which are not shown.
x: Not applicable
For country specific notes on data, please see the geographical notes in the appendix.
© OECD/IEA, 2014 INTERNATIONAL ENERGY AGENCY
MONTHLY NATURAL GAS SURVEY - 8
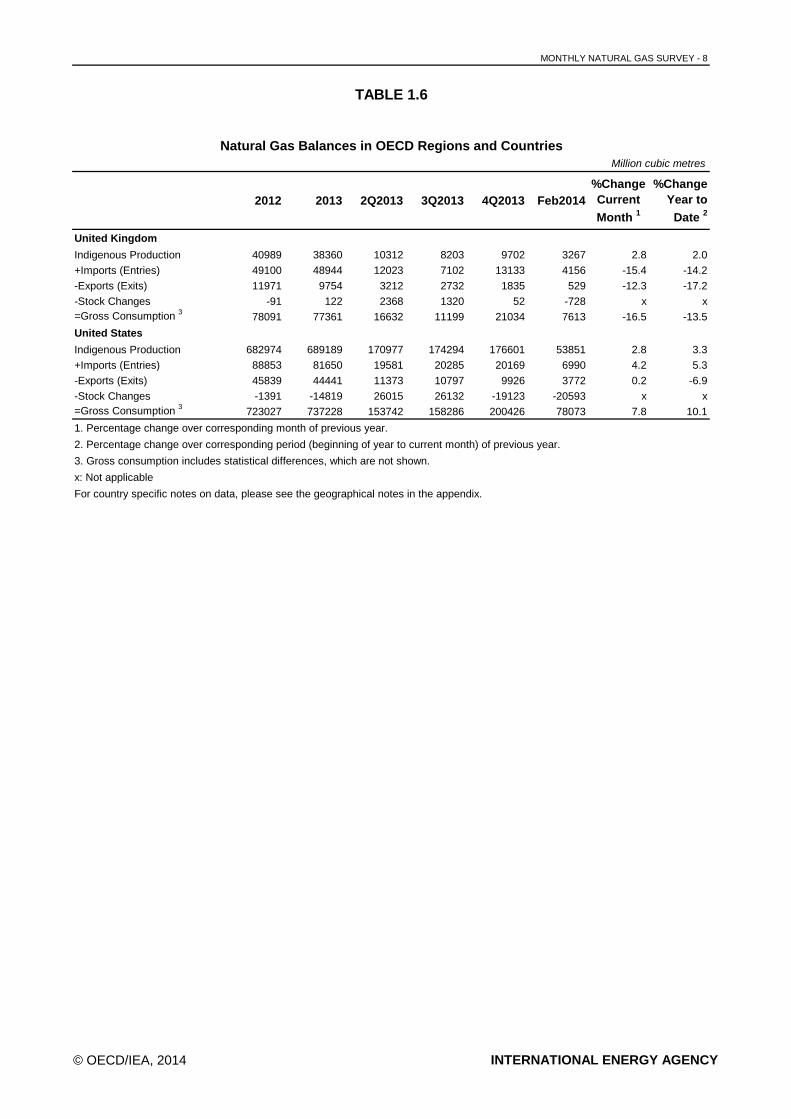
TABLE 1.6
Natural Gas Balances in OECD Regions and CountriesMillion cubic metres
2012 2013 2Q2013 3Q2013 4Q2013 Feb2014%Change Current
Month 1
%Change Year to
Date 2
United Kingdom
Indigenous Production 40989 38360 10312 8203 9702 3267 2.8 2.0
+Imports (Entries) 49100 48944 12023 7102 13133 4156 -15.4 -14.2
-Exports (Exits) 11971 9754 3212 2732 1835 529 -12.3 -17.2
-Stock Changes -91 122 2368 1320 52 -728 x x=Gross Consumption 3 78091 77361 16632 11199 21034 7613 -16.5 -13.5
United States
Indigenous Production 682974 689189 170977 174294 176601 53851 2.8 3.3
+Imports (Entries) 88853 81650 19581 20285 20169 6990 4.2 5.3
-Exports (Exits) 45839 44441 11373 10797 9926 3772 0.2 -6.9
-Stock Changes -1391 -14819 26015 26132 -19123 -20593 x x=Gross Consumption 3 723027 737228 153742 158286 200426 78073 7.8 10.1
1. Percentage change over corresponding month of previous year.
2. Percentage change over corresponding period (beginning of year to current month) of previous year.
3. Gross consumption includes statistical differences, which are not shown.
x: Not applicable
For country specific notes on data, please see the geographical notes in the appendix.
© OECD/IEA, 2014 INTERNATIONAL ENERGY AGENCY
MONTHLY NATURAL GAS SURVEY - 9
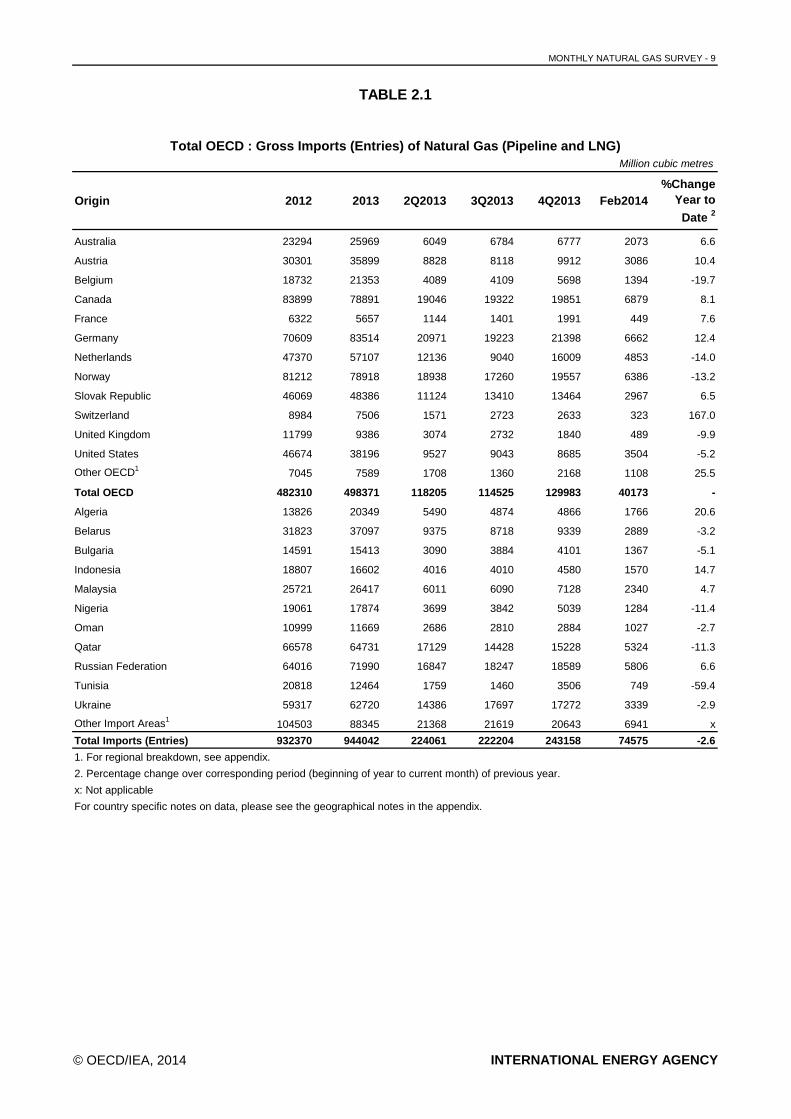
TABLE 2.1
Total OECD : Gross Imports (Entries) of Natural Gas (Pipeline and LNG)Million cubic metres
Origin 2012 2013 2Q2013 3Q2013 4Q2013 Feb2014%Change
Year to
Date 2
Australia 23294 25969 6049 6784 6777 2073 6.6
Austria 30301 35899 8828 8118 9912 3086 10.4
Belgium 18732 21353 4089 4109 5698 1394 -19.7
Canada 83899 78891 19046 19322 19851 6879 8.1
France 6322 5657 1144 1401 1991 449 7.6
Germany 70609 83514 20971 19223 21398 6662 12.4
Netherlands 47370 57107 12136 9040 16009 4853 -14.0
Norway 81212 78918 18938 17260 19557 6386 -13.2
Slovak Republic 46069 48386 11124 13410 13464 2967 6.5
Switzerland 8984 7506 1571 2723 2633 323 167.0
United Kingdom 11799 9386 3074 2732 1840 489 -9.9
United States 46674 38196 9527 9043 8685 3504 -5.2
Other OECD1 7045 7589 1708 1360 2168 1108 25.5
Total OECD 482310 498371 118205 114525 129983 40173 -
Algeria 13826 20349 5490 4874 4866 1766 20.6
Belarus 31823 37097 9375 8718 9339 2889 -3.2
Bulgaria 14591 15413 3090 3884 4101 1367 -5.1
Indonesia 18807 16602 4016 4010 4580 1570 14.7
Malaysia 25721 26417 6011 6090 7128 2340 4.7
Nigeria 19061 17874 3699 3842 5039 1284 -11.4
Oman 10999 11669 2686 2810 2884 1027 -2.7
Qatar 66578 64731 17129 14428 15228 5324 -11.3
Russian Federation 64016 71990 16847 18247 18589 5806 6.6
Tunisia 20818 12464 1759 1460 3506 749 -59.4
Ukraine 59317 62720 14386 17697 17272 3339 -2.9
Other Import Areas1 104503 88345 21368 21619 20643 6941 x
Total Imports (Entries) 932370 944042 224061 222204 243158 74575 -2.6
1. For regional breakdown, see appendix.
2. Percentage change over corresponding period (beginning of year to current month) of previous year.
x: Not applicable
For country specific notes on data, please see the geographical notes in the appendix.
© OECD/IEA, 2014 INTERNATIONAL ENERGY AGENCY
MONTHLY NATURAL GAS SURVEY - 10
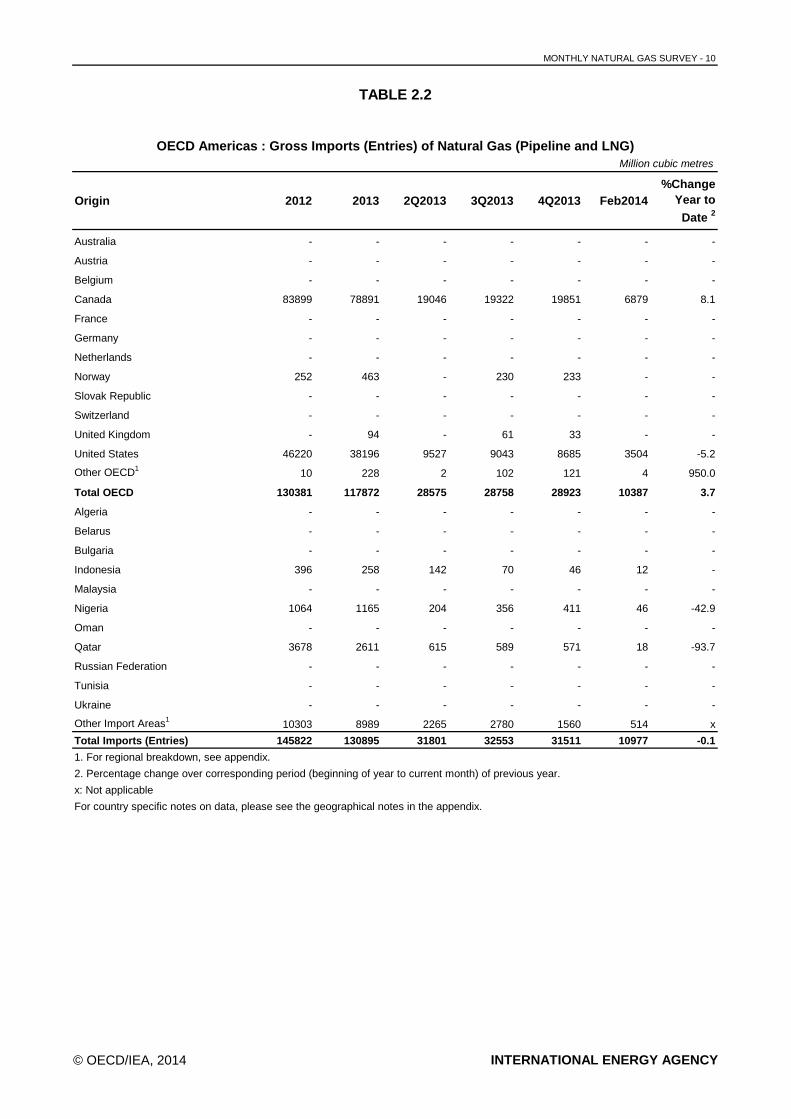
TABLE 2.2
OECD Americas : Gross Imports (Entries) of Natural Gas (Pipeline and LNG)Million cubic metres
Origin 2012 2013 2Q2013 3Q2013 4Q2013 Feb2014%Change
Year to
Date 2
Australia - - - - - - -
Austria - - - - - - -
Belgium - - - - - - -
Canada 83899 78891 19046 19322 19851 6879 8.1
France - - - - - - -
Germany - - - - - - -
Netherlands - - - - - - -
Norway 252 463 - 230 233 - -
Slovak Republic - - - - - - -
Switzerland - - - - - - -
United Kingdom - 94 - 61 33 - -
United States 46220 38196 9527 9043 8685 3504 -5.2
Other OECD1 10 228 2 102 121 4 950.0
Total OECD 130381 117872 28575 28758 28923 10387 3.7
Algeria - - - - - - -
Belarus - - - - - - -
Bulgaria - - - - - - -
Indonesia 396 258 142 70 46 12 -
Malaysia - - - - - - -
Nigeria 1064 1165 204 356 411 46 -42.9
Oman - - - - - - -
Qatar 3678 2611 615 589 571 18 -93.7
Russian Federation - - - - - - -
Tunisia - - - - - - -
Ukraine - - - - - - -
Other Import Areas1 10303 8989 2265 2780 1560 514 x
Total Imports (Entries) 145822 130895 31801 32553 31511 10977 -0.1
1. For regional breakdown, see appendix.
2. Percentage change over corresponding period (beginning of year to current month) of previous year.
x: Not applicable
For country specific notes on data, please see the geographical notes in the appendix.
© OECD/IEA, 2014 INTERNATIONAL ENERGY AGENCY

MONTHLY NATURAL GAS SURVEY - 11
TABLE 2.3
OECD Asia Oceania: Gross Imports (Entries) of Natural Gas (Pipeline and LNG)Million cubic metres
Origin 2012 2013 2Q2013 3Q2013 4Q2013 Feb2014%Change
Year to
Date 2
Australia 23294 25969 6049 6784 6777 2073 6.6
Austria - - - - - - -
Belgium 251 238 - - 83 81 57.4
Canada - - - - - - -
France 89 60 - - 60 - -
Germany - - - - - - -
Netherlands - - - - - 65 -
Norway 647 514 - - 433 173 207.4
Slovak Republic - - - - - - -
Switzerland - - - - - - -
United Kingdom - - - - - - -
United States 454 - - - - - -
Other OECD1 217 274 - - 274 97 -
Total OECD 24952 27055 6049 6784 7627 2489 18.9
Algeria 303 759 86 423 85 88 195.2
Belarus - - - - - - -
Bulgaria - - - - - - -
Indonesia 18411 16344 3874 3940 4534 1558 14.2
Malaysia 25721 26417 6011 6090 7128 2340 4.7
Nigeria 8816 8768 1552 1819 2489 733 -0.3
Oman 10999 11498 2601 2810 2884 1027 -2.7
Qatar 35735 40250 9425 8768 9732 4094 3.6
Russian Federation 14303 14577 3476 3316 3840 1300 -5.3
Tunisia - - - - - - -
Ukraine - - - - - - -
Other Import Areas1 36003 37402 8882 8602 8768 2797 x
Total Imports (Entries) 175243 183070 41956 42552 47087 16426 -0.3
1. For regional breakdown, see appendix.
2. Percentage change over corresponding period (beginning of year to current month) of previous year.
x: Not applicable
For country specific notes on data, please see the geographical notes in the appendix.
© OECD/IEA, 2014 INTERNATIONAL ENERGY AGENCY
MONTHLY NATURAL GAS SURVEY - 12
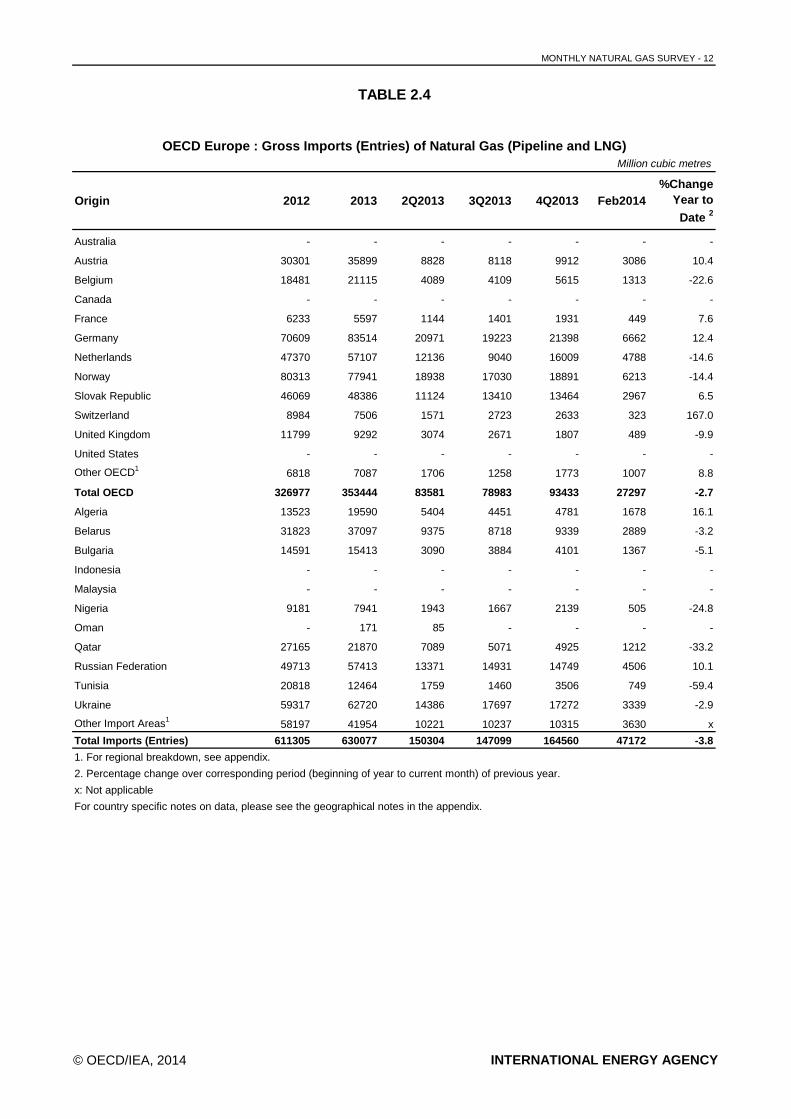
TABLE 2.4
OECD Europe : Gross Imports (Entries) of Natural Gas (Pipeline and LNG)Million cubic metres
Origin 2012 2013 2Q2013 3Q2013 4Q2013 Feb2014%Change
Year to
Date 2
Australia - - - - - - -
Austria 30301 35899 8828 8118 9912 3086 10.4
Belgium 18481 21115 4089 4109 5615 1313 -22.6
Canada - - - - - - -
France 6233 5597 1144 1401 1931 449 7.6
Germany 70609 83514 20971 19223 21398 6662 12.4
Netherlands 47370 57107 12136 9040 16009 4788 -14.6
Norway 80313 77941 18938 17030 18891 6213 -14.4
Slovak Republic 46069 48386 11124 13410 13464 2967 6.5
Switzerland 8984 7506 1571 2723 2633 323 167.0
United Kingdom 11799 9292 3074 2671 1807 489 -9.9
United States - - - - - - -
Other OECD1 6818 7087 1706 1258 1773 1007 8.8
Total OECD 326977 353444 83581 78983 93433 27297 -2.7
Algeria 13523 19590 5404 4451 4781 1678 16.1
Belarus 31823 37097 9375 8718 9339 2889 -3.2
Bulgaria 14591 15413 3090 3884 4101 1367 -5.1
Indonesia - - - - - - -
Malaysia - - - - - - -
Nigeria 9181 7941 1943 1667 2139 505 -24.8
Oman - 171 85 - - - -
Qatar 27165 21870 7089 5071 4925 1212 -33.2
Russian Federation 49713 57413 13371 14931 14749 4506 10.1
Tunisia 20818 12464 1759 1460 3506 749 -59.4
Ukraine 59317 62720 14386 17697 17272 3339 -2.9
Other Import Areas1 58197 41954 10221 10237 10315 3630 x
Total Imports (Entries) 611305 630077 150304 147099 164560 47172 -3.8
1. For regional breakdown, see appendix.
2. Percentage change over corresponding period (beginning of year to current month) of previous year.
x: Not applicable
For country specific notes on data, please see the geographical notes in the appendix.
© OECD/IEA, 2014 INTERNATIONAL ENERGY AGENCY
MONTHLY NATURAL GAS SURVEY - 13
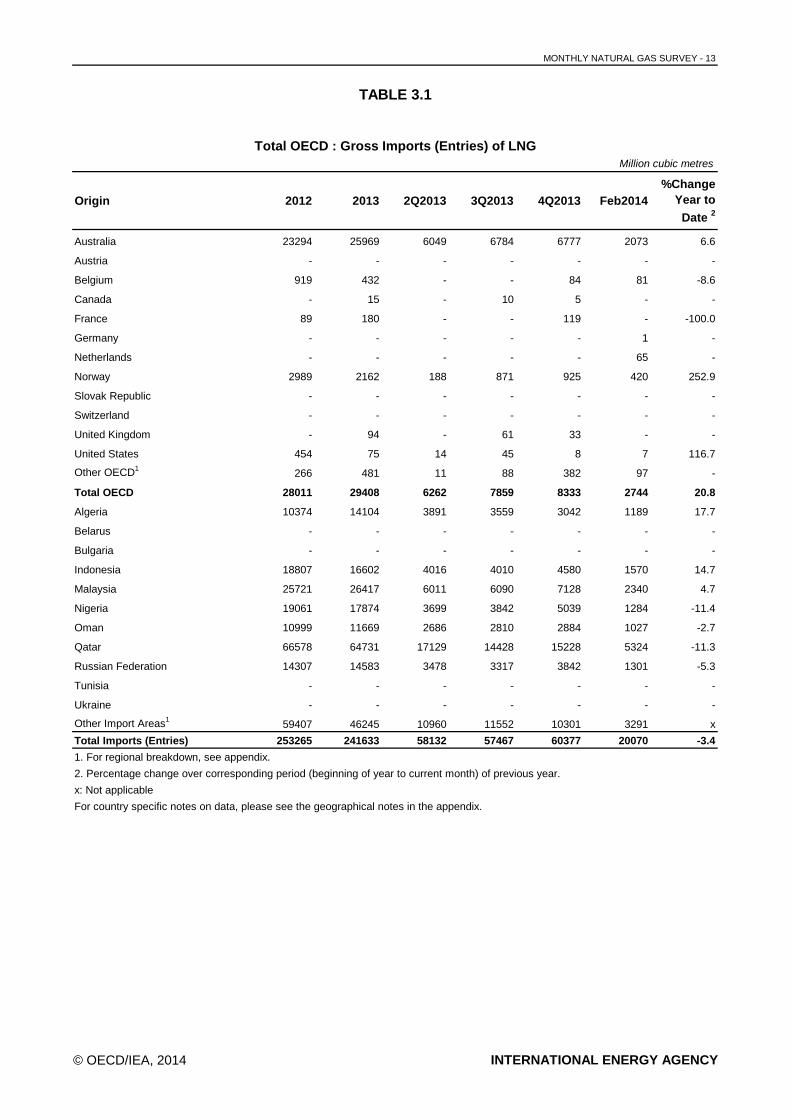
TABLE 3.1
Total OECD : Gross Imports (Entries) of LNGMillion cubic metres
Origin 2012 2013 2Q2013 3Q2013 4Q2013 Feb2014%Change
Year to
Date 2
Australia 23294 25969 6049 6784 6777 2073 6.6
Austria - - - - - - -
Belgium 919 432 - - 84 81 -8.6
Canada - 15 - 10 5 - -
France 89 180 - - 119 - -100.0
Germany - - - - - 1 -
Netherlands - - - - - 65 -
Norway 2989 2162 188 871 925 420 252.9
Slovak Republic - - - - - - -
Switzerland - - - - - - -
United Kingdom - 94 - 61 33 - -
United States 454 75 14 45 8 7 116.7
Other OECD1 266 481 11 88 382 97 -
Total OECD 28011 29408 6262 7859 8333 2744 20.8
Algeria 10374 14104 3891 3559 3042 1189 17.7
Belarus - - - - - - -
Bulgaria - - - - - - -
Indonesia 18807 16602 4016 4010 4580 1570 14.7
Malaysia 25721 26417 6011 6090 7128 2340 4.7
Nigeria 19061 17874 3699 3842 5039 1284 -11.4
Oman 10999 11669 2686 2810 2884 1027 -2.7
Qatar 66578 64731 17129 14428 15228 5324 -11.3
Russian Federation 14307 14583 3478 3317 3842 1301 -5.3
Tunisia - - - - - - -
Ukraine - - - - - - -
Other Import Areas1 59407 46245 10960 11552 10301 3291 x
Total Imports (Entries) 253265 241633 58132 57467 60377 20070 -3.4
1. For regional breakdown, see appendix.
2. Percentage change over corresponding period (beginning of year to current month) of previous year.
x: Not applicable
For country specific notes on data, please see the geographical notes in the appendix.
© OECD/IEA, 2014 INTERNATIONAL ENERGY AGENCY
MONTHLY NATURAL GAS SURVEY - 14
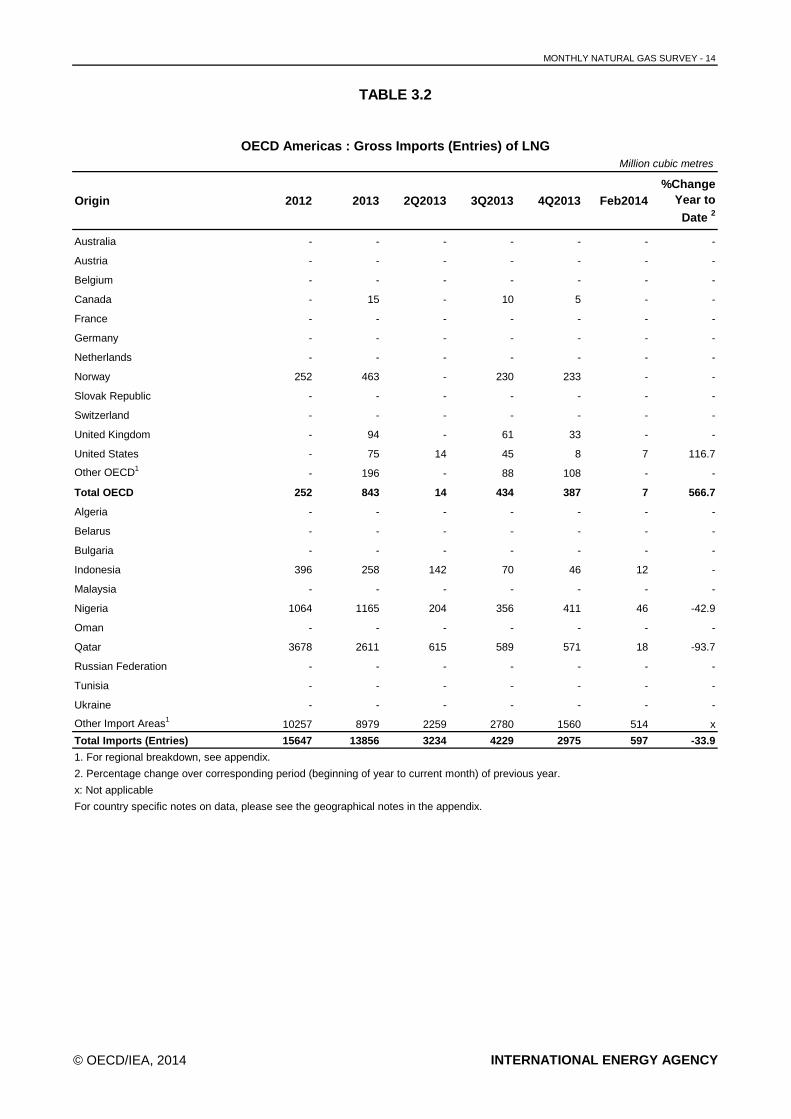
TABLE 3.2
OECD Americas : Gross Imports (Entries) of LNGMillion cubic metres
Origin 2012 2013 2Q2013 3Q2013 4Q2013 Feb2014%Change
Year to
Date 2
Australia - - - - - - -
Austria - - - - - - -
Belgium - - - - - - -
Canada - 15 - 10 5 - -
France - - - - - - -
Germany - - - - - - -
Netherlands - - - - - - -
Norway 252 463 - 230 233 - -
Slovak Republic - - - - - - -
Switzerland - - - - - - -
United Kingdom - 94 - 61 33 - -
United States - 75 14 45 8 7 116.7
Other OECD1 - 196 - 88 108 - -
Total OECD 252 843 14 434 387 7 566.7
Algeria - - - - - - -
Belarus - - - - - - -
Bulgaria - - - - - - -
Indonesia 396 258 142 70 46 12 -
Malaysia - - - - - - -
Nigeria 1064 1165 204 356 411 46 -42.9
Oman - - - - - - -
Qatar 3678 2611 615 589 571 18 -93.7
Russian Federation - - - - - - -
Tunisia - - - - - - -
Ukraine - - - - - - -
Other Import Areas1 10257 8979 2259 2780 1560 514 x
Total Imports (Entries) 15647 13856 3234 4229 2975 597 -33.9
1. For regional breakdown, see appendix.
2. Percentage change over corresponding period (beginning of year to current month) of previous year.
x: Not applicable
For country specific notes on data, please see the geographical notes in the appendix.
© OECD/IEA, 2014 INTERNATIONAL ENERGY AGENCY
MONTHLY NATURAL GAS SURVEY - 15
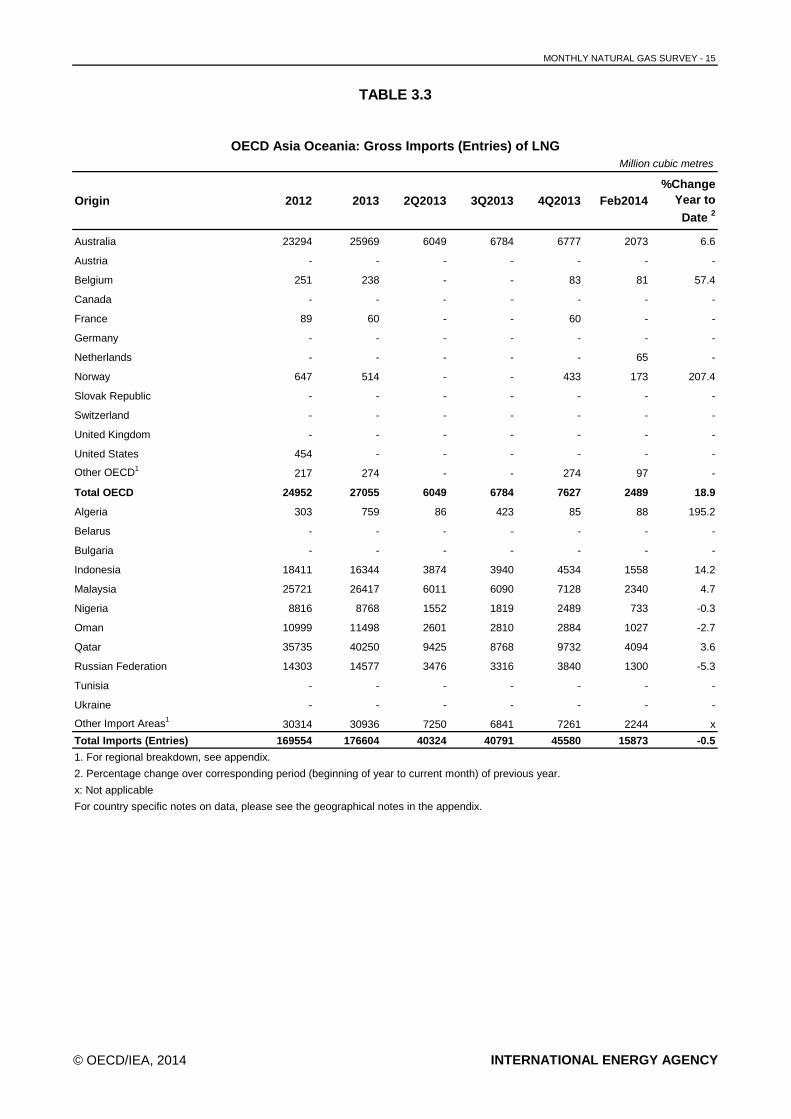
TABLE 3.3
OECD Asia Oceania: Gross Imports (Entries) of LNGMillion cubic metres
Origin 2012 2013 2Q2013 3Q2013 4Q2013 Feb2014%Change
Year to
Date 2
Australia 23294 25969 6049 6784 6777 2073 6.6
Austria - - - - - - -
Belgium 251 238 - - 83 81 57.4
Canada - - - - - - -
France 89 60 - - 60 - -
Germany - - - - - - -
Netherlands - - - - - 65 -
Norway 647 514 - - 433 173 207.4
Slovak Republic - - - - - - -
Switzerland - - - - - - -
United Kingdom - - - - - - -
United States 454 - - - - - -
Other OECD1 217 274 - - 274 97 -
Total OECD 24952 27055 6049 6784 7627 2489 18.9
Algeria 303 759 86 423 85 88 195.2
Belarus - - - - - - -
Bulgaria - - - - - - -
Indonesia 18411 16344 3874 3940 4534 1558 14.2
Malaysia 25721 26417 6011 6090 7128 2340 4.7
Nigeria 8816 8768 1552 1819 2489 733 -0.3
Oman 10999 11498 2601 2810 2884 1027 -2.7
Qatar 35735 40250 9425 8768 9732 4094 3.6
Russian Federation 14303 14577 3476 3316 3840 1300 -5.3
Tunisia - - - - - - -
Ukraine - - - - - - -
Other Import Areas1 30314 30936 7250 6841 7261 2244 x
Total Imports (Entries) 169554 176604 40324 40791 45580 15873 -0.5
1. For regional breakdown, see appendix.
2. Percentage change over corresponding period (beginning of year to current month) of previous year.
x: Not applicable
For country specific notes on data, please see the geographical notes in the appendix.
© OECD/IEA, 2014 INTERNATIONAL ENERGY AGENCY
MONTHLY NATURAL GAS SURVEY - 16
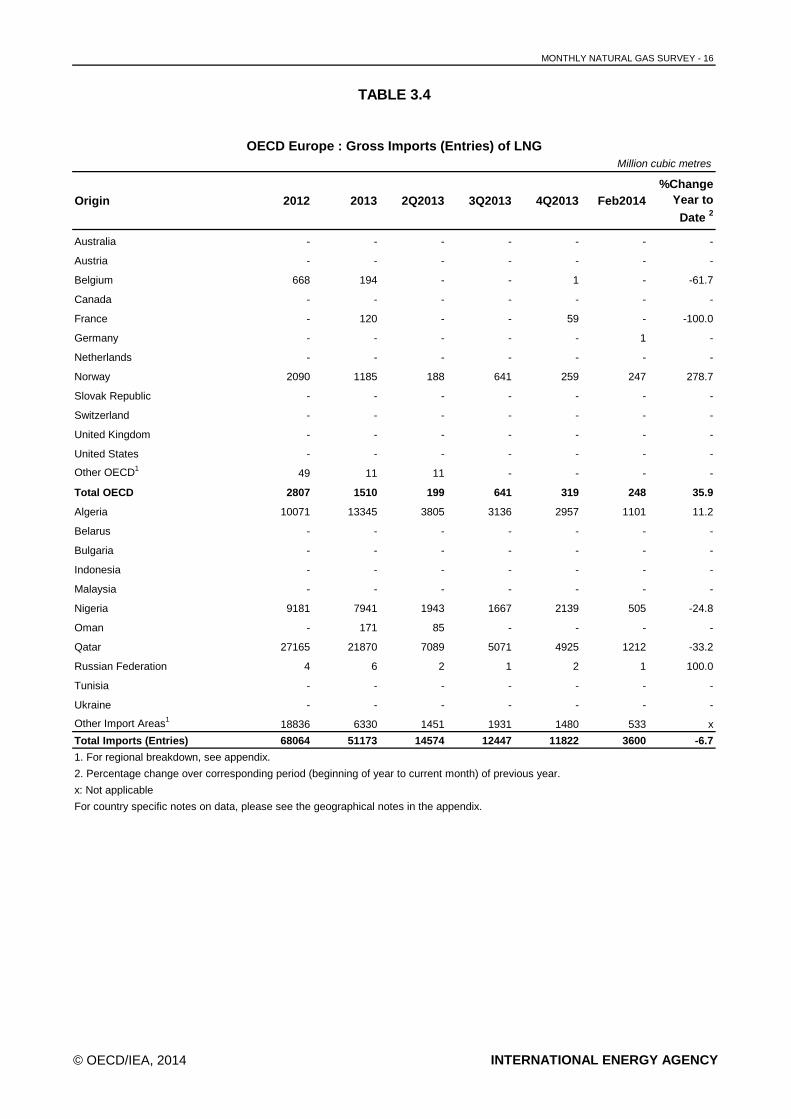
TABLE 3.4
OECD Europe : Gross Imports (Entries) of LNGMillion cubic metres
Origin 2012 2013 2Q2013 3Q2013 4Q2013 Feb2014%Change
Year to
Date 2
Australia - - - - - - -
Austria - - - - - - -
Belgium 668 194 - - 1 - -61.7
Canada - - - - - - -
France - 120 - - 59 - -100.0
Germany - - - - - 1 -
Netherlands - - - - - - -
Norway 2090 1185 188 641 259 247 278.7
Slovak Republic - - - - - - -
Switzerland - - - - - - -
United Kingdom - - - - - - -
United States - - - - - - -
Other OECD1 49 11 11 - - - -
Total OECD 2807 1510 199 641 319 248 35.9
Algeria 10071 13345 3805 3136 2957 1101 11.2
Belarus - - - - - - -
Bulgaria - - - - - - -
Indonesia - - - - - - -
Malaysia - - - - - - -
Nigeria 9181 7941 1943 1667 2139 505 -24.8
Oman - 171 85 - - - -
Qatar 27165 21870 7089 5071 4925 1212 -33.2
Russian Federation 4 6 2 1 2 1 100.0
Tunisia - - - - - - -
Ukraine - - - - - - -
Other Import Areas1 18836 6330 1451 1931 1480 533 x
Total Imports (Entries) 68064 51173 14574 12447 11822 3600 -6.7
1. For regional breakdown, see appendix.
2. Percentage change over corresponding period (beginning of year to current month) of previous year.
x: Not applicable
For country specific notes on data, please see the geographical notes in the appendix.
© OECD/IEA, 2014 INTERNATIONAL ENERGY AGENCY
MONTHLY NATURAL GAS SURVEY - 17
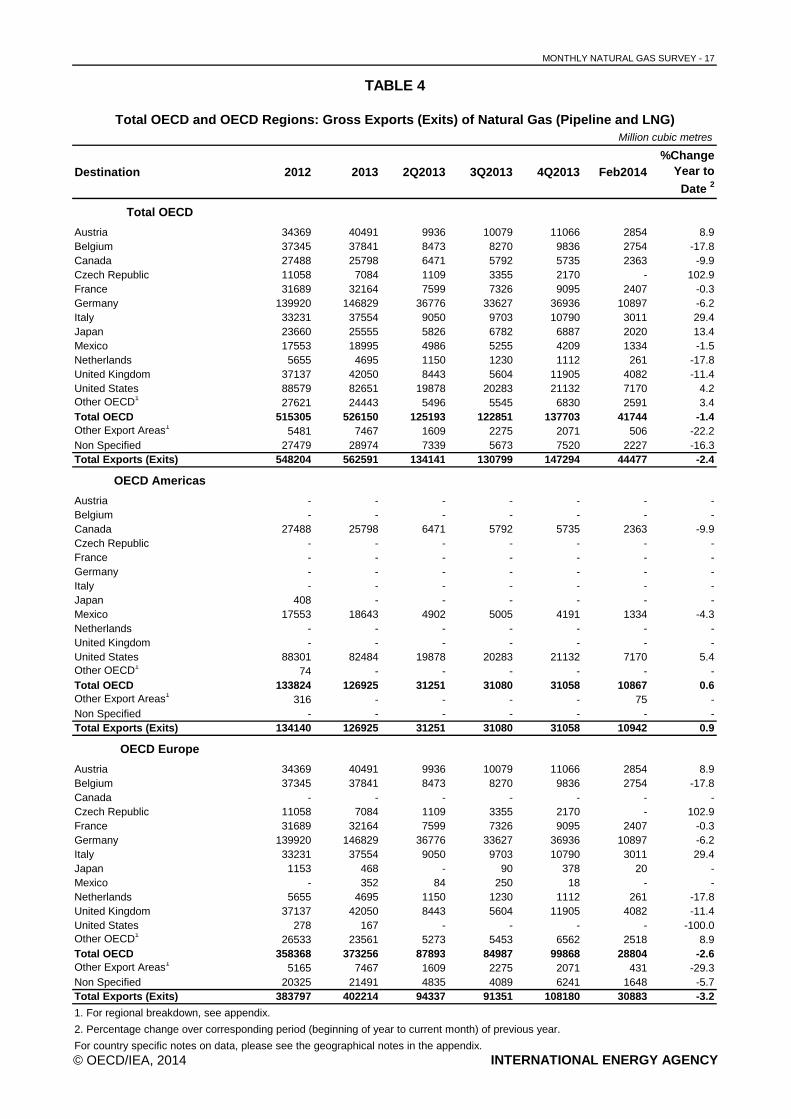
TABLE 4
Total OECD and OECD Regions: Gross Exports (Exits) of Natural Gas (Pipeline and LNG)Million cubic metres
Destination 2012 2013 2Q2013 3Q2013 4Q2013 Feb2014%Change
Year to
Date 2
Total OECD
Austria 34369 40491 9936 10079 11066 2854 8.9Belgium 37345 37841 8473 8270 9836 2754 -17.8Canada 27488 25798 6471 5792 5735 2363 -9.9Czech Republic 11058 7084 1109 3355 2170 - 102.9France 31689 32164 7599 7326 9095 2407 -0.3Germany 139920 146829 36776 33627 36936 10897 -6.2Italy 33231 37554 9050 9703 10790 3011 29.4Japan 23660 25555 5826 6782 6887 2020 13.4Mexico 17553 18995 4986 5255 4209 1334 -1.5Netherlands 5655 4695 1150 1230 1112 261 -17.8United Kingdom 37137 42050 8443 5604 11905 4082 -11.4United States 88579 82651 19878 20283 21132 7170 4.2Other OECD1 27621 24443 5496 5545 6830 2591 3.4Total OECD 515305 526150 125193 122851 137703 41744 -1.4Other Export Areas1 5481 7467 1609 2275 2071 506 -22.2Non Specified 27479 28974 7339 5673 7520 2227 -16.3Total Exports (Exits) 548204 562591 134141 130799 147294 44477 -2.4
OECD Americas
Austria - - - - - - -Belgium - - - - - - -Canada 27488 25798 6471 5792 5735 2363 -9.9Czech Republic - - - - - - -France - - - - - - -Germany - - - - - - -Italy - - - - - - -Japan 408 - - - - - -Mexico 17553 18643 4902 5005 4191 1334 -4.3Netherlands - - - - - - -United Kingdom - - - - - - -United States 88301 82484 19878 20283 21132 7170 5.4Other OECD1 74 - - - - - -Total OECD 133824 126925 31251 31080 31058 10867 0.6Other Export Areas1 316 - - - - 75 -Non Specified - - - - - - -Total Exports (Exits) 134140 126925 31251 31080 31058 10942 0.9
OECD Europe
Austria 34369 40491 9936 10079 11066 2854 8.9Belgium 37345 37841 8473 8270 9836 2754 -17.8Canada - - - - - - -Czech Republic 11058 7084 1109 3355 2170 - 102.9France 31689 32164 7599 7326 9095 2407 -0.3Germany 139920 146829 36776 33627 36936 10897 -6.2Italy 33231 37554 9050 9703 10790 3011 29.4Japan 1153 468 - 90 378 20 -Mexico - 352 84 250 18 - -Netherlands 5655 4695 1150 1230 1112 261 -17.8United Kingdom 37137 42050 8443 5604 11905 4082 -11.4United States 278 167 - - - - -100.0Other OECD1 26533 23561 5273 5453 6562 2518 8.9Total OECD 358368 373256 87893 84987 99868 28804 -2.6Other Export Areas1 5165 7467 1609 2275 2071 431 -29.3Non Specified 20325 21491 4835 4089 6241 1648 -5.7Total Exports (Exits) 383797 402214 94337 91351 108180 30883 -3.2
1. For regional breakdown, see appendix.
2. Percentage change over corresponding period (beginning of year to current month) of previous year.
For country specific notes on data, please see the geographical notes in the appendix.© OECD/IEA, 2014 INTERNATIONAL ENERGY AGENCY
MONTHLY NATURAL GAS SURVEY - 18
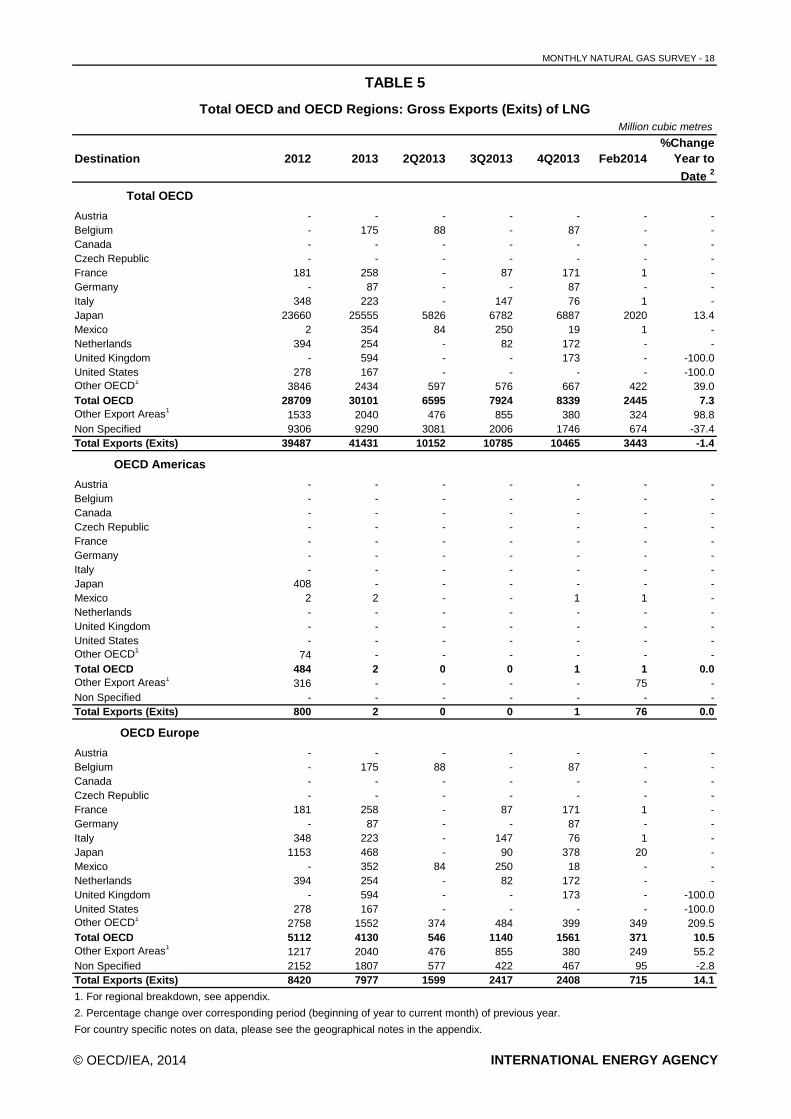
TABLE 5
Total OECD and OECD Regions: Gross Exports (Exits) of LNGMillion cubic metres
Destination 2012 2013 2Q2013 3Q2013 4Q2013 Feb2014%Change
Year to
Date 2
Total OECD
Austria - - - - - - -Belgium - 175 88 - 87 - -Canada - - - - - - -Czech Republic - - - - - - -France 181 258 - 87 171 1 -Germany - 87 - - 87 - -Italy 348 223 - 147 76 1 -Japan 23660 25555 5826 6782 6887 2020 13.4Mexico 2 354 84 250 19 1 -Netherlands 394 254 - 82 172 - -United Kingdom - 594 - - 173 - -100.0United States 278 167 - - - - -100.0Other OECD1 3846 2434 597 576 667 422 39.0Total OECD 28709 30101 6595 7924 8339 2445 7.3Other Export Areas1 1533 2040 476 855 380 324 98.8Non Specified 9306 9290 3081 2006 1746 674 -37.4Total Exports (Exits) 39487 41431 10152 10785 10465 3443 -1.4
OECD Americas
Austria - - - - - - -Belgium - - - - - - -Canada - - - - - - -Czech Republic - - - - - - -France - - - - - - -Germany - - - - - - -Italy - - - - - - -Japan 408 - - - - - -Mexico 2 2 - - 1 1 -Netherlands - - - - - - -United Kingdom - - - - - - -United States - - - - - - -Other OECD1 74 - - - - - -Total OECD 484 2 0 0 1 1 0.0Other Export Areas1 316 - - - - 75 -Non Specified - - - - - - -Total Exports (Exits) 800 2 0 0 1 76 0.0
OECD Europe
Austria - - - - - - -Belgium - 175 88 - 87 - -Canada - - - - - - -Czech Republic - - - - - - -France 181 258 - 87 171 1 -Germany - 87 - - 87 - -Italy 348 223 - 147 76 1 -Japan 1153 468 - 90 378 20 -Mexico - 352 84 250 18 - -Netherlands 394 254 - 82 172 - -United Kingdom - 594 - - 173 - -100.0United States 278 167 - - - - -100.0Other OECD1 2758 1552 374 484 399 349 209.5Total OECD 5112 4130 546 1140 1561 371 10.5Other Export Areas1 1217 2040 476 855 380 249 55.2Non Specified 2152 1807 577 422 467 95 -2.8Total Exports (Exits) 8420 7977 1599 2417 2408 715 14.1
1. For regional breakdown, see appendix.
2. Percentage change over corresponding period (beginning of year to current month) of previous year.
For country specific notes on data, please see the geographical notes in the appendix.
© OECD/IEA, 2014 INTERNATIONAL ENERGY AGENCY
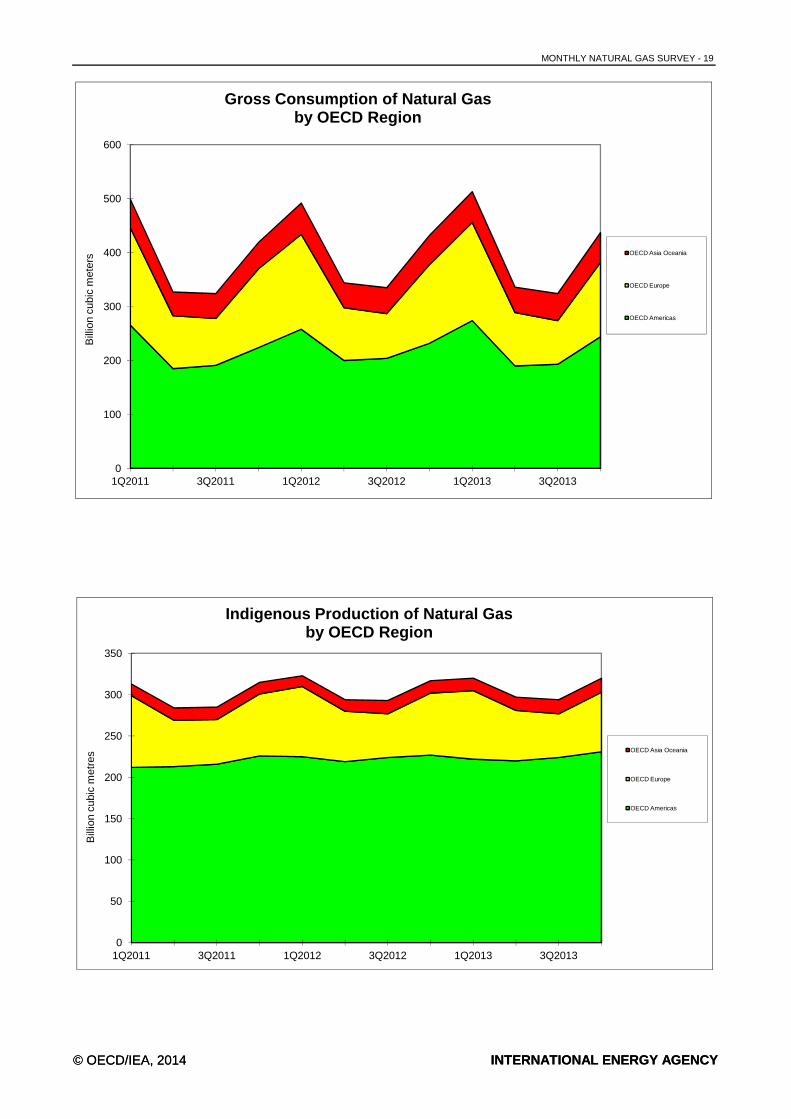
MONTHLY NATURAL GAS SURVEY - 19
0
100
200
300
400
500
600
1Q2011 3Q2011 1Q2012 3Q2012 1Q2013 3Q2013
Bill
ion
cubi
c m
eter
sGross Consumption of Natural Gas
by OECD Region
OECD Asia Oceania
OECD Europe
OECD Americas
© OECD/IEA, 2014 INTERNATIONAL ENERGY AGENCY
0
50
100
150
200
250
300
350
1Q2011 3Q2011 1Q2012 3Q2012 1Q2013 3Q2013
Bill
ion
cubi
c m
etre
s
Indigenous Production of Natural Gasby OECD Region
OECD Asia Oceania
OECD Europe
OECD Americas
© OECD/IEA, 2014 INTERNATIONAL ENERGY AGENCY
MONTHLY GAS SURVEY - 20
APPENDIX
Geographical Notes
This document and any map included herein are without prejudice to the status of or sovereignty over anyterritory, to the delimitation of international frontiers and boundaries, and to the name of any territory, cityor area.
- Israel: The statistical data for Israel are supplied by and under the responsibility ofthe relevant Israeli authorities. The use of such data by the OECD is withoutprejudice to the status of the Golan Heights, East Jerusalem and Israelisettlements in the West Bank under the terms of international law.
TABLES 2, 3 : IMPORTS (ENTRIES)
- Other OECD : Chile, Czech Republic, Denmark, Estonia, Finland, Greece, Hungary,Iceland, Ireland, Israel, Italy, Japan, Korea, Luxembourg, Mexico,New Zealand, Poland, Portugal, Slovenia, Spain, Sweden, Turkey.
- Other Import Areas : Argentina, Azerbaijan, Brunei, Croatia, Egypt, Equatorial Guinea, Georgia, Iran, Latvia, Libya, Morocco, Peru, Trinidad and Tobago,
United Arab Emirates, Yemen.
TABLES 4, 5 : EXPORTS (EXITS)
- Other OECD : Australia, Chile, Denmark, Estonia, Finland, Greece, Hungary, Iceland,Ireland, Israel, Korea, Luxembourg, New Zealand, Norway, Poland, PortugalSlovak Republic, Slovenia, Spain, Sweden, Switzerland, Turkey.
- Other Export Areas : Argentina, Brazil, People’s Republic of China, Croatia, Dominican Republic, India, Kuwait, Romania, Serbia, Chinese Taipei, Ukraine.
For country specific notes on data, please see the geographical notes.
© OECD/IEA, 2014 INTERNATIONAL ENERGY AGENCY