Embed Size (px)
Citation preview
3Q 2019
International CSRC Investment Holdings Co.
INVESTOR'S CONFERENCE
Disclaimer
The forward-looking statements contained in this presentation are subject to risks
and uncertainties and actual results may differ materially from those expressed or
implied in these forward-looking statements.
International CSRC Investment Holdings Co. makes no representation or warranty
as to the accuracy or completeness of these forward-looking statements and nor
does International CSRC Investment Holdings Co. undertake any obligation to
update any forward-looking statements, whether as a result of new information or
future events.
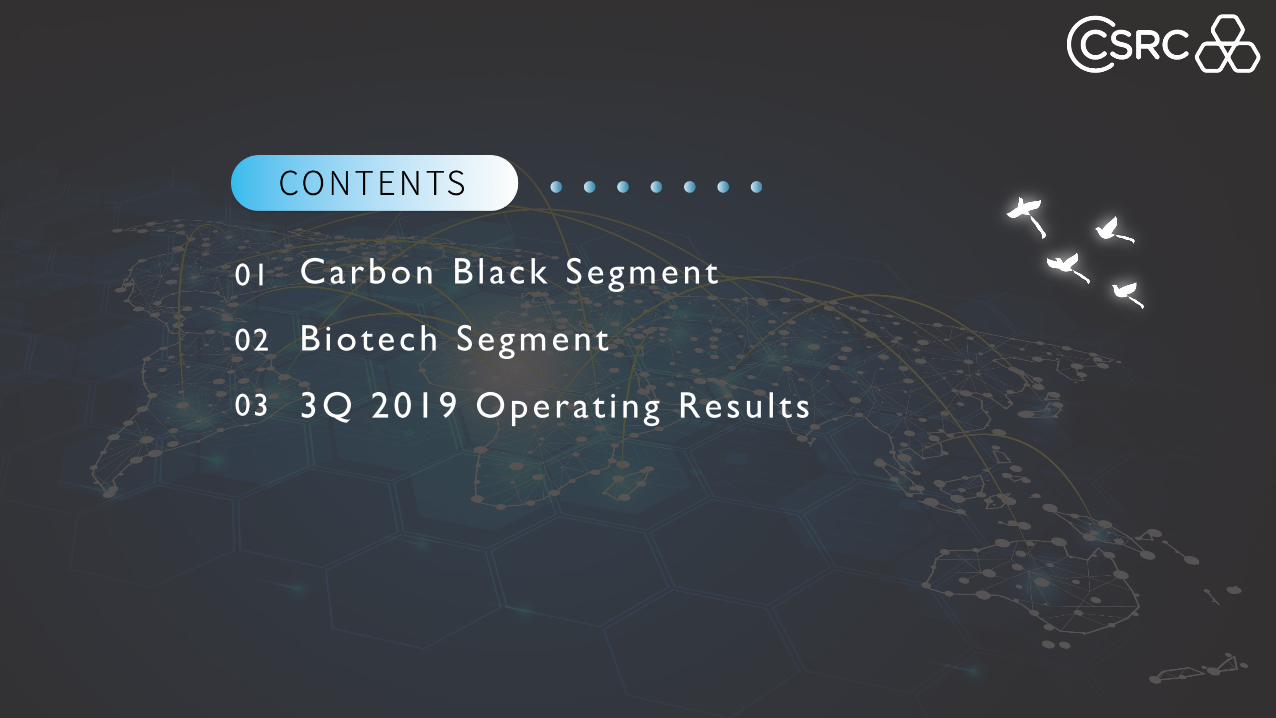
Carbon B lack Segment
Biotech Segment
3Q 2019 Operat ing Resu l ts
01
02
03
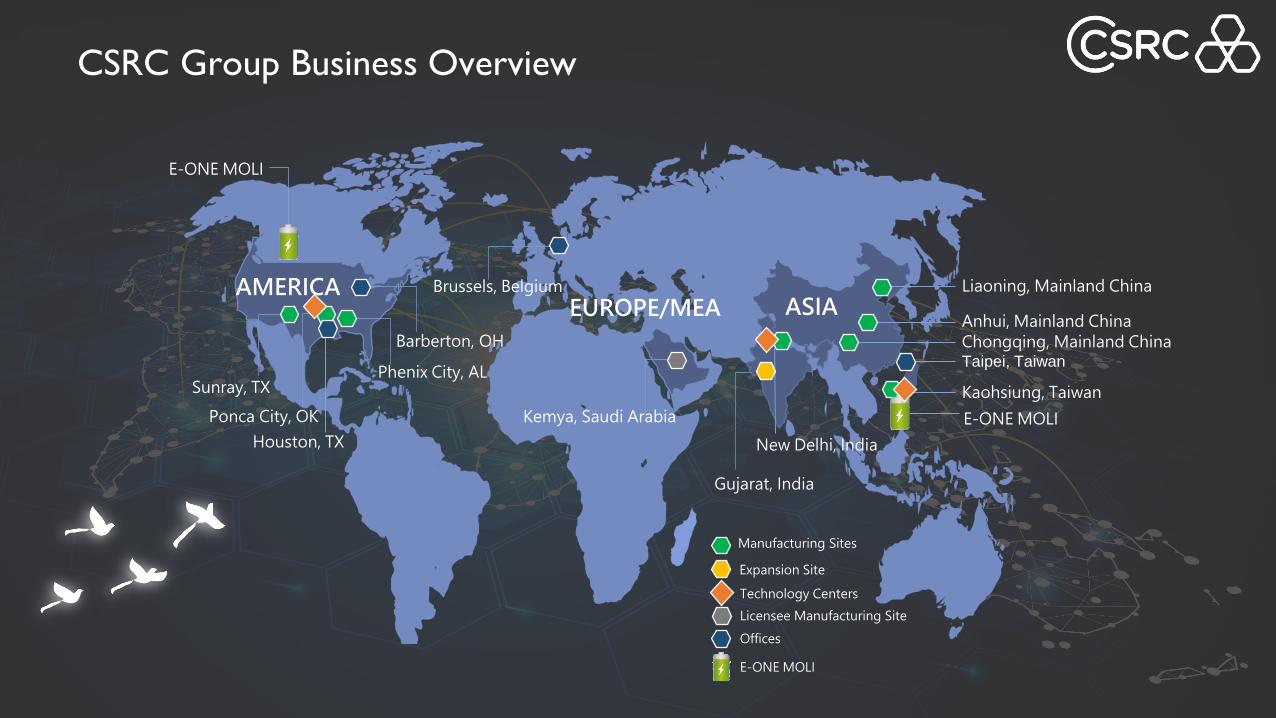
CSRC Group Business Overview
AMERICAEUROPE/MEA ASIA
Manufacturing Sites
Technology Centers
Licensee Manufacturing Site
Offices
Sunray, TX
Ponca City, OK
Houston, TX
Barberton, OH
Phenix City, AL
Brussels, Belgium
Kemya, Saudi Arabia
New Delhi, India
Liaoning, Mainland China
Anhui, Mainland China
Chongqing, Mainland ChinaTaipei, Taiwan
Kaohsiung, Taiwan
E-ONE MOLI
E-ONE MOLI
E-ONE MOLI
Gujarat, India
Expansion Site
Carbon Black Segment
O1
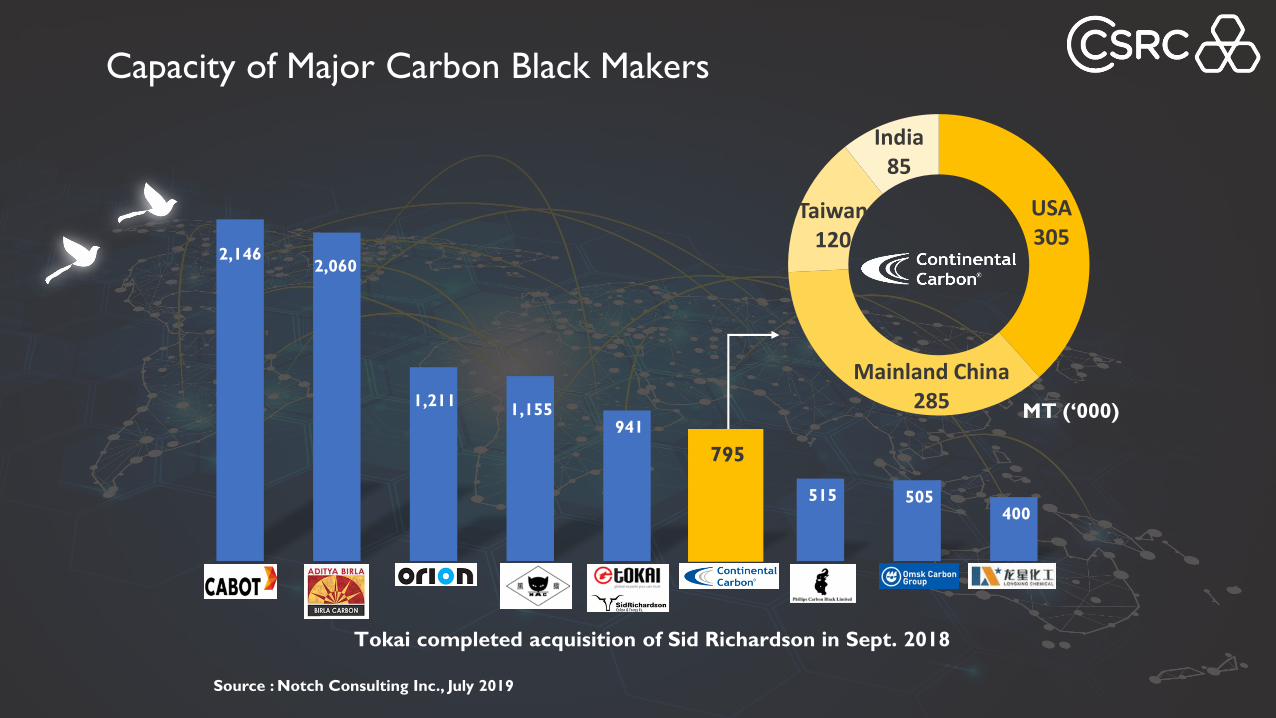
2,1462,060
1,211 1,155
941
795
515 505 400
Cabot Birla Orion Black Cat Tokai & Sid
Richardson
CSRC PCBL OMSK Longxing
Source : Notch Consulting Inc., July 2019
Tokai completed acquisition of Sid Richardson in Sept. 2018
Capacity of Major Carbon Black Makers
795
USA305
Mainland China285
Taiwan120
India85
MT (‘000)
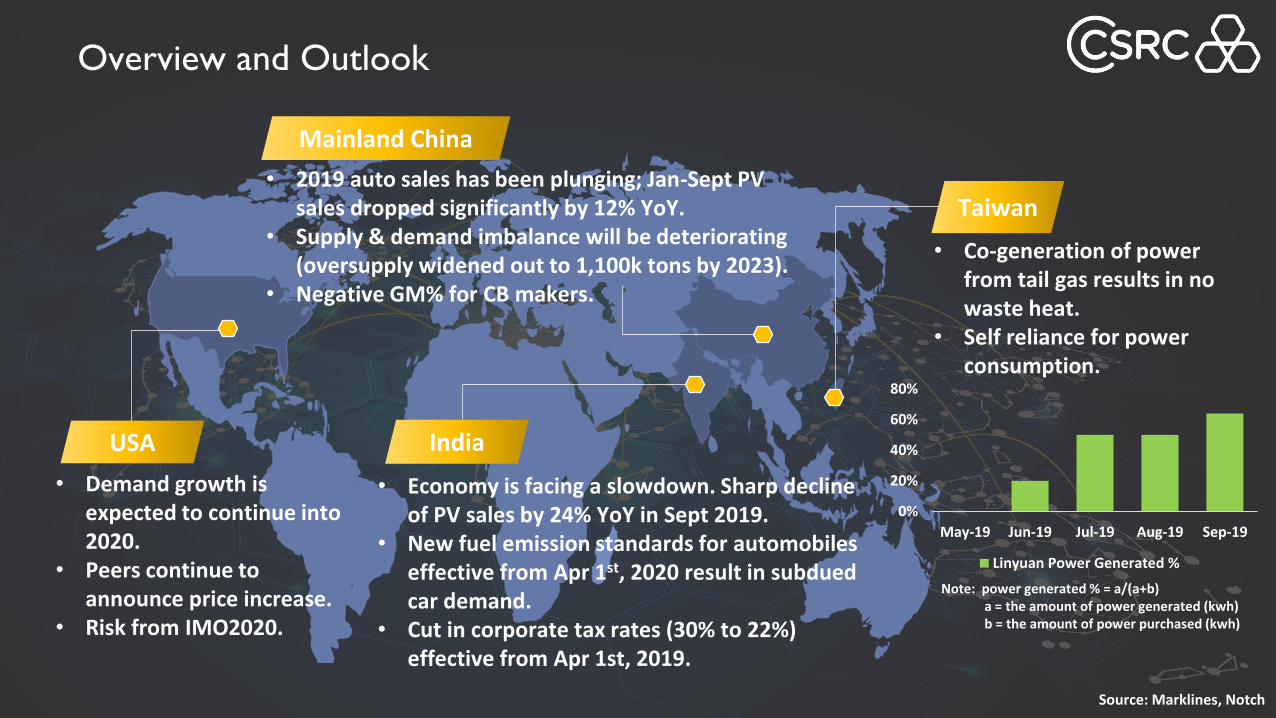
• Demand growth is expected to continue into 2020.
• Peers continue to announce price increase.
• Risk from IMO2020.
• 2019 auto sales has been plunging; Jan-Sept PV sales dropped significantly by 12% YoY.
• Supply & demand imbalance will be deteriorating(oversupply widened out to 1,100k tons by 2023).
• Negative GM% for CB makers.
• Economy is facing a slowdown. Sharp decline of PV sales by 24% YoY in Sept 2019.
• New fuel emission standards for automobiles effective from Apr 1st, 2020 result in subdued car demand.
• Cut in corporate tax rates (30% to 22%) effective from Apr 1st, 2019.
• Co-generation of power from tail gas results in no waste heat.
• Self reliance for power consumption.
Overview and Outlook
0%
20%
40%
60%
80%
May-19 Jun-19 Jul-19 Aug-19 Sep-19
Linyuan Power Generated %
Note: power generated % = a/(a+b)a = the amount of power generated (kwh)b = the amount of power purchased (kwh)
USA India
Mainland China
Taiwan
Source: Marklines, Notch
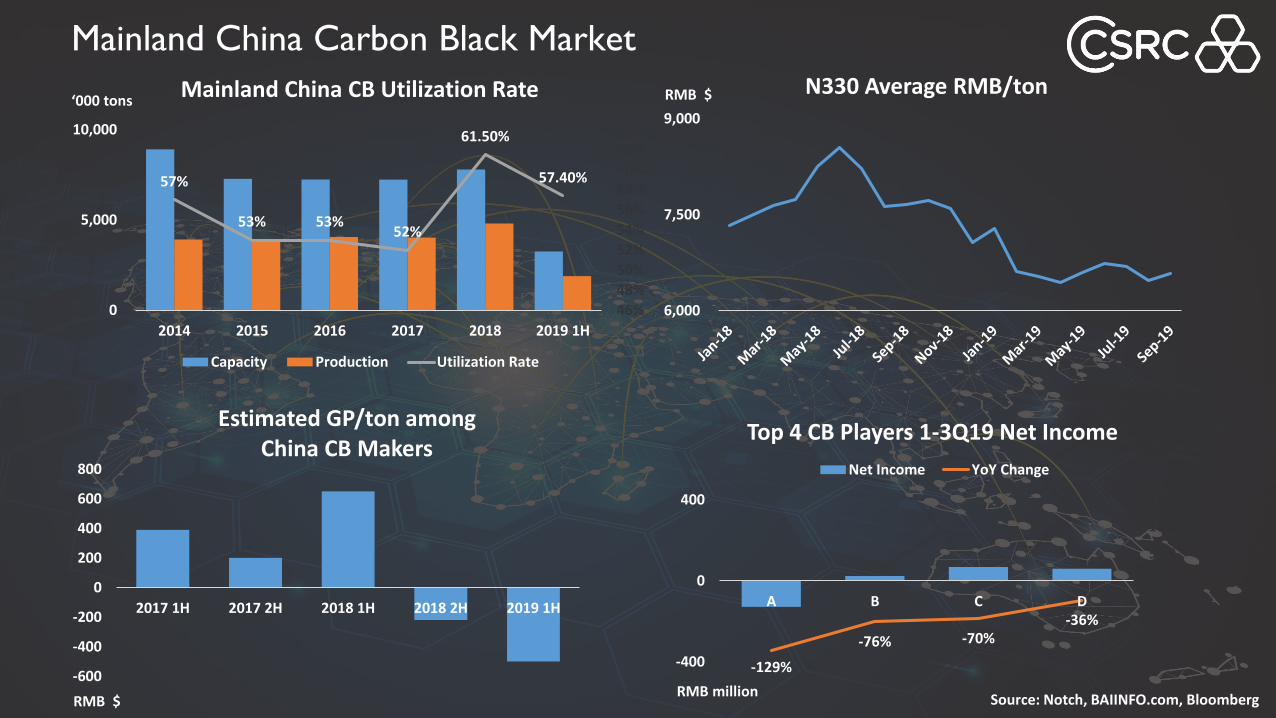
Mainland China Carbon Black Market
57%
53% 53%52%
61.50%
57.40%
46%
48%
50%
52%
54%
56%
58%
60%
62%
64%
0
5,000
10,000
2014 2015 2016 2017 2018 2019 1H
Mainland China CB Utilization Rate
Capacity Production Utilization Rate
-600
-400
-200
0
200
400
600
800
2017 1H 2017 2H 2018 1H 2018 2H 2019 1H
Estimated GP/ton among China CB Makers
6,000
7,500
9,000
N330 Average RMB/ton
-129%
-76% -70%-36%
-150%
-100%
-50%
0%
50%
100%
150%
-400
0
400
A B C D
Top 4 CB Players 1-3Q19 Net Income
Net Income YoY Change
Source: Notch, BAIINFO.com, BloombergRMB million
‘000 tons
RMB $
RMB $
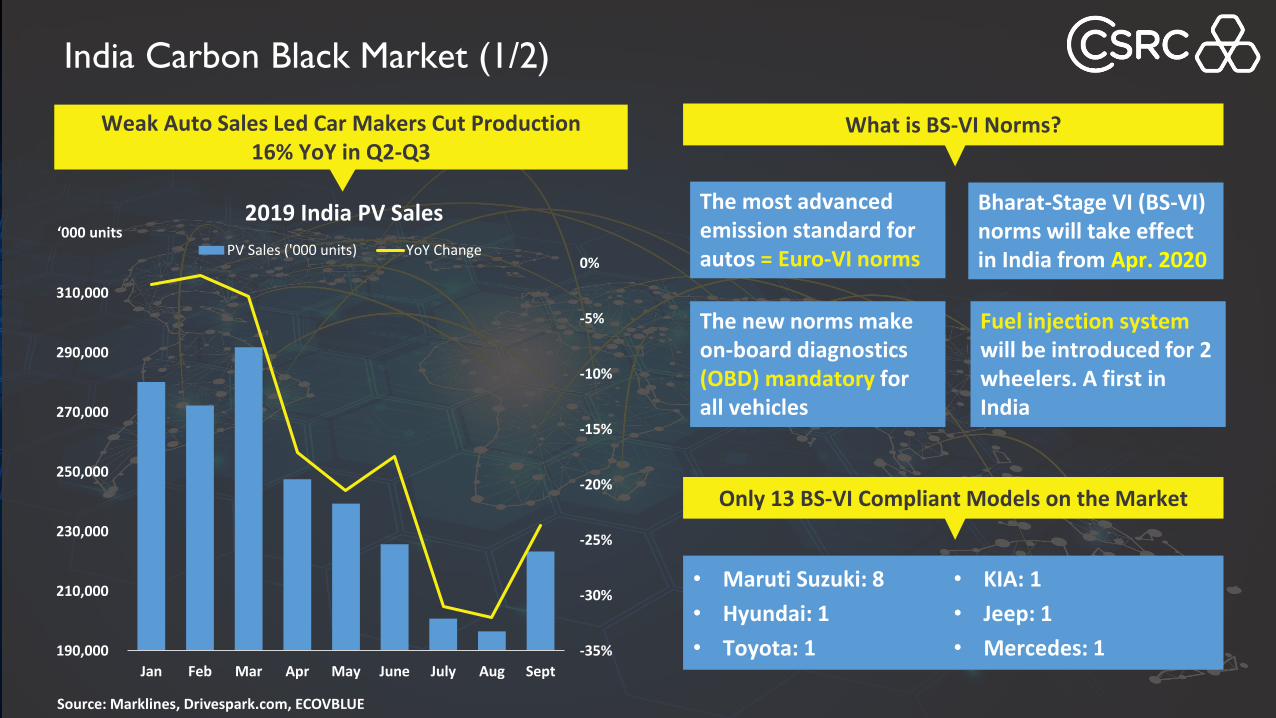
India Carbon Black Market (1/2)
-35%
-30%
-25%
-20%
-15%
-10%
-5%
0%
190,000
210,000
230,000
250,000
270,000
290,000
310,000
Jan Feb Mar Apr May June July Aug Sept
2019 India PV Sales
PV Sales ('000 units) YoY Change
Source: Marklines, Drivespark.com, ECOVBLUE
Weak Auto Sales Led Car Makers Cut Production 16% YoY in Q2-Q3
‘000 units
What is BS-VI Norms?
• Maruti Suzuki: 8
• Hyundai: 1
• Toyota: 1
• KIA: 1
• Jeep: 1
• Mercedes: 1
Bharat-Stage VI (BS-VI) norms will take effect in India from Apr. 2020
The most advanced emission standard for autos = Euro-VI norms
Only 13 BS-VI Compliant Models on the Market
The new norms make on-board diagnostics (OBD) mandatory for all vehicles
Fuel injection system will be introduced for 2 wheelers. A first in India
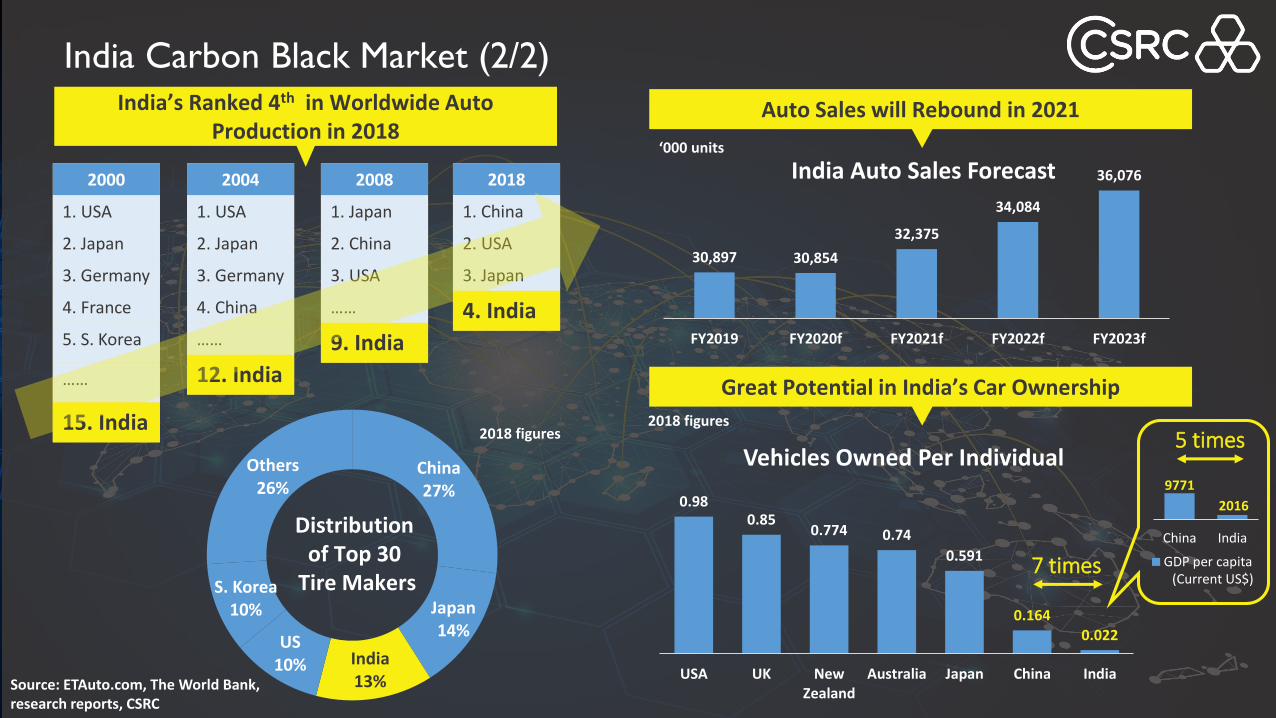
0.980.85
0.774 0.74
0.591
0.1640.022
USA UK NewZealand
Australia Japan China India
Vehicles Owned Per Individual
7 times
9771
2016500
10500
20500
China India
GDP per capita(Current US$)
5 times2018 figures
India Carbon Black Market (2/2)
Source: ETAuto.com, The World Bank,research reports, CSRC
India’s Ranked 4th in Worldwide Auto Production in 2018
2000
1. USA
2. Japan
3. Germany
4. France
5. S. Korea
……
15. India
2004
1. USA
2. Japan
3. Germany
4. China
……
12. India
2008
1. Japan
2. China
3. USA
……
9. India
2018
1. China
2. USA
3. Japan
4. India
30,897 30,854
32,375
34,084
36,076
FY2019 FY2020f FY2021f FY2022f FY2023f
India Auto Sales Forecast‘000 units
Auto Sales will Rebound in 2021
China27%
Japan14%
India13%
US10%
S. Korea10%
Others26%
Distribution of Top 30
Tire Makers
Great Potential in India’s Car Ownership
2018 figures
0
0.5
1
1.5
2
2.5
3
3.5
4
4.5
5
2005 2010 2015 2020 2025
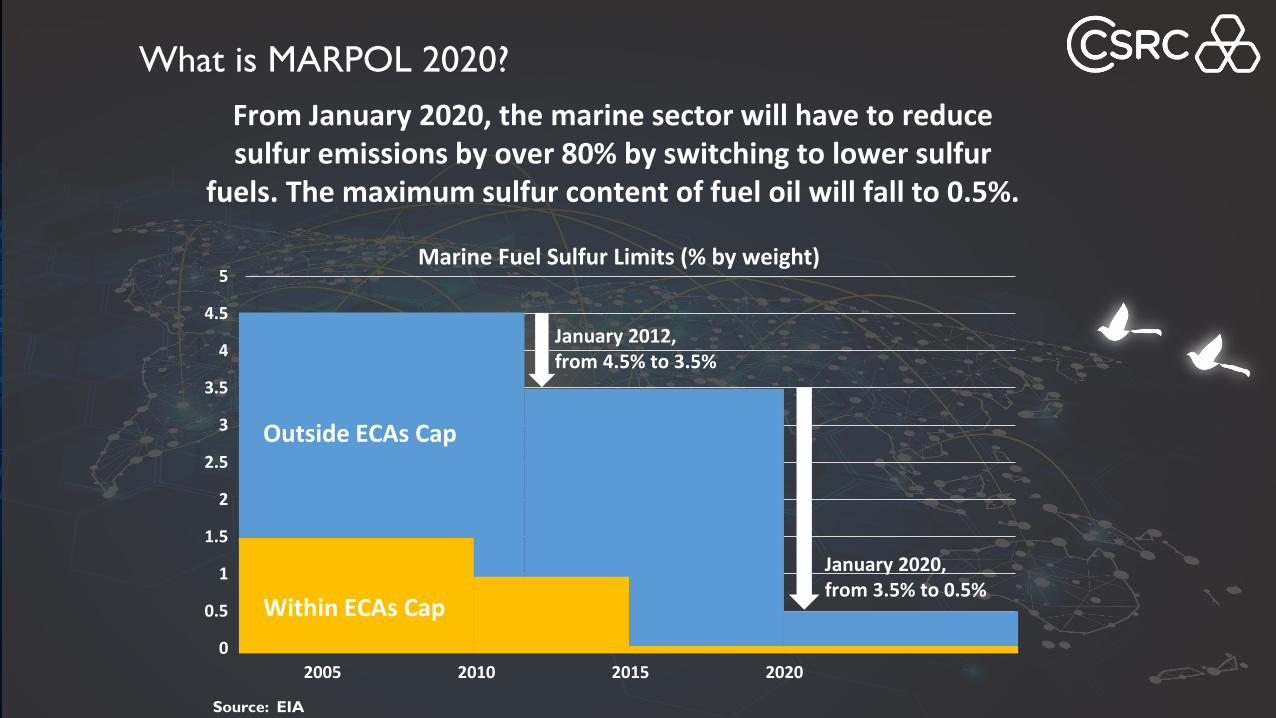
Marine Fuel Sulfur Limits (% by weight)
What is MARPOL 2020?
Outside ECAs Cap
Within ECAs Cap
January 2012, from 4.5% to 3.5%
January 2020, from 3.5% to 0.5%
From January 2020, the marine sector will have to reduce sulfur emissions by over 80% by switching to lower sulfur
fuels. The maximum sulfur content of fuel oil will fall to 0.5%.
Source: EIA
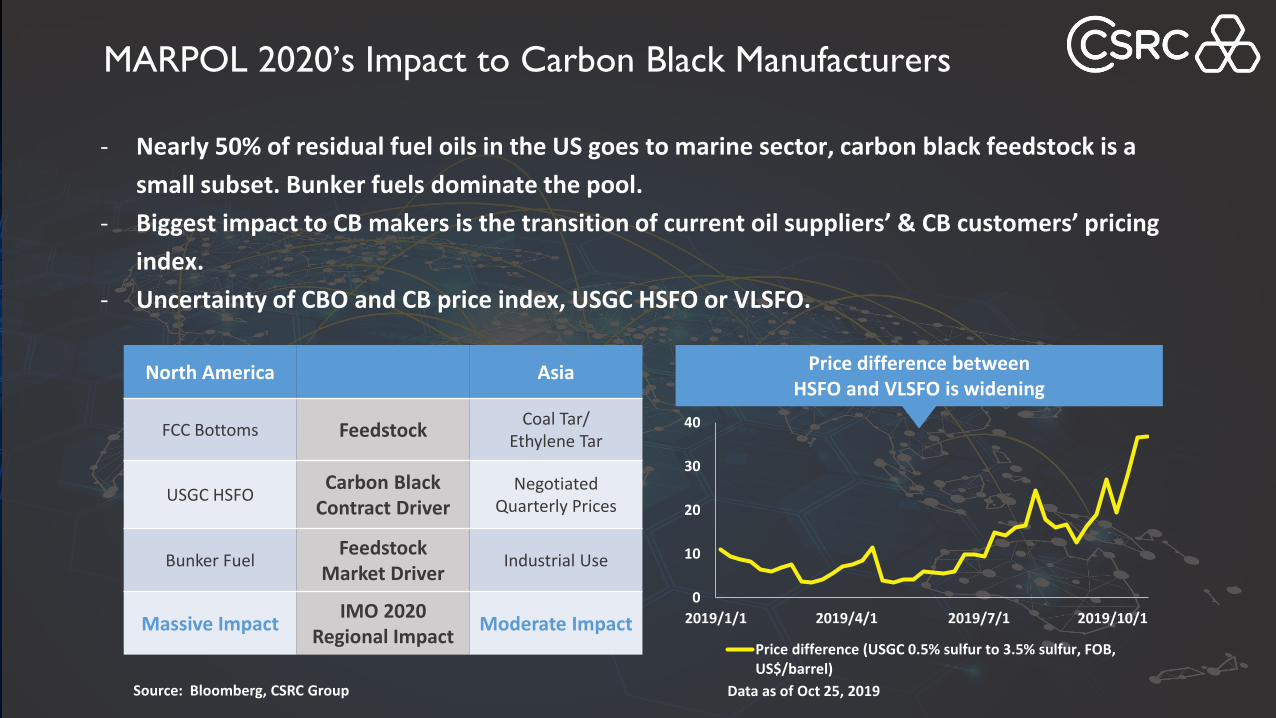
MARPOL 2020’s Impact to Carbon Black Manufacturers
- Nearly 50% of residual fuel oils in the US goes to marine sector, carbon black feedstock is a
small subset. Bunker fuels dominate the pool.
- Biggest impact to CB makers is the transition of current oil suppliers’ & CB customers’ pricing
index.
- Uncertainty of CBO and CB price index, USGC HSFO or VLSFO.
North America Asia
FCC Bottoms FeedstockCoal Tar/
Ethylene Tar
USGC HSFOCarbon Black
Contract DriverNegotiated
Quarterly Prices
Bunker FuelFeedstock
Market DriverIndustrial Use
Massive ImpactIMO 2020
Regional ImpactModerate Impact
Source: Bloomberg, CSRC Group
0
10
20
30
40
2019/1/1 2019/4/1 2019/7/1 2019/10/1
Price difference (USGC 0.5% sulfur to 3.5% sulfur, FOB,US$/barrel)
Data as of Oct 25, 2019
Price difference between HSFO and VLSFO is widening
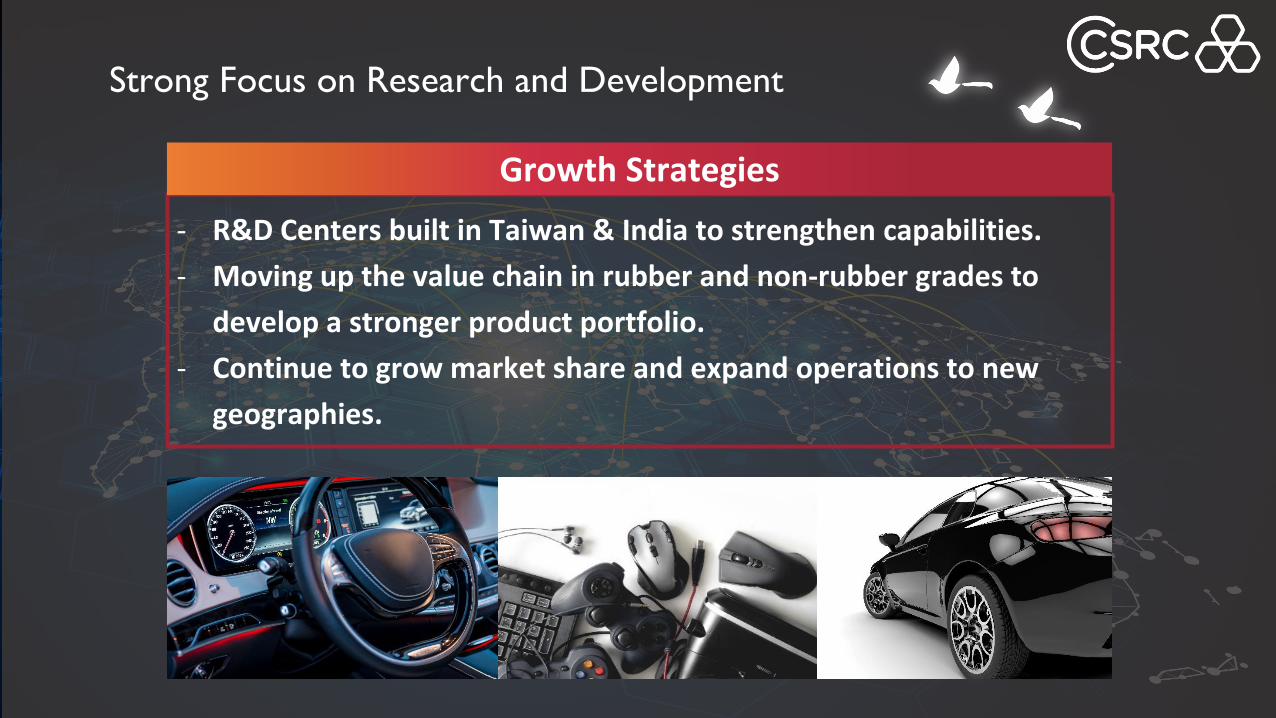
- R&D Centers built in Taiwan & India to strengthen capabilities.
- Moving up the value chain in rubber and non-rubber grades to
develop a stronger product portfolio.
- Continue to grow market share and expand operations to new
geographies.
Growth Strategies
Strong Focus on Research and Development
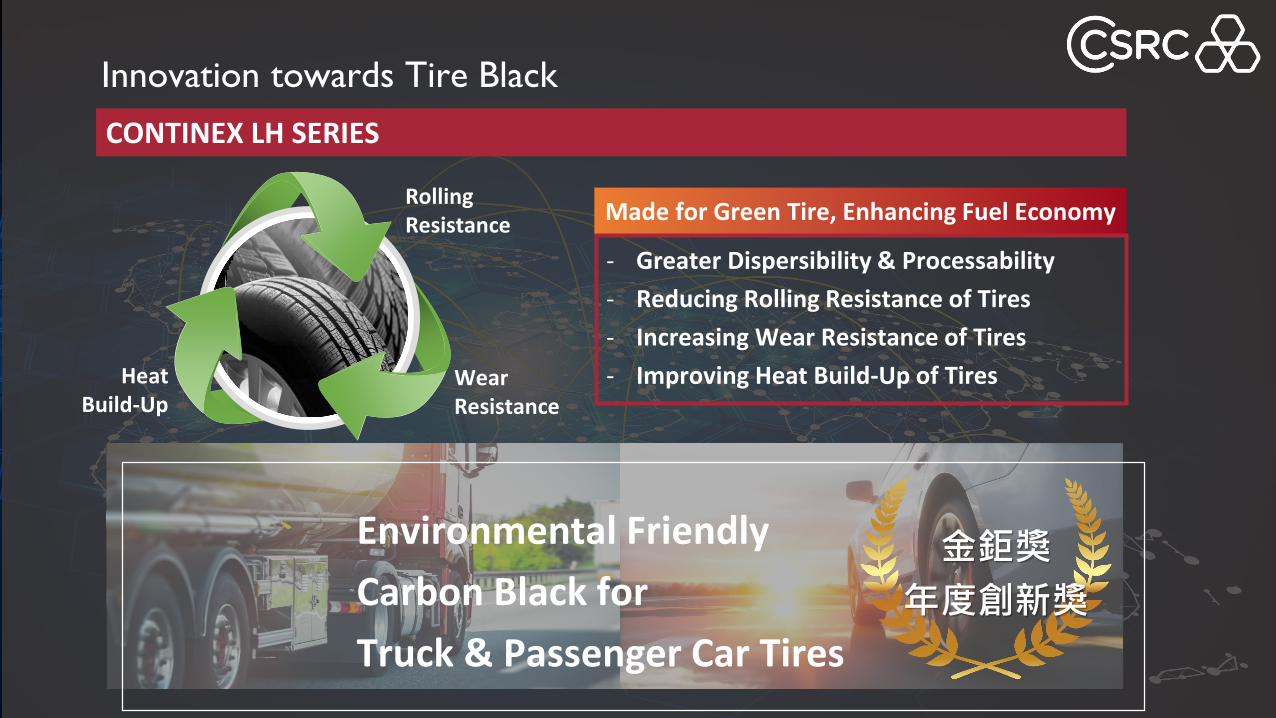
Innovation towards Tire Black
CONTINEX LH SERIES
Environmental Friendly
Carbon Black for
Truck & Passenger Car Tires
Made for Green Tire, Enhancing Fuel Economy
- Greater Dispersibility & Processability
- Reducing Rolling Resistance of Tires
- Increasing Wear Resistance of Tires
- Improving Heat Build-Up of Tires
金鉅獎
年度創新獎
Heat Build-Up
Rolling Resistance
Wear Resistance
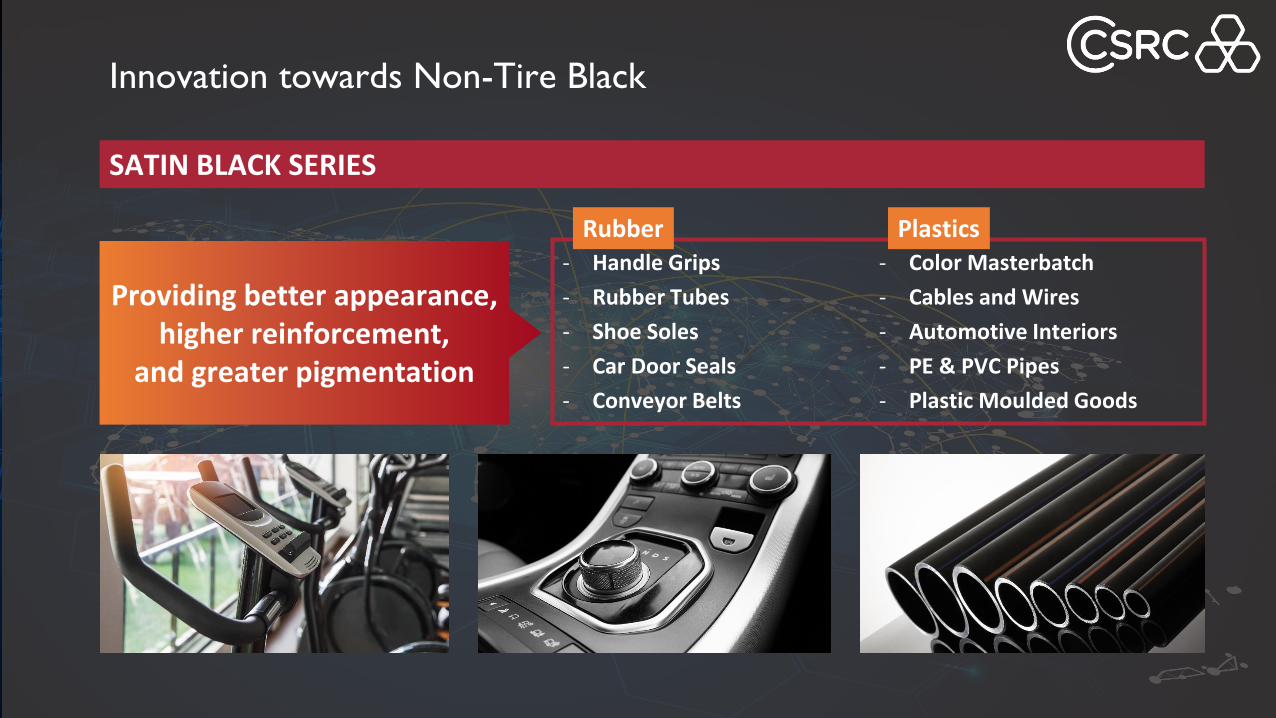
Innovation towards Non-Tire Black
SATIN BLACK SERIES
Providing better appearance, higher reinforcement,
and greater pigmentation
- Handle Grips
- Rubber Tubes
- Shoe Soles
- Car Door Seals
- Conveyor Belts
- Color Masterbatch
- Cables and Wires
- Automotive Interiors
- PE & PVC Pipes
- Plastic Moulded Goods
PlasticsRubber
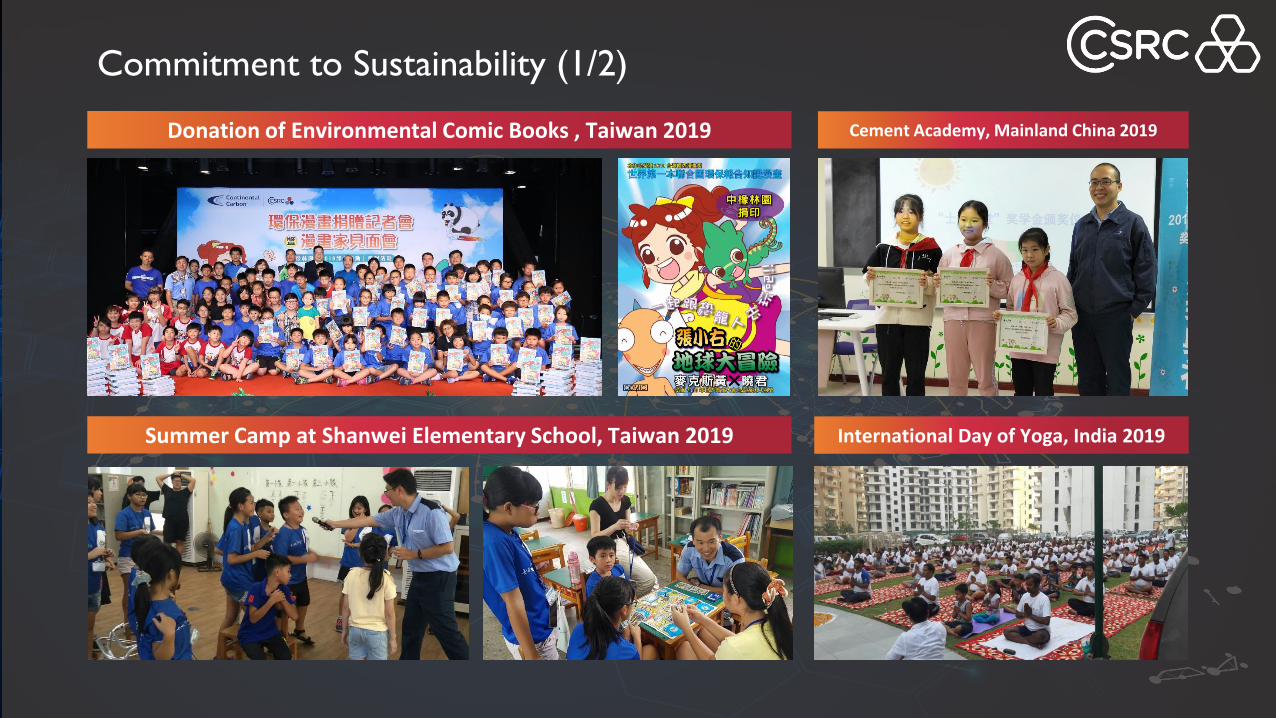
Summer Camp at Shanwei Elementary School, Taiwan 2019
Donation of Environmental Comic Books , Taiwan 2019
Commitment to Sustainability (1/2)
Cement Academy, Mainland China 2019
International Day of Yoga, India 2019
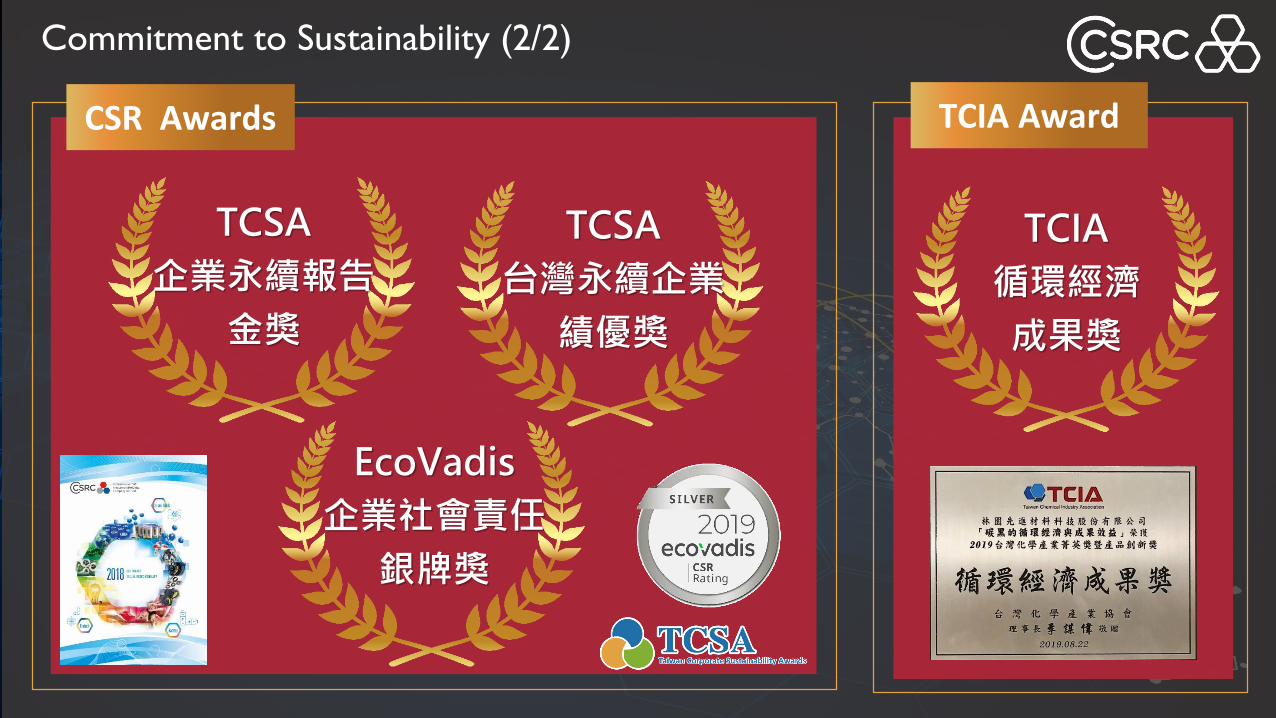
Commitment to Sustainability (2/2)
TCSA
企業永續報告
金獎
CSR Awards TCIA Award
TCSA
台灣永續企業
績優獎
EcoVadis
企業社會責任
銀牌獎
TCIA
循環經濟
成果獎
Biotech Segment
O2
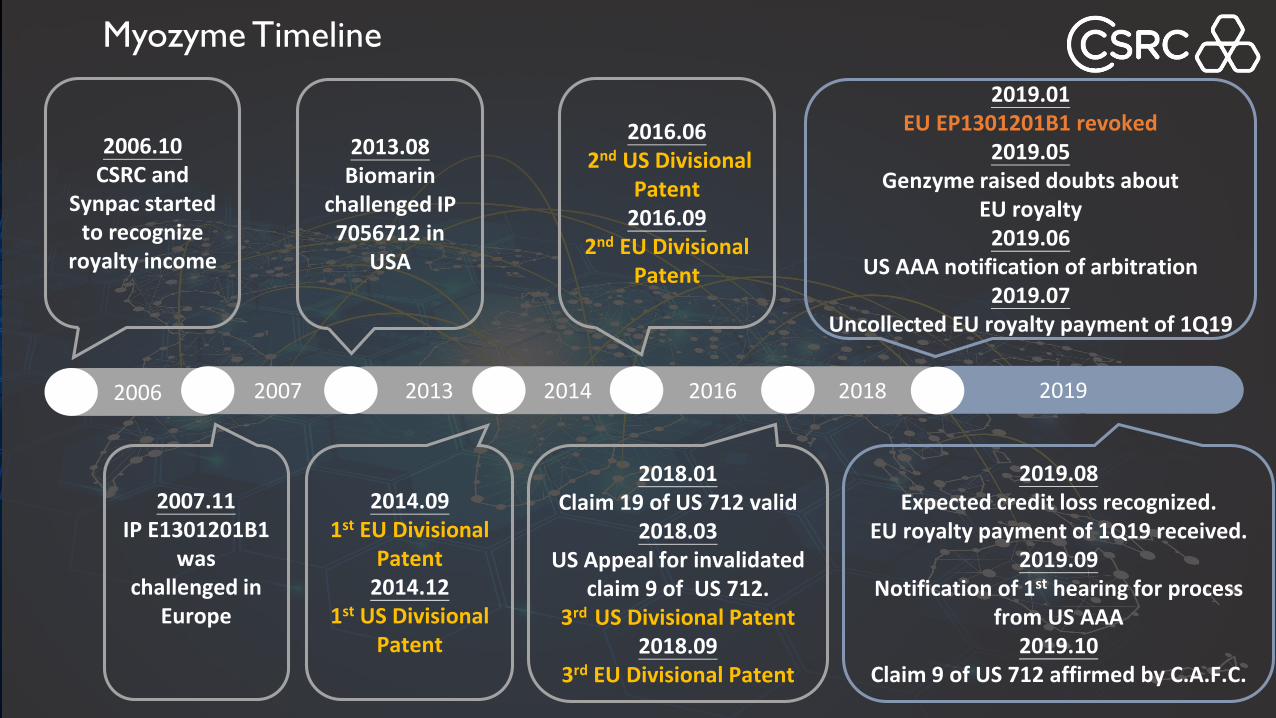
Myozyme Timeline
2007 2013
2007.11IP E1301201B1
was challenged in
Europe
2013.08Biomarin
challenged IP 7056712 in
USA
2014
2014.091st EU Divisional
Patent 2014.12
1st US Divisional Patent
2016
2016.062nd US Divisional
Patent 2016.09
2nd EU Divisional Patent
2018
2018.01Claim 19 of US 712 valid
2018.03US Appeal for invalidated
claim 9 of US 712.3rd US Divisional Patent
2018.093rd EU Divisional Patent
2019
2019.08Expected credit loss recognized.
EU royalty payment of 1Q19 received.2019.09
Notification of 1st hearing for process from US AAA
2019.10Claim 9 of US 712 affirmed by C.A.F.C.
2019.01EU EP1301201B1 revoked
2019.05Genzyme raised doubts about
EU royalty 2019.06
US AAA notification of arbitration2019.07
Uncollected EU royalty payment of 1Q19
2006
2006.10CSRC and
Synpac started to recognize
royalty income
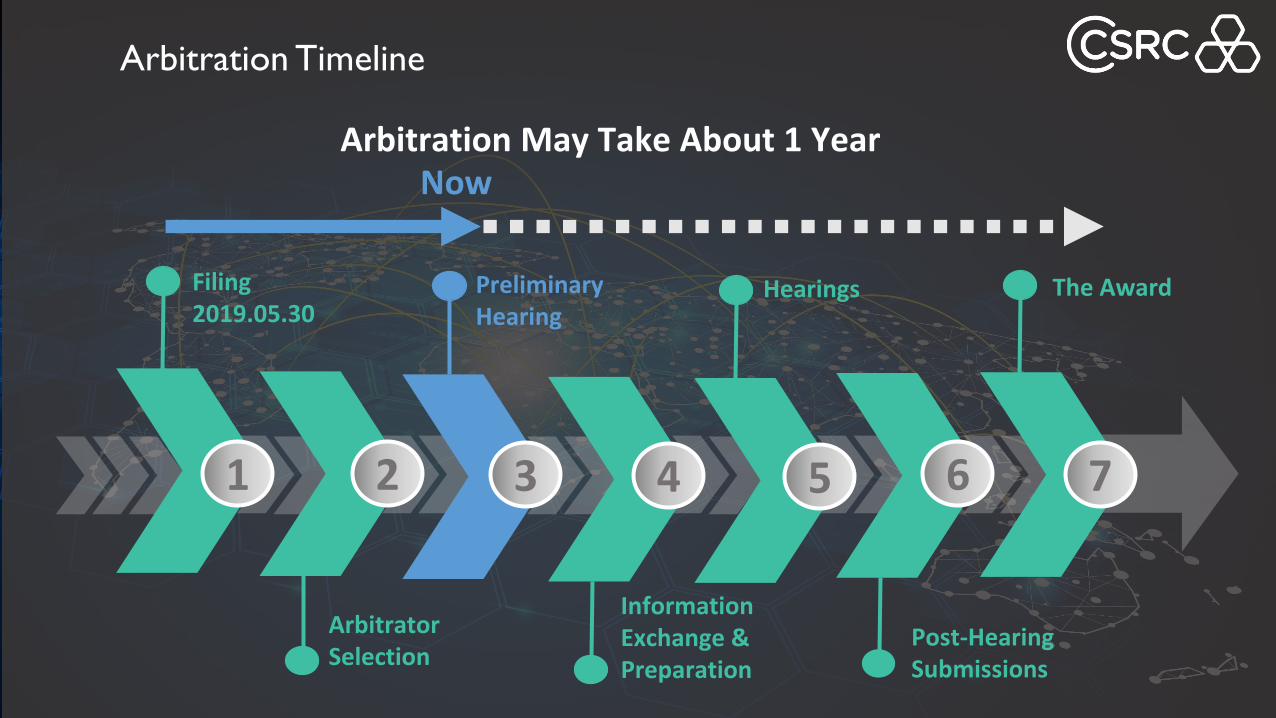
Arbitration Timeline
1 2 3 4 5 6 7
Filing2019.05.30
Arbitrator Selection
Preliminary Hearing
Information Exchange & Preparation
Hearings
Post-Hearing Submissions
The Award
NowArbitration May Take About 1 Year
3Q 2019 Operating Results
O3
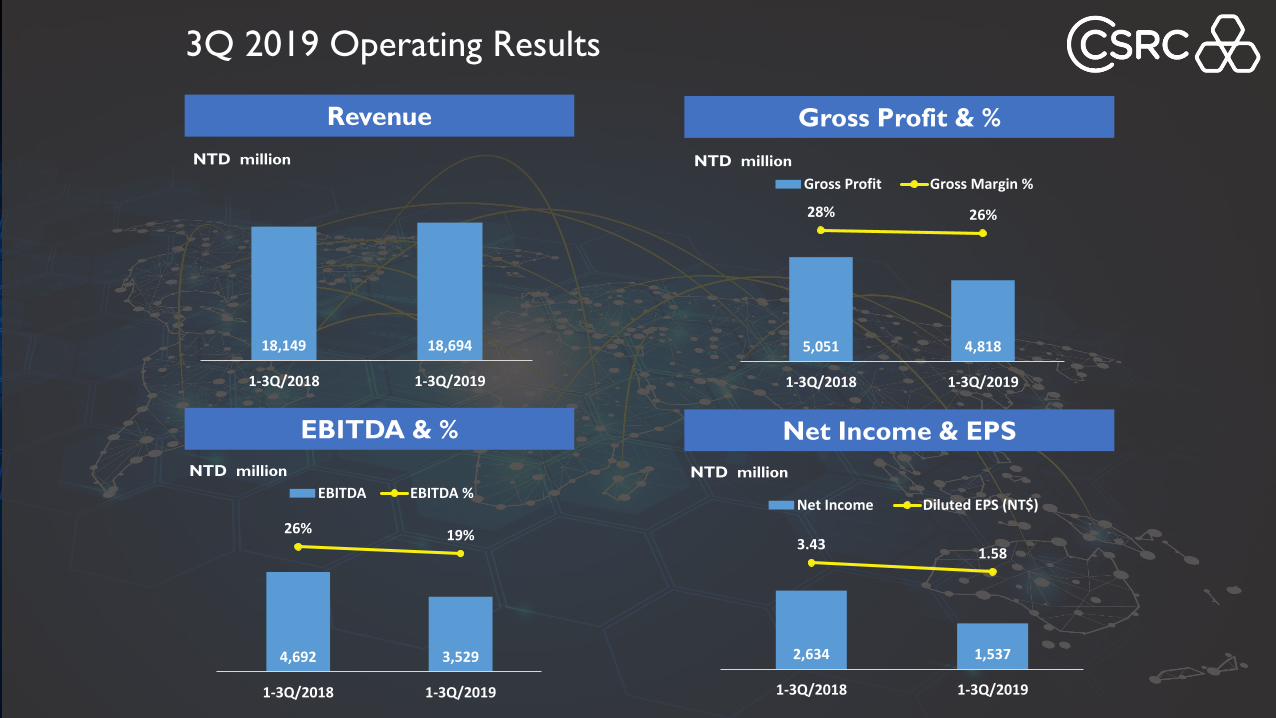
3Q 2019 Operating Results
Revenue Gross Profit & %
EBITDA & % Net Income & EPS
NTD million
NTD million
18,149 18,694
1-3Q/2018 1-3Q/2019
5,051 4,818
28% 26%
1-3Q/2018 1-3Q/2019
Gross Profit Gross Margin %
4,692 3,529
26% 19%
1-3Q/2018 1-3Q/2019
EBITDA EBITDA %
2,634 1,537
3.431.58
1-3Q/2018 1-3Q/2019
Net Income Diluted EPS (NT$)
NTD million
NTD million
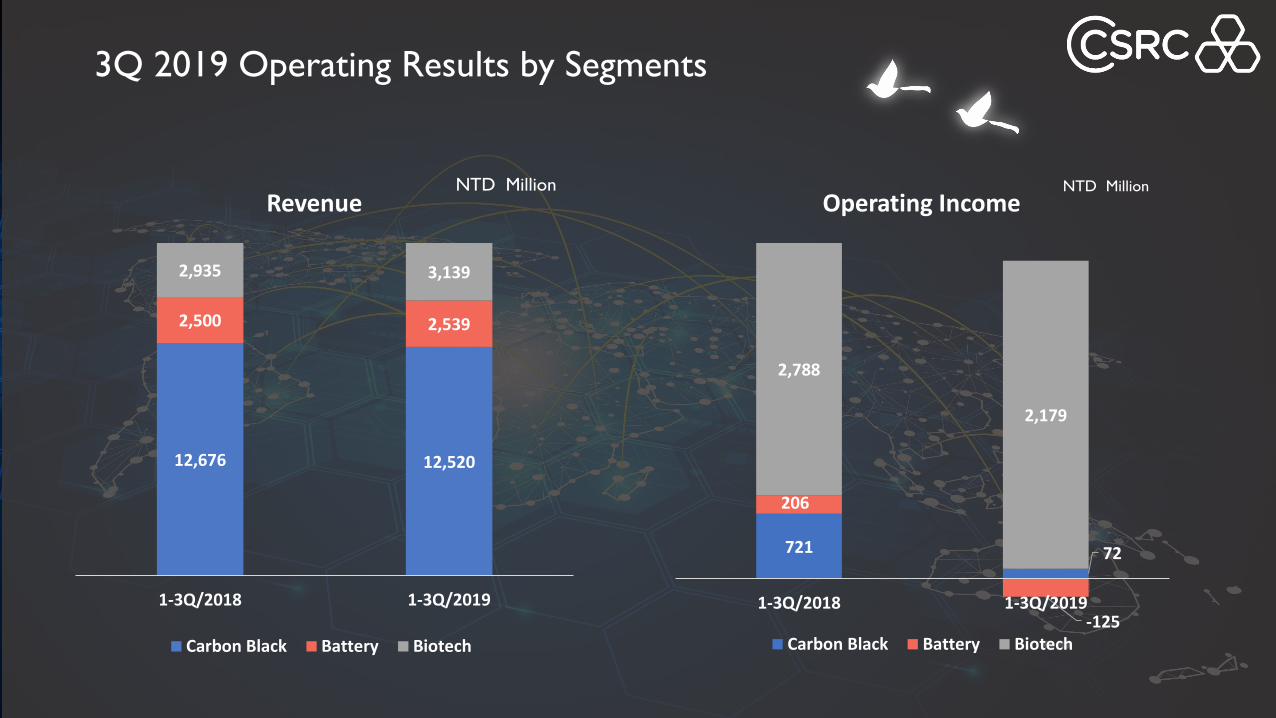
12,676 12,520
2,500 2,539
2,935 3,139
1-3Q/2018 1-3Q/2019
Revenue
Carbon Black Battery Biotech
3Q 2019 Operating Results by Segments
721 72
206
-125
2,788
2,179
1-3Q/2018 1-3Q/2019
Operating Income
Carbon Black Battery Biotech
NTD Million NTD Million
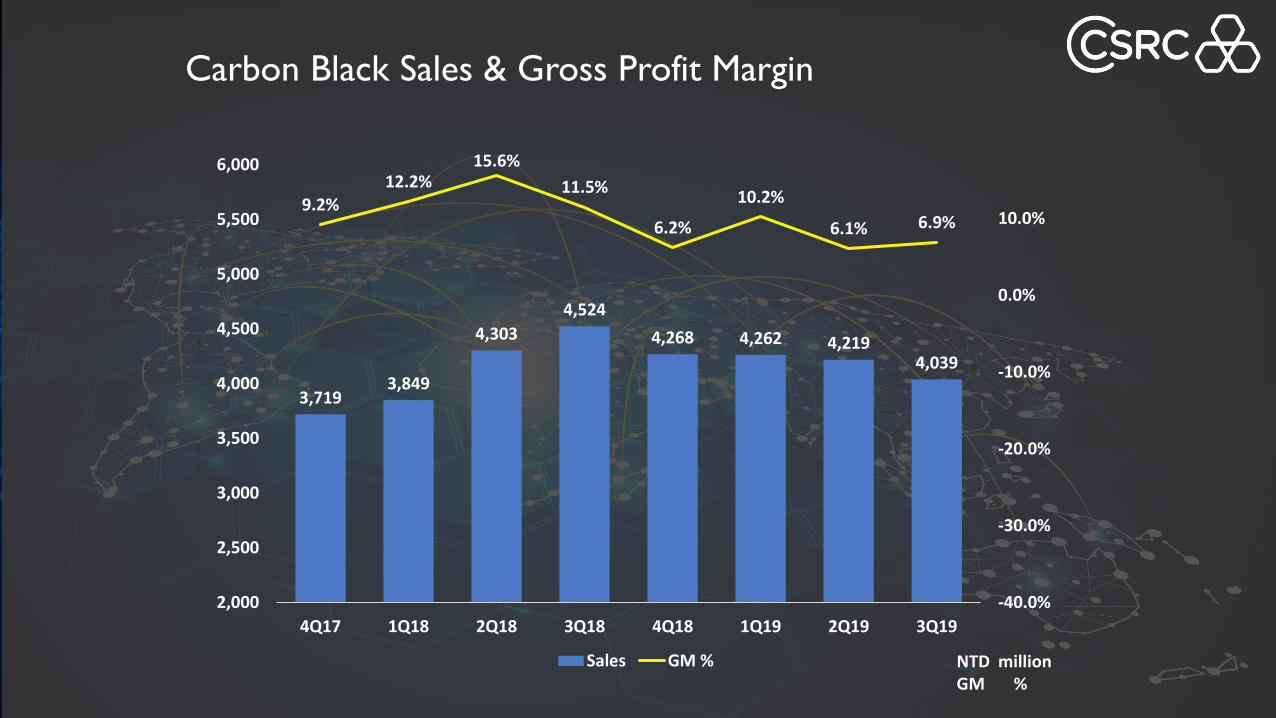
Carbon Black Sales & Gross Profit Margin
NTD millionGM %
3,7193,849
4,303
4,524
4,268 4,262 4,2194,039
9.2%12.2%
15.6%
11.5%
6.2%
10.2%
6.1% 6.9%
-40.0%
-30.0%
-20.0%
-10.0%
0.0%
10.0%
2,000
2,500
3,000
3,500
4,000
4,500
5,000
5,500
6,000
4Q17 1Q18 2Q18 3Q18 4Q18 1Q19 2Q19 3Q19
Sales GM %
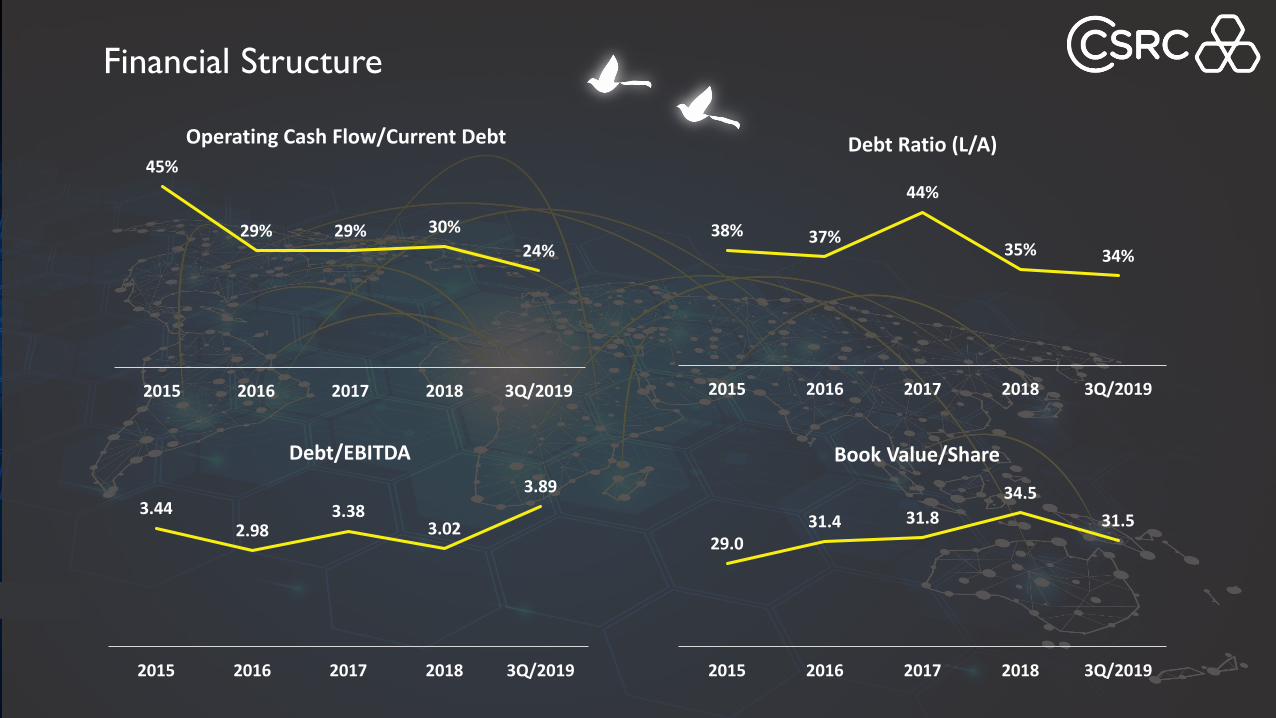
Financial Structure
45%
29% 29% 30%
24%
2015 2016 2017 2018 3Q/2019
Operating Cash Flow/Current Debt
3.44 2.98
3.38 3.02
3.89
2015 2016 2017 2018 3Q/2019
Debt/EBITDA
38% 37%
44%
35% 34%
2015 2016 2017 2018 3Q/2019
Debt Ratio (L/A)
29.0 31.4 31.8
34.5
31.5
2015 2016 2017 2018 3Q/2019
Book Value/Share