Embed Size (px)
Citation preview
ISSN 0038-982X (2014): 2 p. 21-42 UDK 314.724(450)
DOI: 10.2298/STNV1402021R Originalni rad
Primljeno: 27.10.2014.
INTERNAL MOBILITY IN ITALY: A NEW DELAY
Cecilia REYNAUD, Enrico TUCCI ♦
From the second half of the 1990s, mobility appears to have changed profoundly from the great migrations of the 1960s, for two main reasons: firstly, the rise in short-range mobility; and secondly, the strong increase in attraction by geographical areas in Central and above all North-eastern Italy. In more recent years, the evolution of internal mobility has changed again, with a further fall coupled with a loss of attractiveness for some Central and Northern areas.
The recent evolution of mobility could suggest that the large divide between the North and South is closing. However, this is not entirely the case, as differences in mobility by geographicalarea continued to remain and in some cases even increased. In fact, this analysis allows us to show how population loss from the South of Italy has actually risen.
This study aims to focus on the evolution of the phenomenon in individual geographical areas and the varying levels of migration between the different genders and age classes.
While we are clearly not facing a new boom in out-migration from the South, it is true that out-migration is continuing and represents a serious loss of human capital in this area.
Key words: internal migration, transfer of residence, North-South divide
Introduction
In Italy, a country with a strong history of migration, researchers have been focusingon foreign immigration for some time, also thanks to the attention paid to the issue by the mass media and the presumed interest shown by politics.
However, internal migration has made a far more important contribution to defining the territorial distribution of the population as it is today, and as such must not be neglected. In fact, the situation in the 1950s and 1960s was extremely dynamic, with mobility playing one of the most funda-mental and rapidly evolving roles (Casacchia et al. 2006). The internal migrations that took place in this period substantially changed the distribution of the population within Italy, laying the foundations of the
Department of Political Science, Univeristy Roma Tre, Rome. ♦
Italian National Institute of Statistics (ISTAT), Rome.
Stanovništvo 2/2014 22
settlement models that are still seen today (Golini, Reynaud, 2010). In a country where the natural dynamic has become considerably less important than migratory trends, this aspect cannot be ignored, especially when we go beyond the national figures to look at a more detailed territorial level (Bonifazi, 1999). The recovery of internal migration seen in the second half of the 1990s attracted the attention of researchers once again, and in recent years has generated scientific debate over its role and importance (Cantalini, Valentini, 2012). We have seen how the increase in migrations, particularly in the last few years, was mostly composed of foreign migration (Casacchia et al. 2010). The debate has also focused on the role of the South in internal migration: long-distance transfers in the classic South-North direction continue and constitute a loss of resources in the country's most disadvantaged area, although the number has fallen over time (Livi Bacci, 2007); on the other hand, short-distance transfers, recorded through inter-provincial changes of residence, which show the "vibrancy" of an area – with a higher number of transfers denoting greater changes in employment, residence and families – fell precisely in the South, marking a new delay (Bonifazi, 2013).
The pattern of internal migration within Italy has slowly changed, moving from a situation where most migration out of the geographical areas was towards only a few, well-defined centres of attraction, to one where the number of areas marked by significant, if smaller, incoming migration has risen, also due to the increasing, although partial, return of migrants to their areas of origin (Pugliese, 2006).
The availability of data on the most recent years, 2009-2012, has allowed us to identify an initial further fall in internal migration, as an expected result of the economic crisis, and an unexpected rise in the years considered, followed by a strong rise over the last year.
The trend of changes in residence in Italy appears to be the result of partly contradictory changes both between geographical areas, which often confirm the strong dualism between North and South, and also between different types of migration: intra-provincial, within the same geographical area, and between different geographical areas. Moreover, the numbers of Italians and foreigners, men and women also appear to affect the result differently.
In this paper, we attempt to understand which type of migration has had the strongest influence on migration trends in recent years, what contribution the various geographical areas have made to internal migration and what effect the migration of foreigners has had. We also want to examine the characteristics of the individuals taking part in migrations.
Internal Mobility in Italy: A New Delay 23
Data and methods
The most frequently used source for studying internal mobility are public records on changes of residence, which tell us both the origin and the destination of individual transfers on a municipal level. The public records are one of the main sources for studying mobility in Italy, as they capture all changes of residence between Municipalities. Along with the municipality of origin and destination, the records also show some characteristics of the individuals involved, such as their date and place of birth, gender, level of education and employment status. The source is exhaustive, although certainly not without errors.
By analysing the data on changes of residence, divided by geographical area and then by geographical area of destination and origin, we can get an idea of whether migration has changed or not over the last decade. In particular, we will be analysing transfers in the years from 2003 to 2012.
We constructed the in-migration and out-migration rates for each geographical area and type of migration, as well as breaking down the rates by gender, age class and citizenship, distinguishing between Italians and foreigners. Lastly, we will apply a logistical regression model to the flows, comparing the inter-area and intra-area migration types to see whether the differences are mostly attributable to the characteristics of the individuals or the situation.
Results
Recent trends
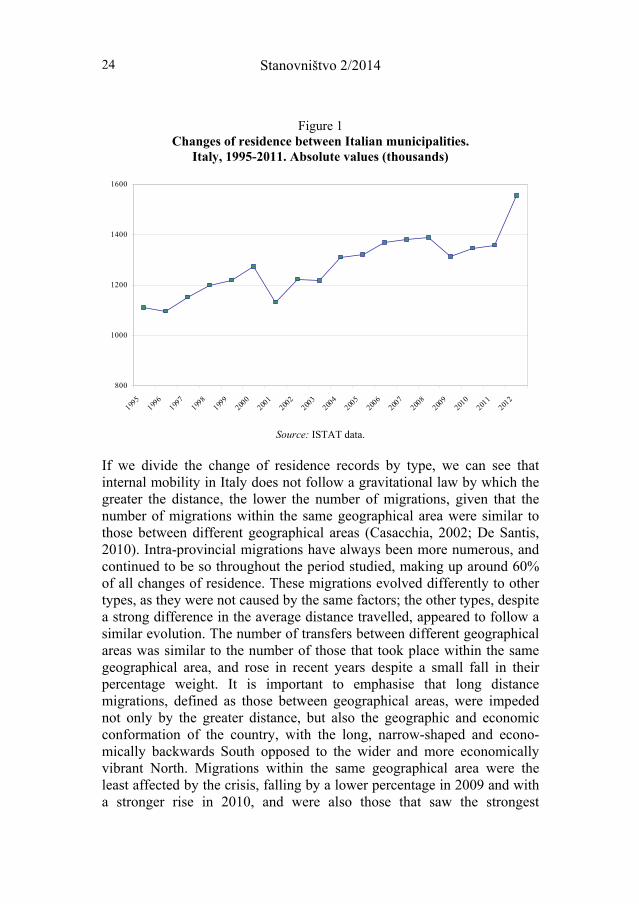
Internal mobility in Italy has seen both pauses and periods of accelerated growth, with different causes and protagonists; recent years in particular have shown a sharp recovery in internal migration, also thanks to the contribution of foreigners resident in Italy (Bonifazi, 2009). The 1990s saw a recovery of internal migration in Italy following a pause during the previous decade; from 1995 onwards there was a particularly visible increase in transfers of residence in Italy, despite the sharp fall in 2001 (Casacchia et al., 2010). Towards the end of the century, this growth appeared to slow until 2009, when there was a drastic inversion of the trend, to the point that the number of changes of residence records was almost on a par with those of 2004, cancelling out 5 years of recovery. This fall may have been expected, given the economic crisis and the resulting general slow-down of the economic system that generates migration. The clear recovery seen in 2010 and the even stronger increase in 2012, on the other hand, were not foreseeable (Figure 1).
Stanovništvo 2/2014 24
Figure 1 Changes of residence between Italian municipalities.
Italy, 1995-2011. Absolute values (thousands)
800
1000
1200
1400
1600
1995
1996
1997
1998
1999
2000
2001
2002
2003
2004
2005
2006
2007
2008
2009
2010
2011
2012
Source: ISTAT data.
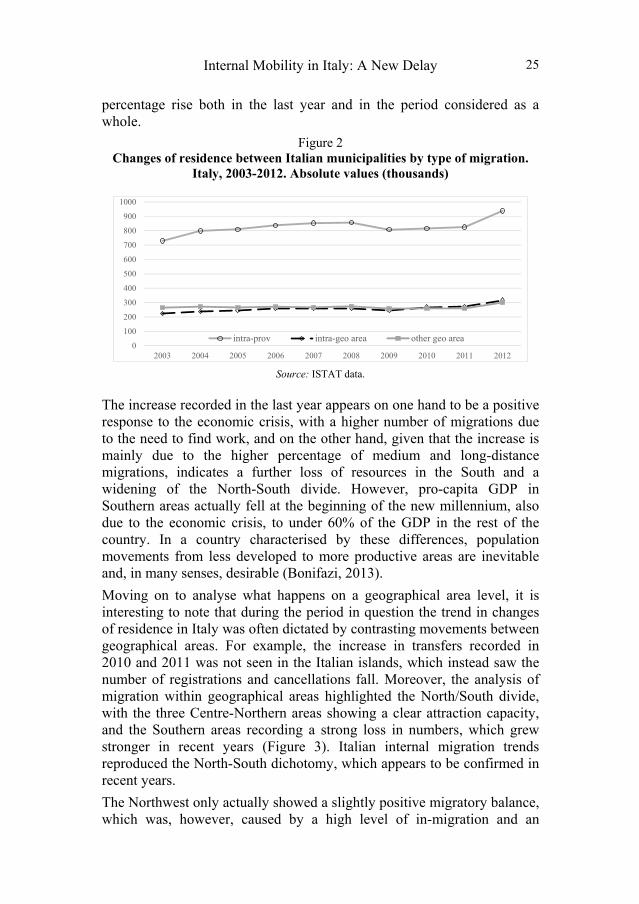
If we divide the change of residence records by type, we can see that internal mobility in Italy does not follow a gravitational law by which the greater the distance, the lower the number of migrations, given that the number of migrations within the same geographical area were similar to those between different geographical areas (Casacchia, 2002; De Santis, 2010). Intra-provincial migrations have always been more numerous, and continued to be so throughout the period studied, making up around 60% of all changes of residence. These migrations evolved differently to other types, as they were not caused by the same factors; the other types, despite a strong difference in the average distance travelled, appeared to follow a similar evolution. The number of transfers between different geographical areas was similar to the number of those that took place within the same geographical area, and rose in recent years despite a small fall in their percentage weight. It is important to emphasise that long distance migrations, defined as those between geographical areas, were impeded not only by the greater distance, but also the geographic and economic conformation of the country, with the long, narrow-shaped and econo-mically backwards South opposed to the wider and more economically vibrant North. Migrations within the same geographical area were the least affected by the crisis, falling by a lower percentage in 2009 and with a stronger rise in 2010, and were also those that saw the strongest
Internal Mobility in Italy: A New Delay 25
percentage rise both in the last year and in the period considered as a whole.
Figure 2 Changes of residence between Italian municipalities by type of migration.
Italy, 2003-2012. Absolute values (thousands)
0
100
200
300
400
500
600
700
800
900
1000
2003 2004 2005 2006 2007 2008 2009 2010 2011 2012
intra-prov intra-geo area other geo area
Source: ISTAT data.
The increase recorded in the last year appears on one hand to be a positive response to the economic crisis, with a higher number of migrations due to the need to find work, and on the other hand, given that the increase is mainly due to the higher percentage of medium and long-distance migrations, indicates a further loss of resources in the South and a widening of the North-South divide. However, pro-capita GDP in Southern areas actually fell at the beginning of the new millennium, also due to the economic crisis, to under 60% of the GDP in the rest of the country. In a country characterised by these differences, population movements from less developed to more productive areas are inevitable and, in many senses, desirable (Bonifazi, 2013).
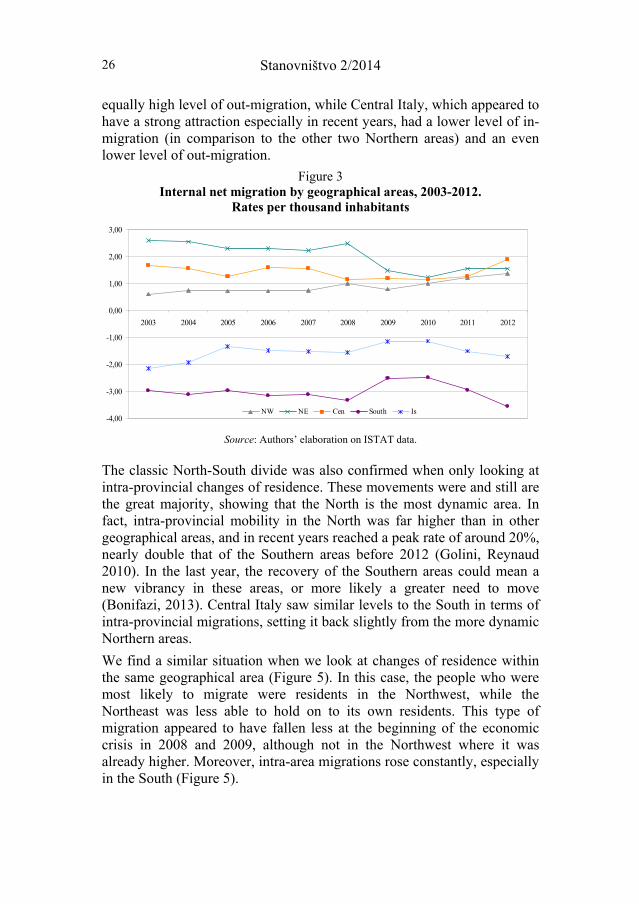
Moving on to analyse what happens on a geographical area level, it is interesting to note that during the period in question the trend in changes of residence in Italy was often dictated by contrasting movements between geographical areas. For example, the increase in transfers recorded in 2010 and 2011 was not seen in the Italian islands, which instead saw the number of registrations and cancellations fall. Moreover, the analysis of migration within geographical areas highlighted the North/South divide, with the three Centre-Northern areas showing a clear attraction capacity, and the Southern areas recording a strong loss in numbers, which grew stronger in recent years (Figure 3). Italian internal migration trends reproduced the North-South dichotomy, which appears to be confirmed in recent years.
The Northwest only actually showed a slightly positive migratory balance, which was, however, caused by a high level of in-migration and an
Stanovništvo 2/2014 26
equally high level of out-migration, while Central Italy, which appeared to have a strong attraction especially in recent years, had a lower level of in-migration (in comparison to the other two Northern areas) and an even lower level of out-migration.
Figure 3 Internal net migration by geographical areas, 2003-2012.
Rates per thousand inhabitants
-4,00
-3,00
-2,00
-1,00
0,00
1,00
2,00
3,00
2003 2004 2005 2006 2007 2008 2009 2010 2011 2012
NW NE Cen South Is
Source: Authors’ elaboration on ISTAT data.
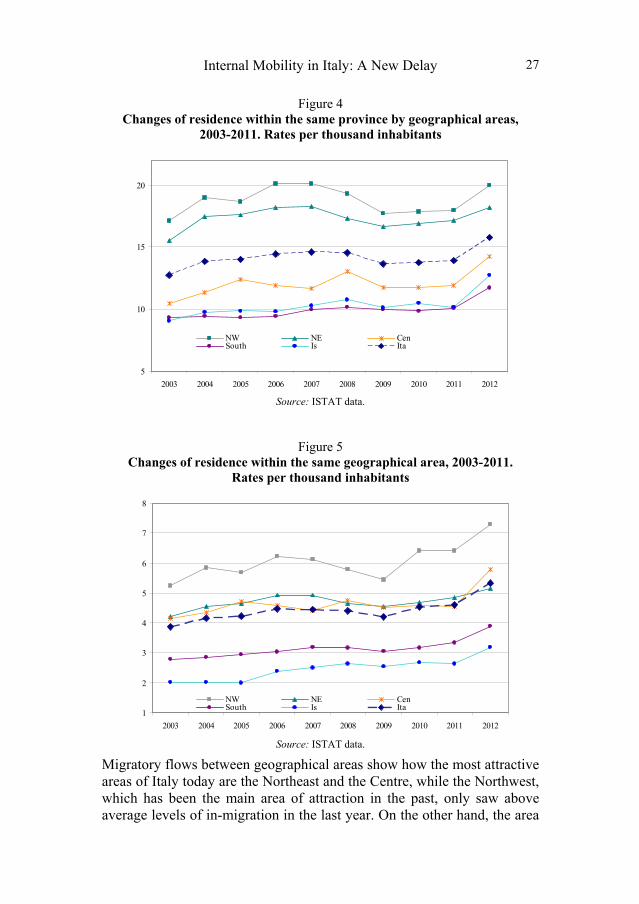
The classic North-South divide was also confirmed when only looking at intra-provincial changes of residence. These movements were and still are the great majority, showing that the North is the most dynamic area. In fact, intra-provincial mobility in the North was far higher than in other geographical areas, and in recent years reached a peak rate of around 20%, nearly double that of the Southern areas before 2012 (Golini, Reynaud 2010). In the last year, the recovery of the Southern areas could mean a new vibrancy in these areas, or more likely a greater need to move (Bonifazi, 2013). Central Italy saw similar levels to the South in terms of intra-provincial migrations, setting it back slightly from the more dynamic Northern areas.
We find a similar situation when we look at changes of residence within the same geographical area (Figure 5). In this case, the people who were most likely to migrate were residents in the Northwest, while the Northeast was less able to hold on to its own residents. This type of migration appeared to have fallen less at the beginning of the economic crisis in 2008 and 2009, although not in the Northwest where it was already higher. Moreover, intra-area migrations rose constantly, especially in the South (Figure 5).
Internal Mobility in Italy: A New Delay 27
Figure 4 Changes of residence within the same province by geographical areas,
2003-2011. Rates per thousand inhabitants
5
10
15
20
2003 2004 2005 2006 2007 2008 2009 2010 2011 2012
NW NE CenSouth Is Ita
Source: ISTAT data.
Figure 5 Changes of residence within the same geographical area, 2003-2011.
Rates per thousand inhabitants
1
2
3
4
5
6
7
8
2003 2004 2005 2006 2007 2008 2009 2010 2011 2012
NW NE CenSouth Is Ita
Source: ISTAT data.
Migratory flows between geographical areas show how the most attractive areas of Italy today are the Northeast and the Centre, while the Northwest, which has been the main area of attraction in the past, only saw above average levels of in-migration in the last year. On the other hand, the area
Stanovništvo 2/2014 28
with the highest levels of out-migration was the South, which continued to lose population at a rate of over 7%, the highest value of all in the period considered. The Islands, although continuing to lose population, did not reach the levels recorded at the beginning of our observation (Figure 6).
Figure 6 Changes of residence between geographical areas, 2003-2012. Rates per
thousand inhabitants
3
4
5
6
7 NW
In-migration ratesNE Cen South Is
2003 2004 2005 2006 2007 2008 2009 2010 2011 2012
Ita
Out-migration rates 7
6
5
4
3
2003 2004 2005 2006 2007 2008 2009 2010 2011 2012
Source: ISTAT data.
The analysis of the different types of internal migration in Italy showed a shared evolution that marked a fall in migrations, or at least a slower rate of growth, in the years 2003-2009, followed by a sharp rise in the last year or two. The economic crisis appears to have had a strong impact on migrations caused by individuals seeking to improve their quality of life, such as choosing to move home, start a family or improve their employment situation; the continuation of the crisis appears to have increased the need to move, often in order to look for work. Nonetheless, we must remember that following the latest censuses, there have always been peaks of changes of residence, although these were not as intense as in 2012. Moreover, all types of migration continue to show a divided Italy, showing two contrasting geographical areas with different economic
Internal Mobility in Italy: A New Delay 29
and social conditions, and a stronger impact of the crisis in the South and Northeast.
The protagonists
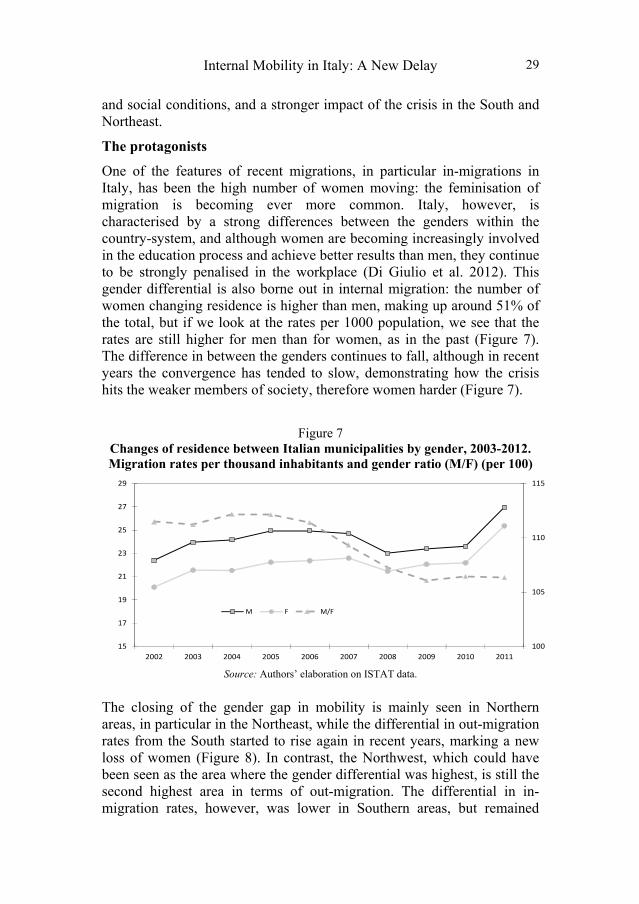
One of the features of recent migrations, in particular in-migrations in Italy, has been the high number of women moving: the feminisation of migration is becoming ever more common. Italy, however, is characterised by a strong differences between the genders within the country-system, and although women are becoming increasingly involved in the education process and achieve better results than men, they continue to be strongly penalised in the workplace (Di Giulio et al. 2012). This gender differential is also borne out in internal migration: the number of women changing residence is higher than men, making up around 51% of the total, but if we look at the rates per 1000 population, we see that the rates are still higher for men than for women, as in the past (Figure 7). The difference in between the genders continues to fall, although in recent years the convergence has tended to slow, demonstrating how the crisis hits the weaker members of society, therefore women harder (Figure 7).
Figure 7 Changes of residence between Italian municipalities by gender, 2003-2012. Migration rates per thousand inhabitants and gender ratio (M/F) (per 100)
100
105
110
115
15
17
19
21
23
25
27
29
2002 2003 2004 2005 2006 2007 2008 2009 2010 2011
M F M/F
Source: Authors’ elaboration on ISTAT data.
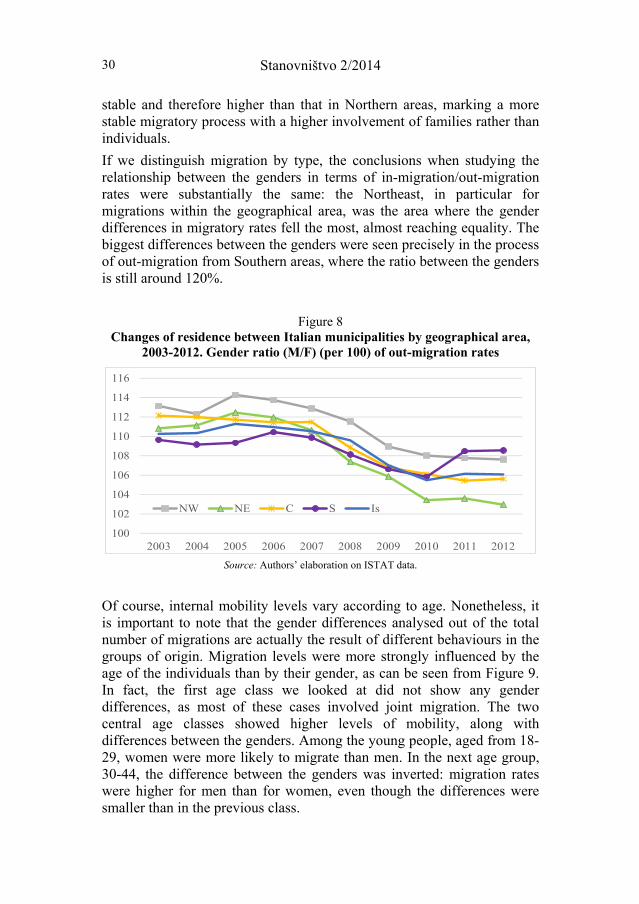
The closing of the gender gap in mobility is mainly seen in Northern areas, in particular in the Northeast, while the differential in out-migration rates from the South started to rise again in recent years, marking a new loss of women (Figure 8). In contrast, the Northwest, which could have been seen as the area where the gender differential was highest, is still the second highest area in terms of out-migration. The differential in in-migration rates, however, was lower in Southern areas, but remained
Stanovništvo 2/2014 30
stable and therefore higher than that in Northern areas, marking a more stable migratory process with a higher involvement of families rather than individuals.
If we distinguish migration by type, the conclusions when studying the relationship between the genders in terms of in-migration/out-migration rates were substantially the same: the Northeast, in particular for migrations within the geographical area, was the area where the gender differences in migratory rates fell the most, almost reaching equality. The biggest differences between the genders were seen precisely in the process of out-migration from Southern areas, where the ratio between the genders is still around 120%.
Figure 8 Changes of residence between Italian municipalities by geographical area,
2003-2012. Gender ratio (M/F) (per 100) of out-migration rates
100
102
104
106
108
110
112
114
116
2003 2004 2005 2006 2007 2008 2009 2010 2011 2012
NW NE C S Is
Source: Authors’ elaboration on ISTAT data.
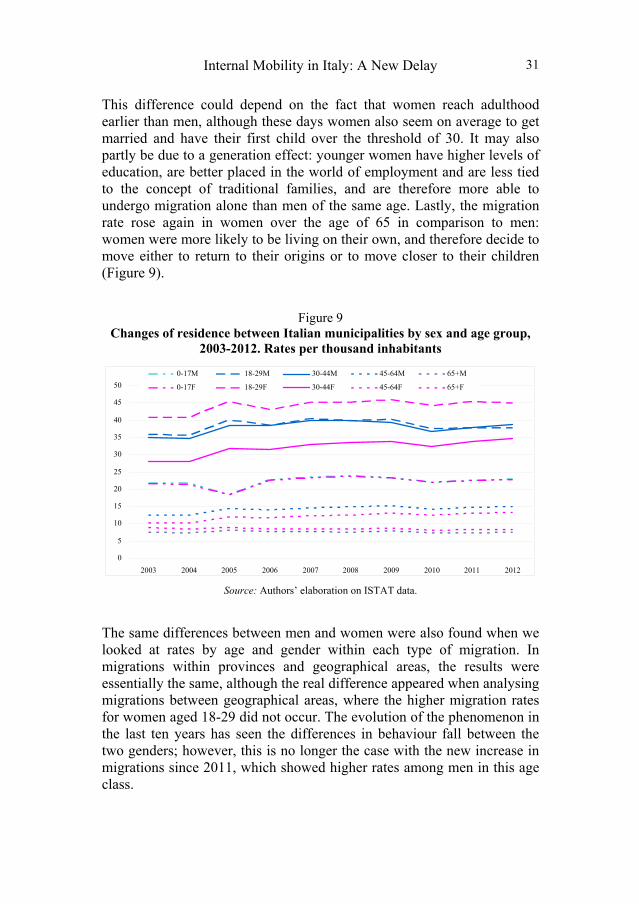
Of course, internal mobility levels vary according to age. Nonetheless, it is important to note that the gender differences analysed out of the total number of migrations are actually the result of different behaviours in the groups of origin. Migration levels were more strongly influenced by the age of the individuals than by their gender, as can be seen from Figure 9. In fact, the first age class we looked at did not show any gender differences, as most of these cases involved joint migration. The two central age classes showed higher levels of mobility, along with differences between the genders. Among the young people, aged from 18-29, women were more likely to migrate than men. In the next age group, 30-44, the difference between the genders was inverted: migration rates were higher for men than for women, even though the differences were smaller than in the previous class.
Internal Mobility in Italy: A New Delay 31
This difference could depend on the fact that women reach adulthood earlier than men, although these days women also seem on average to get married and have their first child over the threshold of 30. It may also partly be due to a generation effect: younger women have higher levels of education, are better placed in the world of employment and are less tied to the concept of traditional families, and are therefore more able to undergo migration alone than men of the same age. Lastly, the migration rate rose again in women over the age of 65 in comparison to men: women were more likely to be living on their own, and therefore decide to move either to return to their origins or to move closer to their children (Figure 9).
Figure 9
Changes of residence between Italian municipalities by sex and age group, 2003-2012. Rates per thousand inhabitants
0
5
10
15
20
25
30
35
40
45
50
2003 2004 2005 2006 2007 2008 2009 2010 2011 2012
0-17M 18-29M 30-44M 45-64M 65+M
0-17F 18-29F 30-44F 45-64F 65+F
Source: Authors’ elaboration on ISTAT data.
The same differences between men and women were also found when we looked at rates by age and gender within each type of migration. In migrations within provinces and geographical areas, the results were essentially the same, although the real difference appeared when analysing migrations between geographical areas, where the higher migration rates for women aged 18-29 did not occur. The evolution of the phenomenon in the last ten years has seen the differences in behaviour fall between the two genders; however, this is no longer the case with the new increase in migrations since 2011, which showed higher rates among men in this age class.
Stanovništvo 2/2014 32
In recent years, the trend of internal migrations in Italy has also been characterised by the important role of the foreign population, which has increased in both size and mobility within the country (Casacchia et al., 2010). Foreigners have already made one migration, and therefore appear to find it easier to move and appear to be more disposed to following the changes of the labour market (Reynaud, Conti, 2011). In fact, over the whole decade foreigners achieved a migration rate of 60%, while Italians remained at 20%. The contribution made by foreigners to internal migration in Italy practically doubled: in 2003, internal transfers by foreigners accounted for 9.4% of the total, while in 2012 they reached nearly double, at 18%. Their contribution was substantially similar through all the types of migration considered. The evolution of migration rates among foreigners during the period considered was substantially similar to that of Italians in the different types, although the levels of the rates were drastically higher. However, migrations within geographical areas were more frequent than those between areas, in contrast to the figures for Italians, and contrary to what might have been expected. Foreigners, despite having fewer links to the territory, were more likely to adhere to a migratory model based on distance, as already analysed in other studies (Casacchia et al., 2010; Lamonica, Zagaglia, 2013).
Table 1 Changes of residence between Italian municipalities of foreign population by
type, 2003-2012. Percentage value of total movements
Year Intra-province Intra-geographical area
Between geographical areas
Total
2003 9.1 10.4 9.4 9.4
2004 12.3 13.3 11.5 12.3
2005 14.3 14.9 12.3 14.0
2006 15.0 16.1 13.5 14.9
2007 15.0 15.8 13.1 14.8
2008 15.7 16.1 13.6 15.3
2009 16.7 17.7 14.3 16.4
2010 17.0 18.2 14.6 16.8
2011 17.4 19.5 15.9 17.6
2012 17.7 20.1 16.5 18.0
Source: Authors’ elaboration on ISTAT data
When analysing the results by type of migration, the main evidence of the particular nature of foreign migration was that from 2006, inter-provincial
Internal Mobility in Italy: A New Delay 33
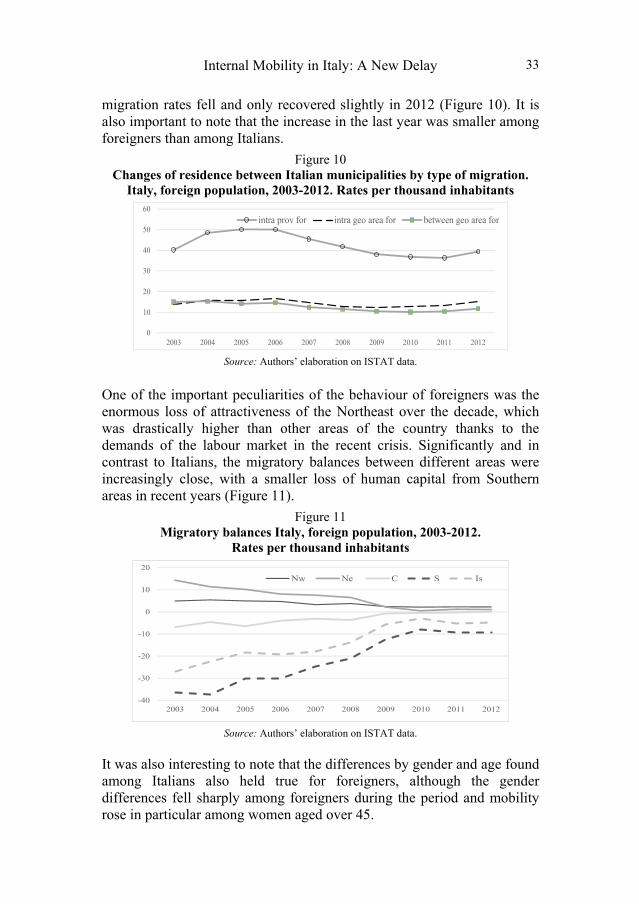
migration rates fell and only recovered slightly in 2012 (Figure 10). It is also important to note that the increase in the last year was smaller among foreigners than among Italians.
Figure 10 Changes of residence between Italian municipalities by type of migration.
Italy, foreign population, 2003-2012. Rates per thousand inhabitants
0
10
20
30
40
50
60
2003 2004 2005 2006 2007 2008 2009 2010 2011 2012
intra prov for intra geo area for between geo area for
Source: Authors’ elaboration on ISTAT data.
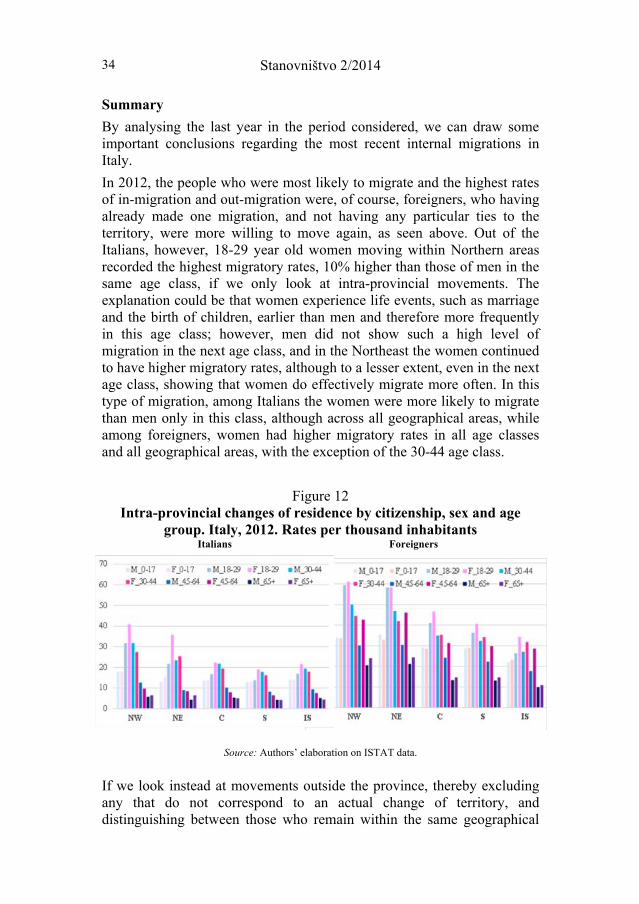
One of the important peculiarities of the behaviour of foreigners was the enormous loss of attractiveness of the Northeast over the decade, which was drastically higher than other areas of the country thanks to the demands of the labour market in the recent crisis. Significantly and in contrast to Italians, the migratory balances between different areas were increasingly close, with a smaller loss of human capital from Southern areas in recent years (Figure 11).
Figure 11 Migratory balances Italy, foreign population, 2003-2012.
Rates per thousand inhabitants
-40
-30
-20
-10
0
10
20
2003 2004 2005 2006 2007 2008 2009 2010 2011 2012
Nw Ne C S Is
Source: Authors’ elaboration on ISTAT data.
It was also interesting to note that the differences by gender and age found among Italians also held true for foreigners, although the gender differences fell sharply among foreigners during the period and mobility rose in particular among women aged over 45.
Stanovništvo 2/2014 34
Summary
By analysing the last year in the period considered, we can draw some important conclusions regarding the most recent internal migrations in Italy.
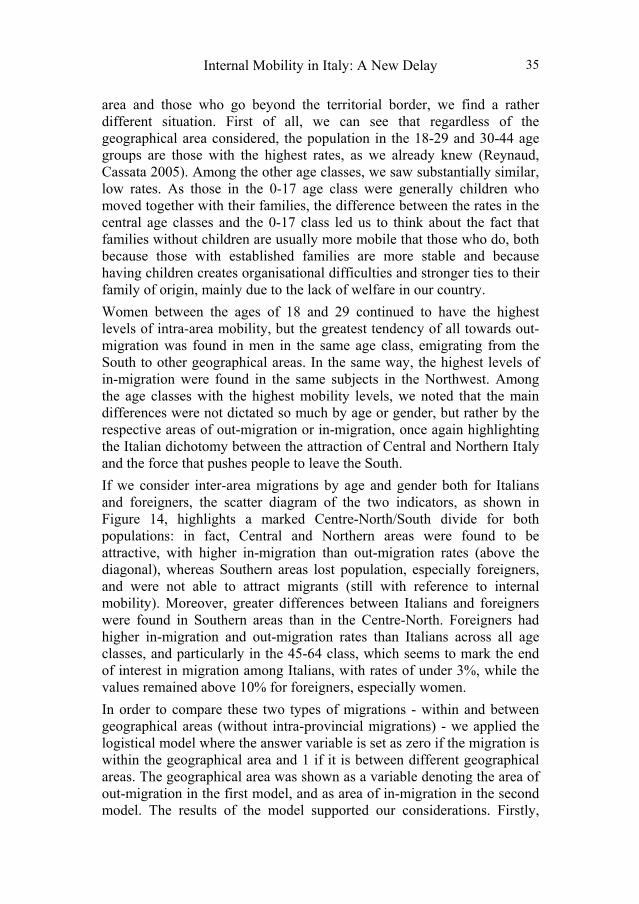
In 2012, the people who were most likely to migrate and the highest rates of in-migration and out-migration were, of course, foreigners, who having already made one migration, and not having any particular ties to the territory, were more willing to move again, as seen above. Out of the Italians, however, 18-29 year old women moving within Northern areas recorded the highest migratory rates, 10% higher than those of men in the same age class, if we only look at intra-provincial movements. The explanation could be that women experience life events, such as marriage and the birth of children, earlier than men and therefore more frequently in this age class; however, men did not show such a high level of migration in the next age class, and in the Northeast the women continued to have higher migratory rates, although to a lesser extent, even in the next age class, showing that women do effectively migrate more often. In this type of migration, among Italians the women were more likely to migrate than men only in this class, although across all geographical areas, while among foreigners, women had higher migratory rates in all age classes and all geographical areas, with the exception of the 30-44 age class.
Figure 12 Intra-provincial changes of residence by citizenship, sex and age
group. Italy, 2012. Rates per thousand inhabitants Italians Foreigners
Source: Authors’ elaboration on ISTAT data.
If we look instead at movements outside the province, thereby excluding any that do not correspond to an actual change of territory, and distinguishing between those who remain within the same geographical
Internal Mobility in Italy: A New Delay 35
area and those who go beyond the territorial border, we find a rather different situation. First of all, we can see that regardless of the geographical area considered, the population in the 18-29 and 30-44 age groups are those with the highest rates, as we already knew (Reynaud, Cassata 2005). Among the other age classes, we saw substantially similar, low rates. As those in the 0-17 age class were generally children who moved together with their families, the difference between the rates in the central age classes and the 0-17 class led us to think about the fact that families without children are usually more mobile that those who do, both because those with established families are more stable and because having children creates organisational difficulties and stronger ties to their family of origin, mainly due to the lack of welfare in our country.
Women between the ages of 18 and 29 continued to have the highest levels of intra-area mobility, but the greatest tendency of all towards out-migration was found in men in the same age class, emigrating from the South to other geographical areas. In the same way, the highest levels of in-migration were found in the same subjects in the Northwest. Among the age classes with the highest mobility levels, we noted that the main differences were not dictated so much by age or gender, but rather by the respective areas of out-migration or in-migration, once again highlighting the Italian dichotomy between the attraction of Central and Northern Italy and the force that pushes people to leave the South.
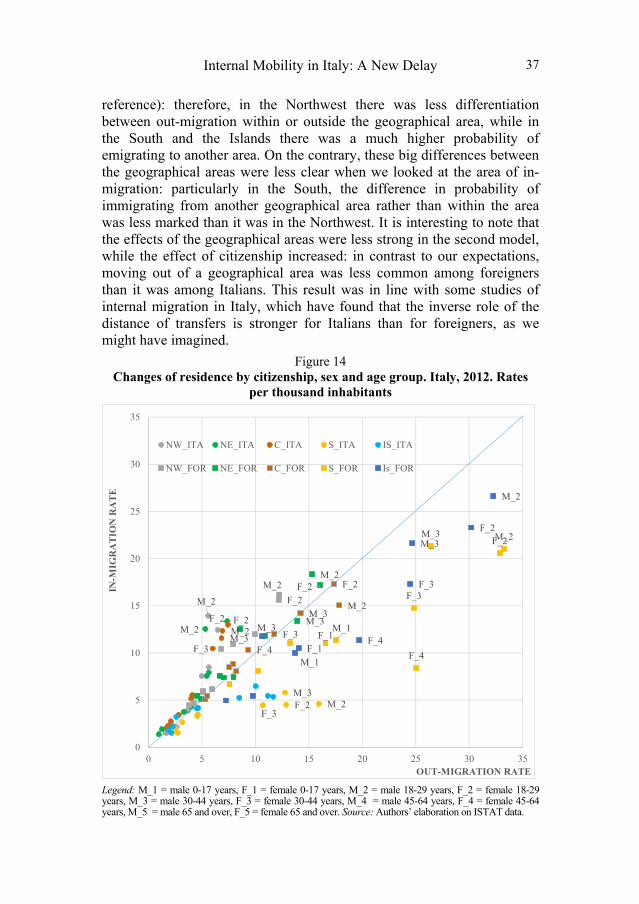
If we consider inter-area migrations by age and gender both for Italians and foreigners, the scatter diagram of the two indicators, as shown in Figure 14, highlights a marked Centre-North/South divide for both populations: in fact, Central and Northern areas were found to be attractive, with higher in-migration than out-migration rates (above the diagonal), whereas Southern areas lost population, especially foreigners, and were not able to attract migrants (still with reference to internal mobility). Moreover, greater differences between Italians and foreigners were found in Southern areas than in the Centre-North. Foreigners had higher in-migration and out-migration rates than Italians across all age classes, and particularly in the 45-64 class, which seems to mark the end of interest in migration among Italians, with rates of under 3%, while the values remained above 10% for foreigners, especially women.
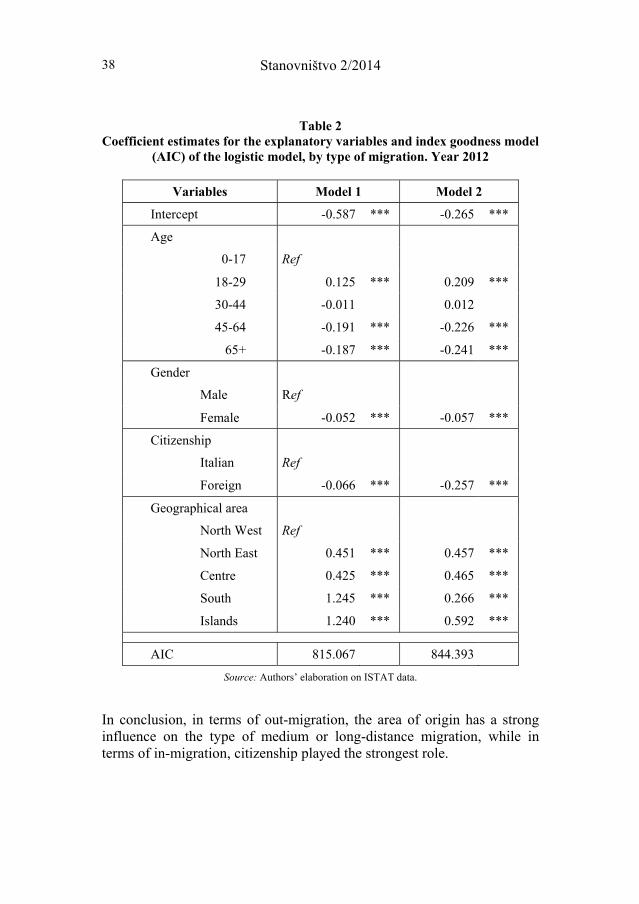
In order to compare these two types of migrations - within and between geographical areas (without intra-provincial migrations) - we applied the logistical model where the answer variable is set as zero if the migration is within the geographical area and 1 if it is between different geographical areas. The geographical area was shown as a variable denoting the area of out-migration in the first model, and as area of in-migration in the second model. The results of the model supported our considerations. Firstly,
Stanovništvo 2/2014 36
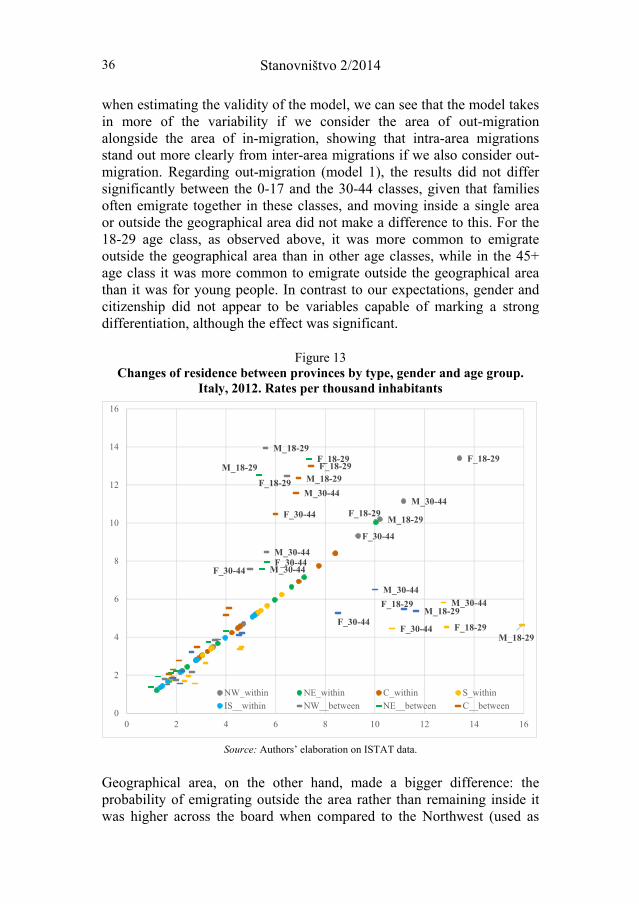
when estimating the validity of the model, we can see that the model takes in more of the variability if we consider the area of out-migration alongside the area of in-migration, showing that intra-area migrations stand out more clearly from inter-area migrations if we also consider out-migration. Regarding out-migration (model 1), the results did not differ significantly between the 0-17 and the 30-44 classes, given that families often emigrate together in these classes, and moving inside a single area or outside the geographical area did not make a difference to this. For the 18-29 age class, as observed above, it was more common to emigrate outside the geographical area than in other age classes, while in the 45+ age class it was more common to emigrate outside the geographical area than it was for young people. In contrast to our expectations, gender and citizenship did not appear to be variables capable of marking a strong differentiation, although the effect was significant.
Figure 13 Changes of residence between provinces by type, gender and age group.
Italy, 2012. Rates per thousand inhabitants
M_18-29
M_30-44
F_18-29
F_30-44
F_18-29
M_18-29
M_30-44
F_18-29
F_30-44
M_18-29
M_30-44
F_18-29
F_30-44
M_18-29
M_30-44
F_18-29
F_30-44
M_18-29
M_30-44
F_18-29F_30-44
M_18-29
M_30-44
F_18-29
F_30-44
0
2
4
6
8
10
12
14
16
0 2 4 6 8 10 12 14 16
NW_within NE_within C_within S_within
IS__within NW__between NE__between C__between
Source: Authors’ elaboration on ISTAT data.
Geographical area, on the other hand, made a bigger difference: the probability of emigrating outside the area rather than remaining inside it was higher across the board when compared to the Northwest (used as
Internal Mobility in Italy: A New Delay 37
reference): therefore, in the Northwest there was less differentiation between out-migration within or outside the geographical area, while in the South and the Islands there was a much higher probability of emigrating to another area. On the contrary, these big differences between the geographical areas were less clear when we looked at the area of in-migration: particularly in the South, the difference in probability of immigrating from another geographical area rather than within the area was less marked than it was in the Northwest. It is interesting to note that the effects of the geographical areas were less strong in the second model, while the effect of citizenship increased: in contrast to our expectations, moving out of a geographical area was less common among foreigners than it was among Italians. This result was in line with some studies of internal migration in Italy, which have found that the inverse role of the distance of transfers is stronger for Italians than for foreigners, as we might have imagined.
Figure 14 Changes of residence by citizenship, sex and age group. Italy, 2012. Rates
per thousand inhabitants
M_2
F_2M_2 M_2
M_3
F_2
F_3
M_2M_3F_2
F_3
M_2
M_3
F_2
M_2
M_3
F_2
M_2M_3
F_2
F_3
F_4
M_1
M_2M_3
F_1
F_2
F_3
F_4M_1
M_2
M_3
F_1
F_2
F_3
F_4
0
5
10
15
20
25
30
35
0 5 10 15 20 25 30 35
IN-M
IGR
AT
ION
RA
TE
OUT-MIGRATION RATE
NW_ITA NE_ITA C_ITA S_ITA IS_ITA
NW_FOR NE_FOR C_FOR S_FOR Is_FOR
Legend: M_1 = male 0-17 years, F_1 = female 0-17 years, M_2 = male 18-29 years, F_2 = female 18-29 years, M_3 = male 30-44 years, F_3 = female 30-44 years, M_4 = male 45-64 years, F_4 = female 45-64 years, M_5 = male 65 and over, F_5 = female 65 and over. Source: Authors’ elaboration on ISTAT data.
Stanovništvo 2/2014 38
Table 2 Coefficient estimates for the explanatory variables and index goodness model
(AIC) of the logistic model, by type of migration. Year 2012
Variables Model 1 Model 2
Intercept -0.587 *** -0.265 ***
Age
0-17 Ref
18-29 0.125 *** 0.209 ***
30-44 -0.011 0.012
45-64 -0.191 *** -0.226 ***
65+ -0.187 *** -0.241 ***
Gender
Male Ref
Female -0.052 *** -0.057 ***
Citizenship
Italian Ref
Foreign -0.066 *** -0.257 ***
Geographical area
North West Ref
North East 0.451 *** 0.457 ***
Centre 0.425 *** 0.465 ***
South 1.245 *** 0.266 ***
Islands 1.240 *** 0.592 ***
AIC 815.067 844.393
Source: Authors’ elaboration on ISTAT data.
In conclusion, in terms of out-migration, the area of origin has a strong influence on the type of medium or long-distance migration, while in terms of in-migration, citizenship played the strongest role.
Internal Mobility in Italy: A New Delay 39
Conclusions
Migrations in Italy, which have represented a particularly important phenomenon for population distribution and trends, picked up in the 1990s before increasing once more in 2010 and reaching a particular intensity in 2012. This could be linked to the displacements recorded in the years after the census; however, the increases are too high to be explained only by this factor. This study shows how the causes of the phenomenon's evolution vary according to the type of migration and the people undergoing it. Intra-provincial migrations have always been, and continue to be, the most common, probably due to a population that continues to spread throughout the territory and expand into larger areas, to the point that city borders are no longer easy to define, forming extendedmetropolitan areas. The other types considered, although less important from a numerical point of view, appear to be even more significant for describing the situation in Italy. Migrations between geographical areas were particularly useful for describing the strong North-South dichotomy in our country in terms of economic and social development, which in the past was responsible for huge population movements from South to North. More recently, the return of South to North migration appears to depend not only on the differences in numbers and quality on the labour market, but also on the continuation of the economic crisis.
By analysing the people who migrate in Italy, we can see that young people and foreigners play a pre-eminent role, along with a confirmation of the higher level of economic and social development in the North than the South, where women still hold a marginal position. When we analyse migration by gender, we see a higher level of participation among women, and in particular young women, although out in Northern areas, with a continued delay in long-distance migrations from the South. The role of foreigners also stood out clearly, who despite behaving in a similar way to Italians, as confirmed by the models, show some specific features such as a higher level of participation among women even in adult age classes, a high level of in-migration in Southern areas and a lower level of long-distance migrations. Like Italians, the balance of foreign migration in the South is strongly negative, but in this case the finding is due to high levels of both in-migration and out-migration. The delay of the South also appears to have been amplified in recent years, with young men once more taking the leading role in migrations, perhaps due to being forced to leave their area of residence, as in the past. The continuing loss of human capital from the South is a recurrent theme in the history of migration in Italy, and is cause for concern despite being, as Bonifazi points out, inevitable given the economic difference between the two areas.
Stanovništvo 2/2014 40
Bibliography
BONIFAZI, C. (ed.) (1999). Mezzogiorno e migrazioni interne. IRP-Monografie: Roma. ottobre.
BONIFAZI, C. (2013). L'Italia delle migrazioni (Bologna: Il Mulino).
CASACCHIA, O. (2002). "Mobilità interna e insediamento della popolazione in Italia". In Natale M. (a cura di) Economia e Popolazione (Milano: Franco Angeli).
CASACCHIA, O. et al (2006). "Population prospects and problems of Italian Regions". Genus, LXI, 3-4.
CANTALINI, B., A. VALENTINI (2012). La recente mobilità territoriale in Italia. (Recent territorial mobility in Italy). ISTAT.
CASACCHIA, O. et al (2010). "Italians’ and Foreigners’ Internal Mobility in Italy: an Application of Gravitational Models". In Proceedings of 45th Scientific Meeting of the Italian Statistical Society.
DE SANTIS, G. (2010). "Mobilità a corto e lungo raggio e pendolarismo della popolazione italiana". In Livi Bacci M. (a cura di) Demografia del capitale umano (Bologna: Il Mulino).
DI GIULIO P., C. REYNAUD, L. VERGAGLIA (2012). "How internal and international migrations have shaped the age structure of the Italian regions, 1955-2008". In Proceedings of XLVI Scientific Meeting of the Italian Statistical Society, 20-22 Giugno 2012.
GOLINI, A., C. REYNAUD (2010). "South-north movements in Italy forty years later". In Rivista Italiana di Economia, Demografia e Statistica LXIV: 101-122.
LIVI BACCI, M. (2007). "Ma c'e' davvero una ripresa delle migrazioni sud-nord?" (Is there really a return to South-North migration?) in neodemos.it
PUGLIESE, E. (2006). L’Italia tra migrazioni internazionali e migrazioni interne (Bologna: Il Mulino).
LAMONICA, G. R., B. ZAGAGLIA (2013). "The determinants of internal mobility in Italy, 1995-2006: A comparison of Italians and resident foreigners". Demographic Research, 29, Article 16: 407-440.
REYNAUD, C, C. CONTI (2011). "Mobilità della popolazione, immigrazione e presenza straniera". In Salvini S, A. De Rose et al. Rapporto sulla popolazione. l'Italia a 150 anni dall'Unità (Bologna: Il Mulino) p. 97-118.
Internal Mobility in Italy: A New Delay 41
Cecilia Reynaud, Enrico Tucci
Internal Mobility in Italy: A New Delay
S u m m a r y
In Italy, internal migration has made a far more important contribution to defining the territorial distribution of the population as it is today, and as such must not be neglected.
In this paper, we attempt to understand which type of migration has had the strongest influence on migration trends in recent years, what contribution the various geographical areas have made to internal migration and what effect the migration of foreigners has had. We also want to examine the characteristics of the individuals taking part in migrations.
By analysing the data on changes of residence – the most frequently used source for studying internal mobility – divided by geographical area and then by geographical area of destination and origin, we can get an idea of whether migration has changed or not over the last decade. In particular, we will be analysing transfers in the years from 2003 to 2012.
We constructed the in-migration and out-migration rates for each geographical area and type of migration, as well as breaking down the rates by gender, age class and citizenship, distinguishing between Italians and foreigners. Lastly, we will apply a logistical regression model to the flows, comparing the inter-area and intra-area migration types to see whether the differences are mostly attributable to the characteristics of the individuals or the situation.
Migrations in Italy, which have represented a particularly important phenomenon for population distribution and trends, picked up in the 1990s before increasing once more in 2010 and reaching a particular intensity in 2012. This could be linked to the displacements recorded in the years after the census; however, the increases are too high to be explained only by this factor.
Intra-provincial migrations have always been, and continue to be, the most common, probably due to a population that continues to spread throughout the territory and expand into larger areas, to the point that city borders are no longer easy to define, forming extended metropolitan areas. The other types considered, although less important from a numerical point of view, appear to be even more significant for describing the situation in Italy. Migrations between geographical areas were particularly useful for describing the strong North-South dichotomy in our country in terms of economic and social development. More recently, the return of South to North migration appears to depend not only on the differences in numbers and quality on the labour market, but also on the continuation of the economic crisis.
By analysing the people who migrate in Italy, we can see that young people and foreigners play a pre-eminent role, along with a confirmation of the higher level of economic and social development in the North than the South, where women still hold a marginal position. When we analyse migration by gender, we see a higher level of participation among women, and in particular young women, although out in Northern areas, with a continued delay in long-distance
Stanovništvo 2/2014 42
migrations from the South. The role of foreigners also stood out clearly, who despite behaving in a similar way to Italians, as confirmed by the models, show some specific features such as a higher level of participation among women even in adult age classes, a high level of in-migration in Southern areas and a lower level of long-distance migrations. Like Italians, the balance of foreign migration in the South is strongly negative, but in this case the finding is due to high levels of both in-migration and out-migration.
Key words: internal migration; transfer of residence; North-South divide
Cecilia Reynaud, Enrico Tucci
Unutrašnje migracije u Italiji: Novo kašnjenje
S a ž e t a k
U odnosu na velike migracije tokom 1960-ih, može se primetiti ogromna promena u mobilnosti stanovništva od druge polovine 1990-ih iz dva razloga: prvi je porast mobilnosti na kraće distance, a drugi je snažan porast privlačenja od strane geografskih oblasti u centralnoj a naročito severoistočnoj Italiji. Poslednjih godina, ponovo je došlo do promena u razvoju unutrašnjih migracija, i to u pravcu pada zajedno sa gubitkom atraktivnosti pojedinih oblasti u centralnom i severnom delu zemlje. Nedavne promene u mobilnosti stanovništva bi mogle ukazati na to da se veliki jaz između Severa i Juga zatvara. Međutim, to nije slučaj u potpunosti, pošto razlike u mobilnosti između geografskih oblasti i dalje ostaju, a u nekim slučajevima se čak i povećavaju. U stvari, ova analiza nam omogućava da pokažemo kako je migracioni gubitak stanovništva na jugu Italije zapravo porastao. Osnovni fokus studije je na evoluciji istraživane pojave po geografskim oblastima kao i na varijabilnosti migracija po polu i starosnim grupama. Iako je jasno da se ne suočavamo sa novim skokom iseljavanja sa juga, evidentno je da se iseljavanje nastavlja, što predstavlja ozbiljan gubitak ljudskog kapitala u ovoj oblasti.
Ključne reči: unutrašnje migracije, promena prebivališta, podela Sever-Jug


![Interacting State Machines for Mobility - von Oheimbdavid.von-oheimb.de/cs/papers/ISMfM_slides.pdf · Interacting State Machines for Mobility ... h2ip]] Thomas A. Kuhn, ... Italy,](https://img.pdfslide.us/doc/110x75/5abef14d7f8b9a3a428d97df/interacting-state-machines-for-mobility-von-state-machines-for-mobility-h2ip.jpg)