Embed Size (px)
Citation preview
“Cycling towards sustainability –
A current analysis of sustainable transportation in
the city of Rome”
Svenja Golombek Masterthesis EMM 12Prof. Dr. Bertil HaackProf. Dr. Carsten Kunkel
Agenda
1. Introduction
1.1 Problem statement
1.2 Research question
1.3 Hypothesis
2. Sustainable city governance & Importance of cycling
2.1 Italy & Rome by bike
2.2 Italian government & cycling associations
09.01.2015 2Golombek, S.
3. Research
3.1 Survey outcome
3.2 The unpublished research project
4. Comparison with Paris
4.1 Paris & Cycling
4.2 Differences & Similarities
5. Conclusion & Outlook
3
Agenda
Golombek, S09.01.2015
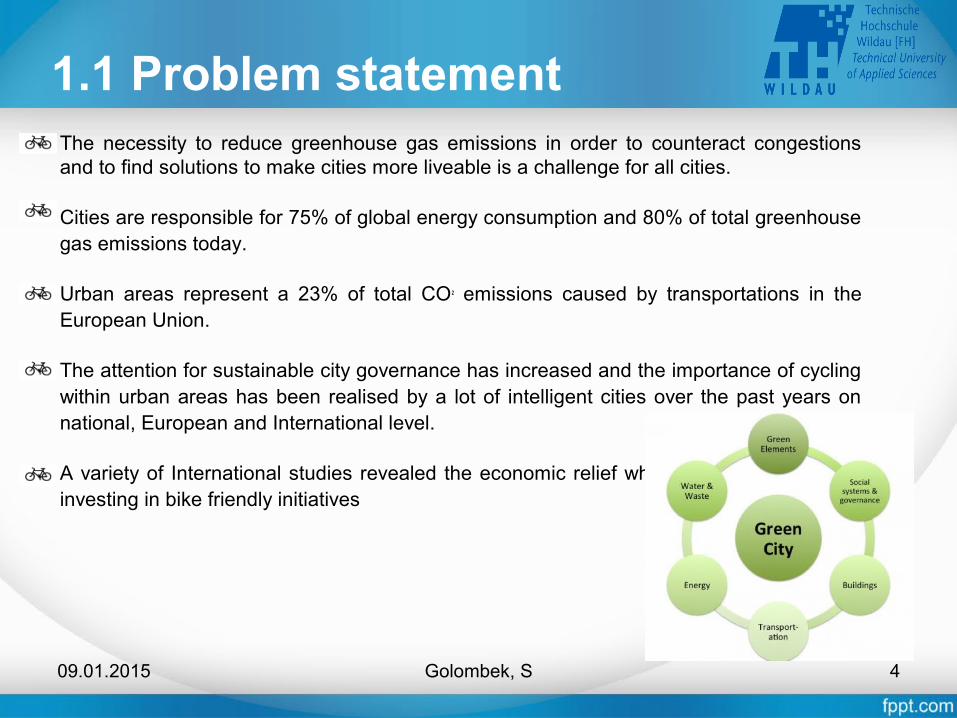
1.1 Problem statementThe necessity to reduce greenhouse gas emissions in order to counteract congestions and to find solutions to make cities more liveable is a challenge for all cities.
Cities are responsible for 75% of global energy consumption and 80% of total greenhouse gas emissions today.
Urban areas represent a 23% of total CO₂ emissions caused by transportations in the European Union.
The attention for sustainable city governance has increased and the importance of cycling within urban areas has been realised by a lot of intelligent cities over the past years on national, European and International level.
A variety of International studies revealed the economic relief when investing in bike friendly initiatives
4Golombek, S09.01.2015
1.1 Research questions
Sustainable mobility in Rome: What is the current situation?
How much is the bicycle used in Rome?
Who rides a bicycle, what are motivations, which purposes and which routes? What are limitations & problems?
Based on this outcome: How can the use of the bicycle be increased over the next years and how can it be better promoted among the inhabitants?
Comparison with similar city such as Paris. Evaluate actions and analyse feasibility of adaption to the city of Rome
5Golombek, S.09.01.2015
1.2 Hypothesis
“Cycling in Rome (and among the Roman population) is not as popular because of the affinity to the car, a dislike of bicycles or the city’s surface but because it is linked to factors that regard city governance. Despite still lacking bike friendly programmes
and initiatives from the local government the use of bicycles will constantly increase.”
6Golombek, S.09.01.2015
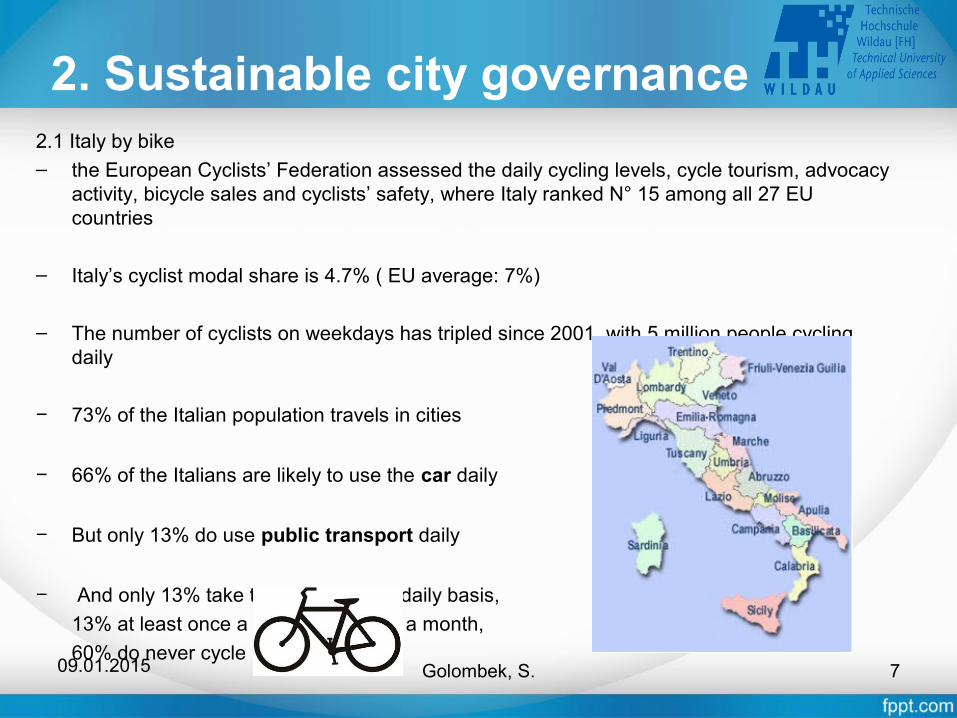
2.1 Italy by bike– the European Cyclists’ Federation assessed the daily cycling levels, cycle tourism, advocacy
activity, bicycle sales and cyclists’ safety, where Italy ranked N° 15 among all 27 EU countries
– Italy’s cyclist modal share is 4.7% ( EU average: 7%)
– The number of cyclists on weekdays has tripled since 2001, with 5 million people cycling daily
− 73% of the Italian population travels in cities
− 66% of the Italians are likely to use the car daily
− But only 13% do use public transport daily
− And only 13% take the bicycle on a daily basis,
13% at least once a week, 14% once a month,
60% do never cycle7
2. Sustainable city governance
Golombek, S.09.01.2015
2.2 Rome by bike
– Rome has 2.6 million inhabitants and i the most populated city in Italy
– Rome is only N°66 among bicycle and pedestrian friendly cities in Italy.
– Romans drive cars: 71 inhabitants out of 100 own a car, the average in Italy is 60.
– cars are responsible for a 57% of the air pollution, Rome has the most polluted air in Italy
– Traffic in the city takes up to 135 million hours of life time every year, Roman citizens
loses three days in traffic jam
– Furthermore it costs the state and the citizens more than 2 billion € a year. (About a 1000€
per car driver and 700€ per public transport user)
– The mortality on the streets of Rome and the region Lazio with 4.38% has been
significantly high, compared to an average 2%.
– Rome is penultimate in the classification of deaths with 70 deaths per 10.000 inhabitants
– Accidents have a social cost of 573€ per inhabitant
8
2. Sustainable city governance
Golombek, S.09.01.2015
– Rome is classified city N°1 with pedestrian victims in Europe ( 65 death/year compared to
Naples 14/year and Palermo 13/year)
– 80% of the deadly accidents with scooters and motorcycles happen in the capital
– A high cost for the public health care system are accidents. Accidents cause a 40.000 million
€ in health care, assistance, police and judicial costs, reconstruction of damaged good,
streets included.
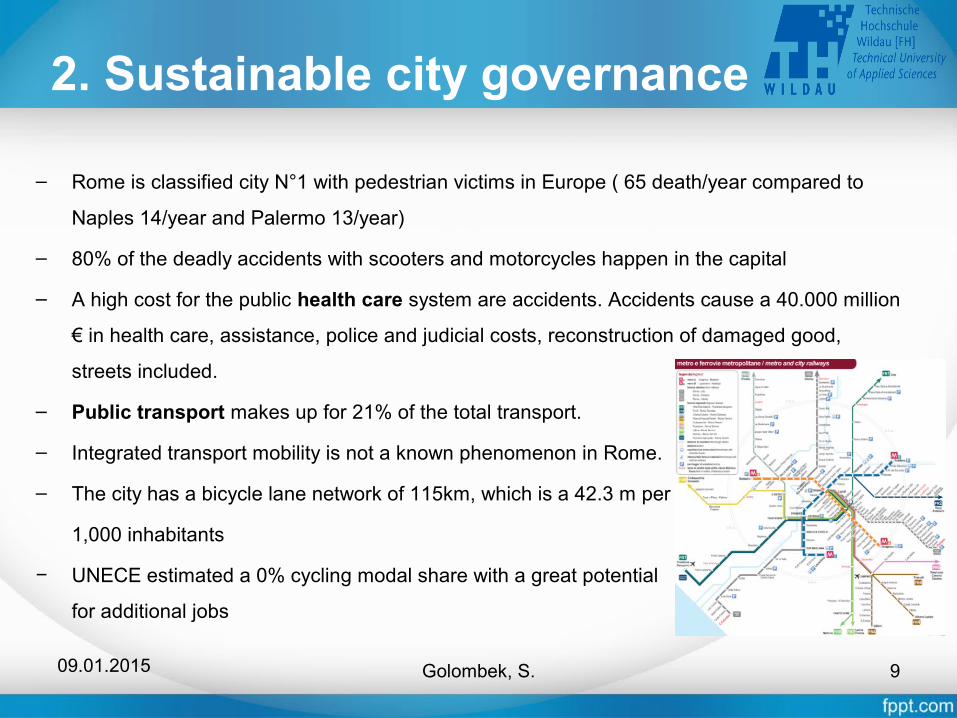
– Public transport makes up for 21% of the total transport.
– Integrated transport mobility is not a known phenomenon in Rome.
– The city has a bicycle lane network of 115km, which is a 42.3 m per
1,000 inhabitants
− UNECE estimated a 0% cycling modal share with a great potential
for additional jobs
9
2. Sustainable city governance
Golombek, S.09.01.2015
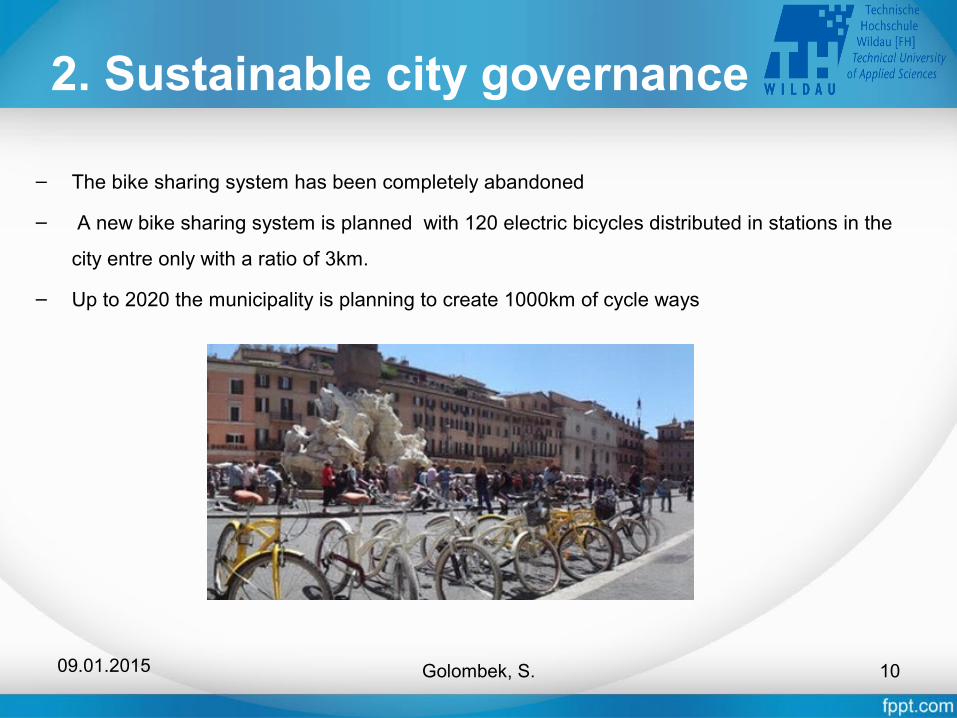
– The bike sharing system has been completely abandoned
– A new bike sharing system is planned with 120 electric bicycles distributed in stations in the
city entre only with a ratio of 3km.
– Up to 2020 the municipality is planning to create 1000km of cycle ways
10
2. Sustainable city governance
Golombek, S.09.01.2015
2.3 Italian Government & Cycling Associations
− Since last year there has been introduced a group of parliamentarians working for the promotion of sustainable transport, in particular the bicycle
− The current legislation is a discrimination of people using the bicycle to go to work. An accident by bike is only acknowledged by law:1. if there is no public transport available to go to work2. if there is no possibility to go by foot from home to work3. only if the accident happens on a bike lane or in a zone not accessible for cars
− There is foreseen a change in the Italian traffic code: the possibility for cyclists to use the reserved lanes for public transport and the introduction of a voluntary bicycle marking in order to be able to identify stolen bicycles
− But bicycles cannot drive the opposite way in one way streets
− The Roman cyclist associations organise a vast variety of different activities and events throughout the year. ( Fiab, Critical Mass, Pedalata di luna piena, Ciemmona, Magnalonga, activities during the European Sustainability Week, Participation in the ECC 2014, English Kitchen etc. )
11
2. Sustainable city governance
Golombek, S.09.01.2015
3. Research
12Golombek, S..09.01.2015
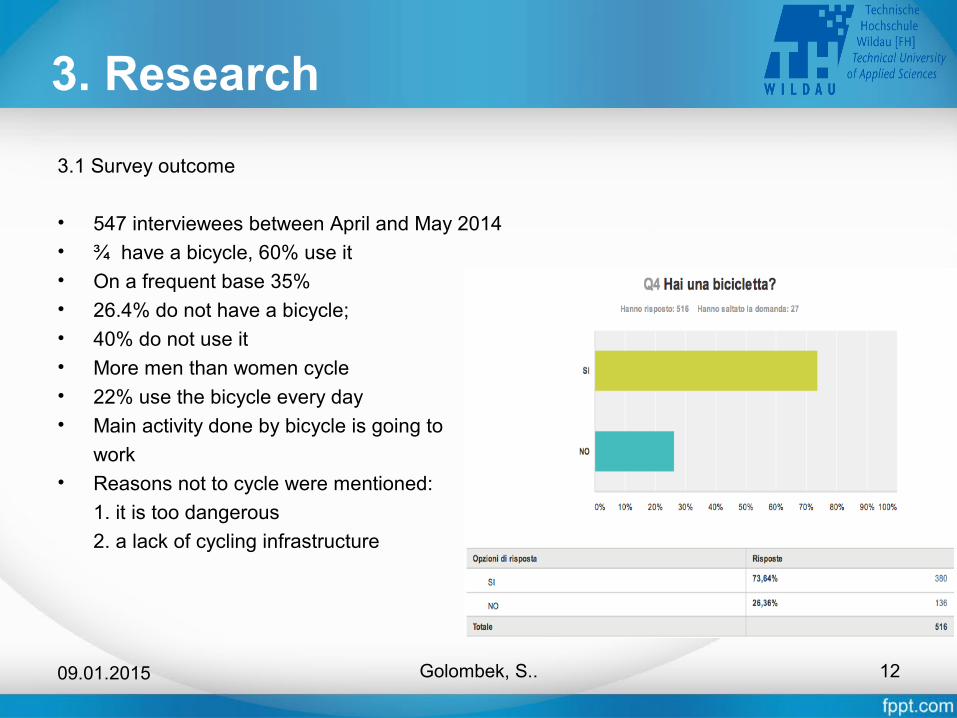
3.1 Survey outcome
• 547 interviewees between April and May 2014• ¾ have a bicycle, 60% use it• On a frequent base 35%• 26.4% do not have a bicycle; • 40% do not use it• More men than women cycle• 22% use the bicycle every day• Main activity done by bicycle is going to
work• Reasons not to cycle were mentioned:
1. it is too dangerous
2. a lack of cycling infrastructure
3. Research
13Golombek, S..09.01.2015
• 73% of those not using the bicycle would like to do so, 13% answered no• Lowest percentage of bike users between 18-30 years old – but the highest percentage of
potential users• The number of cyclists is increasingly growing in the city
3. Research
14Golombek, S..09.01.2015
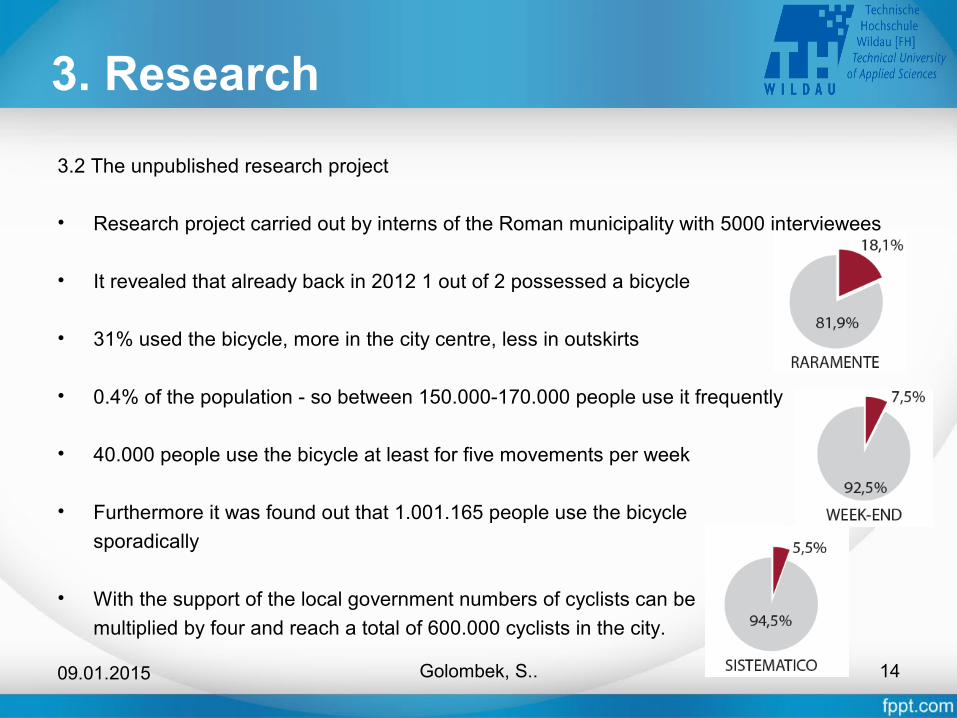
3.2 The unpublished research project
• Research project carried out by interns of the Roman municipality with 5000 interviewees
• It revealed that already back in 2012 1 out of 2 possessed a bicycle
• 31% used the bicycle, more in the city centre, less in outskirts
• 0.4% of the population - so between 150.000-170.000 people use it frequently
• 40.000 people use the bicycle at least for five movements per week
• Furthermore it was found out that 1.001.165 people use the bicycle
sporadically
• With the support of the local government numbers of cyclists can be
multiplied by four and reach a total of 600.000 cyclists in the city.
3. Research
15Golombek, S..09.01.2015
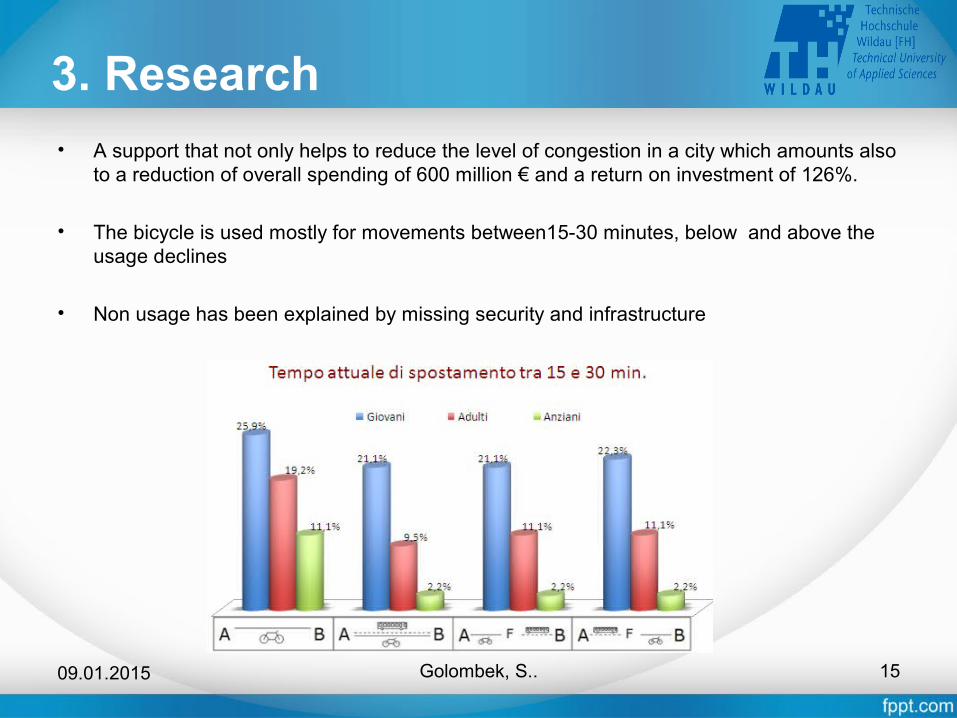
• A support that not only helps to reduce the level of congestion in a city which amounts also to a reduction of overall spending of 600 million € and a return on investment of 126%.
• The bicycle is used mostly for movements between15-30 minutes, below and above the usage declines
• Non usage has been explained by missing security and infrastructure
4. Comparison with Paris
16Golombek, S..09.01.2015
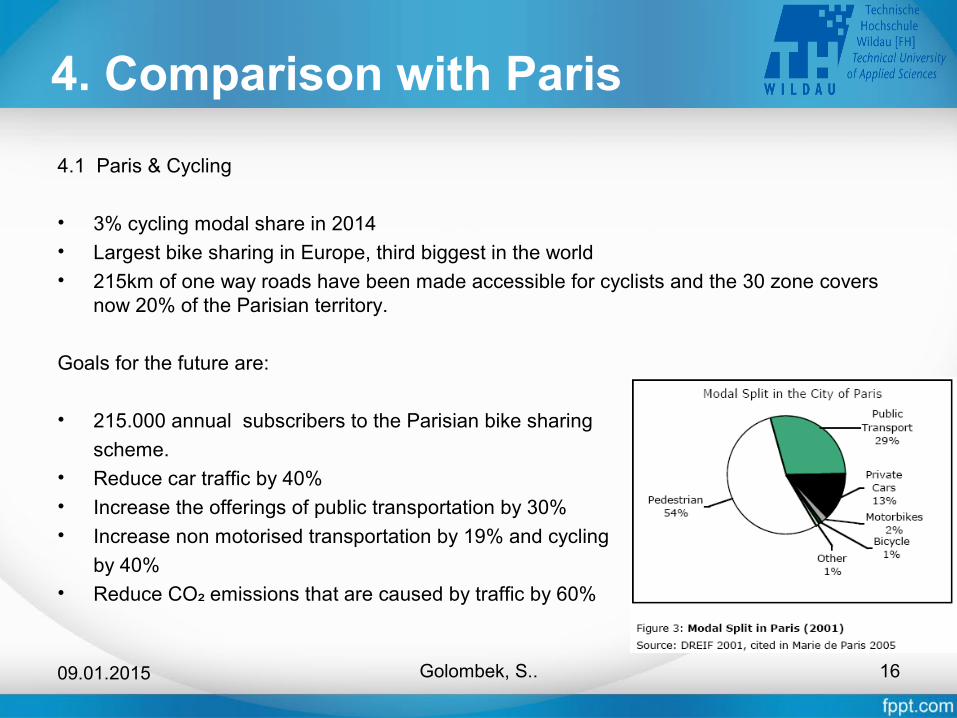
4.1 Paris & Cycling
• 3% cycling modal share in 2014• Largest bike sharing in Europe, third biggest in the world• 215km of one way roads have been made accessible for cyclists and the 30 zone covers
now 20% of the Parisian territory.
Goals for the future are:
• 215.000 annual subscribers to the Parisian bike sharing
scheme.• Reduce car traffic by 40%• Increase the offerings of public transportation by 30%• Increase non motorised transportation by 19% and cycling
by 40%• Reduce CO emissions that are caused by traffic by 60%₂
4. Comparison with Paris
17Golombek, S..09.01.2015
4.2 Differences & Similarities
• There is no coherent view of changing the central problem and move towards sustainable mobility in Rome
• final actions in supporting sustainable mobility are rather heterogeneous.
• Objectives and goals that want to be reached are not defined at all as it is instead very clearly and precisely the case in the Parisian mobility plan.
• The actions in Paris are incomparable to the ones in Rome
• Paris focuses on the strategy “Flooding the market” with introducing a variety of changes consequently and consistently throughout the whole city
• Paris, different from Rome has understood that a city with declining mobility conditions, traffic danger, accidents, air pollution, noise and a lack of choices of moving around other than by car is losing its competitiveness and liveability, but also its inhabitants.
• In order to be able to reach a position such as the one of Paris, the political attitude towards the bicycle and sustainable mobility needs to change
5. Conclusion
18Golombek, S.09.01.2015
• Cycling is gaining ground amongst the Roman population but initiatives are rare
• Main issue is that the municipality is still not recognising the importance of sustainable city governance, sustainable transportation and cycling
• A great engagement from a number of different cyclist associations is recognised
• Both research projects refute the statement that cycling in Rome is not as popular because of a dislike of bicycles or the city’s surface but confirm the hypothesis that the willingness to cycle is linked to factors regarding city governance such as road security and cycling infrastructure
5. Conclusion
19Golombek, S..09.01.2015
• Unless the attitude towards sustainable transportation within the (local) government does not change, the cycling landscape will only slowly change but will not reach Parisian levels
• Furthermore the numbers testify that despite a lack of bike friendly initiatives the level of cycling is increasing constantly.
• On the other hand, the more the number of cyclists is going to increase over time the more
likely it becomes that the city will consider and implement more bike friendly initiatives such as it is the case in Paris.

Thank you for your attention
Do you have any questions?