Embed Size (px)
Citation preview
INTERIM RESULTS PRESENTATION
FOR THE SIX MONTHS ENDED
31 DECEMBER 2016
17 MARCH 2017
2
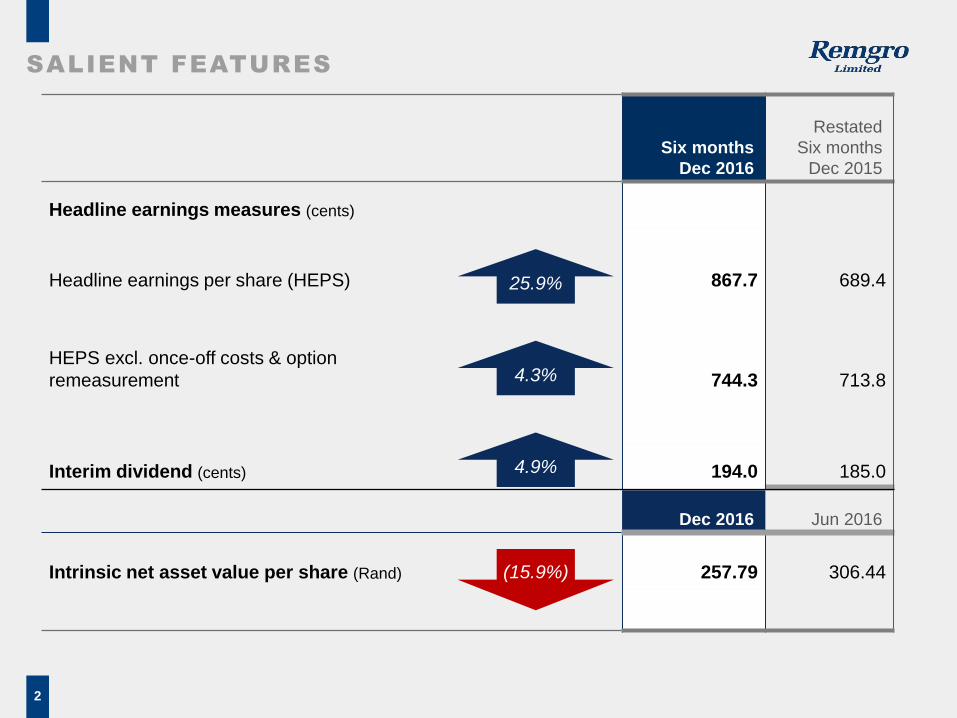
Dec 2016 Jun 2016
Intrinsic net asset value per share (Rand) 257.79 306.44
Six months
Dec 2016
Restated
Six months
Dec 2015
Headline earnings measures (cents)
Headline earnings per share (HEPS) 867.7 689.4
HEPS excl. once-off costs & option
remeasurement 744.3 713.8
Interim dividend (cents) 194.0 185.0
SALIENT FEATURES
(15.9%)
4.3%
25.9%
4.9%
3
HEADLINE EARNINGS ANALYSIS
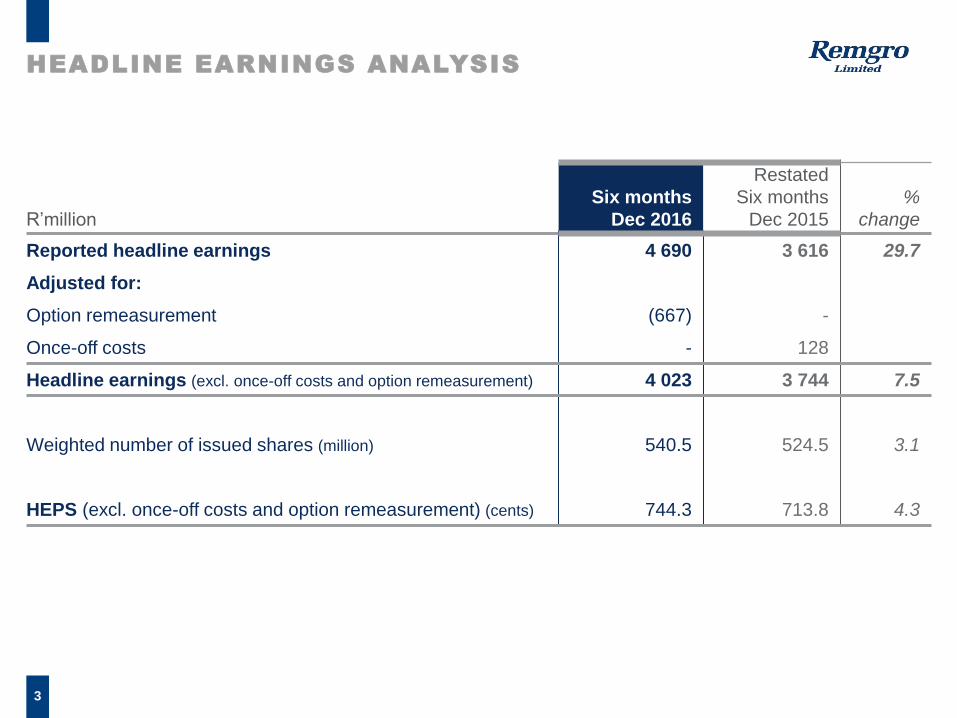
R’million
Six months
Dec 2016
Restated
Six months
Dec 2015
%
change
Reported headline earnings 4 690 3 616 29.7
Adjusted for:
Option remeasurement (667) -
Once-off costs - 128
Headline earnings (excl. once-off costs and option remeasurement) 4 023 3 744 7.5
Weighted number of issued shares (million) 540.5 524.5 3.1
HEPS (excl. once-off costs and option remeasurement) (cents) 744.3 713.8 4.3
4
RESTATEMENT AND RIGHTS ISSUE
RESTATEMENT OF DECEMBER 2015 RESULTS
• The adoption of the amendments to IAS 16: Property, Plant and Equipment and IAS 41: Agriculture resulted
in RCL Foods having to:
• reclassify bearer plants from biological assets to property, plant and equipment; and
• reallocate the remaining non-current biological assets to current biological assets
• The adjustment of the weighted average number of shares in issue by 9 994 195 shares as a result of the
rights issue shares having been issued at a discounted price
RIGHTS ISSUE
During October 2016 Remgro completed a rights issue, whereby the company issued:
• 48 110 637 new Remgro ordinary shares, and
• 3 550 635 B ordinary shares;
• at a subscription price of R192.50 per share – total consideration: R9 944.8 million
• discount to Remgro share price on the day before the announcement, being R243.29 per share: 20.9%
• Oversubscribed by 110%
5
INVESTMENT ACTIVITIES
COMMUNITY INVESTMENT VENTURES HOLDINGS (PTY) LTD (CIVH)
• During September 2016 Remgro subscribed for an additional 12 353 shares amounting to R329.3 million in
terms of CIVH’s rights issue
• Remgro’s effective interest increased marginally to 51.0% (June 2016: 50.9%)
INVENFIN (PTY) LTD (INVENFIN)
• On 27 July 2016 Remgro, through its wholly owned subsidiary Invenfin, acquired a 30% stake in Dynamic
Commodities for R80 million
• Dynamic Commodities is an export-focused company that produces high quality frozen desserts, snacks and
value-added “fresh frozen” fruit
• During August 2017, Invenfin also acquired a 30% stake in Joya Brands, a sweets manufacturer, for
R50.2 million
PEMBANI REMGRO INFRASTRUCTURE FUND (PRIF)
• On 15 August 2016 PRIF had its final close with Remgro receiving:
• a capital distribution of R14.6 million; and
• an income distribution of R3.8 million
• Remgro invested a further R5.6 million (cumulative investment in PRIF is R202.9 million)
• Remaining commitment at 31 December 2016 to PRIF amounted to R447.1 million
6
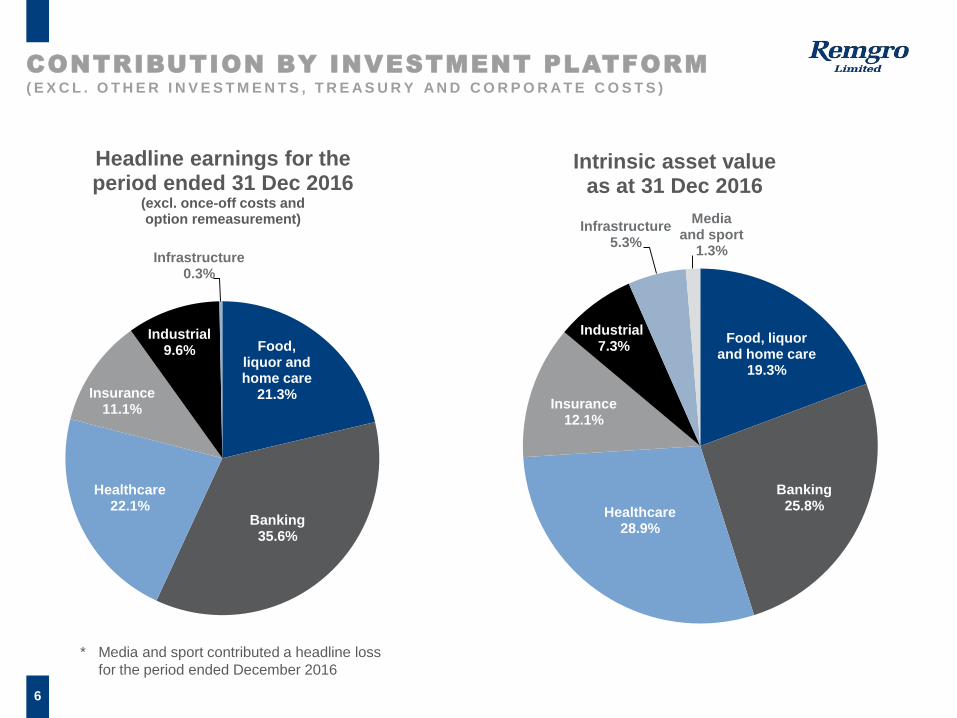
CONTRIBUTION BY INVESTMENT PLATFORM( E X C L . O T H E R I N V E S T M E N T S , T R E A S U R Y A N D C O R P O R A T E C O S T S )
Food, liquor and home care
19.3%
Banking25.8%Healthcare
28.9%
Insurance12.1%
Industrial7.3%
Infrastructure5.3%
Media and sport
1.3%
Intrinsic asset value as at 31 Dec 2016
Food, liquor and home care
21.3%
Banking35.6%
Healthcare22.1%
Insurance11.1%
Industrial9.6%
Infrastructure0.3%
Headline earnings for the period ended 31 Dec 2016
(excl. once-off costs and option remeasurement)
* Media and sport contributed a headline loss
for the period ended December 2016
7
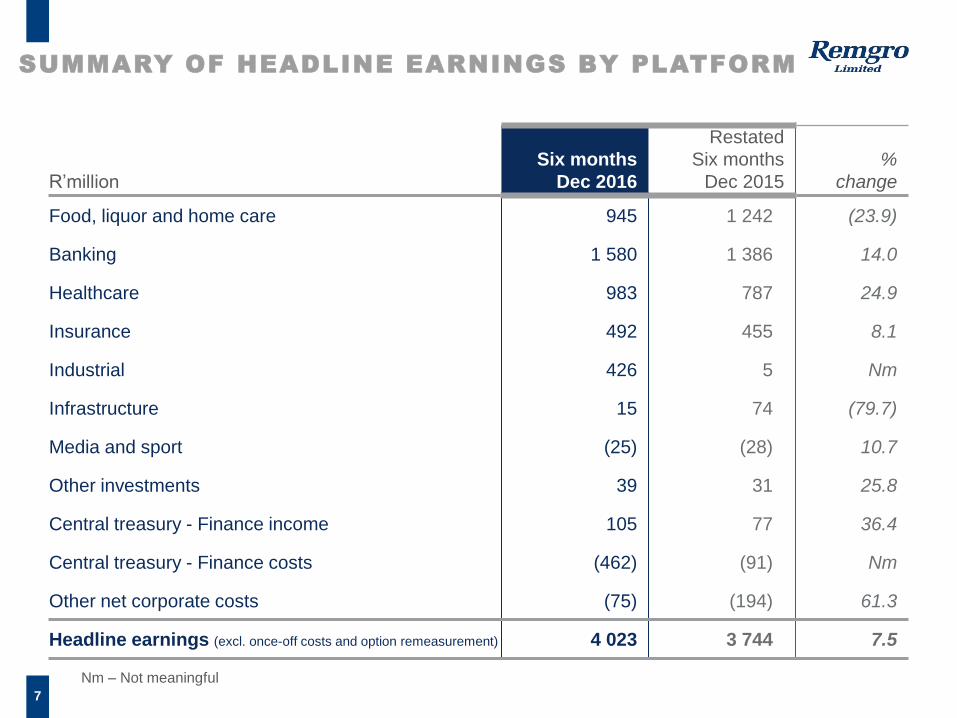
SUMMARY OF HEADLINE EARNINGS BY PLATFORM
R’million
Six months
Dec 2016
Restated
Six months
Dec 2015
%
change
Food, liquor and home care 945 1 242 (23.9)
Banking 1 580 1 386 14.0
Healthcare 983 787 24.9
Insurance 492 455 8.1
Industrial 426 5 Nm
Infrastructure 15 74 (79.7)
Media and sport (25) (28) 10.7
Other investments 39 31 25.8
Central treasury - Finance income 105 77 36.4
Central treasury - Finance costs (462) (91) Nm
Other net corporate costs (75) (194) 61.3
Headline earnings (excl. once-off costs and option remeasurement) 4 023 3 744 7.5
Nm – Not meaningful
8
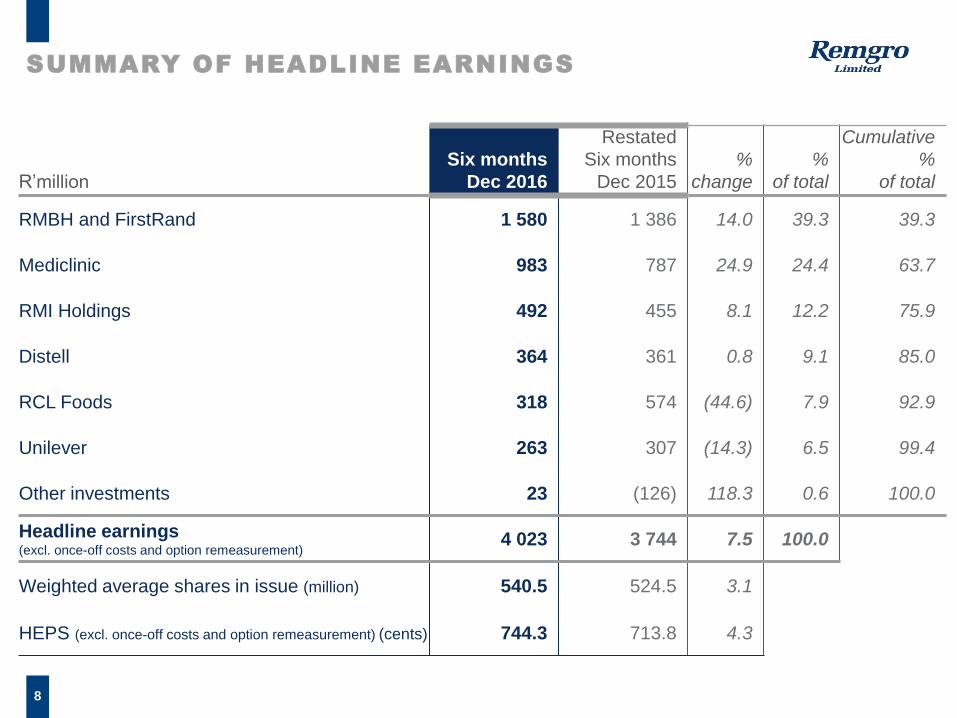
SUMMARY OF HEADLINE EARNINGS
R’million
Six months
Dec 2016
Restated
Six months
Dec 2015
%
change
%
of total
Cumulative
%
of total
RMBH and FirstRand 1 580 1 386 14.0 39.3 39.3
Mediclinic 983 787 24.9 24.4 63.7
RMI Holdings 492 455 8.1 12.2 75.9
Distell 364 361 0.8 9.1 85.0
RCL Foods 318 574 (44.6) 7.9 92.9
Unilever 263 307 (14.3) 6.5 99.4
Other investments 23 (126) 118.3 0.6 100.0
Headline earnings (excl. once-off costs and option remeasurement)
4 023 3 744 7.5 100.0
Weighted average shares in issue (million) 540.5 524.5 3.1
HEPS (excl. once-off costs and option remeasurement) (cents) 744.3 713.8 4.3
9
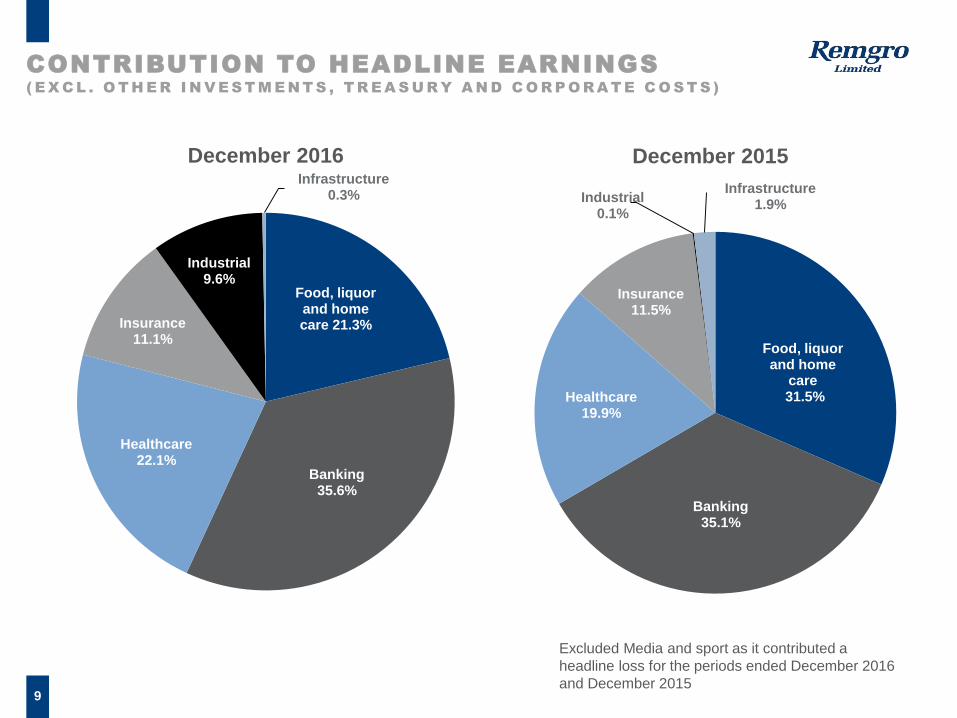
Food, liquor and home care 21.3%
Banking35.6%
Healthcare22.1%
Insurance11.1%
Industrial9.6%
Infrastructure0.3%
December 2016
CONTRIBUTION TO HEADLINE EARNINGS( E X C L . O T H E R I N V E S T M E N T S , T R E A S U R Y A N D C O R P O R A T E C O S T S )
Food, liquor and home
care31.5%
Banking35.1%
Healthcare19.9%
Insurance11.5%
Industrial0.1%
Infrastructure1.9%
December 2015
Excluded Media and sport as it contributed a
headline loss for the periods ended December 2016
and December 2015
10
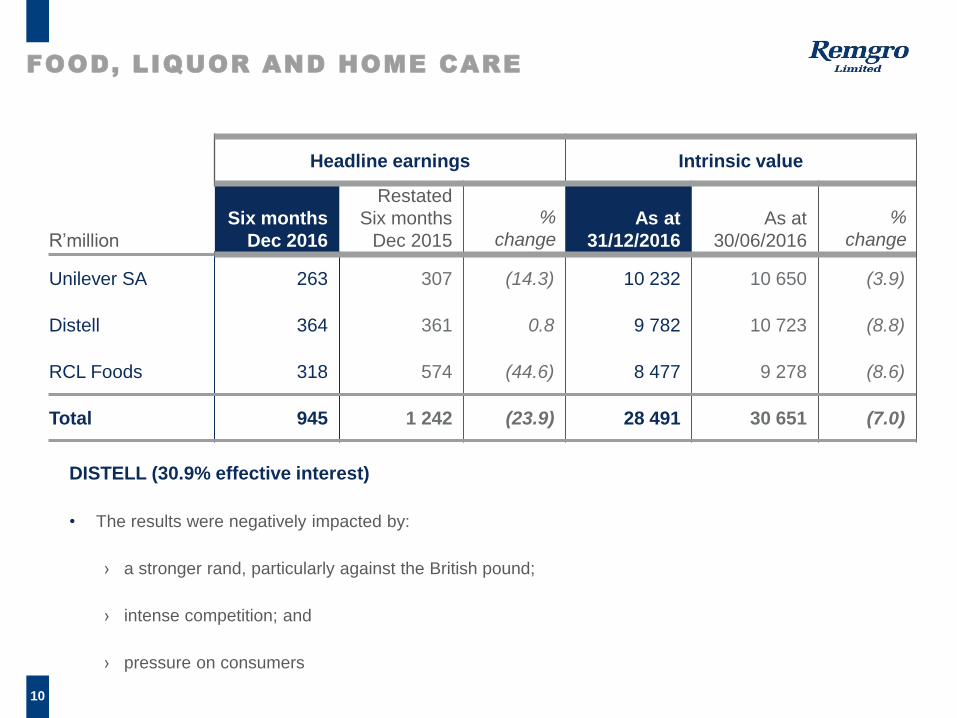
FOOD, LIQUOR AND HOME CARE
DISTELL (30.9% effective interest)
• The results were negatively impacted by:
› a stronger rand, particularly against the British pound;
› intense competition; and
› pressure on consumers
Headline earnings Intrinsic value
R’million
Six months
Dec 2016
Restated
Six months
Dec 2015
%
changeAs at
31/12/2016
As at
30/06/2016
%
change
Unilever SA 263 307 (14.3) 10 232 10 650 (3.9)
Distell 364 361 0.8 9 782 10 723 (8.8)
RCL Foods 318 574 (44.6) 8 477 9 278 (8.6)
Total 945 1 242 (23.9) 28 491 30 651 (7.0)
11
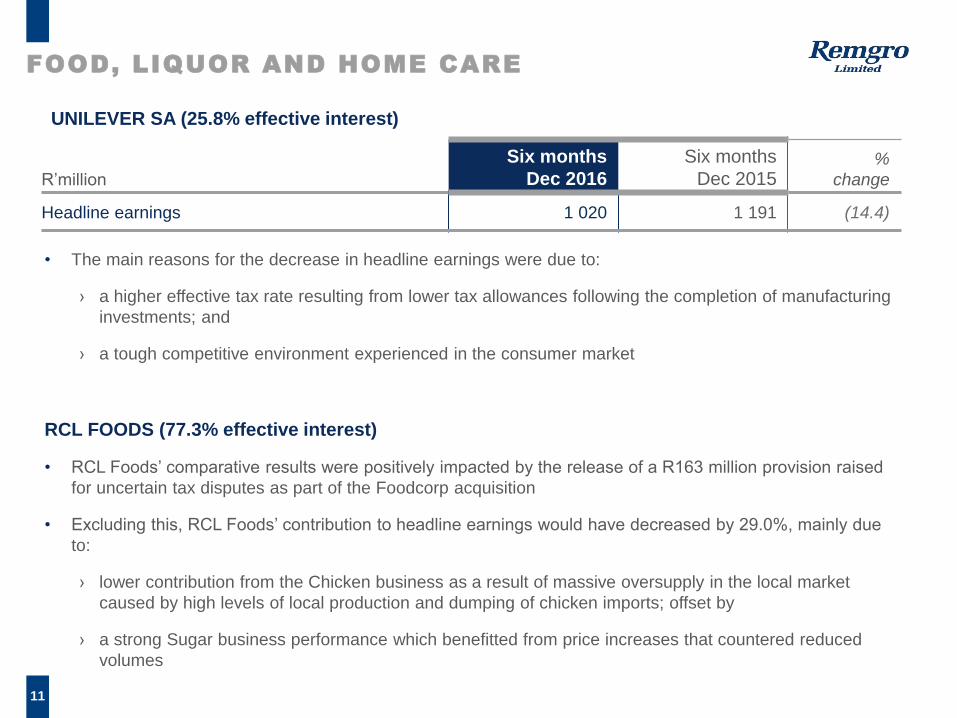
FOOD, LIQUOR AND HOME CARE
• The main reasons for the decrease in headline earnings were due to:
› a higher effective tax rate resulting from lower tax allowances following the completion of manufacturing
investments; and
› a tough competitive environment experienced in the consumer market
RCL FOODS (77.3% effective interest)
• RCL Foods’ comparative results were positively impacted by the release of a R163 million provision raised
for uncertain tax disputes as part of the Foodcorp acquisition
• Excluding this, RCL Foods’ contribution to headline earnings would have decreased by 29.0%, mainly due
to:
› lower contribution from the Chicken business as a result of massive oversupply in the local market
caused by high levels of local production and dumping of chicken imports; offset by
› a strong Sugar business performance which benefitted from price increases that countered reduced
volumes
UNILEVER SA (25.8% effective interest)
R’million
Six months
Dec 2016
Six months
Dec 2015%
change
Headline earnings 1 020 1 191 (14.4)
12
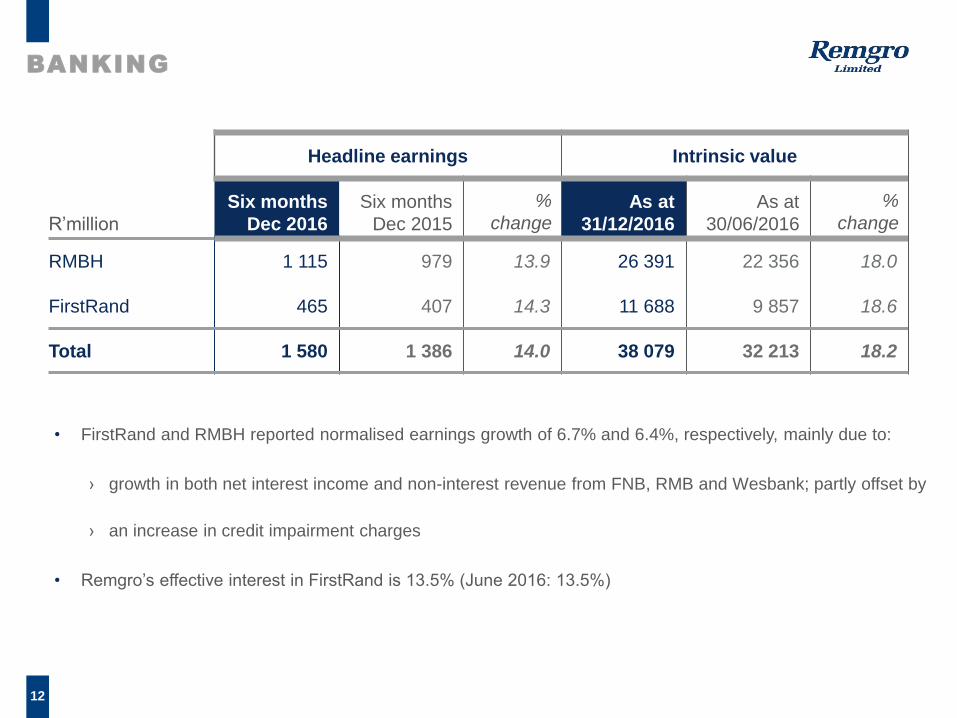
BANKING
• FirstRand and RMBH reported normalised earnings growth of 6.7% and 6.4%, respectively, mainly due to:
› growth in both net interest income and non-interest revenue from FNB, RMB and Wesbank; partly offset by
› an increase in credit impairment charges
• Remgro’s effective interest in FirstRand is 13.5% (June 2016: 13.5%)
Headline earnings Intrinsic value
R’million
Six months
Dec 2016
Six months
Dec 2015
%
changeAs at
31/12/2016
As at
30/06/2016
%
change
RMBH 1 115 979 13.9 26 391 22 356 18.0
FirstRand 465 407 14.3 11 688 9 857 18.6
Total 1 580 1 386 14.0 38 079 32 213 18.2
13
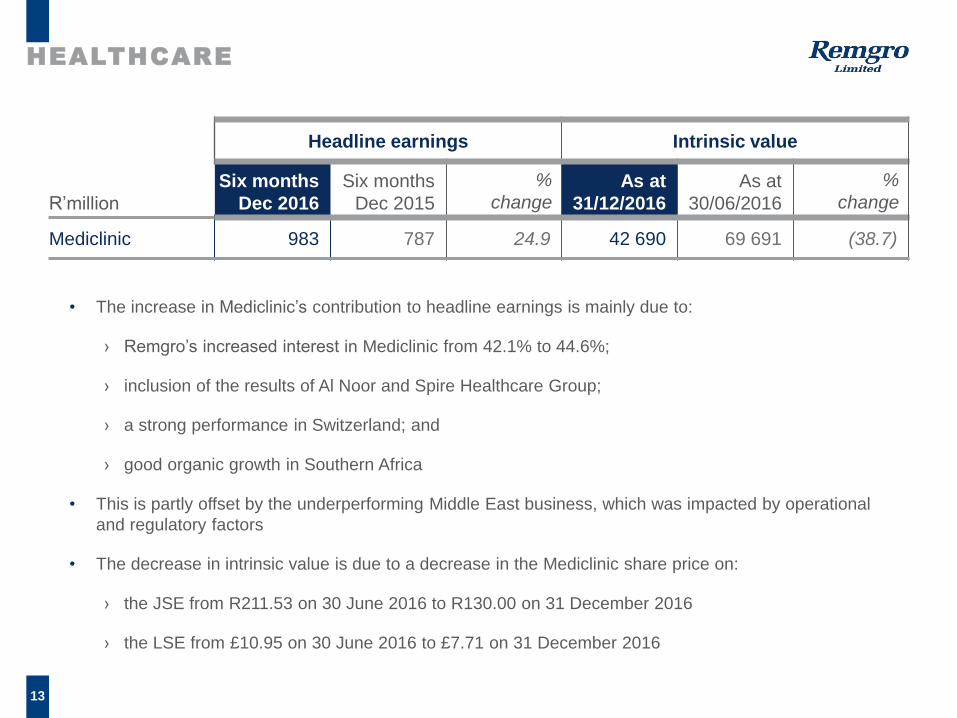
HEALTHCARE
• The increase in Mediclinic’s contribution to headline earnings is mainly due to:
› Remgro’s increased interest in Mediclinic from 42.1% to 44.6%;
› inclusion of the results of Al Noor and Spire Healthcare Group;
› a strong performance in Switzerland; and
› good organic growth in Southern Africa
• This is partly offset by the underperforming Middle East business, which was impacted by operational
and regulatory factors
• The decrease in intrinsic value is due to a decrease in the Mediclinic share price on:
› the JSE from R211.53 on 30 June 2016 to R130.00 on 31 December 2016
› the LSE from £10.95 on 30 June 2016 to £7.71 on 31 December 2016
Headline earnings Intrinsic value
R’million
Six months
Dec 2016
Six months
Dec 2015
%
changeAs at
31/12/2016
As at
30/06/2016
%
change
Mediclinic 983 787 24.9 42 690 69 691 (38.7)
14
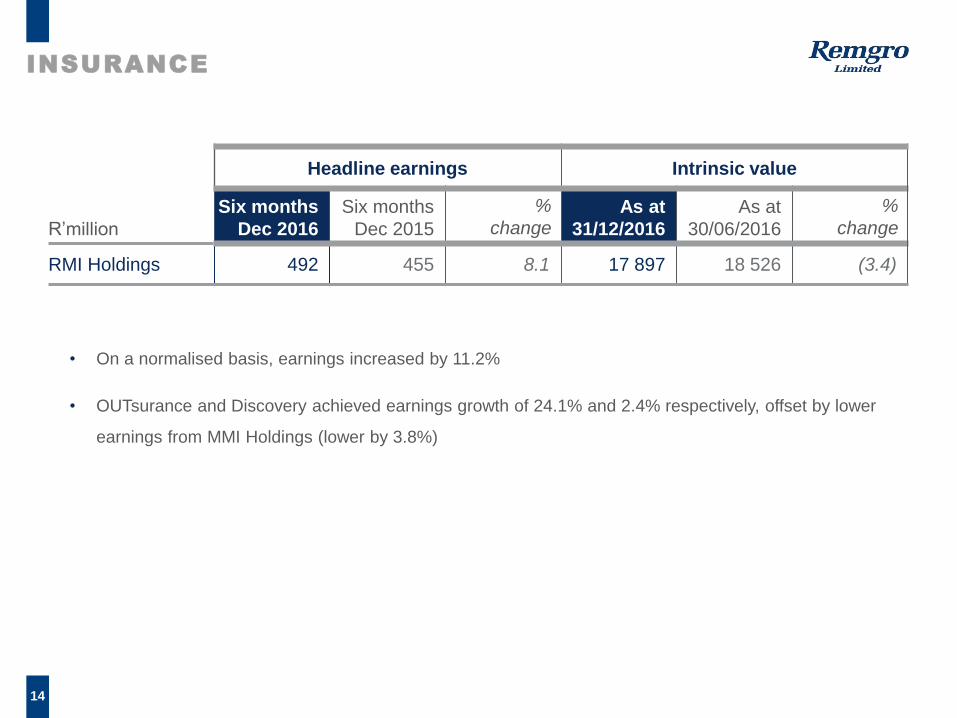
• On a normalised basis, earnings increased by 11.2%
• OUTsurance and Discovery achieved earnings growth of 24.1% and 2.4% respectively, offset by lower
earnings from MMI Holdings (lower by 3.8%)
Headline earnings Intrinsic value
R’million
Six months
Dec 2016
Six months
Dec 2015
%
changeAs at
31/12/2016
As at
30/06/2016
%
change
RMI Holdings 492 455 8.1 17 897 18 526 (3.4)
INSURANCE
15
INDUSTRIAL
Headline earnings/(loss) Intrinsic value
R’million
Six months
Dec 2016
Six months
Dec 2015
%
changeAs at
31/12/2016
As at
30/06/2016
%
change
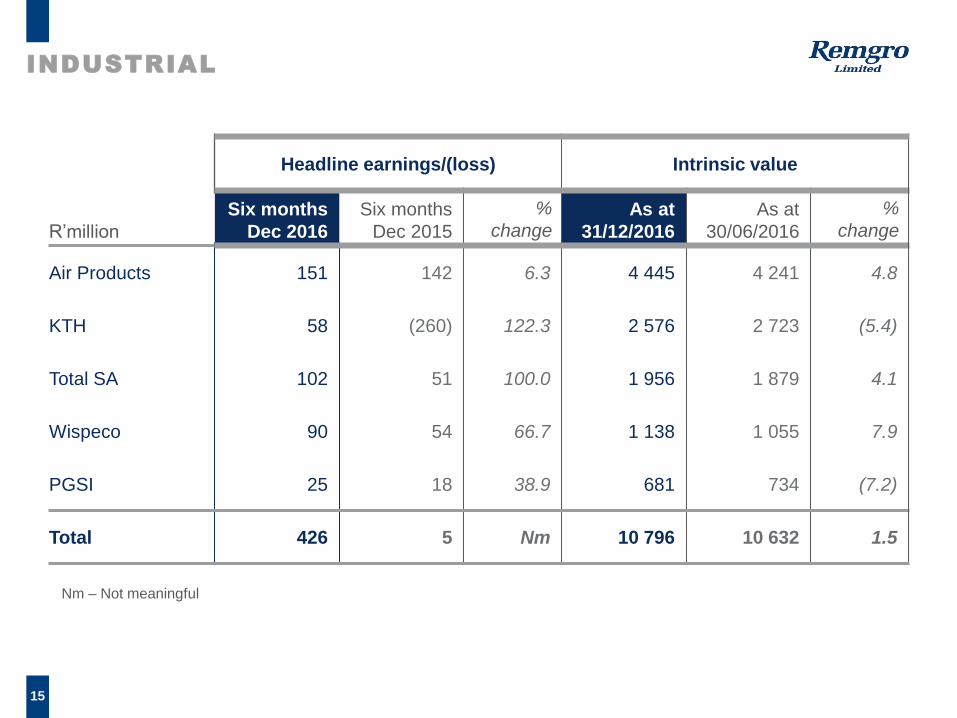
Air Products 151 142 6.3 4 445 4 241 4.8
KTH 58 (260) 122.3 2 576 2 723 (5.4)
Total SA 102 51 100.0 1 956 1 879 4.1
Wispeco 90 54 66.7 1 138 1 055 7.9
PGSI 25 18 38.9 681 734 (7.2)
Total 426 5 Nm 10 796 10 632 1.5
Nm – Not meaningful
16
INDUSTRIAL
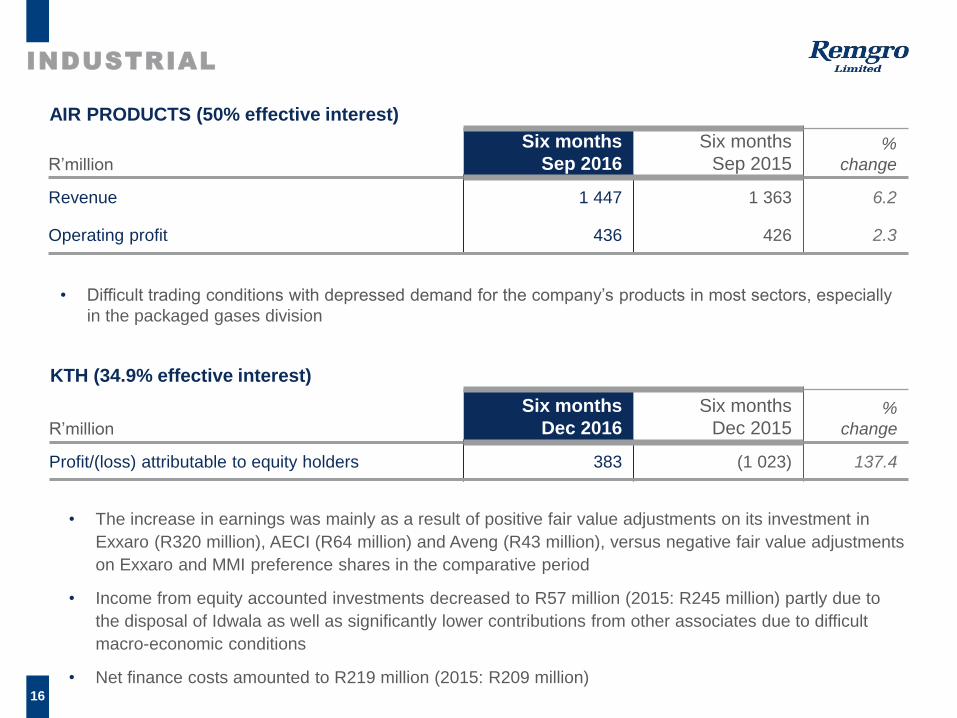
• Difficult trading conditions with depressed demand for the company’s products in most sectors, especially
in the packaged gases division
• The increase in earnings was mainly as a result of positive fair value adjustments on its investment in
Exxaro (R320 million), AECI (R64 million) and Aveng (R43 million), versus negative fair value adjustments
on Exxaro and MMI preference shares in the comparative period
• Income from equity accounted investments decreased to R57 million (2015: R245 million) partly due to
the disposal of Idwala as well as significantly lower contributions from other associates due to difficult
macro-economic conditions
• Net finance costs amounted to R219 million (2015: R209 million)
AIR PRODUCTS (50% effective interest)
R’million
Six months
Sep 2016
Six months
Sep 2015%
change
Revenue 1 447 1 363 6.2
Operating profit 436 426 2.3
KTH (34.9% effective interest)
R’million
Six months
Dec 2016
Six months
Dec 2015%
change
Profit/(loss) attributable to equity holders 383 (1 023) 137.4
17
INDUSTRIAL
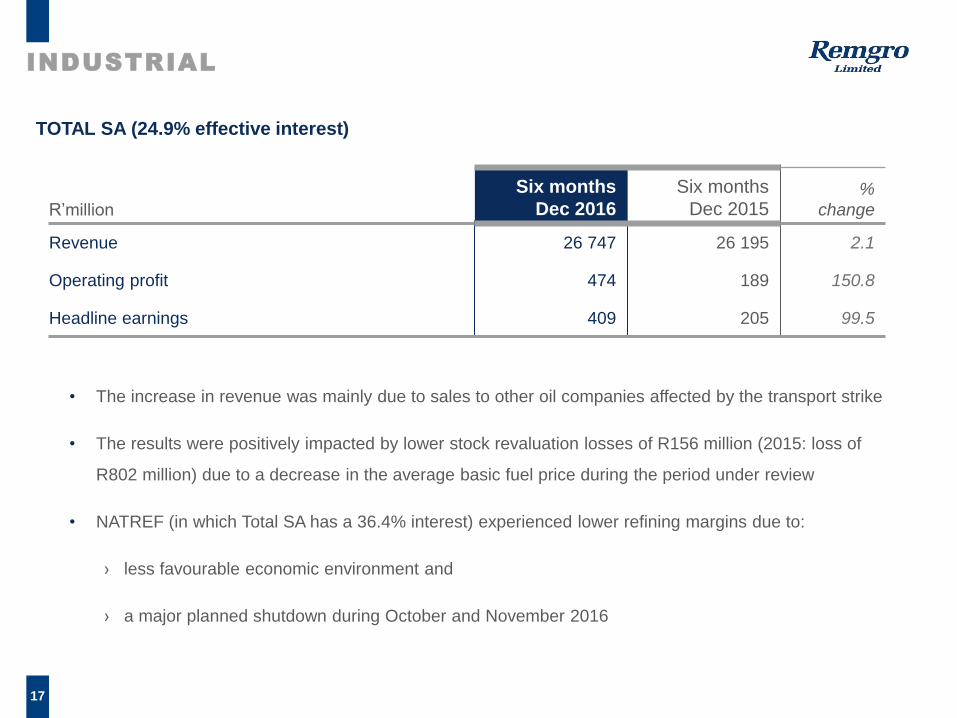
• The increase in revenue was mainly due to sales to other oil companies affected by the transport strike
• The results were positively impacted by lower stock revaluation losses of R156 million (2015: loss of
R802 million) due to a decrease in the average basic fuel price during the period under review
• NATREF (in which Total SA has a 36.4% interest) experienced lower refining margins due to:
› less favourable economic environment and
› a major planned shutdown during October and November 2016
TOTAL SA (24.9% effective interest)
R’million
Six months
Dec 2016
Six months
Dec 2015%
change
Revenue 26 747 26 195 2.1
Operating profit 474 189 150.8
Headline earnings 409 205 99.5
18
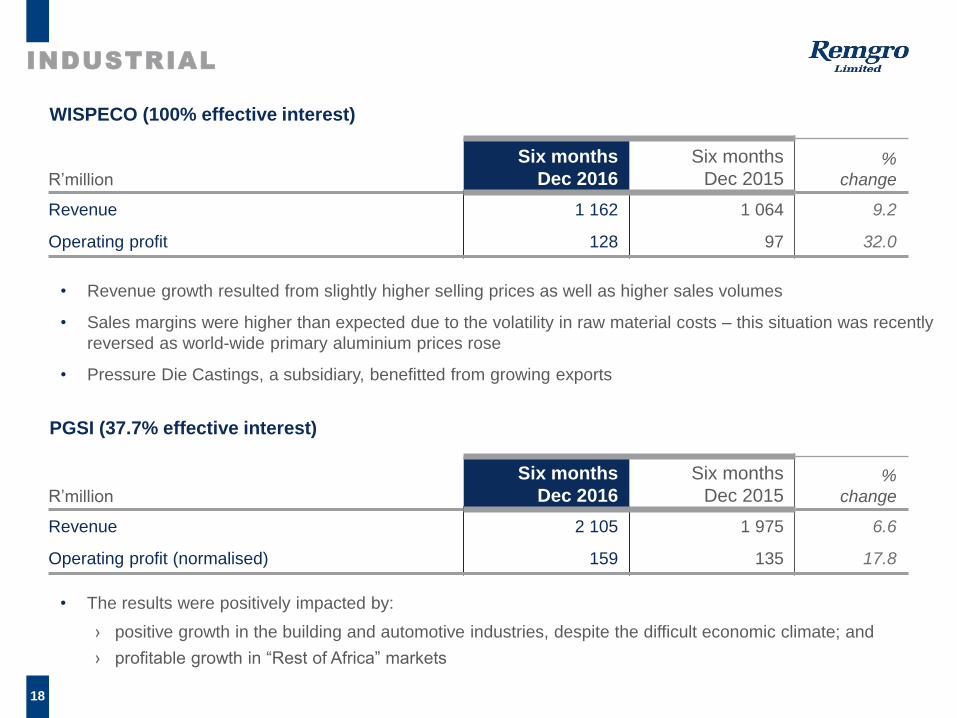
INDUSTRIAL
• Revenue growth resulted from slightly higher selling prices as well as higher sales volumes
• Sales margins were higher than expected due to the volatility in raw material costs – this situation was recently
reversed as world-wide primary aluminium prices rose
• Pressure Die Castings, a subsidiary, benefitted from growing exports
WISPECO (100% effective interest)
R’million
Six months
Dec 2016
Six months
Dec 2015%
change
Revenue 1 162 1 064 9.2
Operating profit 128 97 32.0
PGSI (37.7% effective interest)
R’million
Six months
Dec 2016
Six months
Dec 2015%
change
Revenue 2 105 1 975 6.6
Operating profit (normalised) 159 135 17.8
• The results were positively impacted by:
› positive growth in the building and automotive industries, despite the difficult economic climate; and
› profitable growth in “Rest of Africa” markets
19
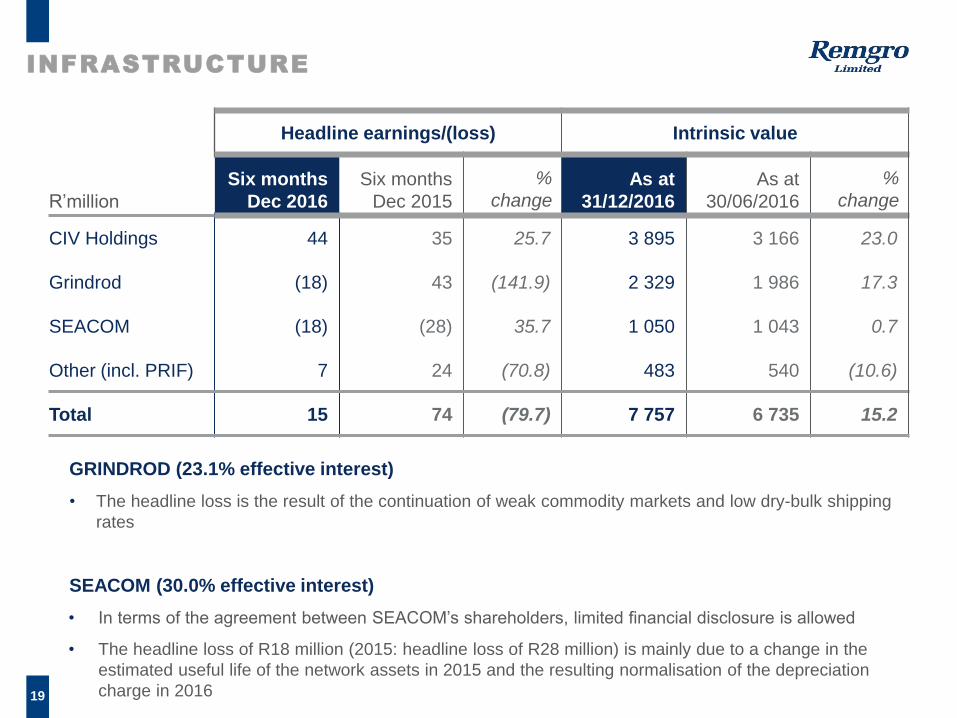
INFRASTRUCTURE
GRINDROD (23.1% effective interest)
• The headline loss is the result of the continuation of weak commodity markets and low dry-bulk shipping
rates
SEACOM (30.0% effective interest)
• In terms of the agreement between SEACOM’s shareholders, limited financial disclosure is allowed
• The headline loss of R18 million (2015: headline loss of R28 million) is mainly due to a change in the
estimated useful life of the network assets in 2015 and the resulting normalisation of the depreciation
charge in 2016
Headline earnings/(loss) Intrinsic value
R’million
Six months
Dec 2016
Six months
Dec 2015
%
changeAs at
31/12/2016
As at
30/06/2016
%
change
CIV Holdings 44 35 25.7 3 895 3 166 23.0
Grindrod (18) 43 (141.9) 2 329 1 986 17.3
SEACOM (18) (28) 35.7 1 050 1 043 0.7
Other (incl. PRIF) 7 24 (70.8) 483 540 (10.6)
Total 15 74 (79.7) 7 757 6 735 15.2
20
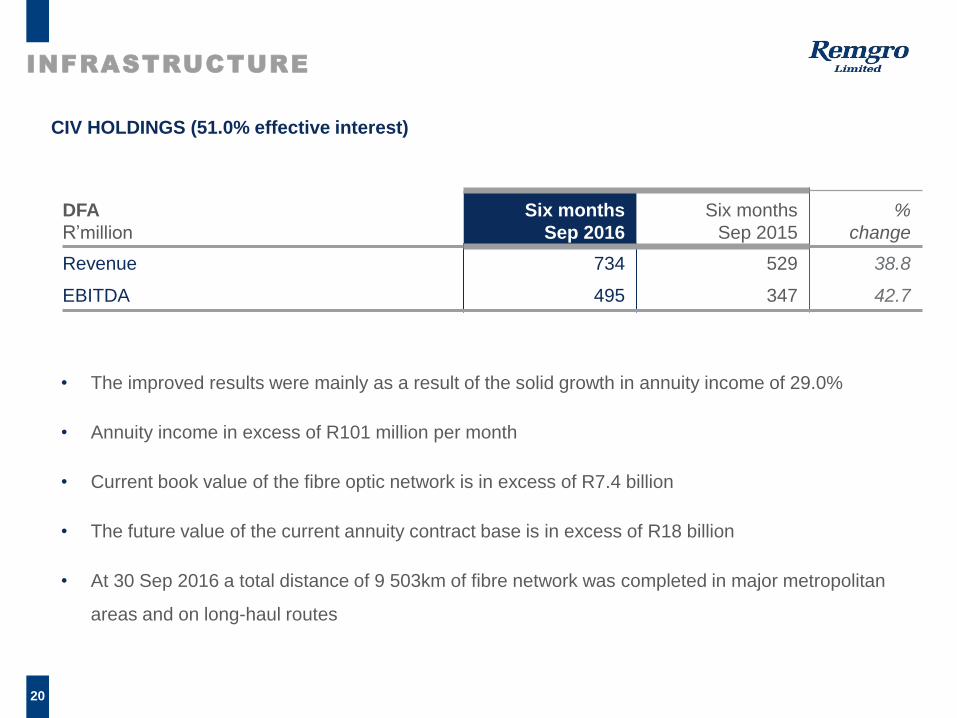
INFRASTRUCTURE
• The improved results were mainly as a result of the solid growth in annuity income of 29.0%
• Annuity income in excess of R101 million per month
• Current book value of the fibre optic network is in excess of R7.4 billion
• The future value of the current annuity contract base is in excess of R18 billion
• At 30 Sep 2016 a total distance of 9 503km of fibre network was completed in major metropolitan
areas and on long-haul routes
CIV HOLDINGS (51.0% effective interest)
DFA
R’million
Six months
Sep 2016
Six months
Sep 2015
%
change
Revenue 734 529 38.8
EBITDA 495 347 42.7
21
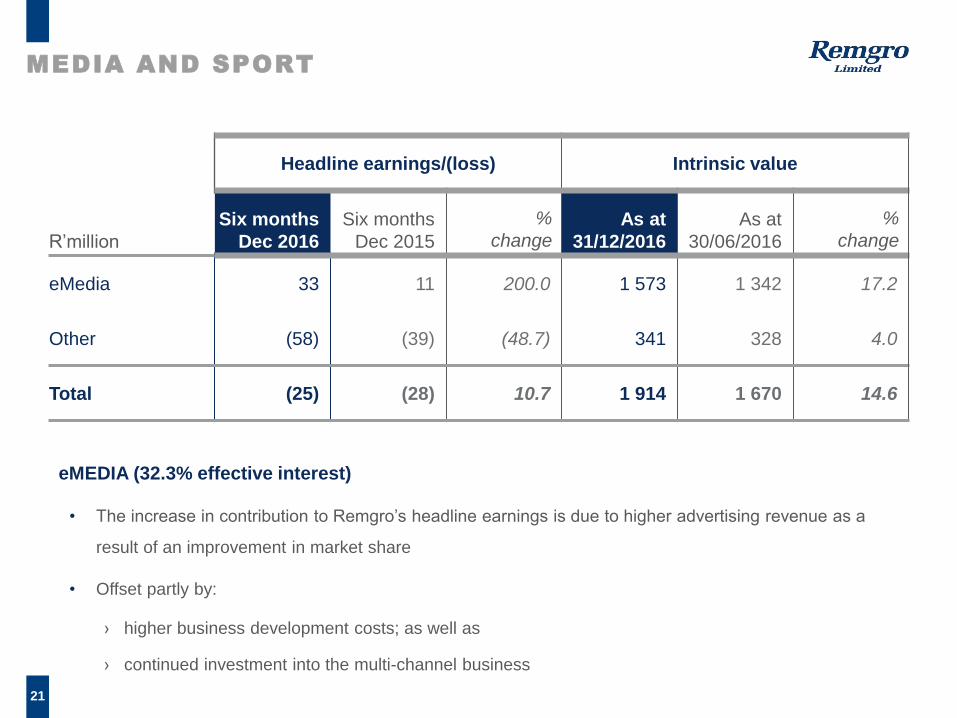
MEDIA AND SPORT
Headline earnings/(loss) Intrinsic value
R’million
Six months
Dec 2016
Six months
Dec 2015
%
changeAs at
31/12/2016
As at
30/06/2016
%
change
eMedia 33 11 200.0 1 573 1 342 17.2
Other (58) (39) (48.7) 341 328 4.0
Total (25) (28) 10.7 1 914 1 670 14.6
eMEDIA (32.3% effective interest)
• The increase in contribution to Remgro’s headline earnings is due to higher advertising revenue as a
result of an improvement in market share
• Offset partly by:
› higher business development costs; as well as
› continued investment into the multi-channel business
22
OTHER INVESTMENTS, TREASURY AND
CORPORATE COSTS
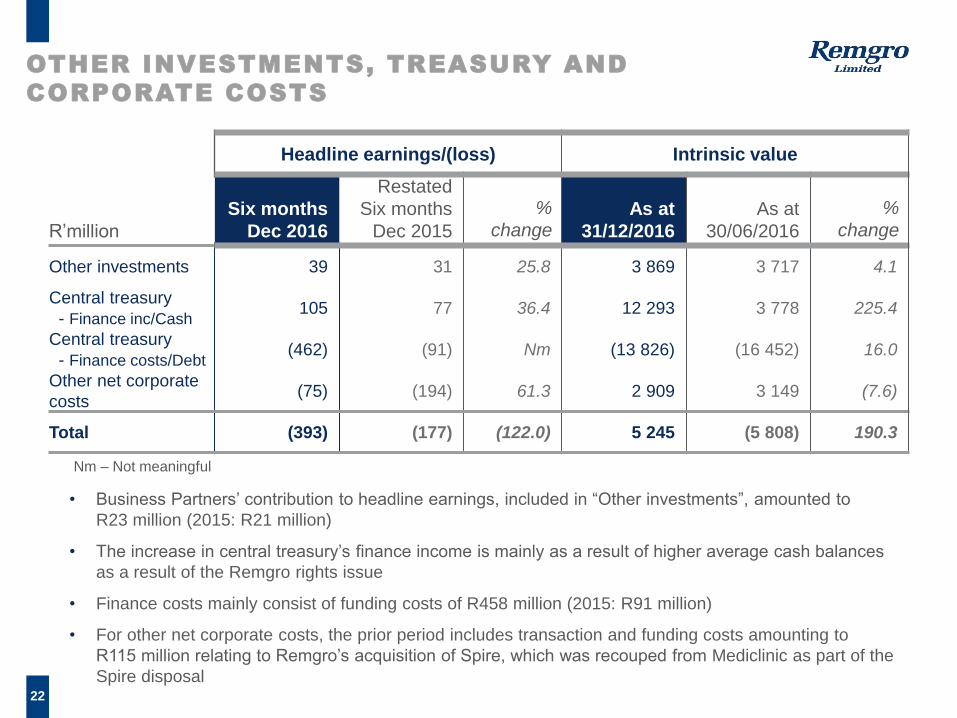
• Business Partners’ contribution to headline earnings, included in “Other investments”, amounted to
R23 million (2015: R21 million)
• The increase in central treasury’s finance income is mainly as a result of higher average cash balances
as a result of the Remgro rights issue
• Finance costs mainly consist of funding costs of R458 million (2015: R91 million)
• For other net corporate costs, the prior period includes transaction and funding costs amounting to
R115 million relating to Remgro’s acquisition of Spire, which was recouped from Mediclinic as part of the
Spire disposal
Headline earnings/(loss) Intrinsic value
R’million
Six months
Dec 2016
Restated
Six months
Dec 2015
%
changeAs at
31/12/2016
As at
30/06/2016
%
change
Other investments 39 31 25.8 3 869 3 717 4.1
Central treasury
- Finance inc/Cash105 77 36.4 12 293 3 778 225.4
Central treasury
- Finance costs/Debt(462) (91) Nm (13 826) (16 452) 16.0
Other net corporate
costs(75) (194) 61.3 2 909 3 149 (7.6)
Total (393) (177) (122.0) 5 245 (5 808) 190.3
Nm – Not meaningful
23
SUMMARY OF INTRINSIC NET ASSET VALUE
R’million
As at
31 Dec 2016
As at
30 Jun 2016
%
change
%
of total
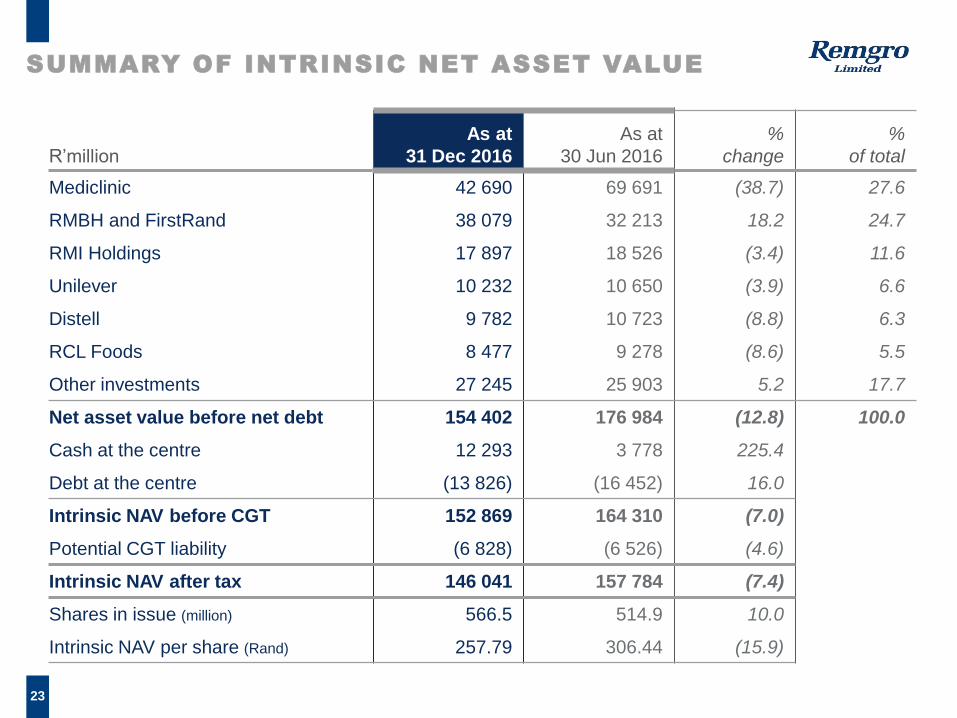
Mediclinic 42 690 69 691 (38.7) 27.6
RMBH and FirstRand 38 079 32 213 18.2 24.7
RMI Holdings 17 897 18 526 (3.4) 11.6
Unilever 10 232 10 650 (3.9) 6.6
Distell 9 782 10 723 (8.8) 6.3
RCL Foods 8 477 9 278 (8.6) 5.5
Other investments 27 245 25 903 5.2 17.7
Net asset value before net debt 154 402 176 984 (12.8) 100.0
Cash at the centre 12 293 3 778 225.4
Debt at the centre (13 826) (16 452) 16.0
Intrinsic NAV before CGT 152 869 164 310 (7.0)
Potential CGT liability (6 828) (6 526) (4.6)
Intrinsic NAV after tax 146 041 157 784 (7.4)
Shares in issue (million) 566.5 514.9 10.0
Intrinsic NAV per share (Rand) 257.79 306.44 (15.9)
24
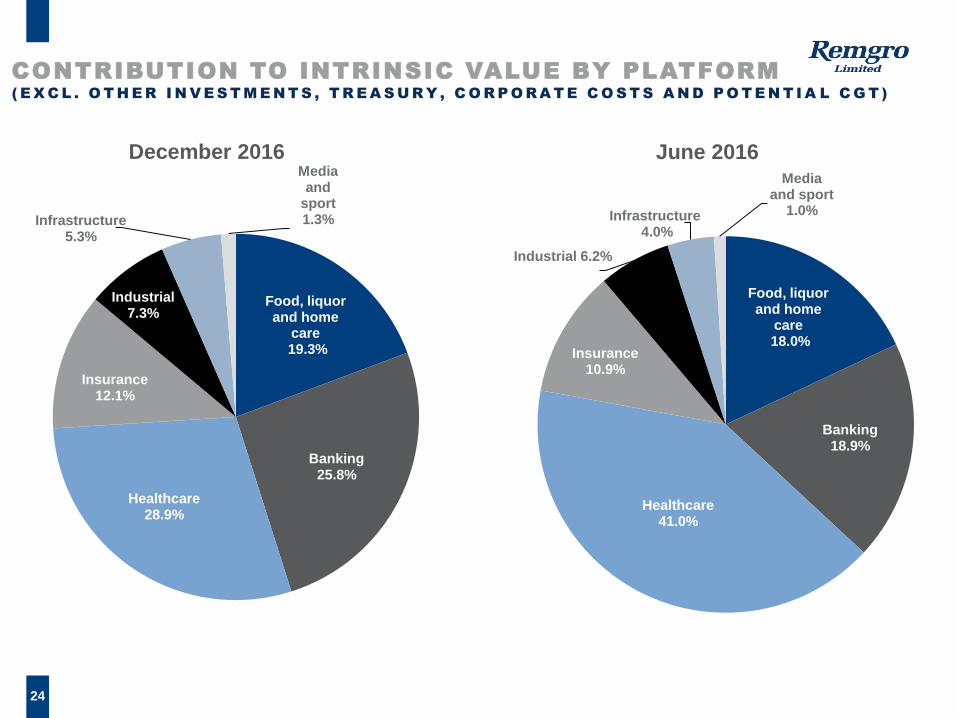
CONTRIBUTION TO INTRINSIC VALUE BY PLATFORM ( E X C L . O T H E R I N V E S T M E N T S , T R E A S U R Y , C O R P O R A T E C O S T S A N D P O T E N T I A L C G T )
Food, liquor and home
care19.3%
Banking25.8%
Healthcare28.9%
Insurance12.1%
Industrial7.3%
Infrastructure5.3%
Media and
sport1.3%
December 2016
Food, liquor and home
care18.0%
Banking18.9%
Healthcare41.0%
Insurance10.9%
Industrial 6.2%
Infrastructure4.0%
Media and sport
1.0%
June 2016
25
INTRINSIC VALUE
R’million
As at
13 Mar 2017
As at
31 Dec 2016
As at
30 Jun 2016
%
change
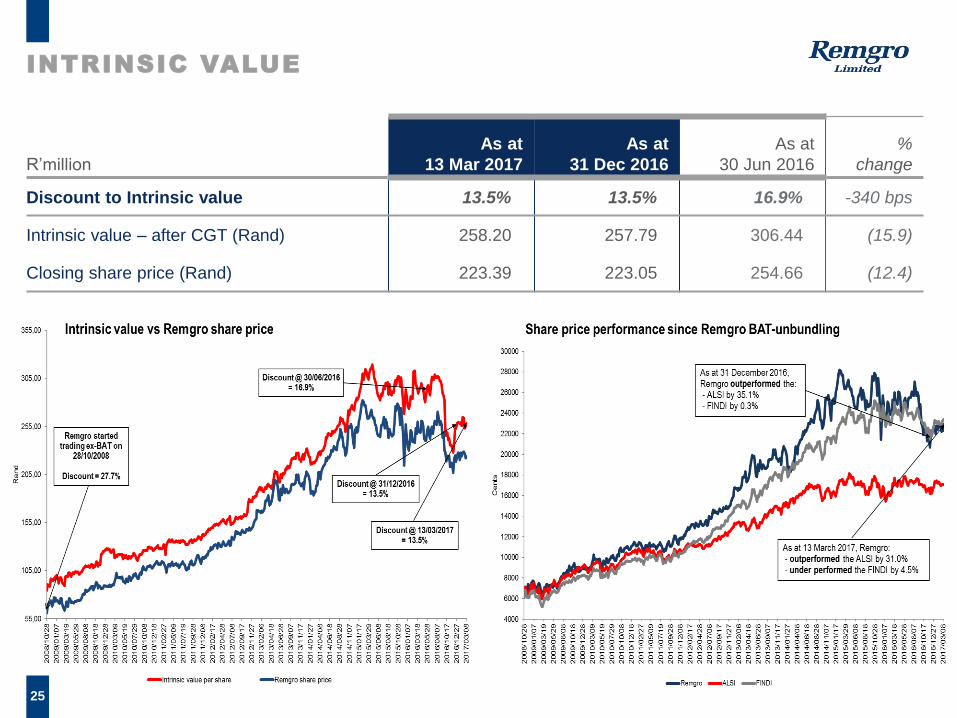
Discount to Intrinsic value 13.5% 13.5% 16.9% -340 bps
Intrinsic value – after CGT (Rand) 258.20 257.79 306.44 (15.9)
Closing share price (Rand) 223.39 223.05 254.66 (12.4)
26
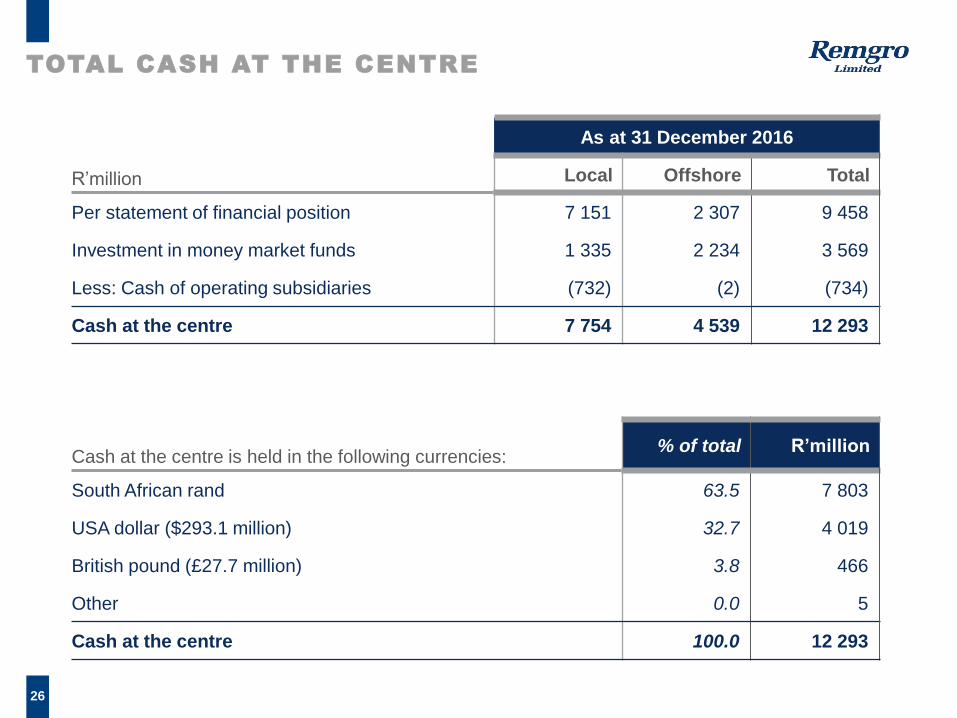
TOTAL CASH AT THE CENTRE
As at 31 December 2016
R’million Local Offshore Total
Per statement of financial position 7 151 2 307 9 458
Investment in money market funds 1 335 2 234 3 569
Less: Cash of operating subsidiaries (732) (2) (734)
Cash at the centre 7 754 4 539 12 293
Cash at the centre is held in the following currencies:% of total R’million
South African rand 63.5 7 803
USA dollar ($293.1 million) 32.7 4 019
British pound (£27.7 million) 3.8 466
Other 0.0 5
Cash at the centre 100.0 12 293
27
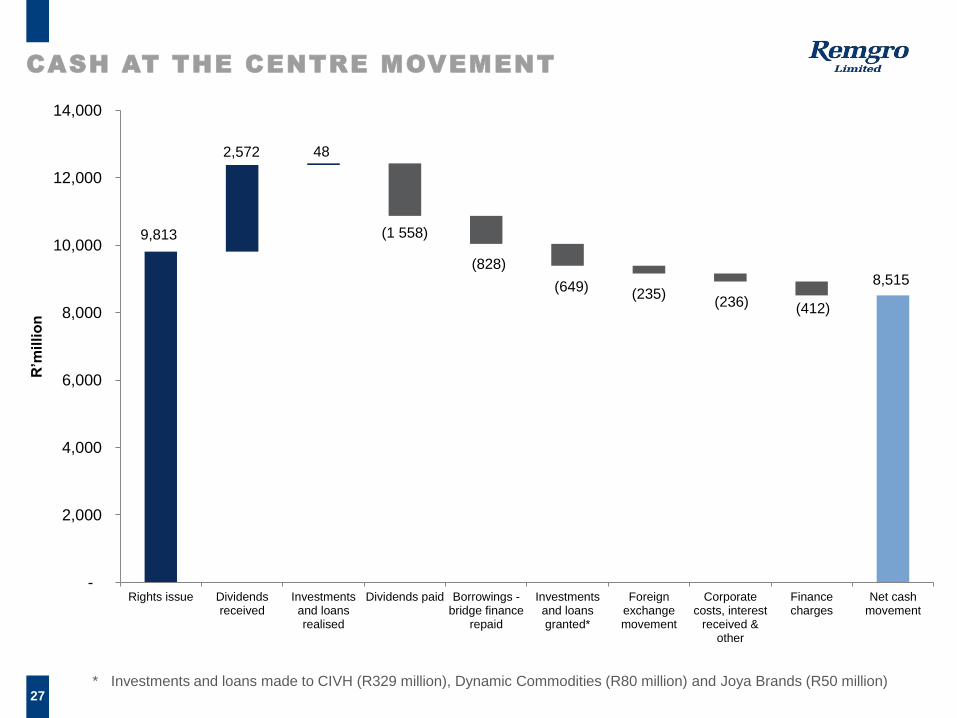
CASH AT THE CENTRE MOVEMENT
9,813
2,572 48
(1 558)
(828)
(649)(235)
(236) (412)
8,515
-
2,000
4,000
6,000
8,000
10,000
12,000
14,000
Rights issue Dividendsreceived
Investmentsand loansrealised
Dividends paid Borrowings -bridge finance
repaid
Investmentsand loansgranted*
Foreignexchangemovement
Corporatecosts, interest
received &other
Financecharges
Net cashmovement
R’m
illi
on
* Investments and loans made to CIVH (R329 million), Dynamic Commodities (R80 million) and Joya Brands (R50 million)
28
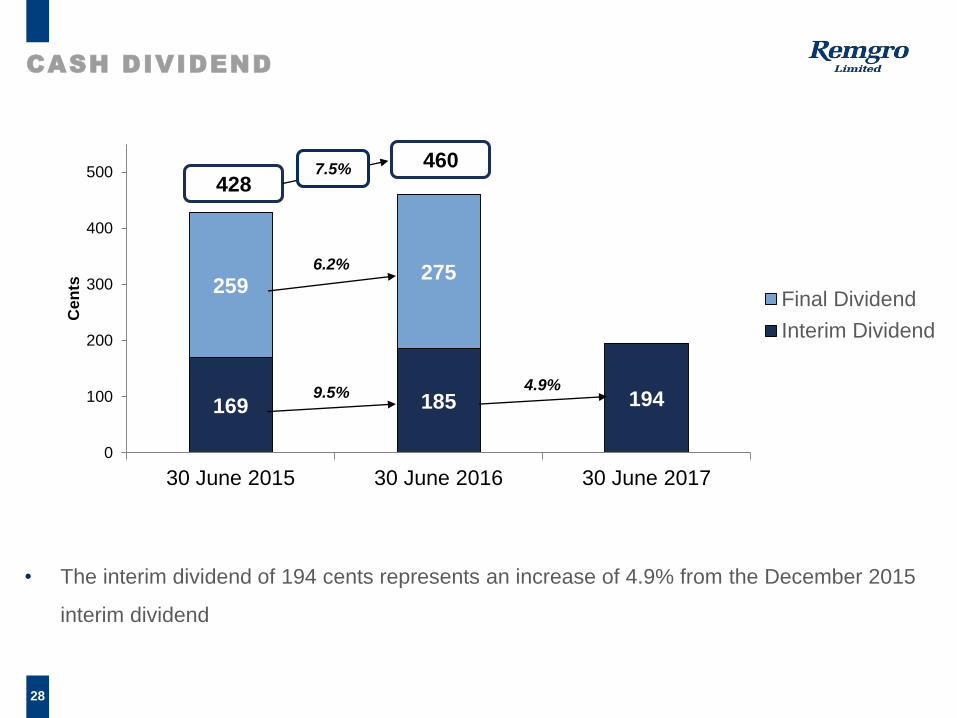
CASH DIVIDEND
• The interim dividend of 194 cents represents an increase of 4.9% from the December 2015
interim dividend
169 185 194
259275
0
100
200
300
400
500
30 June 2015 30 June 2016 30 June 2017
Cen
ts
Final Dividend
Interim Dividend
428
9.5%4.9%
6.2%
7.5% 460
THANK YOU
FOR MORE INFORMATION VISIT OUR WEBSITE
www.remgro.com
30
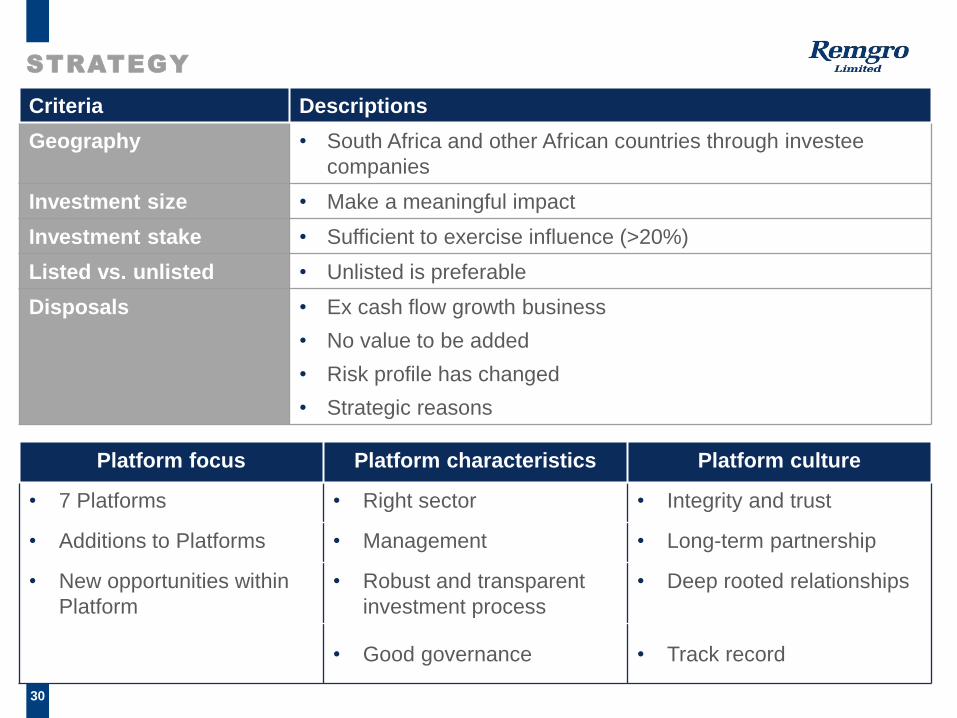
STRATEGY
Criteria Descriptions
Geography • South Africa and other African countries through investee
companies
Investment size • Make a meaningful impact
Investment stake • Sufficient to exercise influence (>20%)
Listed vs. unlisted • Unlisted is preferable
Disposals • Ex cash flow growth business
• No value to be added
• Risk profile has changed
• Strategic reasons
Platform focus Platform characteristics Platform culture
• 7 Platforms • Right sector • Integrity and trust
• Additions to Platforms • Management • Long-term partnership
• New opportunities within
Platform
• Robust and transparent
investment process
• Deep rooted relationships
• Good governance • Track record
31
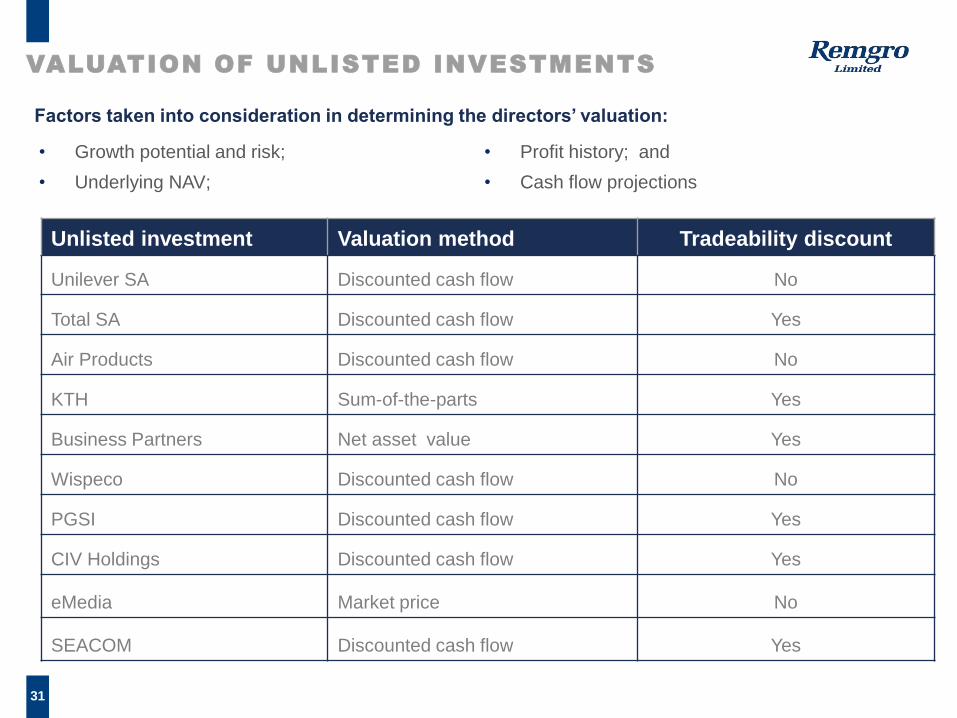
VALUATION OF UNLISTED INVESTMENTS
• Growth potential and risk;
• Underlying NAV;
• Profit history; and
• Cash flow projections
Factors taken into consideration in determining the directors’ valuation:
Unlisted investment Valuation method Tradeability discount
Unilever SA Discounted cash flow No
Total SA Discounted cash flow Yes
Air Products Discounted cash flow No
KTH Sum-of-the-parts Yes
Business Partners Net asset value Yes
Wispeco Discounted cash flow No
PGSI Discounted cash flow Yes
CIV Holdings Discounted cash flow Yes
eMedia Market price No
SEACOM Discounted cash flow Yes
32
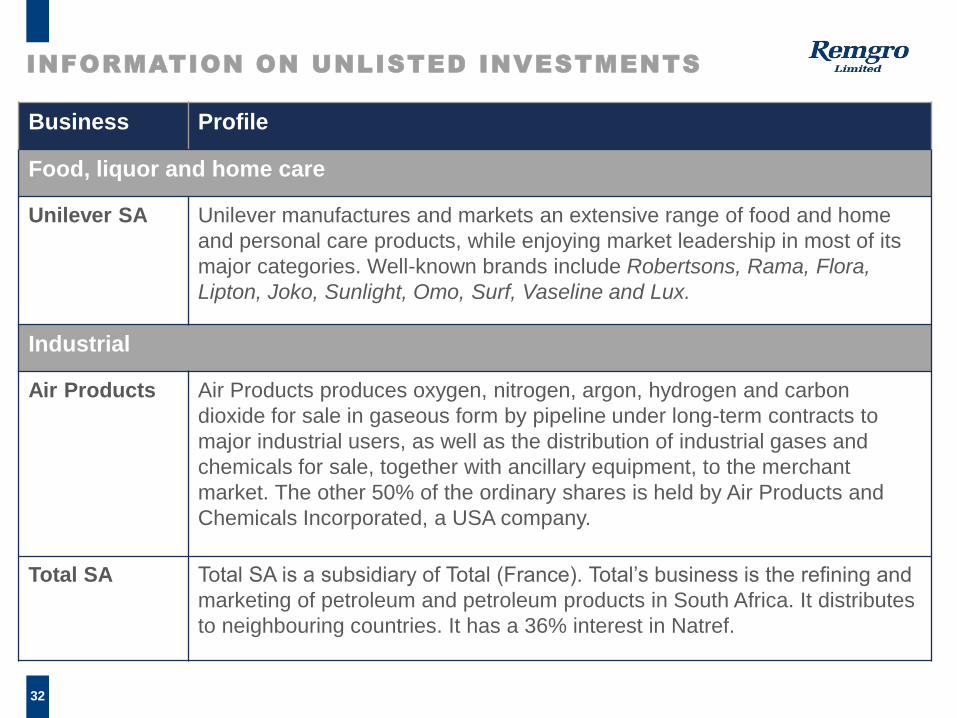
INFORMATION ON UNLISTED INVESTMENTS
Business Profile
Food, liquor and home care
Unilever SA Unilever manufactures and markets an extensive range of food and home
and personal care products, while enjoying market leadership in most of its
major categories. Well-known brands include Robertsons, Rama, Flora,
Lipton, Joko, Sunlight, Omo, Surf, Vaseline and Lux.
Industrial
Air Products Air Products produces oxygen, nitrogen, argon, hydrogen and carbon
dioxide for sale in gaseous form by pipeline under long-term contracts to
major industrial users, as well as the distribution of industrial gases and
chemicals for sale, together with ancillary equipment, to the merchant
market. The other 50% of the ordinary shares is held by Air Products and
Chemicals Incorporated, a USA company.
Total SA Total SA is a subsidiary of Total (France). Total’s business is the refining and
marketing of petroleum and petroleum products in South Africa. It distributes
to neighbouring countries. It has a 36% interest in Natref.
33
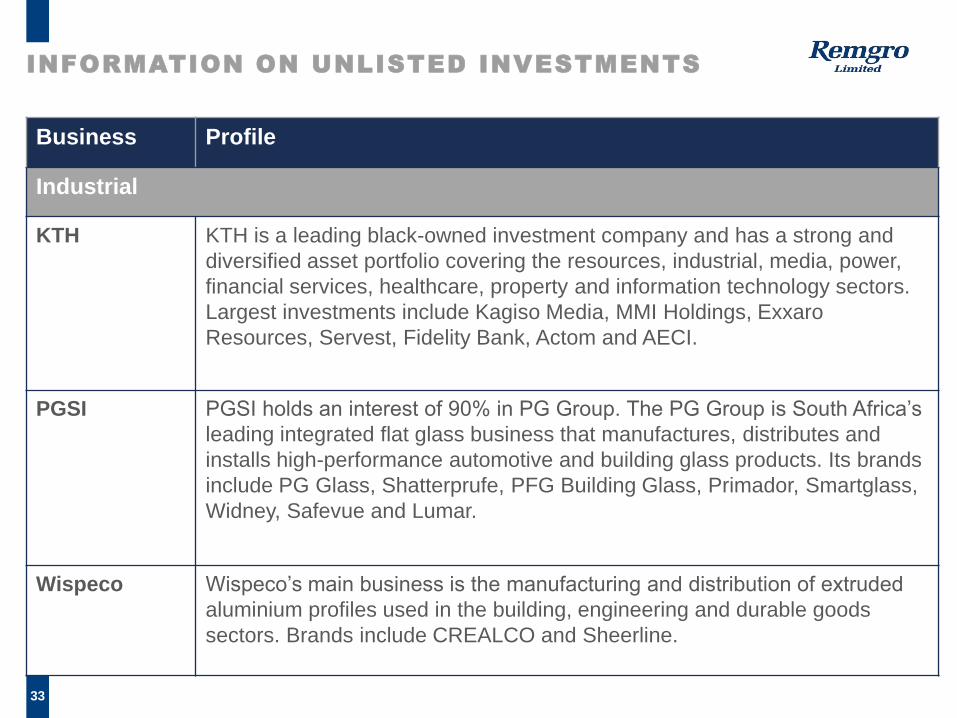
INFORMATION ON UNLISTED INVESTMENTS
Business Profile
Industrial
KTH KTH is a leading black-owned investment company and has a strong and
diversified asset portfolio covering the resources, industrial, media, power,
financial services, healthcare, property and information technology sectors.
Largest investments include Kagiso Media, MMI Holdings, Exxaro
Resources, Servest, Fidelity Bank, Actom and AECI.
PGSI PGSI holds an interest of 90% in PG Group. The PG Group is South Africa’s
leading integrated flat glass business that manufactures, distributes and
installs high-performance automotive and building glass products. Its brands
include PG Glass, Shatterprufe, PFG Building Glass, Primador, Smartglass,
Widney, Safevue and Lumar.
Wispeco Wispeco’s main business is the manufacturing and distribution of extruded
aluminium profiles used in the building, engineering and durable goods
sectors. Brands include CREALCO and Sheerline.
34
INFORMATION ON UNLISTED INVESTMENTS
Business Profile
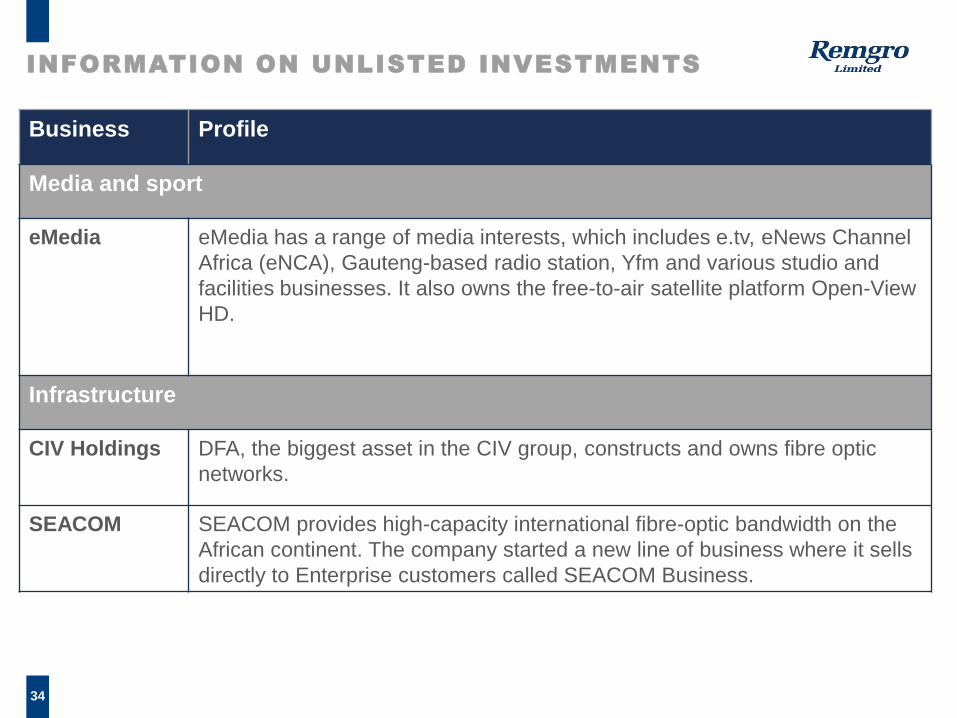
Media and sport
eMedia eMedia has a range of media interests, which includes e.tv, eNews Channel
Africa (eNCA), Gauteng-based radio station, Yfm and various studio and
facilities businesses. It also owns the free-to-air satellite platform Open-View
HD.
Infrastructure
CIV Holdings DFA, the biggest asset in the CIV group, constructs and owns fibre optic
networks.
SEACOM SEACOM provides high-capacity international fibre-optic bandwidth on the
African continent. The company started a new line of business where it sells
directly to Enterprise customers called SEACOM Business.
35
INFORMATION ON UNLISTED INVESTMENTS
Business Profile
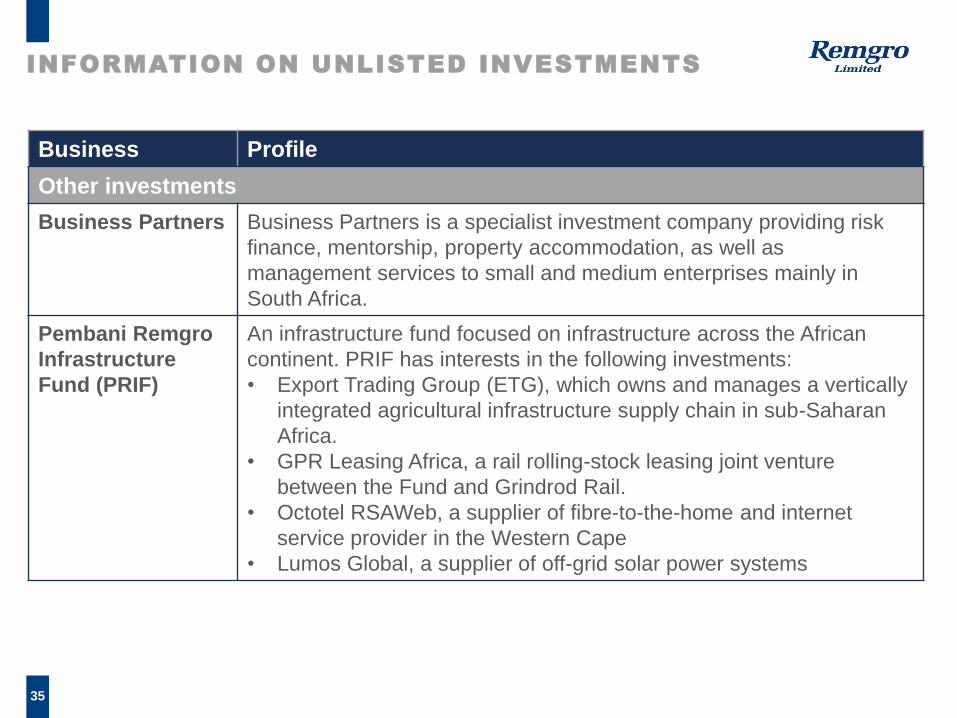
Other investments
Business Partners Business Partners is a specialist investment company providing risk
finance, mentorship, property accommodation, as well as
management services to small and medium enterprises mainly in
South Africa.
Pembani Remgro
Infrastructure
Fund (PRIF)
An infrastructure fund focused on infrastructure across the African
continent. PRIF has interests in the following investments:
• Export Trading Group (ETG), which owns and manages a vertically
integrated agricultural infrastructure supply chain in sub-Saharan
Africa.
• GPR Leasing Africa, a rail rolling-stock leasing joint venture
between the Fund and Grindrod Rail.
• Octotel RSAWeb, a supplier of fibre-to-the-home and internet
service provider in the Western Cape
• Lumos Global, a supplier of off-grid solar power systems