Embed Size (px)
Citation preview

UnaUdited interim
GroUp resUltsfor the six months ended
31 December 2012
% change
Six months ended31 December
Year ended30 June
2012Unaudited
R’000
2011Unaudited
R’000
2012Audited
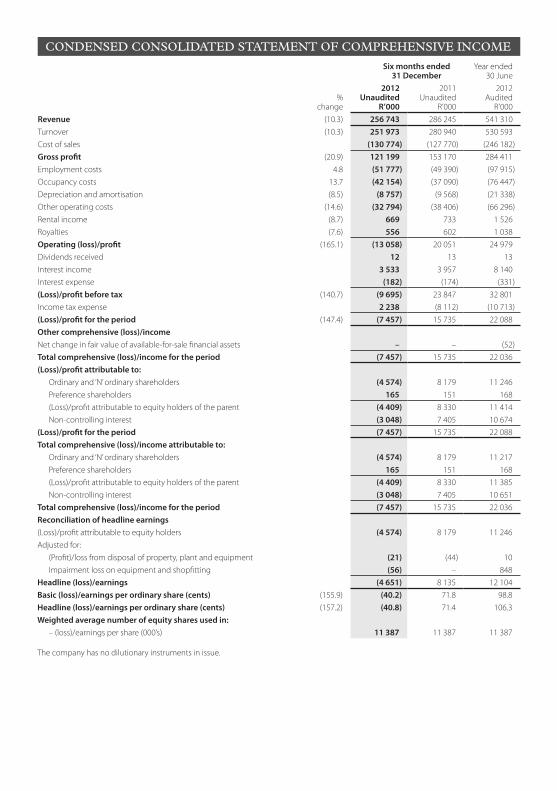
R’000Revenue (10.3) 256 743 286 245 541 310Turnover (10.3) 251 973 280 940 530 593 Cost of sales (130 774) (127 770) (246 182)Gross profit (20.9) 121 199 153 170 284 411 Employment costs 4.8 (51 777) (49 390) (97 915)Occupancy costs 13.7 (42 154) (37 090) (76 447)Depreciation and amortisation (8.5) (8 757) (9 568) (21 338)Other operating costs (14.6) (32 794) (38 406) (66 296)Rental income (8.7) 669 733 1 526 Royalties (7.6) 556 602 1 038 Operating (loss)/profit (165.1) (13 058) 20 051 24 979 Dividends received 12 13 13 Interest income 3 533 3 957 8 140 Interest expense (182) (174) (331)(Loss)/profit before tax (140.7) (9 695) 23 847 32 801 Income tax expense 2 238 (8 112) (10 713)(Loss)/profit for the period (147.4) (7 457) 15 735 22 088 Other comprehensive (loss)/incomeNet change in fair value of available-for-sale financial assets – – (52)Total comprehensive (loss)/income for the period (7 457) 15 735 22 036 (Loss)/profit attributable to:
Ordinary and ‘N’ ordinary shareholders (4 574) 8 179 11 246 Preference shareholders 165 151 168 (Loss)/profit attributable to equity holders of the parent (4 409) 8 330 11 414 Non-controlling interest (3 048) 7 405 10 674
(Loss)/profit for the period (7 457) 15 735 22 088 Total comprehensive (loss)/income attributable to:
Ordinary and ‘N’ ordinary shareholders (4 574) 8 179 11 217 Preference shareholders 165 151 168 (Loss)/profit attributable to equity holders of the parent (4 409) 8 330 11 385 Non-controlling interest (3 048) 7 405 10 651
Total comprehensive (loss)/income for the period (7 457) 15 735 22 036 Reconciliation of headline earnings(Loss)/profit attributable to equity holders (4 574) 8 179 11 246 Adjusted for:
(Profit)/loss from disposal of property, plant and equipment (21) (44) 10 Impairment loss on equipment and shopfitting (56) – 848
Headline (loss)/earnings (4 651) 8 135 12 104 Basic (loss)/earnings per ordinary share (cents) (155.9) (40.2) 71.8 98.8 Headline (loss)/earnings per ordinary share (cents) (157.2) (40.8) 71.4 106.3 Weighted average number of equity shares used in:
– (loss)/earnings per share (000’s) 11 387 11 387 11 387
The company has no dilutionary instruments in issue.
Condensed Consolidated statement oF CompreHensiVe inCome
As at 31 December
As at 30 June
2012Unaudited
R’000
2011Unaudited
R’000
2012Audited
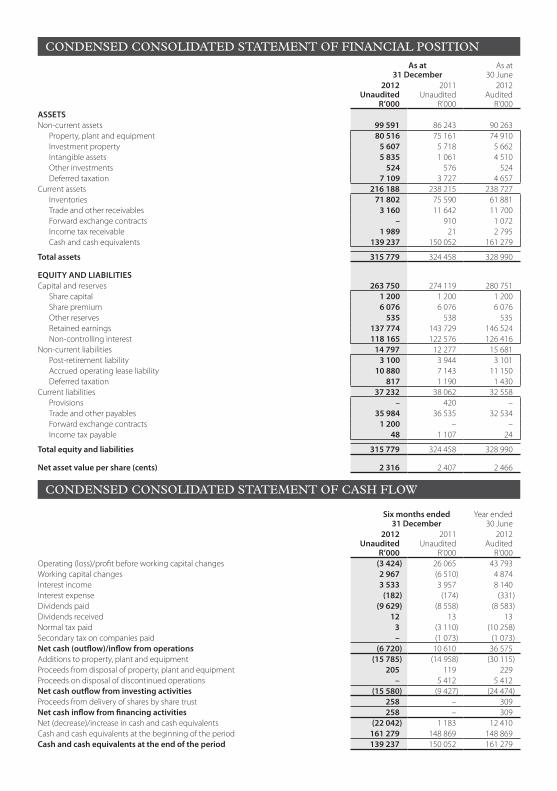
R’000ASSETSNon-current assets 99 591 86 243 90 263
Property, plant and equipment 80 516 75 161 74 910 Investment property 5 607 5 718 5 662 Intangible assets 5 835 1 061 4 510 Other investments 524 576 524 Deferred taxation 7 109 3 727 4 657
Current assets 216 188 238 215 238 727 Inventories 71 802 75 590 61 881 Trade and other receivables 3 160 11 642 11 700 Forward exchange contracts – 910 1 072 Income tax receivable 1 989 21 2 795 Cash and cash equivalents 139 237 150 052 161 279
Total assets 315 779 324 458 328 990
EqUiTy AnD LiABiLiTiESCapital and reserves 263 750 274 119 280 751
Share capital 1 200 1 200 1 200 Share premium 6 076 6 076 6 076 Other reserves 535 538 535 Retained earnings 137 774 143 729 146 524 Non-controlling interest 118 165 122 576 126 416
Non-current liabilities 14 797 12 277 15 681 Post-retirement liability 3 100 3 944 3 101 Accrued operating lease liability 10 880 7 143 11 150 Deferred taxation 817 1 190 1 430
Current liabilities 37 232 38 062 32 558 Provisions – 420 –Trade and other payables 35 984 36 535 32 534 Forward exchange contracts 1 200 – –Income tax payable 48 1 107 24
Total equity and liabilities 315 779 324 458 328 990
net asset value per share (cents) 2 316 2 407 2 466
Six months ended31 December
Year ended30 June
2012Unaudited
R’000
2011Unaudited
R’000
2012Audited
R’000Operating (loss)/profit before working capital changes (3 424) 26 065 43 793 Working capital changes 2 967 (6 510) 4 874 Interest income 3 533 3 957 8 140 Interest expense (182) (174) (331)Dividends paid (9 629) (8 558) (8 583)Dividends received 12 13 13 Normal tax paid 3 (3 110) (10 258)Secondary tax on companies paid – (1 073) (1 073)net cash (outflow)/inflow from operations (6 720) 10 610 36 575 Additions to property, plant and equipment (15 785) (14 958) (30 115)Proceeds from disposal of property, plant and equipment 205 119 229 Proceeds on disposal of discontinued operations – 5 412 5 412 net cash outflow from investing activities (15 580) (9 427) (24 474)Proceeds from delivery of shares by share trust 258 – 309 net cash inflow from financing activities 258 – 309 Net (decrease)/increase in cash and cash equivalents (22 042) 1 183 12 410 Cash and cash equivalents at the beginning of the period 161 279 148 869 148 869 Cash and cash equivalents at the end of the period 139 237 150 052 161 279
Condensed Consolidated statement oF FinanCial position
Condensed Consolidated statement oF CasH FloW
Six months ended31 December
Year ended30 June
2012Unaudited
R’000
2011Unaudited
R’000
2012Audited
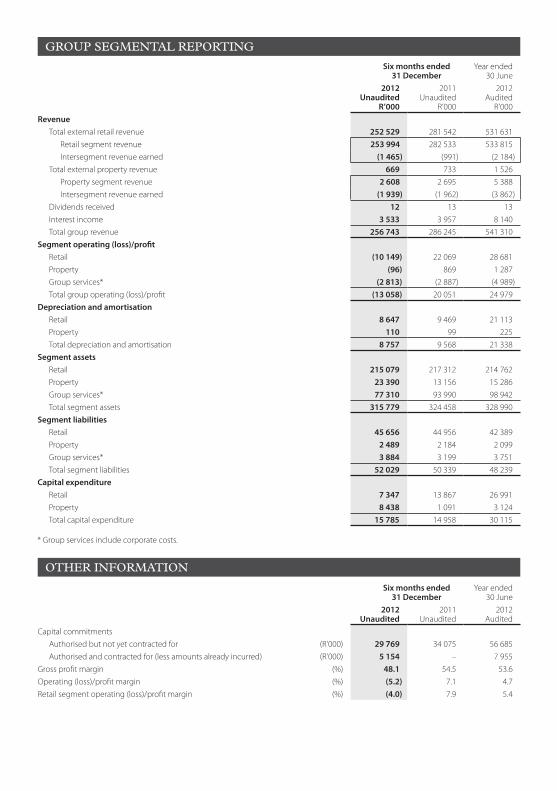
R’000Revenue
Total external retail revenue 252 529 281 542 531 631 Retail segment revenue 253 994 282 533 533 815 Intersegment revenue earned (1 465) (991) (2 184)
Total external property revenue 669 733 1 526 Property segment revenue 2 608 2 695 5 388 Intersegment revenue earned (1 939) (1 962) (3 862)
Dividends received 12 13 13 Interest income 3 533 3 957 8 140 Total group revenue 256 743 286 245 541 310
Segment operating (loss)/profitRetail (10 149) 22 069 28 681 Property (96) 869 1 287 Group services* (2 813) (2 887) (4 989)Total group operating (loss)/profit (13 058) 20 051 24 979
Depreciation and amortisationRetail 8 647 9 469 21 113 Property 110 99 225 Total depreciation and amortisation 8 757 9 568 21 338
Segment assetsRetail 215 079 217 312 214 762 Property 23 390 13 156 15 286 Group services* 77 310 93 990 98 942 Total segment assets 315 779 324 458 328 990
Segment liabilitiesRetail 45 656 44 956 42 389 Property 2 489 2 184 2 099 Group services* 3 884 3 199 3 751 Total segment liabilities 52 029 50 339 48 239
Capital expenditureRetail 7 347 13 867 26 991 Property 8 438 1 091 3 124 Total capital expenditure 15 785 14 958 30 115
* Group services include corporate costs.
Six months ended31 December
Year ended30 June
2012Unaudited
2011Unaudited
2012Audited
Capital commitmentsAuthorised but not yet contracted for (R’000) 29 769 34 075 56 685 Authorised and contracted for (less amounts already incurred) (R’000) 5 154 – 7 955
Gross profit margin (%) 48.1 54.5 53.6Operating (loss)/profit margin (%) (5.2) 7.1 4.7Retail segment operating (loss)/profit margin (%) (4.0) 7.9 5.4
GroUp seGmental reportinG
otHer inFormation
As at 31 December
As at 30 June
2012Unaudited
R’000
2011Unaudited
R’000
2012Audited
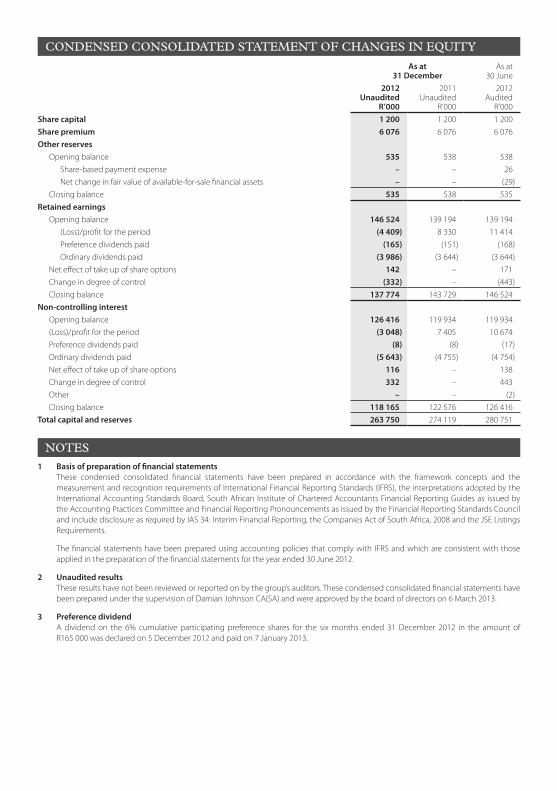
R’000Share capital 1 200 1 200 1 200 Share premium 6 076 6 076 6 076 Other reserves
Opening balance 535 538 538 Share-based payment expense – – 26 Net change in fair value of available-for-sale financial assets – – (29)
Closing balance 535 538 535 Retained earnings
Opening balance 146 524 139 194 139 194 (Loss)/profit for the period (4 409) 8 330 11 414 Preference dividends paid (165) (151) (168)Ordinary dividends paid (3 986) (3 644) (3 644)
Net effect of take up of share options 142 – 171 Change in degree of control (332) – (443)Closing balance 137 774 143 729 146 524
non-controlling interestOpening balance 126 416 119 934 119 934 (Loss)/profit for the period (3 048) 7 405 10 674 Preference dividends paid (8) (8) (17)Ordinary dividends paid (5 643) (4 755) (4 754)Net effect of take up of share options 116 – 138 Change in degree of control 332 – 443 Other – – (2)Closing balance 118 165 122 576 126 416
Total capital and reserves 263 750 274 119 280 751
1 Basis of preparation of financial statements These condensed consolidated financial statements have been prepared in accordance with the framework concepts and the
measurement and recognition requirements of International Financial Reporting Standards (IFRS), the interpretations adopted by the International Accounting Standards Board, South African Institute of Chartered Accountants Financial Reporting Guides as issued by the Accounting Practices Committee and Financial Reporting Pronouncements as issued by the Financial Reporting Standards Council and include disclosure as required by IAS 34: Interim Financial Reporting, the Companies Act of South Africa, 2008 and the JSE Listings Requirements.
The financial statements have been prepared using accounting policies that comply with IFRS and which are consistent with those applied in the preparation of the financial statements for the year ended 30 June 2012.
2 Unaudited results These results have not been reviewed or reported on by the group’s auditors. These condensed consolidated financial statements have
been prepared under the supervision of Damian Johnson CA(SA) and were approved by the board of directors on 6 March 2013.
3 Preference dividend A dividend on the 6% cumulative participating preference shares for the six months ended 31 December 2012 in the amount of
R165 000 was declared on 5 December 2012 and paid on 7 January 2013.
Condensed Consolidated statement oF CHanGes in eQUitY
notes
GRO
UND
PEPP
ER
www.queenspark.com • www.rextrueform.com • www.rextrueformofficepark.com
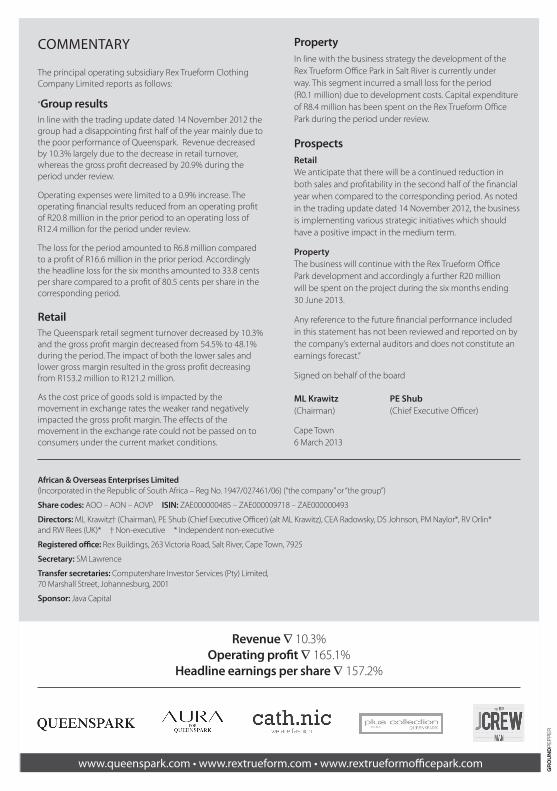
African & Overseas Enterprises Limited (Incorporated in the Republic of South Africa – Reg No. 1947/027461/06) (“the company” or “the group”)
Share codes: AOO – AON – AOVP iSin: ZAE000000485 – ZAE000009718 – ZAE000000493
Directors: ML Krawitz† (Chairman), PE Shub (Chief Executive Officer) (alt ML Krawitz), CEA Radowsky, DS Johnson, PM Naylor*, RV Orlin* and RW Rees (UK)* † Non-executive * Independent non-executive
Registered office: Rex Buildings, 263 Victoria Road, Salt River, Cape Town, 7925
Secretary: SM Lawrence
Transfer secretaries: Computershare Investor Services (Pty) Limited, 70 Marshall Street, Johannesburg, 2001
Sponsor: Java Capital
Gr
ou
nd
Pe
PP
er
Revenue ∇ 10.3% Operating profit ∇ 165.1%
Headline earnings per share ∇ 157.2%
COMMENTARY
The principal operating subsidiary Rex Trueform Clothing Company Limited reports as follows:
“Group resultsIn line with the trading update dated 14 November 2012 the group had a disappointing first half of the year mainly due to the poor performance of Queenspark. Revenue decreased by 10.3% largely due to the decrease in retail turnover, whereas the gross profit decreased by 20.9% during the period under review.
Operating expenses were limited to a 0.9% increase. The operating financial results reduced from an operating profit of R20.8 million in the prior period to an operating loss of R12.4 million for the period under review.
The loss for the period amounted to R6.8 million compared to a profit of R16.6 million in the prior period. Accordingly the headline loss for the six months amounted to 33.8 cents per share compared to a profit of 80.5 cents per share in the corresponding period.
RetailThe Queenspark retail segment turnover decreased by 10.3% and the gross profit margin decreased from 54.5% to 48.1% during the period. The impact of both the lower sales and lower gross margin resulted in the gross profit decreasing from R153.2 million to R121.2 million.
As the cost price of goods sold is impacted by the movement in exchange rates the weaker rand negatively impacted the gross profit margin. The effects of the movement in the exchange rate could not be passed on to consumers under the current market conditions.
PropertyIn line with the business strategy the development of the Rex Trueform Office Park in Salt River is currently under way. This segment incurred a small loss for the period (R0.1 million) due to development costs. Capital expenditure of R8.4 million has been spent on the Rex Trueform Office Park during the period under review.
ProspectsRetail We anticipate that there will be a continued reduction in both sales and profitability in the second half of the financial year when compared to the corresponding period. As noted in the trading update dated 14 November 2012, the business is implementing various strategic initiatives which should have a positive impact in the medium term.
Property The business will continue with the Rex Trueform Office Park development and accordingly a further R20 million will be spent on the project during the six months ending 30 June 2013.
Any reference to the future financial performance included in this statement has not been reviewed and reported on by the company’s external auditors and does not constitute an earnings forecast.”
Signed on behalf of the board
ML Krawitz PE Shub(Chairman) (Chief Executive Officer)
Cape Town 6 March 2013