Embed Size (px)
Citation preview
Insert Text Here
Interim results presentation
6 months ended 31 July 2017
26 September 2017
2
Forward-looking statements
This presentation contains certain forward-looking statements with respect to the financial condition, results of operations, and businesses of Card Factory plc. These statements and forecasts involve risk, uncertainty and assumptions because they relate to events and depend upon circumstances that will occur in the future. There are a number of factors that could cause actual results or developments to differ materially from those expressed or implied by these forward-looking statements. These forward-looking statements are made only as at the date of this presentation. Nothing in this presentation should be construed as a profit forecast. Except as required by law, Card Factory plc has no obligation to update the forward-looking statements or to correct any inaccuracies therein.
The financial information in this presentation does not contain sufficient detail to allow a full understanding of the results Card Factory plc. For more detailed information, please see the interim results announcement for the six months ended 31 July 2017 which can be found on www.cardfactoryinvestors.com.

3
Agenda
• Introduction Geoff Cooper (Chairman)
• Financial review Kris Lee (CFO)
• Business update Karen Hubbard (CEO)
• Questions
4
Introduction
Geoff CooperChairman
5
Financial review
Kris LeeChief Financial Officer

6
Financial highlights
H1 FY18 H1 FY17Year-on-year
change
Revenue £179.6m £169.2m +6.1%
Card Factory LFLs +3.1% +0.2%
EBITDA £32.8m £34.2m -4.0%
Margin 18.3% 20.2% -1.9ppts
Operating profit £27.7m £29.0m -4.6%
Margin 15.4% 17.1% -1.7ppts
Profit before tax £26.3m £27.6m -4.8%
Effective tax rate 19.7% 20.4% -0.7ppts
Basic EPS 6.19p 6.45p -4.0%
Interim dividend 2.9p 2.8p +3.6%
Special dividend 15.0p/£51.2m 15.0p/£51.1m
Total dividends since IPO 72.3p/£246.5m 48.1p/£163.8m
Net debt £146.0m £121.7m
Leverage 1.50x 1.26x
Note
All figures shown on an underlying basis
7
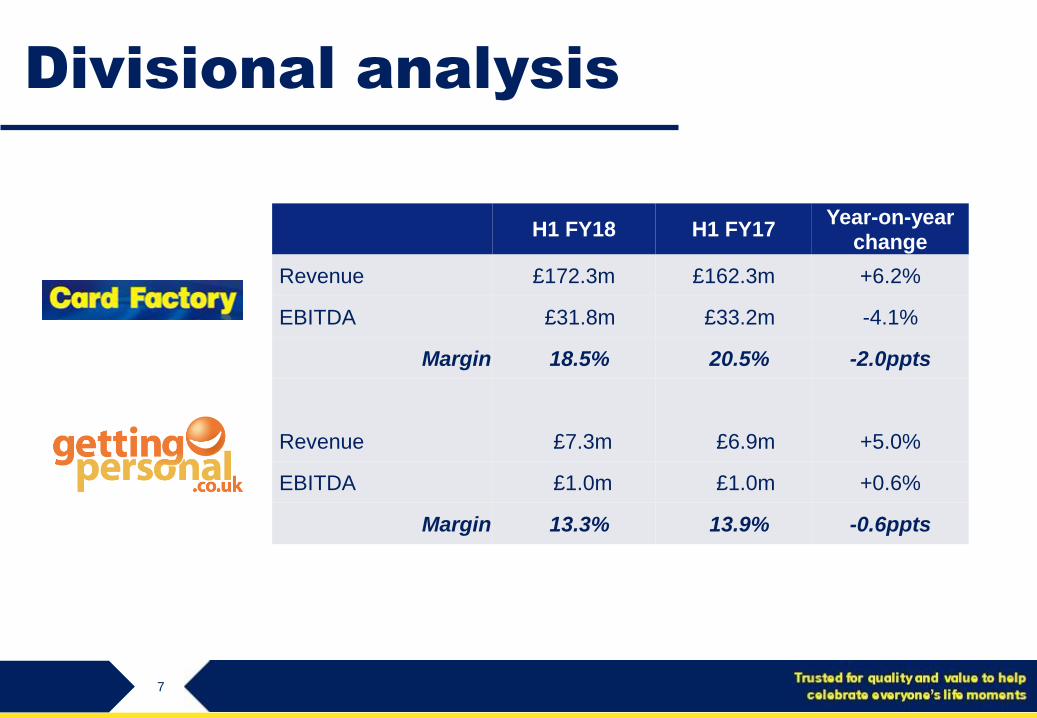
Divisional analysis
H1 FY18 H1 FY17Year-on-year
change
Revenue £172.3m £162.3m +6.2%
EBITDA £31.8m £33.2m -4.1%
Margin 18.5% 20.5% -2.0ppts
Revenue £7.3m £6.9m +5.0%
EBITDA £1.0m £1.0m +0.6%
Margin 13.3% 13.9% -0.6ppts

8
Revenue and like-for-like sales
Strong store like-for-like sales performance
FY18 H1
Highest like-for-like sales performance in 4
years
Non-card investment in ranges showing
strong performance
149.4 161.4 169.2 179.6
203.9 220.2 229.0
FY15 FY16 FY17 FY18
£’m
H2
H1
Card Factory* FY15 FY16 FY17 FY18
LFL H1 +2.6% +2.7% -0.1% +3.0%
LFL FY +1.8% +2.8% +0.4%
* relate to stores only
9
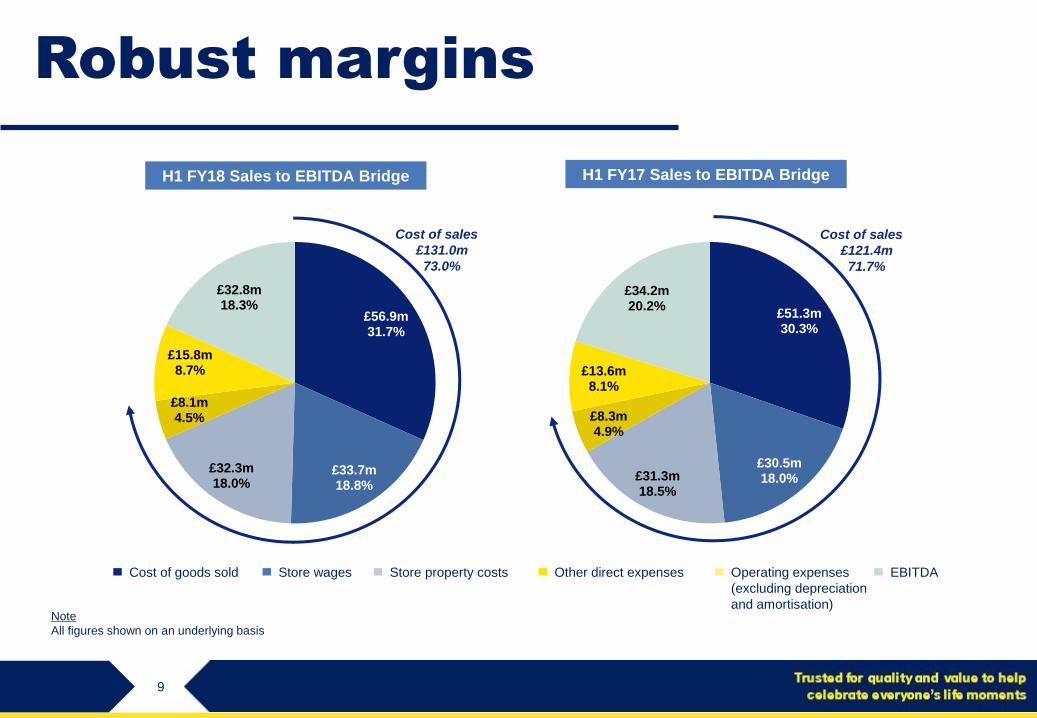
£51.3m30.3%
£30.5m18.0%£31.3m
18.5%
£8.3m4.9%
£13.6m8.1%
£34.2m20.2%
Robust margins
H1 FY17 Sales to EBITDA Bridge
£56.9m31.7%
£33.7m18.8%
£32.3m18.0%
£8.1m4.5%
£15.8m8.7%
£32.8m18.3%
H1 FY18 Sales to EBITDA Bridge
Cost of sales
£131.0m
73.0%
Cost of sales
£121.4m
71.7%
Note
All figures shown on an underlying basis
Cost of goods sold Store property costsStore wages Other direct expenses EBITDAOperating expenses
(excluding depreciation
and amortisation)
10
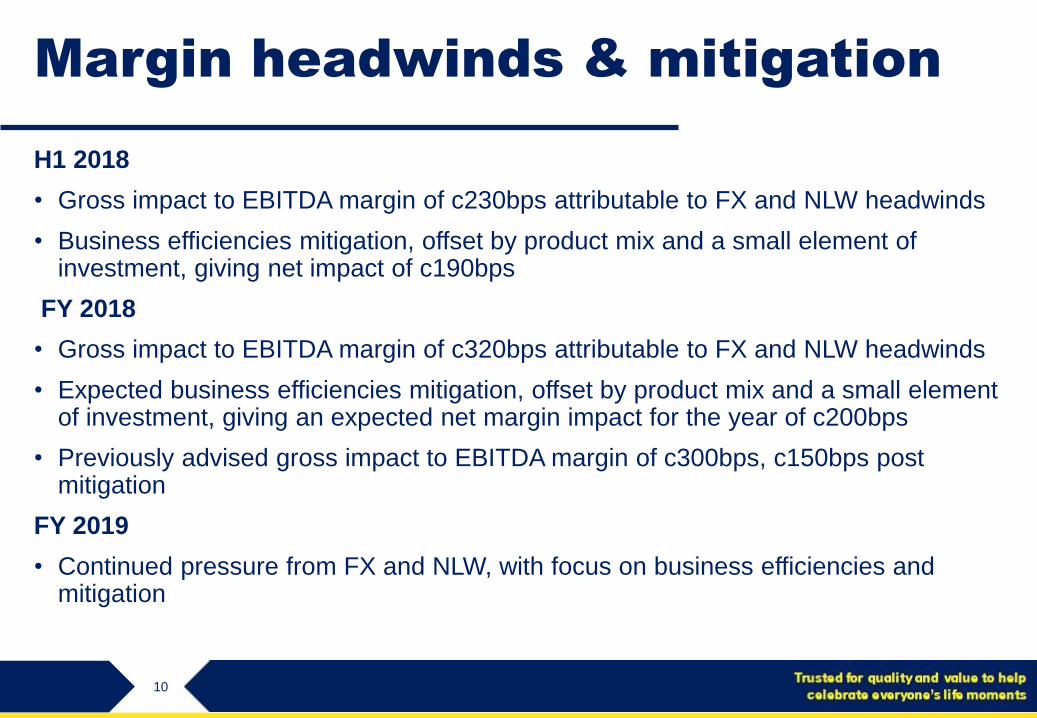
Margin headwinds & mitigation
H1 2018
• Gross impact to EBITDA margin of c230bps attributable to FX and NLW headwinds
• Business efficiencies mitigation, offset by product mix and a small element of investment, giving net impact of c190bps
FY 2018
• Gross impact to EBITDA margin of c320bps attributable to FX and NLW headwinds
• Expected business efficiencies mitigation, offset by product mix and a small element of investment, giving an expected net margin impact for the year of c200bps
• Previously advised gross impact to EBITDA margin of c300bps, c150bps post mitigation
FY 2019
• Continued pressure from FX and NLW, with focus on business efficiencies and mitigation

11
Highly cash generative
H1 FY18
£’m
H1 FY17
£’m
Cash inflow from operating activities 27.6 * 37.9
Corporation tax (8.8) (8.8)
Net cash inflow from operating activities 18.8 29.1
Cash outflow from investing activities
Capital expenditure (see over) (6.6) (5.6)
Net cash outflow from investing activities (6.6) (5.6)
Net cash inflow before financing activities 12.2 23.5
Cash generation impacted by working capital
* reduction in operating cash flow versus H1 FY17 principally reflects £5.2m FX impact and an increase in stock, in part due to the impact of foreign exchange on unit costs, and in part due to planned build-up of stocks on popular lines

12
Capex
Low, predictable and well controlled
• Total capex includes:
• Recurring annual capex
• Refurbishments and roll-out
• c£8-9m pa
• One-off strategic projects
• EPOS
• Investment of £4.8m this year
• Improved stock control
• Better analysis of performing lines
• Medium term view
• Annual capex of c£12m in medium term
with some additional investment in EPOS in
the short term
H1 FY18
£’m
H1 FY17
£’m
One-off strategic projects
Digital print - 1.0
LED conversions 0.6 0.4
EPOS 2.1 0.8
Online packaging 0.2 -
Sub-total 2.9 2.2
Recurring capex
New stores 2.2 2.3
Existing stores 0.1 0.3
Relocations 0.2 0.2
Other capex 1.2 0.6
Sub-total 3.7 3.4
Total capex 6.6 5.6
13
Dividends
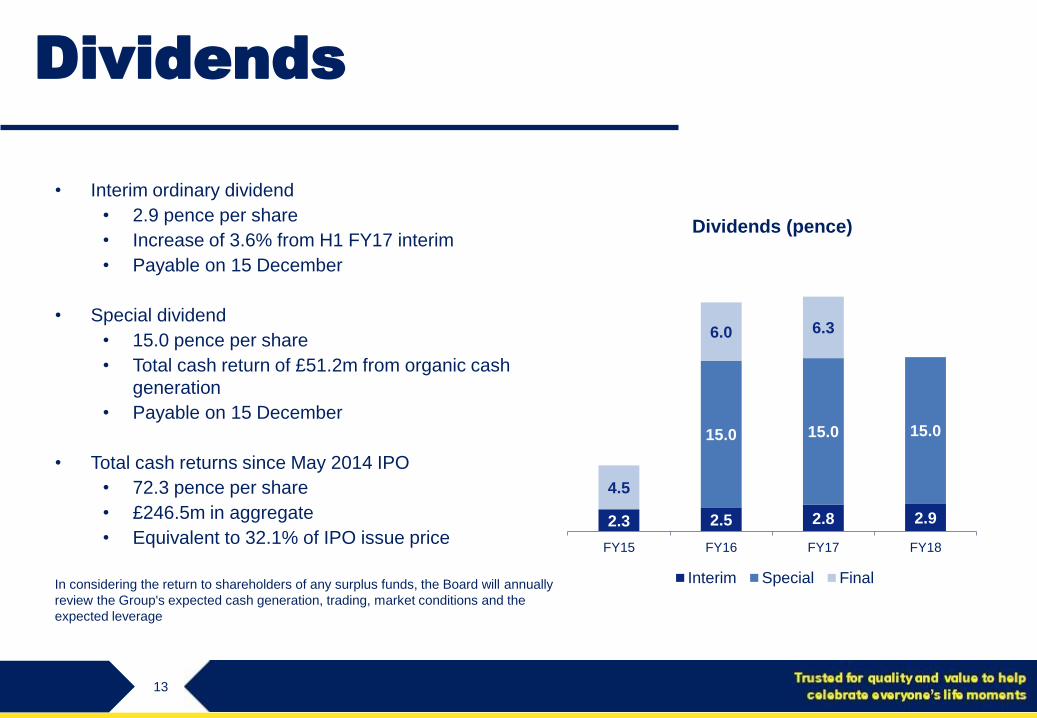
• Interim ordinary dividend
• 2.9 pence per share
• Increase of 3.6% from H1 FY17 interim
• Payable on 15 December
• Special dividend
• 15.0 pence per share
• Total cash return of £51.2m from organic cash
generation
• Payable on 15 December
• Total cash returns since May 2014 IPO
• 72.3 pence per share
• £246.5m in aggregate
• Equivalent to 32.1% of IPO issue price
In considering the return to shareholders of any surplus funds, the Board will annually
review the Group's expected cash generation, trading, market conditions and the
expected leverage
2.3 2.5 2.8 2.9
15.0 15.0 15.0
4.5
6.0 6.3
FY15 FY16 FY17 FY18
Dividends (pence)
Interim Special Final

14
Financial performance
Summary
Strong profit margins- Margin headwinds, mainly living
wage, FX and maintaining price points
- Cost control culture
- Business efficiencies
Strong revenue growth- Good average spend increases
- Outperforming footfall trends
- New store roll out
- Online development
Surplus cash returns- Leverage of 1.50x LTM EBITDA
- Special dividend of 15p (£51.2m)
- £246.5m returned since IPO
- Timing and amount of future
returns to be reviewed
Highly cash generative- Strong underlying operating cashflow
- Low, predictable and well controlled
capex

15
Insert Text Here
Business update
Karen Hubbard
Chief Executive Officer

16
H1 FY18 four pillar performance
Like-for-like
sales growth
Store LFL: 3.0%
cardfactory.co.uk: 29.8%
New stores
30 net new UK store
openings
895 UK stores
1 ROI trial store
Business
efficiencies
EBITDA margin: 18.3%
Further mitigation in H2
Online
development
Sales growth:
Getting Personal: 5.0 %
cardfactory.co.uk: 29.8%
17
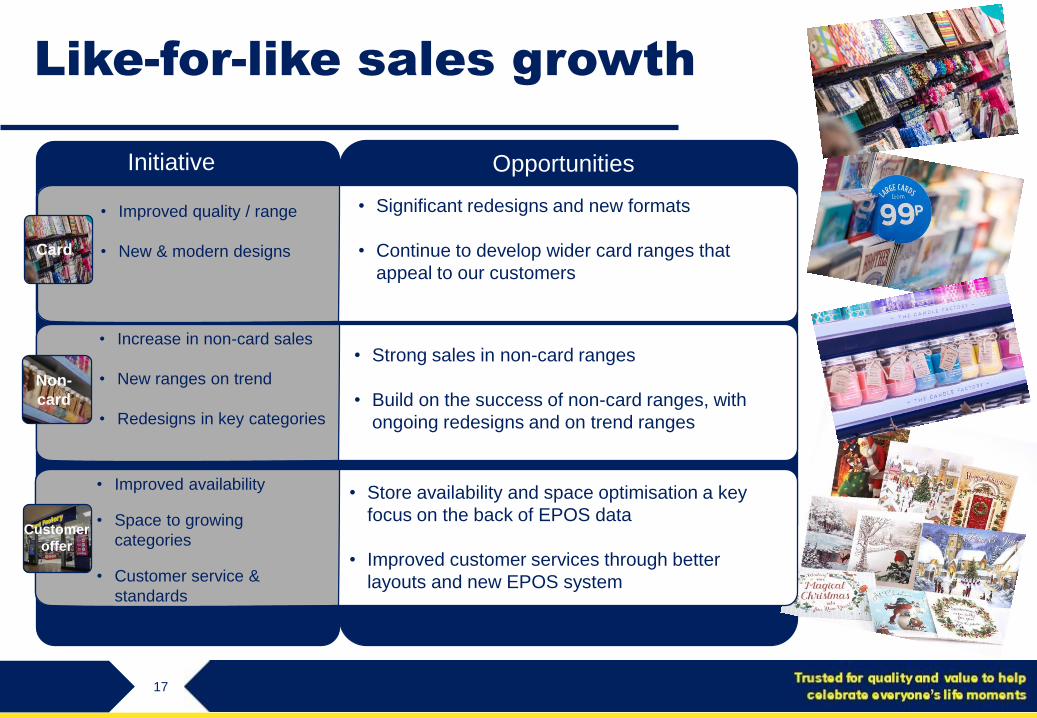
Like-for-like sales growth
OpportunitiesInitiative
Card
Non-
card
Customer
offer
• Improved quality / range
• New & modern designs
• Increase in non-card sales
• New ranges on trend
• Redesigns in key categories
• Improved availability
• Space to growing
categories
• Customer service &
standards
• Significant redesigns and new formats
• Continue to develop wider card ranges that
appeal to our customers
• Strong sales in non-card ranges
• Build on the success of non-card ranges, with
ongoing redesigns and on trend ranges
• Store availability and space optimisation a key
focus on the back of EPOS data
• Improved customer services through better
layouts and new EPOS system

18
New store roll out
OpportunitiesInitiative
• 50 net new stores
• Opportunity with retail
parks
• Assess viability of
Card Factory to
trade in ROI
• Profitable and cost
effectiveRetail
Estate
Republic
of Ireland
New
Stores
• Continue to open 50 net new stores with
appropriate stores for that customer base
• Continue to assess ROI performance and
identify opportunity to open new space
• Continue to drive cost effective property,
whilst at the same time improving the
customer proposition
19
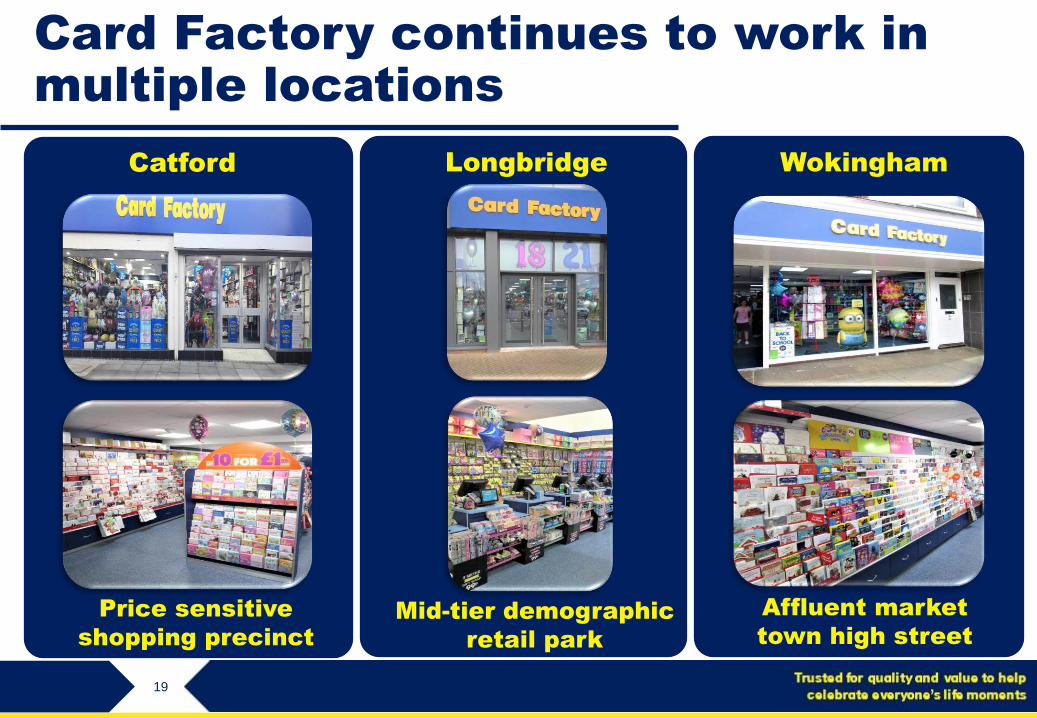
Card Factory continues to work in
multiple locations
Price sensitive
shopping precinct
Catford
Mid-tier demographic
retail park
Longbridge
Affluent market
town high street
Wokingham
20
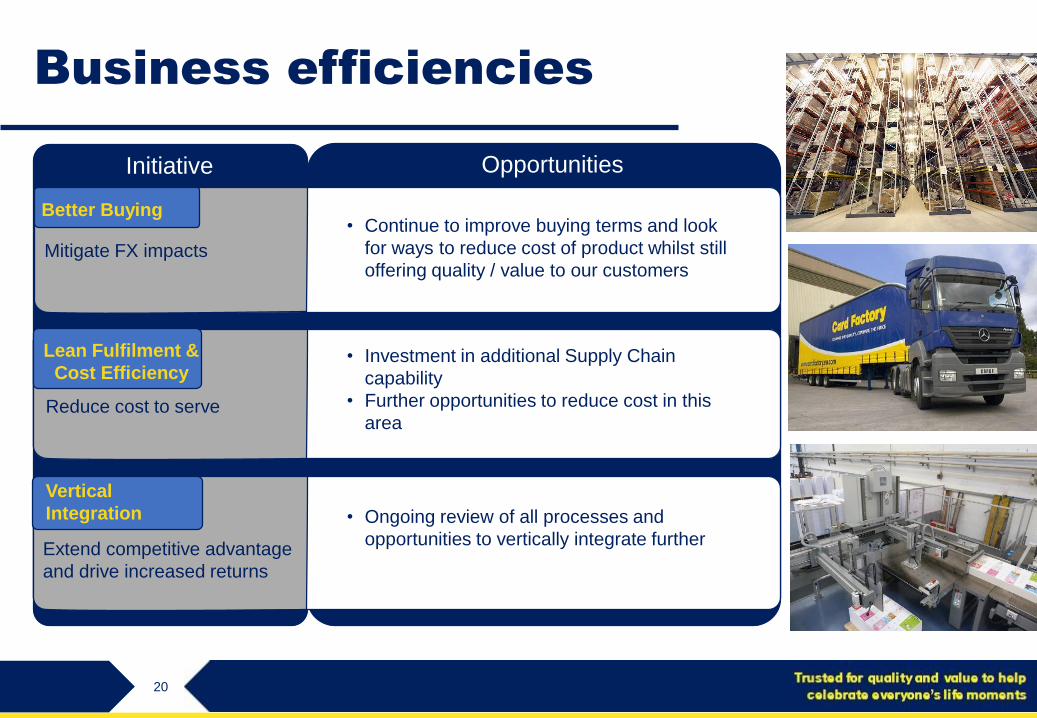
Business efficiencies
Opportunities Initiative
Mitigate FX impacts
Extend competitive advantage
and drive increased returns
Vertical
Integration
Reduce cost to serve
Lean Fulfilment &
Cost Efficiency
Better Buying• Continue to improve buying terms and look
for ways to reduce cost of product whilst still
offering quality / value to our customers
• Investment in additional Supply Chain
capability
• Further opportunities to reduce cost in this
area
• Ongoing review of all processes and
opportunities to vertically integrate further
21
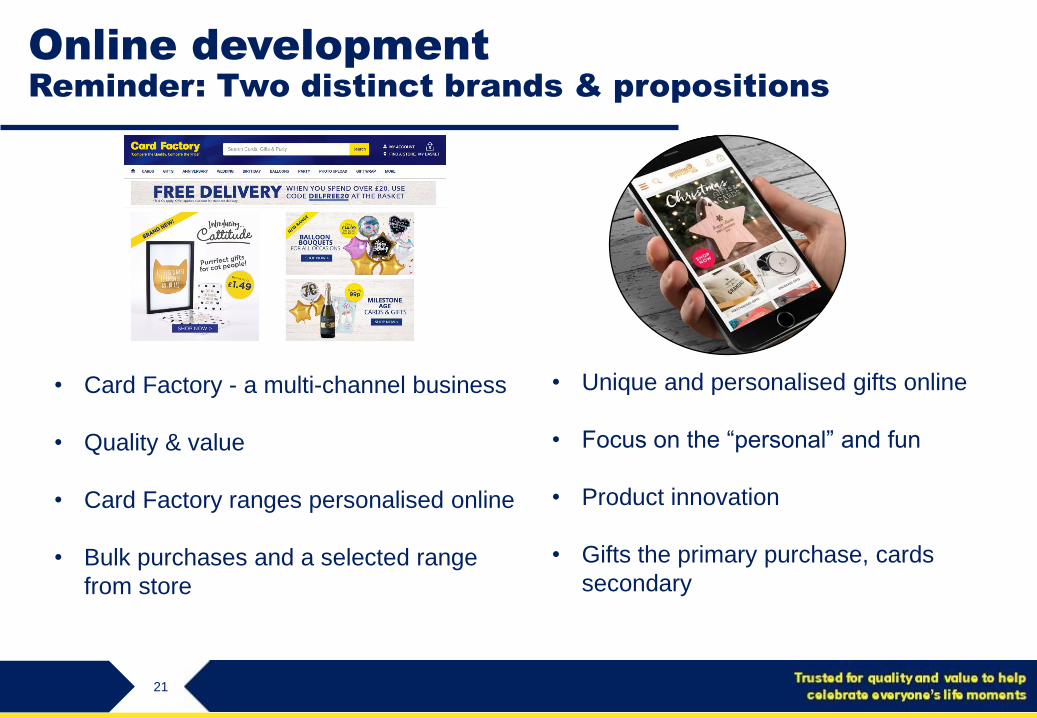
Online development
Reminder: Two distinct brands & propositions
• Card Factory - a multi-channel business
• Quality & value
• Card Factory ranges personalised online
• Bulk purchases and a selected range
from store
• Unique and personalised gifts online
• Focus on the “personal” and fun
• Product innovation
• Gifts the primary purchase, cards
secondary

22
cardfactory.co.uk
Progress StatusInitiative OpportunitiesInitiative
Customer Experience
Product
Acquire Customers• Further innovative and cost effective ways to
drive awareness of the Card Factory online
proposition
• Development of ranges in line with quality /
value with a focus on seasonal & occasion
based ranges
• Significant development of platform and
customer experience
23
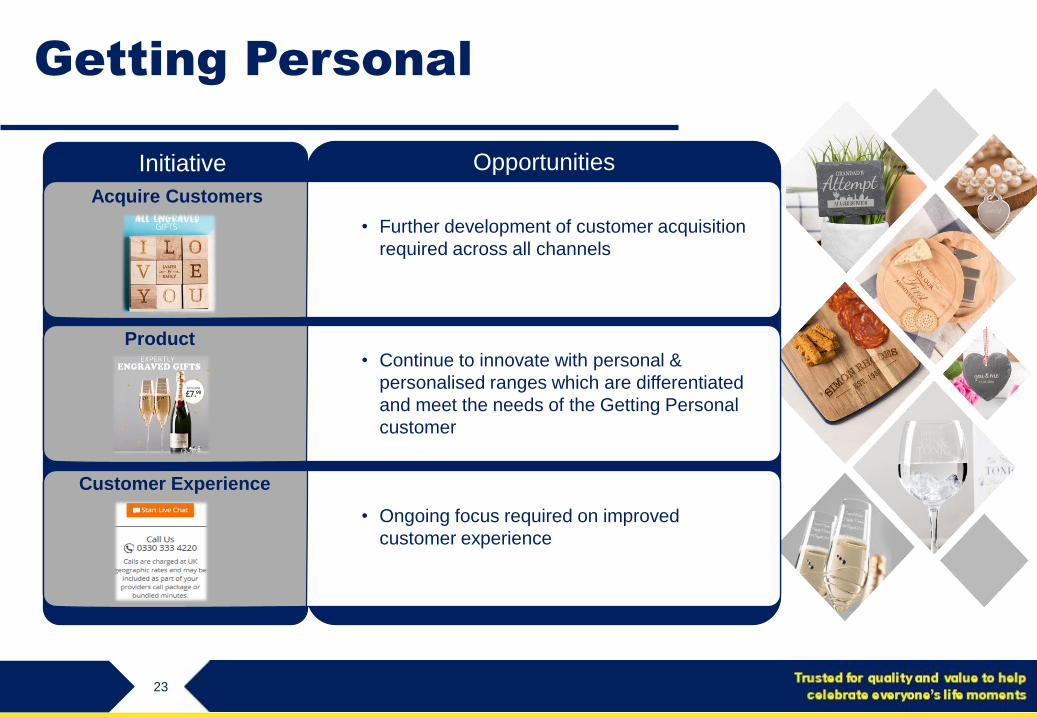
Getting Personal
StatusOpportunitiesInitiative
Customer Experience
Product
Acquire Customers
• Further development of customer acquisition
required across all channels
• Continue to innovate with personal &
personalised ranges which are differentiated
and meet the needs of the Getting Personal
customer
• Ongoing focus required on improved
customer experience
24
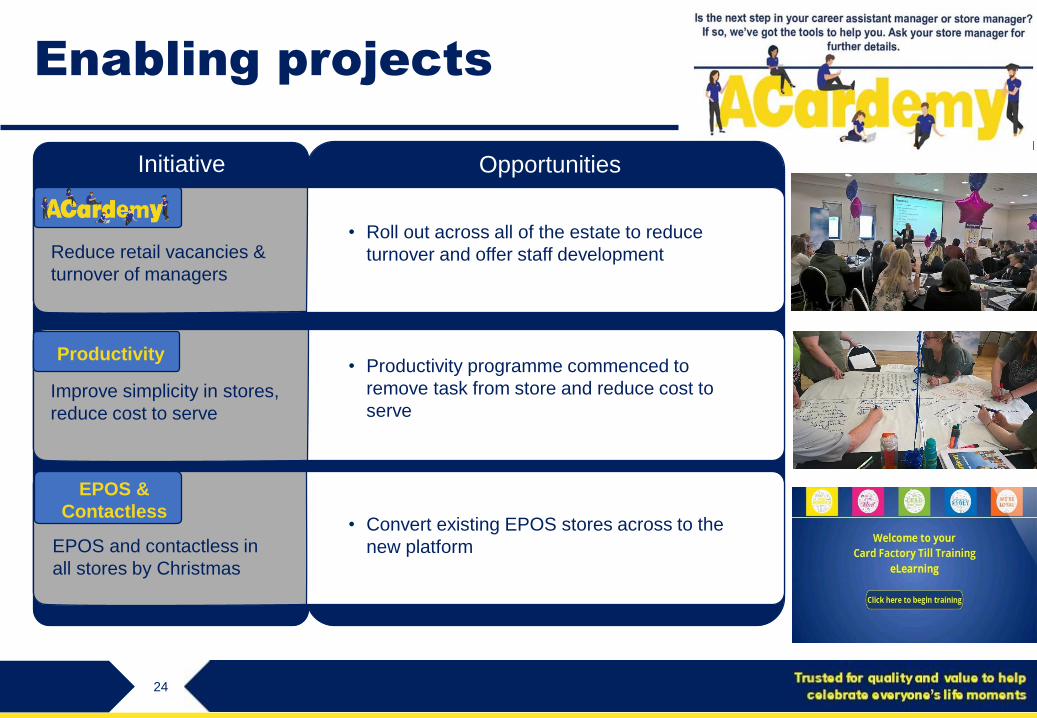
Enabling projects
OpportunitiesInitiative
Reduce retail vacancies &
turnover of managers
Improve simplicity in stores,
reduce cost to serve
Productivity
EPOS &
Contactless
EPOS and contactless in
all stores by Christmas
• Roll out across all of the estate to reduce
turnover and offer staff development
• Productivity programme commenced to
remove task from store and reduce cost to
serve
• Convert existing EPOS stores across to the
new platform
25
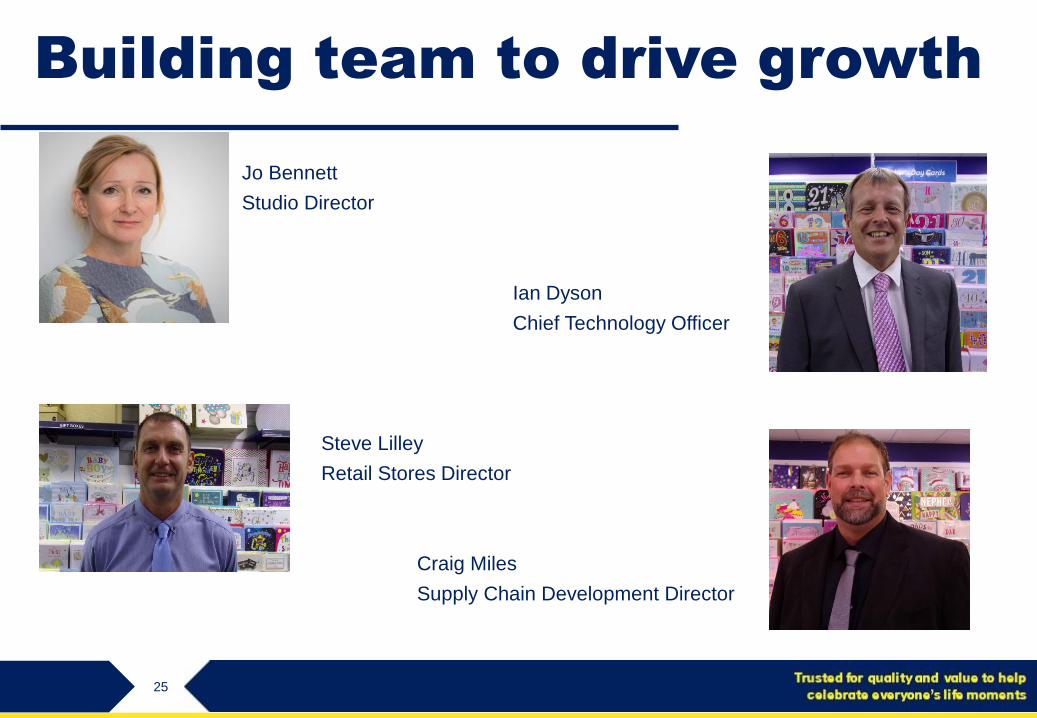
Building team to drive growth
Jo Bennett
Studio Director
Ian Dyson
Chief Technology Officer
Steve Lilley
Retail Stores Director
Craig Miles
Supply Chain Development Director
26
Forward View
• Strong sales performance
• Ongoing cost headwinds
• A retailer fit for the future
• The right team in place
• Encouraging start to H2

27
Trusted for quality and value to help
celebrate everyone’s life moments
28
Insert Text Here
Questions