Embed Size (px)
Citation preview
For the First Quarter ended31 December 2018
CONDENSED INTERIM REPORT

Condensed Interim Report 1Q 2019 1
C O N T E N T S
Vision, Mission and Core Values 3
Company Information 4
Shareholders’ Information 5
Company Profile and Group Structure 6
Directors’ Review 8
Condensed Interim Statement of Financial Position 10
Condensed Interim Statement of Profit and Loss Account 12
Condensed Interim Statement of Comprehensive Income 13
Condensed Interim Cash Flow Statement 14
Condensed Interim Statement of Changes in Equity 15
Notes to the Condensed Interim Financial Information 16

2
Condensed Interim Report 1Q 2019 3
To gain and maintain leadership in our relevant sectors by producingthe best quality products at the lowest possible cost
To give the best returns to our shareholders by optimal allocation ofresources to the products and markets we compete in
To provide the best value products and services to our customersthrough investment in technology, human resources, operational
systems, and processes
To provide the best working environment to our employees andprovide them opportunities to enhance their skills
To work with our farmers, suppliers, and distributors as partners indeveloping their expertise and profitability
To pursue environment friendly policies, and effectively and efficientlyuse all energy resources aiming for zero waste and a clean healthy
environment
To be a socially responsible corporate citizen supporting education,health, environment, and socio economic development of its
community
VISION, MISSION & CORE VALUES

4
COMPANY INFORMATION
Board of Directors 1. Chairman (Non-Executive) Muhammad Anwar2. Chief Executive Officer Anjum Muhammad Saleem In alphabetic order:3. Executive Director Ali Altaf Saleem4. Non-Executive Director Hajerah Ahsan Saleem 5. Non-Executive Director Khalid Bashir6. Non-Executive Director (Independent) Khawaja Jalaluddin7. Non-Executive Director Muhammad Arshad8. Non-Executive Director (Independent) Sheikh Asim Rafiq
Audit CommitteeChairman Khalid BashirMember Hajerah Ahsan SaleemMember Khawaja Jalaluddin (Independent)Member Sheikh Asim Rafiq (Independent)
Human Resource & Remuneration CommitteeChairman Muhammad Anwar Member Anjum Muhammad SaleemMember Khalid Bashir
Chief Financial Officer Muhammad Asif
Company Secretary Asif Ali
Management Committees
Executive CommitteeChairman Anjum Muhammad Saleem Ali Altaf Saleem Muhammad Pervez Akhtar
Business Strategy CommitteeChairman Anjum Muhammad Saleem Ali Altaf Saleem Muhammad Pervez Akhtar Muhammad Asif Manzoor Hussain Malik System & Technology CommitteeChairman Muhammad Pervez Akhtar Muhammad Asif Ibrahim Ahmad Cheema

Condensed Interim Report 1Q 2019 5
Stock Exchange Listing Shakarganj Limited is a listed company and its shares are traded on the Pakistan Stock Exchange. Daily quotes on the Company’s stock can be obtained from leading newspapers. Shakarganj is listed under ‘Sugar & Allied Industries ’
Public Information
Financial analysts, Stock brokers,interested investors and financialmedia desiring information about“Shakarganj” should contactMr. Asif Aliat the Company’s Office, Jhang.Tel: (047) 763 1001 - 05Fax: (047) 763 1011E-mail: [email protected]
Shareholders’ Information
Inquiries concerning lost stockcertificates, dividend payment,change of address, verification oftransfer deeds and share transfersshould be directed to CorpTec Associates (Pvt) Limited, Share Registrar of the Company at Lahore.Tel: (042) 3517 0336 - 7Fax: (042) 3517 0338E-mail: [email protected]
Products
• Sugar• Bio Fuel• Bio Power• Building Materials• Yarn• Tiger Compost
Legal Advisor
Hassan & Hassan Advocates, Lahore
Auditors
KPMG Taseer Hadi & Co.Chartered Accountants
Bankers
MCB Bank LimitedNational Bank of PakistanBank Islami Pakistan Limited
SHAREHOLDERS’ INFORMATION
Works
Principal Facility
Management HouseToba Road, Jhang, PakistanTel: (047) 763 1001 - 05Fax: (047) 763 1011E-mail: [email protected]
Satellite Facility
Management House63 km, Jhang Sargodha RoadBhone, PakistanTel: (048) 688 9211 - 13Fax: (047) 763 1011
Website
www.shakarganj.com.pkNote: This Report isavailable on Shakarganj website.
Registered and Principal Office
Executive Floor, IT Tower, 73 E 1Hali Road, Gulberg III, Lahore, PakistanUAN: (042) 111 111 765Tel: (042) 3578 3801-06Fax: (042) 3578 3811
Karachi Office
12th Floor, Sidco Avenue Centre,264 R.A. Lines, Karachi, PakistanTel: (021) 3568 8149Fax: (021) 3568 0476
Faisalabad Office
Nishatabad, New Lahore Road,Faisalabad, PakistanTel: (041) 875 2810Fax: (041) 875 2811
Share Registrar
CorpTec Associates (Pvt) Limited503-E, Johar TownLahoreTel: (042) 3517 0336 - 7Fax: (042) 3517 0338E-mail: [email protected]

6
Shakarganj Limited was incorporated in Pakistan in 1967 as a Public Limited Company and is listed on the Pakistan Stock Exchange. Shakarganj is a leading manufacturer of food products, biofuel, building materials, as well as textiles. We transform renewable crops such as sugarcane and cotton into value added products including refined sugar, textiles, biofuel, and building materials. Our registered office is in Lahore with regional offices in Faisalabad and Karachi.
Shakarganj Limited, through its strategic shareholding in Shakarganj Food Products Limited, is also active in production of dairy and fruit products.
Sugar Business:
We have two manufacturing facilities, which are both located in District Jhang. We produce different types of sugar comprising pharmaceutical, beverage and commercial grades sugar as well as soft brown sugar, castor and icing sugar, sugar cubes, sachets and retail packs. Our combined crushing capacity is of 20,000 Tons of Cane per Day (TCD) which is extendable to 32,000 TCD.
Biofuel Business:
We have six distillation plants of which three are located at our Jhang facility and the remaining three are located at our Bhone facility where various grades of biofuel are produced. Our products include Rectified Ethanol (REN) for industrial and food grades, Anhydrous Ethanol for fuel grade, and Extra Neutral Alcohol (ENA) for pharmaceutical and perfume grades. The combined capacity of our distilleries is 350,000 litres per day.
Bio Power Business:
We have a biogas based power generation facility located at Jhang. This facility consists of an Effluent Treatment Plant (ETP) and a Power Generation Facility. ETP operations involve biological treatment of distillery waste to produce methane, which then undergoes a biological de-sulphurisation process that removes sulphur from it. This gas can then either be utilised as fuel in our boilers, or more efficiently utilised to generate electricity in our biogas based generators which have a capacity 8 Megawatts.
Building Materials Business:
Our Building Materials Division is located at our Jhang facility, with a capability to produce 12 x 4 foot sheets of particle board with varying thickness. Our daily production capacity is 30 cubic metres.
Textile Business:
Located at our Jhang facility, this cotton spinning unit produces carded cotton and PC yarn ranging from 10/s to 33/s and doubled yarn ranging from 8 to 40 TPI. The installed capacity is 24,960 spindles for cotton/PC spinning and 2,304 spindles for doubling.
Farming & Allied Business:
This comprises different parcels of land mainly located in Jhang District near our manufacturing facilities. Total area under cultivation is 1,285 acres which is our owned land. The main crops include sugarcane, wheat, gram, maize, fodder and seasonal vegetables. A dairy farm located at Jhang has been developed, with a herd of 150 milking and fattening cattle. A small herd of rams and bucks for fattening purpose has also been developed. Shakarganj has also launched a new product in the area of non chemicals fertilizers under the brand name of “Shakarganj Tiger Compost”. The product as organic fertilizer has been developed using aerobic decomposition process with addition of standardised microbial culture in filter cake. The compost is a rich source of organic matter, with macro and micro nutrients to help improve soil and it is very useful for better growth, yield and quality of all field crops in general and specifically for sugarcane. This is at its initial stage and would grow up in the farmer’s community with the practical exposures.
Business Vision and Strategy:
Shakarganj’s vision is to create the country’s leading renewable ingredients business. We aim to achieve this by building a consistent portfolio of distinctive, profitable, high-value solutions in products and services for our customers. Shakarganj is committed to providing long-term value for our shareholders. Our strategy is to build a stronger value added business with a low-cost commodity base. We
COMPANY PROFILE AND GROUP STRUCTURE

Condensed Interim Report 1Q 2019 7
focus on five key business objectives to deliver consistent growth.
- Serve our Customers:
Delivering excellent customer service is at the core of everything we do. Our aim is to be the partner of choice in our customers’ processes and to help them develop more successful consumer products.
- Operate Efficiently and Safely:
We aim to be the lowest-cost and most efficient producer in all our markets. Through our expertise in high-volume process management, our focus is on technical and manufacturing excellence and the efficient use of services such as logistics and utilities. We are continually working to improve operational efficiency and strive to ensure safe and healthy conditions for everyone at our sites.
- Invest in Long Term Assets and Partnerships:
We continually evaluate investment opportunities that would add strategic value by enabling us to enter new markets or add products, technologies and knowledge more efficiently than we could originally. We also aim to grow our business by forming joint ventures and partnerships to enhance the capabilities of our existing product portfolio. Using alliances
and joint ventures can be an efficient way to lower our cost of investing in new areas and markets, and will help secure access to new and complementary technology and expertise.
- Invest in Technology and People:
We are investing in our research and development capabilities to help us in developing innovative solutions that meet our customers’ product challenges. We are also complementing our own capabilities through business and technology partnerships, and university collaborations. To develop talent, improve leadership and help our employees succeed, we operate various Programmes designed to ensure the right skills at all levels to grow our business.
- Grow the Contribution from Value Added Products:
We are committed to grow the contribution from our value added products. Value added products utilise technology and intellectual property enabling us to obtain a price premium along with sustainable and/or higher margins.
8
I am pleased to present you the un-audited condensed interim financial information of the Company for the first quarter ended 31 December 2018.
Financial and Operational Performance: Summary of operating performance:
In challenging economic environments, Shakarganj started its crushing campaign on 30 December 2018, so no sugar production in the period under review. At the season opening time, sugar mills were reluctant to start crushing season and in Punjab no sugar mill could start crushing even till the mid of December 2018. Unpredictable and impractical policies of the government pertaining to sugar exports have created problems both for millers and growers and resultantly sugar prices remained very depressed. However, subsequently improvements in sugar price and improved recovery were noticed which may reduce the expected losses.
Our biofuel business performed well and prices as well as the margins were reasonably good. The Company’s export of biofuel improved to more than double. Inspite of heavy losses in sugar business due to no production and prevailing price scenario, the Company still earned a gross profit of Rs. 126.62 million compared to a gross loss of Rs. 306.80 million during corresponding period. Consequently, Company incurred an overall after tax loss of Rs. 68.21 million as compared to after tax loss of Rs. 390.33 million in Q1FY2018. In view of improvements in biofuel prices in terms of Pak Currency, we hope that your Company would be able to do well in biofuel business.
Business Segments:
Sugar Division:
Due to high cost of sugarcane compared to sugar selling prices, the crushing campaign was started very late (30 December 2018) and the production of sugar was still in start-up phase on 31 December 2018. The Sugar Division crushed 4,179 MT (1QFY18: 62,064 MT) of sugarcane to produce Nil (1QFY18: 2,481 MT) of sugar.
Biofuel Division:
The production of this division increased to 6.70 million litres (1QFY18: 4.62 million litres). During the period under review, the performance of Biofuel Division was good and the trend was improving in terms of production and profitability. However, delay in crushing season has the impact on overall raw material scenario in the area. During the period, exports accounted for 91.3 percent of total biofuel sales.
DIRECTORS’ REVIEW

Condensed Interim Report 1Q 2019 9
Textile Division:
Yarn production decreased to 914,322 kg (1QFY18: 943,261 kg). The decrease in production was mainly attributable to increase in average count during the current period compared to corresponding period.
Outlook:
Initial survey for the sugarcane crop indicates that sugarcane output was expected to remain lower, however, sugar division performance is dependent on its selling price of sugar and availability of good quality sugarcane. However, the management is confident for better results in biofuel business in the remaining period of fiscal year 2019 in view of better production as well as improvements in foreign exchange rates. As the future outlook of our distilleries operation depends on continuous availability of good quality molasses, the management is striving to add bulk quantity of molasses at reasonable cost to create enough margins for healthy bottom line. Sugar Price outlook is dependent of government policies. However, we would try our level best to achieve better results in this segment. The Textile Division performance is expected to improve in view of the margin available. The Company remains committed to its best efforts to keep the operational profitability going on and to improve further its overall liquidity scenario as well.
We would like to thank all stakeholders for their patronage and looking forward for their support.
On behalf of the Board
Anjum Muhammad SaleemChief Executive Officer
Ali Altaf SaleemDirector
Date: 28 January 2019

10
CONDENSED INTERIM STATEMENT OF FINANCIAL POSITIONS AT As at 31 December 2018 (Un-audited) 31 DECEMBER 2018 (UN-AUDITED)
Note 31 December 30 September 2018 2018 (Un-audited) (Audited) (Rupees in thousand)
EQUITY AND LIABILITIES Share capital and reserves Authorized capital 150,000,000 (30 September 2018: 150,000,000) ordinary shares of Rs. 10 each 1,500,000 1,500,000 50,000,000 (30 September 2018: 50,000,000) preference shares of Rs. 10 each 500,000 500,000 2,000,000 2,000,000 Issued, subscribed and paid up capital 125,000,000 (30 September 2018: 125,000,000) ordinary shares of Rs 10 each 1,250,000 1,250,000 Equity portion of director loan - net of tax Reserves 2,192,669 2,196,442 Accumulated losses (1,573,849) (1,588,974)Surplus on revaluation of property, plant and equipment - net of tax 6,742,071 6,825,404
8,610,891 8,682,872 Non-current liabilities Long term finances 7 391,912 442,703 Deferred taxation 1,108,173 1,129,461 1,500,085 1,572,164 Current liabilities Current portion of long term liabilities 109,413 97,703 Short term borrowings 8 2,177,078 2,243,284 Trade and other payables 1,626,458 1,663,125 Unclaimed dividend 2,217 2,273 Accrued finance cost 59,373 45,711
3,974,539 4,052,096 Contingencies and commitments 9 14,085,515 14,307,132 The annexed notes 1 to 21 form an integral part of this condensed interim financial information.
Chief Executive Director Chief Financial Officer

Condensed Interim Report 1Q 2019 11
Note 31 December 30 September 2018 2018 (Un-audited) (Audited) (Rupees in thousand)
ASSETS Non-current assets Property, plant and equipment 10 10,707,888 10,825,661 Biological assets 11,738 11,558 Investments - related parties 11 1,959,128 1,938,565 Employees’ retirement benefits 11,948 11,948 Long term loans, advances and deposits 33,986 33,986 12,724,688 12,821,718 Current assets Biological assets 18,056 19,717 Stores, spare parts and loose tools 145,223 65,756 Stock-in-trade 12 618,065 1,028,311 Trade debts 283,106 39,431 Loans, advances, deposits, prepayments and other receivables 202,280 303,928 Cash and bank balances 94,097 28,271 1,360,827 1,485,414
14,085,515 14,307,132
Chief Executive Director Chief Financial Officer

12
CONDENSED INTERIM STATEMENT OF PROFIT AND LOSS ACCOUNTFor the First Quarter Ended 31 December 2018 (Un-Audited)
December December 2018 2017 Note (Rupees in thousand)
Sales - net 14.1 1,482,220 822,712 Cost of sales 14.2 (1,355,602) (1,129,512) Gross profit / (loss) 126,618 (306,800) Administrative expenses (71,101) (62,692) Distribution and selling costs (66,354) (27,802) Other expenses (23,933) (22,782) Other income 9,960 22,493 Loss from operations (24,810) (397,583) Finance cost (73,229) (50,033) Share of profit from equity accounted investment 59,880 81,399 Loss before taxation (38,159) (366,217) Taxation - Company 5,495 5,235 - Equity accounted investment (35,544) (29,353)
(30,049) (24,118) Loss for the period (68,208) (390,335) Loss per share - basic and diluted Rupees 17 (0.55) (3.33) The annexed notes 1 to 21 form an integral part of this condensed interim financial information.
Chief Executive Director Chief Financial Officer

Condensed Interim Report 1Q 2019 13
CONDENSED INTERIM STATEMENT OF COMPREHENSIVE INCOMEFFor the First Quarter Ended 31 December 2018 (Un-Audited)
December December 2018 2017 (Rupees in thousand)
Loss for the period (68,208) (390,335) Other comprehensive income for the period Items that are or may be reclassified to profit or loss account: Fair value loss on ‘Available for sale’ investments (3,773) (5,558) Total comprehensive income for the period (71,981) (395,893) The annexed notes 1 to 21 form an integral part of this condensed interim financial information.
Chief Executive Director Chief Financial Officer

14
CONDENSED INTERIM CASH FLOW STATEMENTFor the First Quarter Ended 31 December 2018 (Un-Audited)
December December 2018 2017 Note (Rupees in thousand)
Cash flows from operating activities Cash generated from operations 18 279,143 416,587 Finance cost paid (59,567) (112,810)Taxes paid (15,279) (10,347) Net cash generated from operating activities 204,297 293,430 Cash flows from investing activities Fixed capital expenditure (40,064) (20,474)Proceeds from sale of property, plant and equipment 6,703 - Dividends received 180 405 Income from bank deposits received 53 26 Net cash used in investing activities (33,128) (20,043) Cash flows from financing activities Repayment of long term finances (39,081) (24,369)Short term borrowings - net (66,206) (236,575)Dividend paid (56) - Net cash used in financing activities (105,343) (260,945) Net Increase in cash and cash equivalents 65,826 12,442 Cash and cash equivalents at beginning of the period 28,271 5,255 Cash and cash equivalents at end of the period 13 94,097 17,697
The annexed notes 1 to 21 form an integral part of this condensed interim financial information.
Chief Executive Director Chief Financial Officer

Condensed Interim Report 1Q 2019 15
CO
ND
EN
SED
INT
ER
IM S
TAT
EM
EN
T O
F C
HA
NG
ES
IN E
QU
ITY
For
the
Firs
t Qua
rter
End
ed 3
1 Dec
embe
r 20
18 (U
n-A
udite
d)
CA
PIT
AL
RES
ERV
E
REV
ENU
E R
ESER
VE
Shar
e in
Diff
eren
ce o
f Su
rplu
s on
Eq
uity
Cap
ital R
eser
ves
C
apita
l Und
er
reva
luat
ion
port
ion
of
Equi
ty
of E
quity
Fa
ir
Sche
me
of
on p
rope
rty,
di
rect
or
Inve
stm
ent
Acc
umul
ated
Sh
are
Shar
e A
ccou
nted
Va
lue
Arr
ange
men
t pl
ant a
nd
loan
- n
et
D
ivid
end
Mar
ket V
alue
l
oss
C
apita
l Pr
emiu
m
Inve
stm
ent
Res
erve
of
Mer
ger
mac
hine
ry
of ta
x G
ener
al
Equa
lizat
ion
Equa
lizat
ion
To
tal
Bal
ance
as
on 0
1 Oct
ober
20
17 -
rest
ated
1,
250
,00
0
1,0
56,3
73
(14,
688
) 12
,553
15
5,93
0
4,7
19,9
06
4
7,055
4
10,6
06
2
2,70
0
83,
00
0
(1,6
06,
671)
6
,136,
764
Tota
l com
preh
ensi
ve in
com
e fo
r th
e pe
riod
end
ed 3
1 Dec
embe
r 20
17
Lo
ss fo
r th
e pe
riod
(390
,335
) (3
90,3
35)
Oth
er c
ompr
ehen
sive
inco
me
for
the
perio
d:
Fair
valu
e lo
ss o
n ‘A
vaila
ble
for
sale
’ inv
estm
ents
(5,5
58)
(5
,558
)
-
-
-
(5,5
58)
-
-
-
-
-
-
(390
,335
) (3
95,
893)
Surp
lus
tran
sfer
red
to a
ccum
ulat
ed lo
sses
on
acco
unt o
f:
- inc
rem
enta
l dep
reci
atio
n on
pro
pert
y, p
lant
and
equ
ipm
ent
- n
et o
f def
erre
d ta
x -
- -
- -
(53,
426
) -
- -
- 5
3,42
6
-
-
-
-
(5
,558
) -
(5
3,42
6)
-
-
-
-
(336
,90
9)
(39
5,89
3)Tr
ansa
ctio
ns w
ith o
wne
rs o
f the
Com
pany
, rec
ogni
zed
dire
ctly
in e
quity
Equi
ty p
ortio
n of
loan
from
dire
ctor
- ne
t of t
ax
- -
- -
- -
(2,5
57)
- -
- 2
,557
-
Bal
ance
as
on 3
1 Dec
embe
r 20
17
1,25
0,0
00
1,
056
,373
(1
4,6
88)
6,9
95
15
5,93
0
4,6
66,
480
4
4,49
8
410
,60
6
22,
700
8
3,0
00
(1
,941
,023
) 5
,740
,871
B
alan
ce a
s on
01 O
ctob
er 2
018
1,
250
,00
0
1,0
56,3
73
469
,980
(2
,147)
15
5,93
0
6,8
25,4
04
-
410
,60
6
22,
700
8
3,0
00
(1
,588
,974
) 8
,682
,872
Tota
l com
preh
ensi
ve in
com
e fo
r th
e pe
riod
end
ed 3
1 Dec
embe
r 20
18
Lo
ss fo
r th
e pe
riod
-
-
-
- -
-
-
-
-
-
(6
8,20
8)
(68,
208)
Oth
er c
ompr
ehen
sive
inco
me
for
the
perio
d:
F
air
valu
e lo
ss o
n ‘A
vaila
ble
for
sale
’ inv
estm
ents
-
-
-
(3
,773
) -
-
-
-
-
-
-
(3
,773
)
-
-
-
(3
,773
) -
-
-
-
-
-
(6
8,20
8)
(71,9
81)
Surp
lus
tran
sfer
red
to a
ccum
ulat
ed lo
sses
on
acco
unt o
f
- dis
posa
l of p
rope
rty,
pla
nt a
nd e
quip
men
t - n
et o
f tax
-
-
-
-
-
(2
,797
) -
-
-
-
2
,797
-
- i
ncre
men
tal d
epre
ciat
ion
on p
rope
rty,
pla
nt a
nd
equi
pmen
t - n
et o
f def
erre
d ta
x -
-
-
-
-
(8
0,5
36)
-
-
-
-
80
,536
-
To
tal c
ompr
ehen
sive
inco
me
for
the
peri
od
-
-
-
-
-
(83,
333)
-
-
-
-
8
3,33
3
-
Bal
ance
as
on 3
1 Dec
embe
r 20
18
1,25
0,0
00
1,
056
,373
4
69,9
80
(5,9
20)
155,
930
6
,742,
071
-
410
,60
6
22,
700
8
3,0
00
(1
,573
,849
) 8
,610
,891
Th
e an
nexe
d no
tes
1 to
21 fo
rm a
n in
tegr
al p
art o
f thi
s co
nden
sed
inte
rim fi
nanc
ial i
nfor
mat
ion.
(Rup
ees
in th
ousa
nd)
C
hief
Exe
cutiv
e D
irec
tor
Chi
ef F
inan
cial
Offi
cer

16
NOTES TO THE CONDENSED INTERIM FINANCIAL INFORMATIONFor the First Quarter Ended 31 December 2018 (Un-Audited)
1. Reporting entity information 1.1 Shakarganj Limited (“the Company”) was incorporated in Pakistan and is listed on Pakistan
Stock Exchange. It is principally engaged in manufacture, purchase and sale of sugar, bio fuel, building materials, yarn (textile). The Company has its principal manufacturing facilities at Jhang and satellite manufacturing facilities at Bhone. The registered office of the Company is situated at E-floor, IT tower, 73-E/1, Hali Road, Gulberg-III, Lahore.
Business Unit Location - Jhang Unit Toba tek singh road, Jhang -35200 Pakistan. - Bhone Unit 57 km Jhang - Sargodha road, Bhone -35200 Pakistan. 1.2 Summary of significant events and transactions in the current reporting period The Company’s financial position and performance was particularly affected by the following
events and transactions during the reporting period: - The accounting policy for revaluation surplus on property plant and machinery changed
during the last year. Consequently, the amount of revaluation surplus on property, plant and machinery reported outside the equity in the prior years has been reclassified to equity. Furthermore revaluation of property plant and machinery was carried out during the last year which resulted in surplus of Rs. 2,721.1 million.
- Due to the first time application of financial reporting requirements under the Companies
Act, 2017, including disclosure and presentation requirements of the fourth schedule of the Companies Act, 2017, some of the amounts reported for the previous period have been reclassified.
- Devaluation of Pak Rupees against US dollars positively impacted the Company’s
export. - Sugar crushing season was started very late due to depressed selling prices. - For a detailed discussion about Company’s performance please refer to the directors
review accompanied in the condensed interim financial information of the Company for the period ended 31 December 2018.
2. Basis of preparation 2.1 Basis of accounting 2.1.1 This condensed interim financial information comprises the condensed interim statement of
financial position of the Company as at 31 December 2018 and the related condensed interim profit and loss account, condensed interim statement of comprehensive income, condensed interim cash flow statement and condensed interim statement of changes in equity together with the notes forming part thereof for the period from 01 October 2018 to 31 December 2018.
2.1.2 This condensed interim financial information has been prepared in accordance with the
accounting and reporting standards as applicable in Pakistan for interim financial reporting. The accounting and reporting standards as applicable in Pakistan for interim financial reporting comprise of:

Condensed Interim Report 1Q 2019 17
- International Accounting Standard (IAS) 34, Interim Financial Reporting, issued by the International Accounting Standards Board (IASB) as notified under the Companies Act, 2017;
- Islamic Financial Accounting Standards (IFAS) issued by the Institute of Chartered
Accountants of Pakistan as notified under the Companies Act, 2017; and - Provisions of and directives issued under the Companies Act, 2017. Where the provisions of and directives issued under the Companies Act, 2017 differ with the
requirements of IAS 34 or IFAS, the provisions of and directives issued under the Companies Act, 2017 have been followed.
2.1.3 This condensed interim financial information does not include all of the information required
for full annual financial statements and should be read in conjunction with the annual financial statements for the year ended 30 September 2018.
2.1.4 Comparative statement of financial position numbers are extracted from the annual audited
financial statements of the Company for the year ended 30 September 2018, whereas comparative figures of profit and loss account, statement of comprehensive income, cash flow statement and statement of changes in equity are stated from unaudited condensed interim financial information of the Company for the period ended 31 December 2017.
2.1.5 This condensed interim financial information is unaudited and being submitted to the
shareholders as required under Section 237 of the Companies Act, 2017 and the Listing Regulations of Pakistan Stock Exchange Limited.
3. Statement of consistency in accounting policies 3.1 The accounting policies and the methods of computation adopted in the preparation of the
condensed interim financial information are same as those applied in the preparation of the audited financial statements for the year ended 30 September 2018.
3.2 The following amendments and interpretations of approved accounting standards will be
effective for accounting periods as detailed below: Standard or interpretation Effective date (accounting periods beginning on or after)
IFRIC 23 - Uncertainty over Income Tax Treatments 01 January 2019 IAS 28 - Investments in Associates and Joint Ventures 01 January 2019 IFRS 3 - Business Combinations 01 January 2019 IFRS - 11 Joint Ventures 01 January 2019 IAS - 12 Income Taxes 01 January 2019 IAS - 23 Borrowing Cost 01 January 2019 4. Estimates The preparation of condensed interim financial information requires management to make
judgments, estimates and assumptions that affect the application of accounting policies and the reported amounts of assets and liabilities, income and expense. Actual results may differ from these estimates.
In preparing these condensed interim financial information, the significant judgments made by
management in applying the Company’s accounting policies and the key sources of estimation uncertainty were the same as those that applied to the financial statements for the year ended 30 September 2018.

18
5. Seasonality of operations Due to seasonal nature of sugar segment, operating results are expected to fluctuate in the
remaining nine months of the year than the first three months. The sugar cane crushing season normally starts from November and lasts till April in each
year. 6. Taxation The provision for taxation for the period ended 31 December 2018 has been made on an
estimated basis. .
Note December September 2018 2018 (Un-audited) (Audited) (Rupees in thousand)7. Long term finances Long term loans - secured Interest bearing - NBP Restructured 7.1 156,325 195,406 - NBP Medium Term 7.2 250,000 250,000 - First Credit Investment Bank 7.3 95,000 95,000
501,325 540,406 Less: transferred to current maturity - Long term loans - secured (109,413) (97,703) 391,912 442,703
7.1 This represents a restructured loan from National Bank of Pakistan having an aggregate amount of Rs. 312.5 million. The term of the loan is 5 years (inclusive of 1 year grace period) and the principal repayment to take place in 16 equal-quarterly installments of Rs 19.54 million. Mark-up is payable quarterly at a rate of monthly KIBOR + 100 bps per annum. This loan is secured against first pari passu charge over entire present and future fixed assets of the Company, first exclusive charge over specific machinery and personal guarantees of the directors of the Company.
7.2 This represents a medium term loan from National Bank of Pakistan having an aggregate
amount of Rs. 300 million out of which Rs. 250 million were disbursed till 31 December 2018. Term of the loan is three years including one year of grace period and the principal repayment to take place in equal quarterly installments of Rs. 31.25 million each starting from October 2019. Markup is payable quarterly at a rate of three month KIBOR + 3%. This loan is secured against 1st Joint Pari Passu charge of PKR 400 million over present and future fixed assets of the Company, personal guarantees by Mr. Anjum Muhammad Saleem (CEO) and Mr. Ali Altaf Saleem (Director of the Company). The security shall also be secured through pledge of such number of shares of Crescent Steel and Allied Products Limited with 40% margin which are equivalent to Loan amount.

Condensed Interim Report 1Q 2019 19
7.3 This represents a medium term finance facility from First Credit Investment Bank Limited aggregating to Rs. 100 million out of which Rs. 95 million were disbursed till 31 December 2018. The term of the loan is three years including eighteen months of grace period and the principal repayments to take place in equal quarterly installments of Rs. 15.84 million each starting from March 2020. Markup is payable quarterly at a rate of three months KIBOR + 3.5%. The loan is secured against pledge of shares from KSE 100 index acceptable to FCIBL at market value with 35% margin, personal guarantees of Mr. Anjum Muhammad Saleem (CEO) and Mr. Ali Altaf Saleem (Director of the Company) and ranking hypothecation charge over present and future assets of the Company with 25% margin excluding land and building.
Note December September 2018 2018 (Un-audited) (Audited) (Rupees in thousand)8. Short term borrowings
Secured: - Cash / Running finance 8.2 352,000 394,200 - Export refinance 8.3 1,456,633 1,474,800 Unsecured: - Short term interest free financing 8.4 368,445 374,284 2,177,078 2,243,284 8.1 Types of short term borrowings Interest / mark-up based financing 1,708,633 1,769,000 Islamic mode of financing 100,000 100,000 Interest free financing 368,445 374,284 2,177,078 2,243,284 8.2 Cash / Running finances The Company has arranged this short term finance facility from MCB Bank Limited to meet
working capital requirements to the extent of Rs. 1,000 million. This finance was available at a mark-up ranging from 10.83% per annum to 12.25% per annum (30 September 2018: 8.11% to 9.86%) on the outstanding balance or part thereof. Expiry date of this facility is 31 December 2018.
It is secured against stock of sugar located at Bhone premises of the Company and first joint
pari passu charge of Rs. 1,000 million over all fixed assets of the Company. However, exposure exceeding Rs. 525 million will be additionally secured by lien over LC’s (sight) of minimum “B” rated banks, value equivalent to the utilized facility.
8.3 Export refinance The Company has arranged facilities for short term finances to meet working capital
requirements from various bank under mark-up arrangements to the extent of Rs. 1,975 million (30 September 2018: Rs. 1,775 million). These finances were available at a mark-up ranging from 3.00% to 12.25% (30 September 2018: 3.00% to 9.86%) on the outstanding balance or part thereof. Foreign currency borrowings were available at mark-up rates based on LIBOR ranging around 5.72% (30 September 2018: 4.86% to 5.72%). Expiry date of the finances obtained from Bank Islami Pakistan Limited is 28 February 2019 for MCB Bank Limited 31 December 2018, for National Bank of Pakistan Dollar loan is 31 December 2018 and that of National Bank FAPC is 30 May 2019.

20
The aggregate export finance is secured against lien on export contracts, pledge of stock-in-trade, registered hypothecation charge on property, plant and equipment and current and fixed assets of the Company, first Joint Pari Passu charge over fixed assets of the Company, personal guarantees of CEO and Director and pledge of 55 million shares of Shakarganj Food Products Limited at a price of Rs. 10/share.
8.4 Short term interest free financing It represents unsecured short term interest free financing provided by a sugar agent for
financing the operations of the Company.
9. Contingencies and commitments 9.1 Contingencies
(i) Bank guarantee of Rs. 9.55 million (2018: Rs. 9.55 million) in favour of Sui Northern Gas Pipelines Limited against performance of contracts.
(ii) The Company has issued post dated cheques in favour of the Collector of Customs
against custom duty clearance in respect of import of plant and machinery amounting to Rs. 14.02 million (2018: Rs. 14.02 million).
(iii) The Sindh High Court (the Court) in the case of ‘Kasim Textile’ in its order of 07 May 2013
has held that benefit of carry forward of minimum tax under section 113 of the Income Tax Ordinance, 2001 is only available if tax payable in a tax year is less than minimum tax paid. If in a tax year, a Company has assessed losses on which no tax is payable, the Company forgoes the right to carry forward minimum tax paid in that year. In the light of this order, the Company is not entitled to carry forward minimum tax paid in the tax year 2013 to 2018 of Rs. 291.77 million as a result of assessed tax losses in these years and adjust it against normal tax liability. Also, in the case of refunds claimed in any year, those would also be adjusted accordingly. However, the management is of the view that the verdict has been challenged in the Supreme Court. The management expects a favorable outcome in respect of this case and hence no provision has been incorporated in this condensed interim financial information.
(iv) A case is pending against the Company is the Environmental Protection Agency, Punjab
(EPA) as a result of wastes and emissions generated during operational conditions of the principle manufacturing facility in Jhang. The Company has filed an appeal before the EPA and is confident of a favourable outcome.
9.2 Commitments The Company has the following commitments in respect of: (i) Contracts for acquisition of intangible (computer software) amounting to Rs. 20 million
(2018: Rs. 20 million). (ii) Contracts for other than capital expenditures Rs. 2.16 million (2018: Rs. 1.20 million).

Condensed Interim Report 1Q 2019 21
Note December September 2018 2018 (Un-audited) (Audited) (Rupees in thousand)10. Property, plant and equipment Operating assets (owned) 10.1 10,578,899 10,706,426 Capital work-in-progress 10.2 128,989 119,235
10,707,888 10,825,661 10.1 Operating assets (owned) Opening book value 10,706,426 8,386,457 Add: Addition 10.1.1 30,311 90,257 Adjustment of revaluation surplus - 2,735,070 10,736,737 11,211,784 Less Disposal during the period (4,137) (5,863) Depreciation charged during the period (153,701) (499,495)
(157,838) (505,358)
Closing book value 10,578,899 10,706,426 10.1.1 Addition during the period/year Plant and machinery 26,702 49,126 Tools and equipment - 19 Water electric and weighbridge equipment 2,534 2,098 Furniture and fixture 171 1,132 Office equipment 88 70 Vehicles 816 37,812 30,311 90,257
10.1.2 The Company basis its valuation of operating assets subject to impairment upon valuation performed by an independent valuation expert.
December September 2018 2018 (Un-audited) (Audited) (Rupees in thousand)10.2 Capital work-in-progress Civil works 5,112 5,112 Plant and machinery 97,111 87,357 102,223 92,469 Advances given for capital work in progress 26,766 26,766
128,989 119,235

22
Note December September 2018 2018 (Un-audited) (Audited) (Rupees in thousand)11. Investments - related parties In equity instruments of Shakarganj Food Products Limited (“SFPL”) 11.1 1,949,127 1,924,791 Available for sale 11.2 10,001 13,774 1,959,128 1,938,565 11.1 In equity instruments of SFPL Unquoted Shakarganj Food Products Limited 87,785,643 (30 September 2018: 87,785,643) fully paid ordinary shares of Rs. 10 each Equity held: 52.39% (30 September 2018: 52.39%) 11.1.1 1,949,127 1,924,791 11.1.1 In equity instruments of SFPL Cost 590,784 393,818 Brought forward amounts of post acquisition reserves 1,334,007 662,184 Further acquisition due to right shares - 196,966 1,924,791 1,252,968 Share of movement in reserves during the period / year - 484,668 Share of profit for the period / year - before taxation 59,880 265,754 - provision for taxation (35,544) (78,599)
24,336 187,155 Balance as at period / year end 11.1 1,949,127 1,924,791

Condensed Interim Report 1Q 2019 23
11.1.2 Shakarganj Food Products Limited (“SFPL”) is a public unlisted Company incorporated in Pakistan and is principally engaged in the business of manufacturing, processing and sale of food products. The activities of SFPL are largely independent of the Company. The following table summarizes the financial information of SFPL as included in its own financial statements and the Company’s share in the results. The table also reconciles the summarized financial information to the carrying amount of the Company’s interest in its associate.
December September 2018 2018 (Un-audited) (Audited)
Percentage interest held 52.39% 52.39%
December September 2018 2018 (Un-audited) (Audited) (Rupees in thousand)
Non-current assets 5,604,266 4,879,041 Current assets 3,184,606 3,475,686 Non-current liabilities (1,979,951) (1,694,572) Current liabilities (3,224,524) (3,122,209)
Net assets (100%) 3,584,397 3,537,946
Company’s share of net assets 1,877,866 1,853,530 Excess of purchase consideration over net assets 71,261 71,261
Carrying amount of interest in associate 1,949,127 1,924,791 Revenue 4,464,007 15,775,889 Profit from operations 46,452 356,024 Other comprehensive income - 926,322 Total comprehensive income (100%) 46,452 1,282,346 Company’s share of total comprehensive income 24,336 671,821
The financial year end of SFPL is also 30 September and above figures (adjusted with the
top up effect of revaluation surplus) are based on unaudited interim financial statements as of 31 December 2018.
11.1.3 Investments with face value of Rs. 550.00 million (30 September 2018: Rs. 550.00 million)
are pledged as security against short term borrowings as referred to in note 8. 11.1.4 Investment in SFPL is treated as joint venture in these financial statements instead of an
investment in subsidiary due to joint control over SFPL as a result of the shareholders’ agreement dated 12 April 2008.

24
Note December September 2018 2018 (Un-audited) (Audited) (Rupees in thousand)11.2 Available for sale Associated / related companies Quoted - related party Crescent Steel and Allied Products Limited: 180,000 (30 September 2018: 180,000) fully paid ordinary shares of Rs. 10 each 15,921 15,921 Equity held: 0.23% (30 September 2018: 0.23%) Market value - Rs. 10.00 million (30 September 2018 : Rs. 13.77 million) Unquoted - associated Company Crescent Standard Telecommunications Limited: 300,000 (30 September 2018: 300,000) fully paid ordinary shares of Rs 10 each 3,000 3,000 Others Unquoted Crescent Group Services (Private) Limited: 220,000 (30 September 2018: 220,000) fully paid ordinary shares of Rs 10 each 2,200 2,200 Innovative Investment Bank Limited: 51,351 (30 September 2018: 51,351) fully paid ordinary shares of Rs 10 each - - 21,121 21,121 Add: Cumulative fair value reserve 11.2.1 (5,920) (2,147) Less: Cumulative impairment losses recognized 11.2.2 (5,200) (5,200)
Fair value loss (11,120) (7,347)
10,001 13,774 11.2.1 Cumulative fair value reserve
As at 01 October (2,147) 12,553 Disposal of shares - - Fair value adjustment during the period / year (3,773) (14,700)
Balance as at period / year end (5,920) (2,147) 11.2.2 Cumulative impairment losses recognized As at 01 October 5,200 5,200 Reversal during the year - - Balance as at period / year end 5,200 5,200
Condensed Interim Report 1Q 2019 25
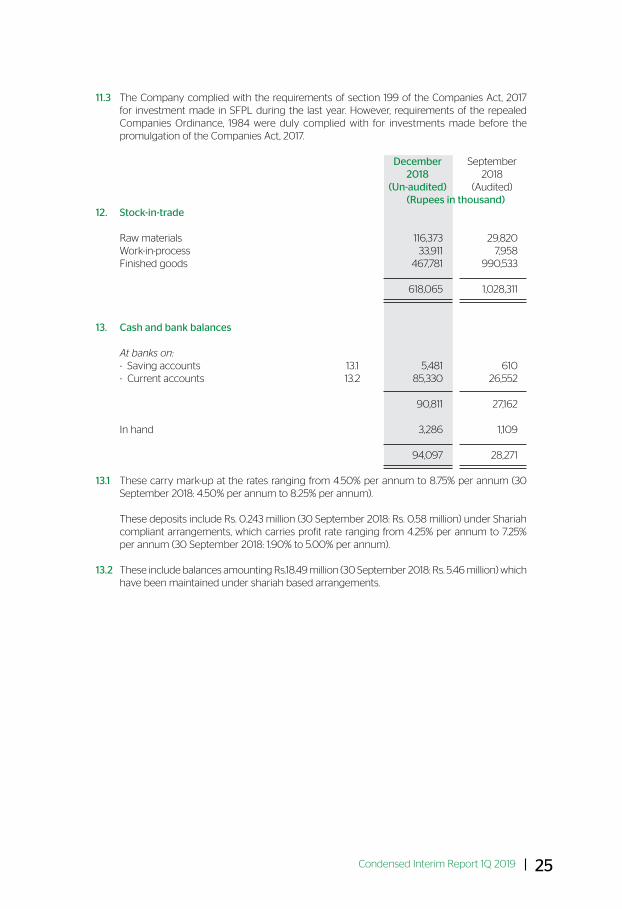
11.3 The Company complied with the requirements of section 199 of the Companies Act, 2017 for investment made in SFPL during the last year. However, requirements of the repealed Companies Ordinance, 1984 were duly complied with for investments made before the promulgation of the Companies Act, 2017.
December September 2018 2018 (Un-audited) (Audited) (Rupees in thousand)12. Stock-in-trade Raw materials 116,373 29,820 Work-in-process 33,911 7,958 Finished goods 467,781 990,533 618,065 1,028,311 13. Cash and bank balances
At banks on: - Saving accounts 13.1 5,481 610 - Current accounts 13.2 85,330 26,552 90,811 27,162 In hand 3,286 1,109 94,097 28,271 13.1 These carry mark-up at the rates ranging from 4.50% per annum to 8.75% per annum (30
September 2018: 4.50% per annum to 8.25% per annum). These deposits include Rs. 0.243 million (30 September 2018: Rs. 0.58 million) under Shariah
compliant arrangements, which carries profit rate ranging from 4.25% per annum to 7.25% per annum (30 September 2018: 1.90% to 5.00% per annum).
13.2 These include balances amounting Rs.18.49 million (30 September 2018: Rs. 5.46 million) which
have been maintained under shariah based arrangements.

26
Suga
r
Bio
Fue
l Te
xtile
F
arm
s
Oth
ers
Tota
l
31
Dec
embe
r 31
Dec
embe
r 31
Dec
embe
r 31
Dec
embe
r 31
Dec
embe
r 31
Dec
embe
r 31
Dec
embe
r 31
Dec
embe
r 31
Dec
embe
r 31
Dec
embe
r 31
Dec
embe
r 31
Dec
embe
r
2018
20
17
2018
20
17
2018
20
17
2018
20
17
2018
20
17
2018
20
17
14.1
Sale
s
- Ext
erna
l 10
5,74
0
159,
748
1,
077
,798
4
19,2
68
2
84,7
29
229
,90
2
13,4
81
13,7
94
472
-
1,
482,
220
8
22,7
12
- I
nter
segm
ent
82,
742
5
3,72
3
23,
143
14
,771
-
-
1,
290
-
-
-
188,
482
2
13,4
71
1,10
0,9
41
434
,039
2
84,7
29
229
,90
2
14,7
71
13,7
94
472
-
1,
482,
220
8
22,7
12
14.2
Se
gmen
t exp
ense
s
C
ost o
f Sal
es
- E
xter
nal
330
,685
5
13,7
62
727
,748
3
90,4
98
287
,731
2
20,5
23
9,0
00
4
,325
4
38
40
4
1,35
5,60
2
1,12
9,51
2
- Int
erse
gmen
t 2
3,15
1 14
,776
8
2,73
4
53,
718
-
-
1,
290
-
-
-
353
,836
5
28,5
38
810
,482
4
44,2
16
287
,731
2
20,5
23
10,2
90
4,3
25
438
4
04
1,
355,
602
1,
129,
512
G
ross
pro
fit /
(loss
) (1
65,
354)
(3
15,0
67)
290
,459
(1
0,17
7)
(3,0
02)
9
,379
4
,481
9
,469
3
4
(40
4)
126,
618
(3
06,
800
)
-
Adm
inis
trat
ive
expe
nses
(9
,163)
(1
8,13
7)
(53,
530
) (3
6,87
7)
(8,0
80)
(7,3
58)
(30
5)
(320
) (2
3)
-
(71,1
01)
(6
2,69
2)
- D
istr
ibut
ion
and
selli
ng e
xpen
ses
(1,6
72)
(1,2
22)
(64,
222)
(2
6,24
5)
(460
) (3
35)
-
-
-
-
(66,
354)
(2
7,80
2)
(10
,835
) (1
9,35
9)
(117
,752
) (6
3,12
2)
(8,5
40)
(7,6
93)
(30
5)
(320
) (2
3)
-
(137
,455
) (9
0,4
94)
Se
gmen
t res
ults
(1
76,18
9)
(334
,426
) 17
2,70
7
(73,
299)
(1
1,542
) 1,
686
4
,176
9
,149
11
(4
04)
(1
0,8
37)
(397
,294
)
O
ther
ope
ratin
g ex
pens
es
(23,
933)
(2
2,78
2)
Oth
er o
pera
ting
inco
me
-
9
,960
2
2,49
3
O
pera
ting
loss
(2
4,81
0)
(397
,583
)
Fi
nanc
e co
sts
(73,
229)
(5
0,0
33)
Sh
are
of p
rofit
from
equ
ity a
ccou
nted
inve
stm
ent
59,
880
8
1,399
Lo
ss b
efor
e ta
xatio
n
(3
8,15
9)
(36
6,21
7)
Ta
xatio
n
-C
ompa
ny
5,4
95
5
,235
-Ass
ocia
tes
(35,
544)
(2
9,35
3)
(30
,049
) (2
4,11
8)
Lo
ss fo
r th
e pe
riod
(6
8,20
8)
(390
,335
) 14
. B
usin
ess
segm
ents
info
rmat
ion
(Rup
ees
in th
ousa
nd)
14.3
In
ter
- seg
men
t sal
es a
nd p
urch
ases
Inte
r - s
egm
ent s
ales
and
pur
chas
es h
ave
been
elim
inat
ed fr
om to
tal f
igur
es.

Condensed Interim Report 1Q 2019 27
Segment assets Segment liabilities
31 December 30 September 31 December 30 September 2018 2018 2018 2018 (Un-audited) (Audited) (Un-audited) (Audited) (Rupees in thousand)14.4 Segment assets and liabilities Sugar 7,610,043 6,854,607 3,238,839 3,351,611 Bio Fuel 2,503,937 2,865,990 1,649,594 1,698,395 Textile 474,995 392,638 131,999 109,370 Farms 819,748 694,905 14,570 14,570 Others 29 395 600 600 Unallocated 2,676,765 3,498,596 439,023 449,714 14,085,515 14,307,132 5,474,625 5,624,260
14.5 Geographical Information 14.5.1 Segment revenue from external customers by geographical areas is as follows:
December December 2018 2017 (Rupees in thousand)
Export sales - Europe 908,914 1,588 Export sales - Asia 117,560 384,153 Local sales 455,746 436,971 1,482,220 822,712 14.5.2 All non current assets of the Company were located and operated in Pakistan.
15. Other income Income from financial assets Dividend income 180 405 Return on bank deposits 53 26
233 431 Income from non-financial assets Scrap sales 387 2,143 Agricultural income 1,080 1,632 Profit on sale of property, plant and equipment 2,565 - Liabilities written back - 13,186 Rental income 4,267 4,534 Others 1,428 567
9,727 22,062 9,960 22,493
Dividend income is received from the following: Related party: Crescent Steel and Allied Products Limited 180 405

28
16. Fair value is the price that would be received to sell an asset or paid to transfer a liability in an orderly transaction between market participants at the measurement date.
Underlying the definition of fair value is the presumption that the Company is a going concern
and there is no intention or requirement to curtail materially the scale of its operations or to undertake a transaction on adverse terms.
A financial instrument is regarded as quoted in an active market if quoted prices are readily and
regularly available from an exchange dealer, broker, industry group, pricing service, or regulatory agency, and those prices represent actual and regularly occurring market transactions on an arm’s length basis.
IFRS 13 ‘Fair Value Measurement’ requires the Company to classify fair value measurements and
fair value hierarchy that reflects the significance of the inputs used in making the measurements of fair value hierarchy has the following levels:
- Quoted prices (unadjusted) in active markets for identical assets or liabilities (Level 1) - Inputs other than quoted prices included within level 1 that are observable for the asset
either directly (that is, derived from prices) (Level 2) - Inputs for the asset or liability that are not based on observable market data (that is,
unadjusted) inputs (Level 3) Transfer between levels of the fair value hierarchy are recognized at the end of the reporting
period during which the changes have occurred. The following table shows the carrying amounts and fair values of financial assets and financial
liabilities, including their levels in the fair value hierarchy. It does not include fair value information for financial assets and financial liabilities not measured at fair value if the carrying amount is a reasonable approximation of fair value.

Condensed Interim Report 1Q 2019 29
Car
ryin
g am
ount
Fai
r va
lue
Ava
ilabl
e
Trad
e an
d C
ash
and
Oth
er
for
ot
her
cash
fin
anci
al
sale
re
ceiv
able
s eq
uiva
lent
s lia
bilit
ies
Tota
l Le
vel 1
Le
vel 2
Le
vel 3
To
tal
N
ote
- -
- - -
- - -
- - -
- - -
- - -
- - -
- - -
- - -
- - -
- - -
- - -
- - R
upee
s in
thou
sand
s - -
- - -
- - -
- - -
- - -
- - -
- - -
- - -
- - -
- - -
- - -
- - -
- -
31 D
ecem
ber
2018
Fina
ncia
l ass
ets
- mea
sure
d at
fair
val
ue
Av
aila
ble
for
sale
11
10
,00
1 -
-
-
10
,00
1 10
,00
1 -
-
10
,00
1 B
iolo
gica
l ass
ets
-
2
9,79
4
-
-
29,
794
-
11
,738
18
,056
2
9,79
4
10,0
01
29,
794
-
-
3
9,79
5
10,0
01
11,7
38
18,0
56
39,
795
Fina
ncia
l ass
ets
- not
mea
sure
d at
fair
val
ue
Long
term
dep
osits
-
33,
986
-
-
3
3,98
6
-
-
-
-
Trad
e de
bts
-
2
83,10
6
-
-
283
,106
-
-
-
-
Lo
ans
, Adv
ance
s, de
posit
s, pr
epay
men
ts a
nd o
ther
rece
ivab
les
-
2
4,46
0
-
-
24,
460
-
-
-
-
C
ash
and
Ban
k ba
lanc
es
13
-
-
94,
097
-
9
4,0
97
-
-
-
-
-
341
,552
9
4,0
97
-
435
,648
-
-
-
-
Fi
nanc
ial l
iabi
litie
s - m
easu
red
at fa
ir v
alue
-
-
-
-
-
-
-
-
-
Fina
ncia
l lia
bilit
ies
- not
mea
sure
d at
fair
val
ue
Long
term
loan
s
7 -
-
-
5
01,3
25
50
1,325
-
5
01,3
25
-
50
1,325
Sh
ort t
erm
bor
row
ings
8
-
-
-
2,17
7,078
2
,177,0
78
-
2,17
7,078
-
2
,177,0
78
Trad
e an
d ot
her
paya
bles
-
-
-
937
,415
9
37,4
15
-
-
-
-
Acc
rued
fina
nce
cost
-
-
-
59,
373
5
9,37
3
-
-
-
-
-
-
-
3,6
75,19
1 3
,675
,191
-
2,6
78,4
03
-
2
,678
,40
3

30
December December 2018 2017 17. Loss per share - basic and diluted i-Profit / (Loss) attributable to ordinary share holders: Loss for the period Rupees (68,207,754) (390,335,000) ii-Weighted-average number of ordinary shares: Weighted average number of shares Number 125,000,000 117,113,835 Loss per share Rupees (0.55) (3.33) 17.1 No figure for diluted earnings per share has been presented as the Company has not issued
any instruments carrying options which would have an impact on earnings per share when exercised.
December December 2018 2017 (Rupees in thousand)18. Cash generated from operating activities Loss before taxation (38,159) (366,217) Adjustment for depreciation/amortization of: - property, plant and equipment 153,700 123,792 - intangible assets - - Liabilities no longer payable written back - (13,186) Gain on sale of property, plant and equipment (2,565) - Interest from bank deposits (54) (26) Dividend income (180) (405) Net (income) / loss on biological assets 1,982 (2,060) Share of profit from associates (59,880) (81,399) Finance cost 73,229 50,033
166,233 76,749 Profit / (loss) before working capital changes 128,075 (289,468) Effect on cash flow due to working capital changes: Increase in stores spare parts and loose tools (79,467) (54,670) Decrease in stock in trade 410,246 338,313 (Increase) / decrease in biological assets - net (502) 3,493 (Increase) / decrease in trade debts (243,675) 116,007 Decrease in loans, advances, prepayments and other receivables 101,133 29,975 (Decrease) / increase in trade and other payables (36,666) 272,937
151,068 706,055
Cash generated from operating activities 279,143 416,587

Condensed Interim Report 1Q 2019 31
19. Related Party Disclosures
The related parties comprise subsidiaries, associated undertakings, other related group companies, directors of the Company, key management personnel and post employment benefit plans. The Company in the normal course of business carries out transactions with various related parties. Significant transactions with related parties are as follows:
Name of Party Relationship Basis of December December Relationship 2018 2017 (Rupees in thousand) Crescent Steel & Allied Related Party Associate due to shareholding Products Limited by CSAPL in SL of 21.93% (2017: 21.93%) Purchase of goods 1,170 582 Salary expense and other common 698 1,349 Dividend income 180 405 Shakarganj Energy (Private) Limited Related Party Associate due to CSAPL Common expenses 745 4,023 Shakarganj Engineering (Division of CSAPL) Related Party Associate due to CSAPL Purchase of goods - 140 Crescent Hadeed (Private) Limited associated Related Party Associate due to CSAPL and undertaking of CSAPL Common Directorship Rendering of services 185 - Premier Insurance Limited Related Party Common directorship Insurance expenses 2,198 2,275 Shakarganj Food Related Party Common CEO - 52.39% (2017: 49.24%) Products Limited of shareholding in associate. Sale of goods 66,234 13,211 Salary expense and other common 524 657 Post employment Related Party Provident Fund,Pension Fund, benefit plans Gratuity Fund Expense charged in respect of 5,878 5,127 retirement benefit plans Transactions with gratuity and pension fund account - Funds received 228,280 75,350 - Funds repaid 228,280 75,350 - Markup expense 10,569 2,864

32
20. Date of authorization of issue This condensed interim financial information was authorized for issue on 28 January 2019 by
the board of directors of the Company. 21. Events after the balance sheet date There are no subsequent events occurring after balance sheet date.
Chief Executive Director Chief Financial Officer

Condensed Interim Report 1Q 2019 33

34

Shakarganj LimitedExecutive Floor, IT Tower, 73 E 1 Hali Road, Gulberg III, Lahore, PakistanTelephone: (042) 111 111 765Fax: (042) 3578 3811