Embed Size (px)
Citation preview
INTERIM FINANCIAL REPORT FOR THE SIX MONTHS ENDED 31 DECEMBER 2014 ISSUED 25 FEBRUARY 2015
For
per
sona
l use
onl
y
Ausdrill Limited ABN 95 009 211 474
ASX Half-year information - 31 December 2014
Lodged with the ASX under Listing Rule 4.2A.This information should be read in conjunction with the30 June 2014 Annual report
ContentsPage
Results for Announcement to the Market 3Half-year financial report 4
For
per
sona
l use
onl
y

Ausdrill LimitedFor the-half year ended 31 December 2014
Results for announcement to the market
$'000Revenue for ordinary activities Down 2.2% to 414,665
Loss from continuing ordinary activities after taxattributable to members Down 1,326.8% to (177,390)
Net loss for the period attributable to members Down 1,326.8% to (177,390)
Dividends Amount per security Franked amount per securityInterim dividend (cents) 1.0 1.0
Previous corresponding period (cents) 2.5 2.5
Payment date of dividend 31 March 2015
Record date for determining entitlements to the interim dividend 20 March 2015
Dividend reinvestment plan
The Ausdrill Limited Dividend Reinvestment Plan (DRP) is not currently in operation following the decision on 19September 2013 of the Board of Ausdrill Limited to suspend the DRP until further notice.
Net tangible assets per share
31 December2014
Cents
31 December2013
Cents
Net tangible asset backing per ordinary share 180.42 241.43
For
per
sona
l use
onl
y
Ausdrill Limited ABN 95 009 211 474
Interim financial report - 31 December 2014
ContentsPage
Directors' report 5Auditor's Independence Declaration 12Financial statements
Consolidated statement of comprehensive income 13Consolidated statement of financial position 14Consolidated statement of changes in equity 15Consolidated statement of cash flows 16Notes to the consolidated financial statements 17
Directors' declaration 32Independent auditor's review report to the members 33
This interim financial report does not include all the notes of the type normally included in an annual financial report.Accordingly, this report is to be read in conjunction with the annual report for the year ended 30 June 2014 and any publicannouncements made by Ausdrill Limited during the interim reporting period in accordance with the continuous disclosurerequirements of the Corporations Act 2011.
4
For
per
sona
l use
onl
y
Ausdrill Limited Directors' report
31 December 2014
5
Directors' report Your directors present their report on the consolidated entity consisting of Ausdrill Limited and the entities it controlled at
the end of, or during, the half-year ended 31 December 2014.
Directors
The following persons were directors of Ausdrill Limited during the whole of the half-year and up to the date of this report,
except for as noted below:
Terence Edward O'Connor AM QC (Chairman)
Ronald George Sayers (Managing Director)
Terrence John Strapp
Donald James Argent
Mark Anthony Connelly
Mark Andrew Hine
Wallace Macarthur King
Mr Wallace Macarthur King AO (Deputy Chairman) was a director from the beginning of the financial period until his
resignation on 28 October 2014.
Mark Andrew Hine was appointed as director on 24 February 2015.
Review of operations
Key points:
Sales Revenue down 2.3% from $423.4m to $413.6m
EBITDA down 37.2% from $94.1m to $59.1m
EBIT down 63.1% from $40.5m to $15.0m
Operating profit after tax (excluding impairment expense) up 3.7% to $19.9 million
Impairment expense of $197.3m (no tax recognised)
Profit attributable to Ausdrill down from $14.5m to a loss of $177.4m
Basic earnings per share down from 4.63 cents per share to a loss of 56.81 cents per share
Interim dividend of 1.0 cent per share, fully franked
First half continues to be impacted by lower level of demand for services and competitive environment
Overview
As a diversified mining services company, Ausdrill Limited (ASX: ASL) experienced challenging market conditions during the
six months to 31 December 2014 as a result of a number of factors, including falling commodity prices and adverse weather
conditions in key operating regions.
The Company has responded to these challenges by reducing capital expenditure and paying down debt, placing Ausdrill in
the best possible position to capitalise on the inevitable turnaround in the mining industry.
For
per
sona
l use
onl
y

Ausdrill Limited Directors' report
31 December 2014 (continued)
6
Ausdrill has reported a net attributable loss of $177.4 million for the half year to 31 December 2014. The Board has
declared an interim dividend of 1.0 cent per share, fully franked, payable on 31 March 2015.
The results for the half are disappointing and reflect the continuation of a challenging environment for the resources
industry which are expected to continue for the remainder of the year with opportunities for improvements in selected
markets expected later this year.
The key challenges that have given rise to the weaker performance are as follows:
Mining Services Australia – in recent months the price of iron ore, which is one of the key commodities for our
clients, has fallen materially. This has impacted on Ausdrill with Western Desert Resources going into
administration, resulting in a bad debt provision of $7.5 million plus the loss of future revenue from the loss of the
drill and blast and explosive supply contracts. The drill and blast services at BHPB were in-sourced from
November 2014. Other areas of its business (including waterwell drilling and equipment hire) have also been
impacted due to the reduction in spend by clients as a result of lower iron ore prices. Ausdrill was also advised
that its contract for drill and blast services at the Edna May Gold Mine would conclude earlier than expected in
December 2014.
Energy Drilling Australia – the expectation for the energy drilling business was that a break-even position would
be achieved in FY2015 through better utilisation of the rig fleet. Whilst significant achievements have been made
in getting the division’s new 500,000lb rig to work, delays are being experienced in achieving continuity of work
for the remaining rigs.
Contract Mining Africa – Ausdrill’s contract mining business in West Africa has underperformed in the first quarter
as a result of higher than expected rainfall and pit flooding which affected profitability on certain sites. In
addition, mining volumes have been adjusted where clients have advised that projects are to be re-optimised as a
result of the lower US dollar gold price. Specifically, forecast revenues were adversely impacted by the deferral of
mining of the Stage 2 cutback at the Syama sulphide open pit.
Although Guinea, one of the West African countries Ausdrill operates in, has been substantially impacted by the
Ebola virus, to date Ausdrill operations have not been impacted in any significant way as a result of the virus, and
measures are in place to monitor the situation and safeguard personnel.
Ausdrill remains positive on the outlook in Africa and is actively tendering for further work which, if successful,
could substantially improve the earnings of the business.
During the period Ausdrill continued its strategy of deleveraging the business and managed to restrict net capital
expenditure to $9.9 million whilst paying down debt of $56.8 million. Net cash flow from operations was sound at $76.9
million which was higher than the previous corresponding period of $65.7 million. Ausdrill also successfully refinanced its
secured debt facility by reducing the facility amount from $300 million to $125 million, amending the debt coverage ratio to
only include secured debt and to extend the term to March 2018.
As a result, Ausdrill remains well positioned with a strong level of undrawn liquidity to underpin the Group’s ongoing
funding requirements in both Australia and Africa.
For
per
sona
l use
onl
y
Ausdrill Limited Directors' report
31 December 2014 (continued)
7
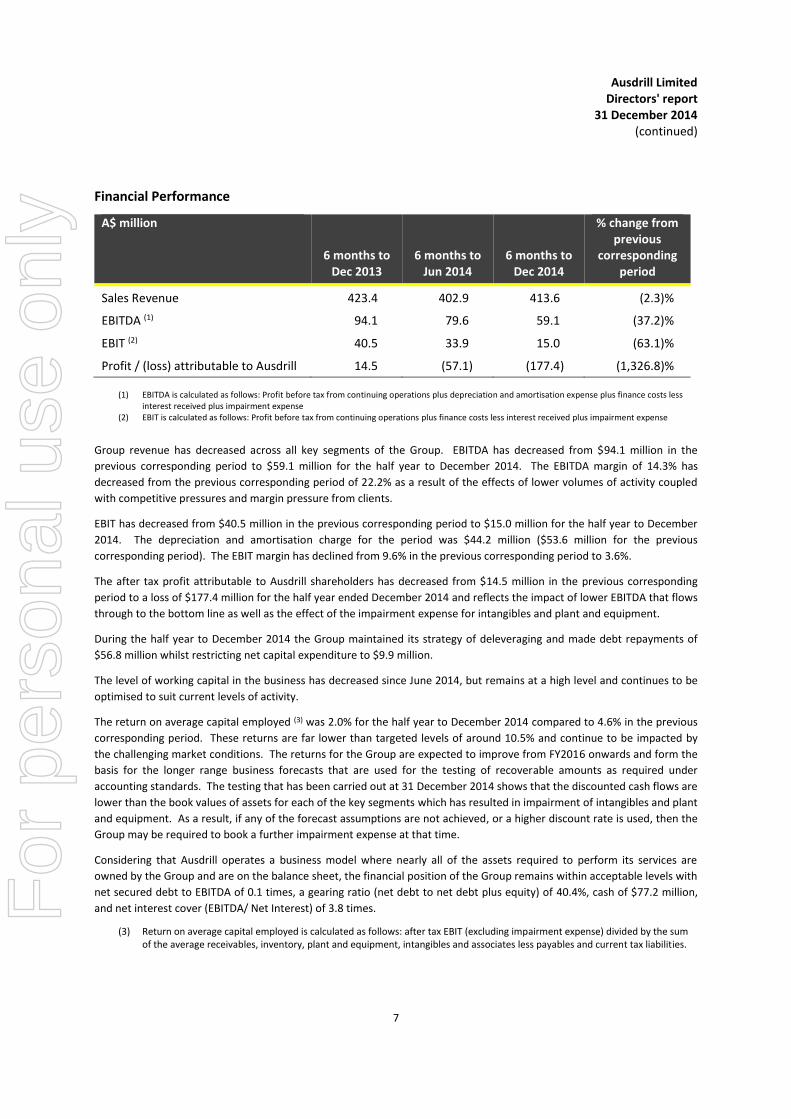
Financial Performance
A$ million
6 months to Dec 2013
6 months to Jun 2014
6 months to Dec 2014
% change from previous
corresponding period
Sales Revenue 423.4 402.9 413.6 (2.3)%
EBITDA (1) 94.1 79.6 59.1 (37.2)%
EBIT (2) 40.5 33.9 15.0 (63.1)%
Profit / (loss) attributable to Ausdrill 14.5 (57.1) (177.4) (1,326.8)%
(1) EBITDA is calculated as follows: Profit before tax from continuing operations plus depreciation and amortisation expense plus finance costs less interest received plus impairment expense
(2) EBIT is calculated as follows: Profit before tax from continuing operations plus finance costs less interest received plus impairment expense Group revenue has decreased across all key segments of the Group. EBITDA has decreased from $94.1 million in the
previous corresponding period to $59.1 million for the half year to December 2014. The EBITDA margin of 14.3% has
decreased from the previous corresponding period of 22.2% as a result of the effects of lower volumes of activity coupled
with competitive pressures and margin pressure from clients.
EBIT has decreased from $40.5 million in the previous corresponding period to $15.0 million for the half year to December
2014. The depreciation and amortisation charge for the period was $44.2 million ($53.6 million for the previous
corresponding period). The EBIT margin has declined from 9.6% in the previous corresponding period to 3.6%.
The after tax profit attributable to Ausdrill shareholders has decreased from $14.5 million in the previous corresponding
period to a loss of $177.4 million for the half year ended December 2014 and reflects the impact of lower EBITDA that flows
through to the bottom line as well as the effect of the impairment expense for intangibles and plant and equipment.
During the half year to December 2014 the Group maintained its strategy of deleveraging and made debt repayments of
$56.8 million whilst restricting net capital expenditure to $9.9 million.
The level of working capital in the business has decreased since June 2014, but remains at a high level and continues to be
optimised to suit current levels of activity.
The return on average capital employed (3) was 2.0% for the half year to December 2014 compared to 4.6% in the previous
corresponding period. These returns are far lower than targeted levels of around 10.5% and continue to be impacted by
the challenging market conditions. The returns for the Group are expected to improve from FY2016 onwards and form the
basis for the longer range business forecasts that are used for the testing of recoverable amounts as required under
accounting standards. The testing that has been carried out at 31 December 2014 shows that the discounted cash flows are
lower than the book values of assets for each of the key segments which has resulted in impairment of intangibles and plant
and equipment. As a result, if any of the forecast assumptions are not achieved, or a higher discount rate is used, then the
Group may be required to book a further impairment expense at that time.
Considering that Ausdrill operates a business model where nearly all of the assets required to perform its services are
owned by the Group and are on the balance sheet, the financial position of the Group remains within acceptable levels with
net secured debt to EBITDA of 0.1 times, a gearing ratio (net debt to net debt plus equity) of 40.4%, cash of $77.2 million,
and net interest cover (EBITDA/ Net Interest) of 3.8 times.
(3) Return on average capital employed is calculated as follows: after tax EBIT (excluding impairment expense) divided by the sum of the average receivables, inventory, plant and equipment, intangibles and associates less payables and current tax liabilities.
For
per
sona
l use
onl
y
Ausdrill Limited Directors' report
31 December 2014 (continued)
8
The Company’s net tangible asset position has decreased from $2.41 per share at 31 December 2013 to $1.80 per share at
31 December 2014.
The decrease in business levels has unfortunately led to a reduction in staff from 4,536 at 31 December 2013 to 4,477 at 31
December 2014.
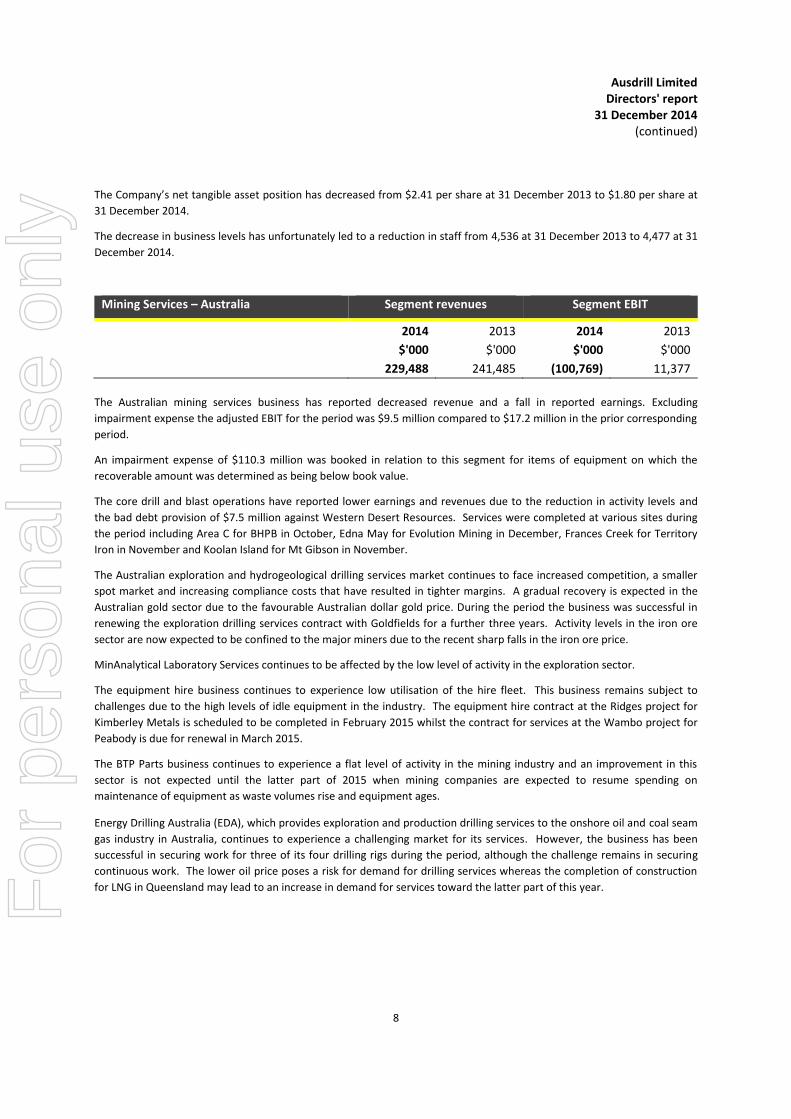
Mining Services – Australia Segment revenues Segment EBIT
2014 2013 2014 2013
$'000 $'000 $'000 $'000
229,488 241,485 (100,769) 11,377
The Australian mining services business has reported decreased revenue and a fall in reported earnings. Excluding
impairment expense the adjusted EBIT for the period was $9.5 million compared to $17.2 million in the prior corresponding
period.
An impairment expense of $110.3 million was booked in relation to this segment for items of equipment on which the
recoverable amount was determined as being below book value.
The core drill and blast operations have reported lower earnings and revenues due to the reduction in activity levels and
the bad debt provision of $7.5 million against Western Desert Resources. Services were completed at various sites during
the period including Area C for BHPB in October, Edna May for Evolution Mining in December, Frances Creek for Territory
Iron in November and Koolan Island for Mt Gibson in November.
The Australian exploration and hydrogeological drilling services market continues to face increased competition, a smaller
spot market and increasing compliance costs that have resulted in tighter margins. A gradual recovery is expected in the
Australian gold sector due to the favourable Australian dollar gold price. During the period the business was successful in
renewing the exploration drilling services contract with Goldfields for a further three years. Activity levels in the iron ore
sector are now expected to be confined to the major miners due to the recent sharp falls in the iron ore price.
MinAnalytical Laboratory Services continues to be affected by the low level of activity in the exploration sector.
The equipment hire business continues to experience low utilisation of the hire fleet. This business remains subject to
challenges due to the high levels of idle equipment in the industry. The equipment hire contract at the Ridges project for
Kimberley Metals is scheduled to be completed in February 2015 whilst the contract for services at the Wambo project for
Peabody is due for renewal in March 2015.
The BTP Parts business continues to experience a flat level of activity in the mining industry and an improvement in this
sector is not expected until the latter part of 2015 when mining companies are expected to resume spending on
maintenance of equipment as waste volumes rise and equipment ages.
Energy Drilling Australia (EDA), which provides exploration and production drilling services to the onshore oil and coal seam
gas industry in Australia, continues to experience a challenging market for its services. However, the business has been
successful in securing work for three of its four drilling rigs during the period, although the challenge remains in securing
continuous work. The lower oil price poses a risk for demand for drilling services whereas the completion of construction
for LNG in Queensland may lead to an increase in demand for services toward the latter part of this year.
For
per
sona
l use
onl
y
Ausdrill Limited Directors' report
31 December 2014 (continued)
9
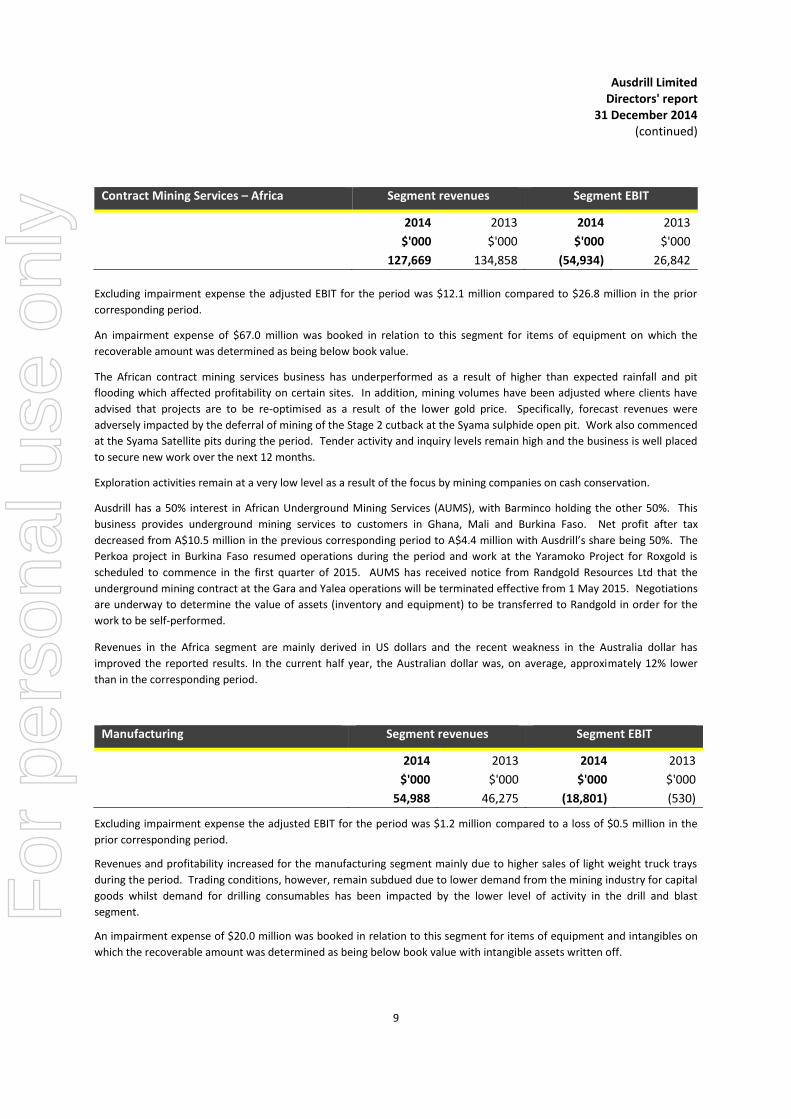
Contract Mining Services – Africa Segment revenues Segment EBIT
2014 2013 2014 2013
$'000 $'000 $'000 $'000
127,669 134,858 (54,934) 26,842
Excluding impairment expense the adjusted EBIT for the period was $12.1 million compared to $26.8 million in the prior
corresponding period.
An impairment expense of $67.0 million was booked in relation to this segment for items of equipment on which the
recoverable amount was determined as being below book value.
The African contract mining services business has underperformed as a result of higher than expected rainfall and pit
flooding which affected profitability on certain sites. In addition, mining volumes have been adjusted where clients have
advised that projects are to be re-optimised as a result of the lower gold price. Specifically, forecast revenues were
adversely impacted by the deferral of mining of the Stage 2 cutback at the Syama sulphide open pit. Work also commenced
at the Syama Satellite pits during the period. Tender activity and inquiry levels remain high and the business is well placed
to secure new work over the next 12 months.
Exploration activities remain at a very low level as a result of the focus by mining companies on cash conservation.
Ausdrill has a 50% interest in African Underground Mining Services (AUMS), with Barminco holding the other 50%. This
business provides underground mining services to customers in Ghana, Mali and Burkina Faso. Net profit after tax
decreased from A$10.5 million in the previous corresponding period to A$4.4 million with Ausdrill’s share being 50%. The
Perkoa project in Burkina Faso resumed operations during the period and work at the Yaramoko Project for Roxgold is
scheduled to commence in the first quarter of 2015. AUMS has received notice from Randgold Resources Ltd that the
underground mining contract at the Gara and Yalea operations will be terminated effective from 1 May 2015. Negotiations
are underway to determine the value of assets (inventory and equipment) to be transferred to Randgold in order for the
work to be self-performed.
Revenues in the Africa segment are mainly derived in US dollars and the recent weakness in the Australia dollar has
improved the reported results. In the current half year, the Australian dollar was, on average, approximately 12% lower
than in the corresponding period.
Manufacturing Segment revenues Segment EBIT
2014 2013 2014 2013
$'000 $'000 $'000 $'000
54,988 46,275 (18,801) (530)
Excluding impairment expense the adjusted EBIT for the period was $1.2 million compared to a loss of $0.5 million in the
prior corresponding period.
Revenues and profitability increased for the manufacturing segment mainly due to higher sales of light weight truck trays
during the period. Trading conditions, however, remain subdued due to lower demand from the mining industry for capital
goods whilst demand for drilling consumables has been impacted by the lower level of activity in the drill and blast
segment.
An impairment expense of $20.0 million was booked in relation to this segment for items of equipment and intangibles on
which the recoverable amount was determined as being below book value with intangible assets written off.
For
per
sona
l use
onl
y
Ausdrill Limited Directors' report
31 December 2014 (continued)
10
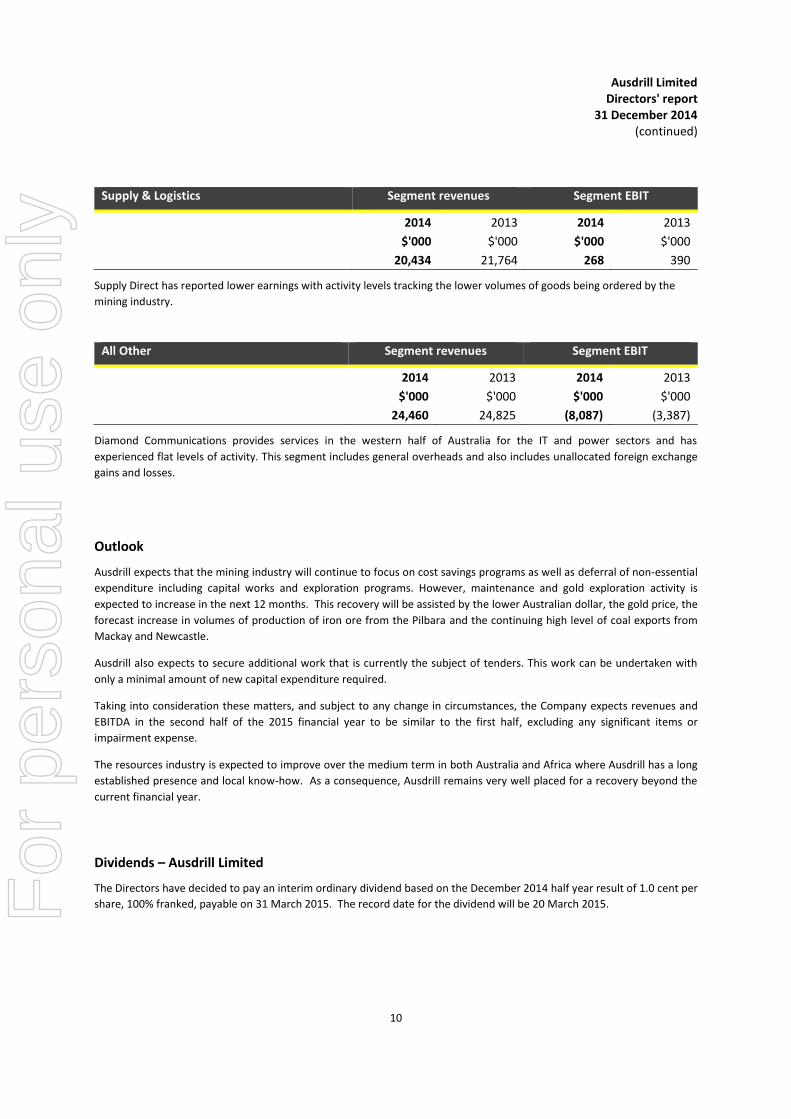
Supply & Logistics Segment revenues Segment EBIT
2014 2013 2014 2013
$'000 $'000 $'000 $'000
20,434 21,764 268 390
Supply Direct has reported lower earnings with activity levels tracking the lower volumes of goods being ordered by the
mining industry.
All Other Segment revenues Segment EBIT
2014 2013 2014 2013
$'000 $'000 $'000 $'000
24,460 24,825 (8,087) (3,387)
Diamond Communications provides services in the western half of Australia for the IT and power sectors and has
experienced flat levels of activity. This segment includes general overheads and also includes unallocated foreign exchange
gains and losses.
Outlook
Ausdrill expects that the mining industry will continue to focus on cost savings programs as well as deferral of non-essential
expenditure including capital works and exploration programs. However, maintenance and gold exploration activity is
expected to increase in the next 12 months. This recovery will be assisted by the lower Australian dollar, the gold price, the
forecast increase in volumes of production of iron ore from the Pilbara and the continuing high level of coal exports from
Mackay and Newcastle.
Ausdrill also expects to secure additional work that is currently the subject of tenders. This work can be undertaken with
only a minimal amount of new capital expenditure required.
Taking into consideration these matters, and subject to any change in circumstances, the Company expects revenues and
EBITDA in the second half of the 2015 financial year to be similar to the first half, excluding any significant items or
impairment expense.
The resources industry is expected to improve over the medium term in both Australia and Africa where Ausdrill has a long
established presence and local know-how. As a consequence, Ausdrill remains very well placed for a recovery beyond the
current financial year.
Dividends – Ausdrill Limited
The Directors have decided to pay an interim ordinary dividend based on the December 2014 half year result of 1.0 cent per
share, 100% franked, payable on 31 March 2015. The record date for the dividend will be 20 March 2015.
For
per
sona
l use
onl
y
Ausdrill Limited Directors' report
31 December 2014 (continued)
11
Auditor’s independence declaration
A copy of the auditor's independence declaration as required under section 307C of the Corporations Act 2001 is set out on
page 12.
Rounding of amounts
The Company is of a kind referred to in Class Order 98/100, issued by the Australian Securities and Investments
Commission, relating to the 'rounding off' of amounts in the directors' report and financial report. Amounts in the directors'
report have been rounded off in accordance with that Class Order to the nearest thousand dollars.
This report is made in accordance with a resolution of directors.
Ronald George Sayers
Managing Director
Perth
25 February 2015
For
per
sona
l use
onl
y

For
per
sona
l use
onl
y
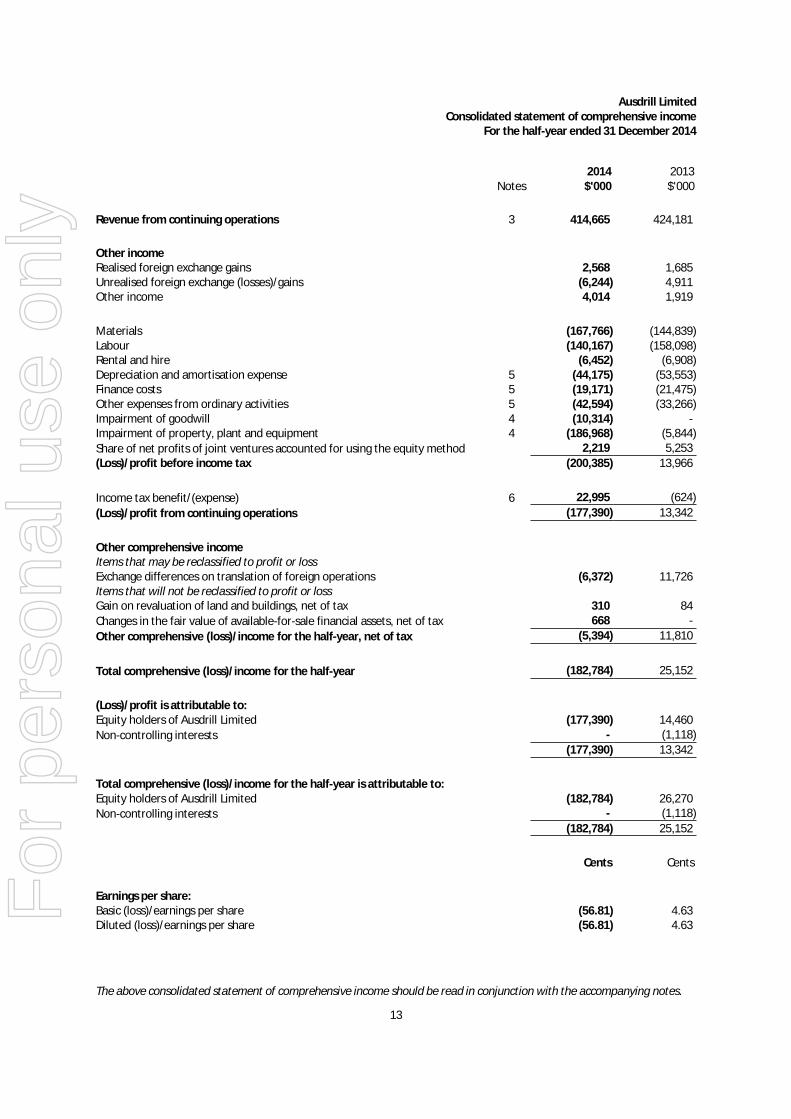
Ausdrill LimitedConsolidated statement of comprehensive income
For the half-year ended 31 December 2014
Notes2014
$'0002013$'000
Revenue from continuing operations 3 414,665 424,181
Other incomeRealised foreign exchange gains 2,568 1,685Unrealised foreign exchange (losses)/gains (6,244) 4,911Other income 4,014 1,919
Materials (167,766) (144,839)Labour (140,167) (158,098)Rental and hire (6,452) (6,908)Depreciation and amortisation expense 5 (44,175) (53,553)Finance costs 5 (19,171) (21,475)Other expenses from ordinary activities 5 (42,594) (33,266)Impairment of goodwill 4 (10,314) -Impairment of property, plant and equipment 4 (186,968) (5,844)
Share of net profits of joint ventures accounted for using the equity method 2,219 5,253
(Loss)/profit before income tax (200,385) 13,966
Income tax benefit/(expense) 6 22,995 (624)
(Loss)/profit from continuing operations (177,390) 13,342
Other comprehensive incomeItems that may be reclassified to profit or lossExchange differences on translation of foreign operations (6,372) 11,726Items that will not be reclassified to profit or lossGain on revaluation of land and buildings, net of tax 310 84
Changes in the fair value of available-for-sale financial assets, net of tax 668 -
Other comprehensive (loss)/income for the half-year, net of tax (5,394) 11,810
Total comprehensive (loss)/income for the half-year (182,784) 25,152
(Loss)/profit is attributable to:Equity holders of Ausdrill Limited (177,390) 14,460
Non-controlling interests - (1,118)
(177,390) 13,342
Total comprehensive (loss)/income for the half-year is attributable to:Equity holders of Ausdrill Limited (182,784) 26,270
Non-controlling interests - (1,118)
(182,784) 25,152
Cents Cents
Earnings per share:Basic (loss)/earnings per share (56.81) 4.63Diluted (loss)/earnings per share (56.81) 4.63
The above consolidated statement of comprehensive income should be read in conjunction with the accompanying notes.
13
For
per
sona
l use
onl
y
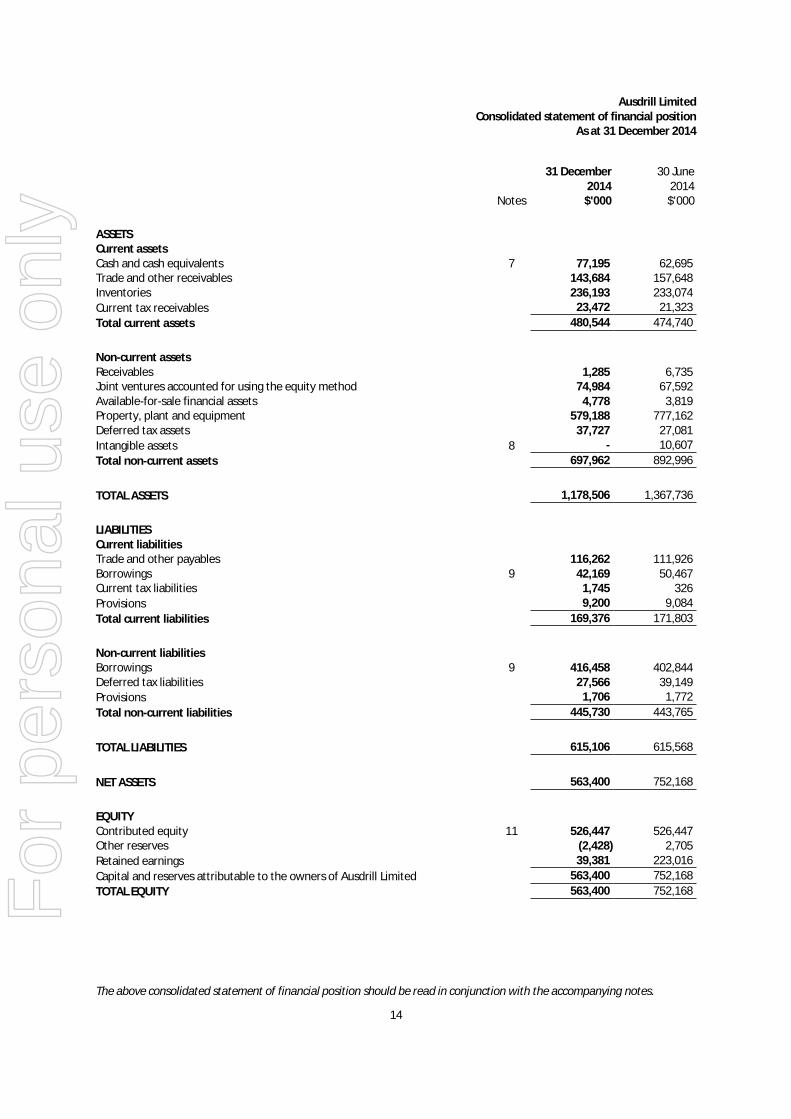
Ausdrill LimitedConsolidated statement of financial position
As at 31 December 2014
Notes
31 December2014
$'000
30 June2014$'000
ASSETSCurrent assetsCash and cash equivalents 7 77,195 62,695Trade and other receivables 143,684 157,648Inventories 236,193 233,074
Current tax receivables 23,472 21,323
Total current assets 480,544 474,740
Non-current assetsReceivables 1,285 6,735Joint ventures accounted for using the equity method 74,984 67,592Available-for-sale financial assets 4,778 3,819Property, plant and equipment 579,188 777,162Deferred tax assets 37,727 27,081
Intangible assets 8 - 10,607
Total non-current assets 697,962 892,996
TOTAL ASSETS 1,178,506 1,367,736
LIABILITIESCurrent liabilitiesTrade and other payables 116,262 111,926Borrowings 9 42,169 50,467Current tax liabilities 1,745 326
Provisions 9,200 9,084
Total current liabilities 169,376 171,803
Non-current liabilitiesBorrowings 9 416,458 402,844Deferred tax liabilities 27,566 39,149
Provisions 1,706 1,772
Total non-current liabilities 445,730 443,765
TOTAL LIABILITIES 615,106 615,568
NET ASSETS 563,400 752,168
EQUITYContributed equity 11 526,447 526,447Other reserves (2,428) 2,705
Retained earnings 39,381 223,016
Capital and reserves attributable to the owners of Ausdrill Limited 563,400 752,168
TOTAL EQUITY 563,400 752,168
The above consolidated statement of financial position should be read in conjunction with the accompanying notes.
14
For
per
sona
l use
onl
y

Ausdrill LimitedConsolidated statement of changes in equity
For the half-year ended 31 December 2014
Attributable to owners ofAusdrill Limited
Notes
Contributedequity$'000
Otherreserves
$'000
Retainedearnings
$'000Total$'000
Non-controlling
interests$'000
Totalequity$'000
Balance at 1 July 2013 526,447 2,329 290,589 819,365 (1,979) 817,386
Profit for the half-year - - 14,460 14,460 (1,118) 13,342
Other comprehensive income - 11,810 - 11,810 - 11,810
Total comprehensive income for thehalf-year - 11,810 14,460 26,270 (1,118) 25,152
Transactions with owners in their capacity asowners:Dividends paid 10 - - (17,175) (17,175) - (17,175)Employee share options - value of employeeservices - 815 - 815 - 815
- 815 (17,175) (16,360) - (16,360)
Balance at 31 December 2013 526,447 14,954 287,874 829,275 (3,097) 826,178
Balance at 1 July 2014 526,447 2,705 223,016 752,168 - 752,168
Loss for the half-year - - (177,390) (177,390) - (177,390)
Other comprehensive loss - (5,394) - (5,394) - (5,394)
Total comprehensive loss for the half-year - (5,394) (177,390) (182,784) - (182,784)
Transactions with owners in their capacity asowners:Dividends paid 10 - - (6,245) (6,245) - (6,245)Shares issued on conversion of employeeshare options, net of transaction costs - 261 - 261 - 261
- 261 (6,245) (5,984) - (5,984)
Balance at 31 December 2014 526,447 (2,428) 39,381 563,400 - 563,400
The above consolidated statement of changes in equity should be read in conjunction with the accompanying notes.
15
For
per
sona
l use
onl
y
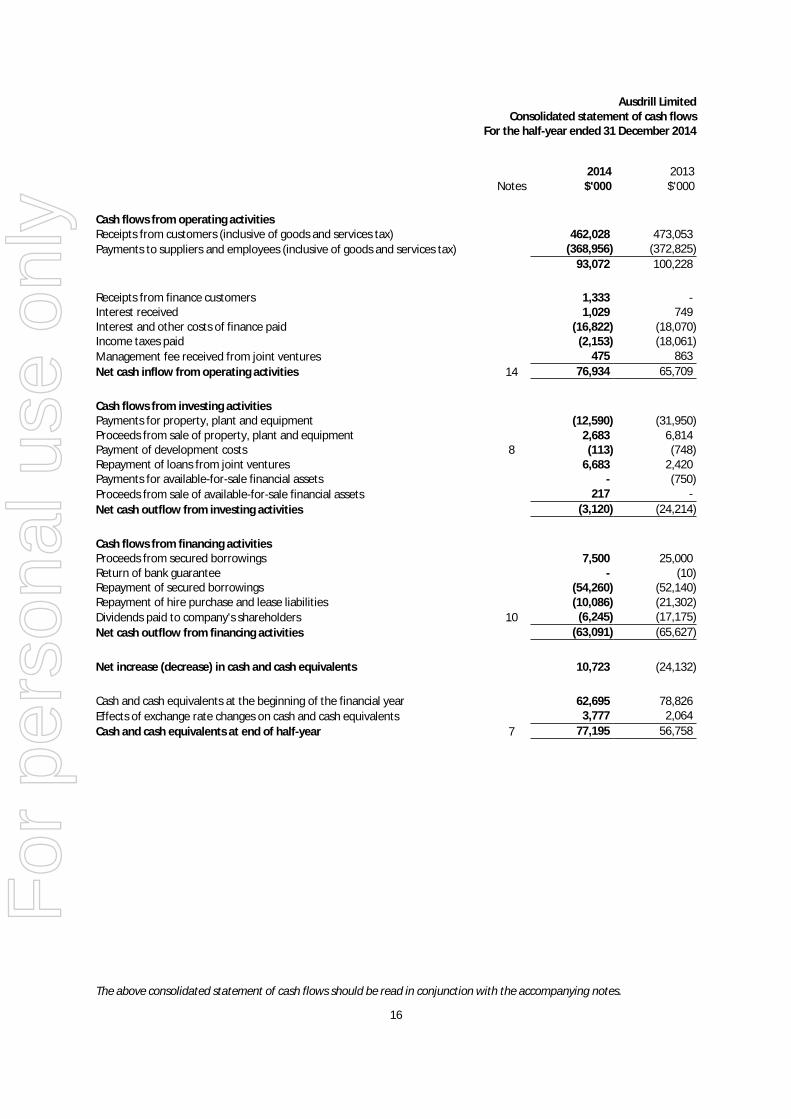
Ausdrill LimitedConsolidated statement of cash flows
For the half-year ended 31 December 2014
Notes2014
$'0002013$'000
Cash flows from operating activitiesReceipts from customers (inclusive of goods and services tax) 462,028 473,053
Payments to suppliers and employees (inclusive of goods and services tax) (368,956) (372,825)
93,072 100,228
Receipts from finance customers 1,333 -Interest received 1,029 749Interest and other costs of finance paid (16,822) (18,070)Income taxes paid (2,153) (18,061)
Management fee received from joint ventures 475 863
Net cash inflow from operating activities 14 76,934 65,709
Cash flows from investing activitiesPayments for property, plant and equipment (12,590) (31,950)Proceeds from sale of property, plant and equipment 2,683 6,814Payment of development costs 8 (113) (748)Repayment of loans from joint ventures 6,683 2,420Payments for available-for-sale financial assets - (750)
Proceeds from sale of available-for-sale financial assets 217 -
Net cash outflow from investing activities (3,120) (24,214)
Cash flows from financing activitiesProceeds from secured borrowings 7,500 25,000Return of bank guarantee - (10)Repayment of secured borrowings (54,260) (52,140)Repayment of hire purchase and lease liabilities (10,086) (21,302)
Dividends paid to company's shareholders 10 (6,245) (17,175)
Net cash outflow from financing activities (63,091) (65,627)
Net increase (decrease) in cash and cash equivalents 10,723 (24,132)
Cash and cash equivalents at the beginning of the financial year 62,695 78,826
Effects of exchange rate changes on cash and cash equivalents 3,777 2,064
Cash and cash equivalents at end of half-year 7 77,195 56,758
The above consolidated statement of cash flows should be read in conjunction with the accompanying notes.
16
For
per
sona
l use
onl
y
Ausdrill LimitedNotes to the consolidated financial statements
31 December 2014
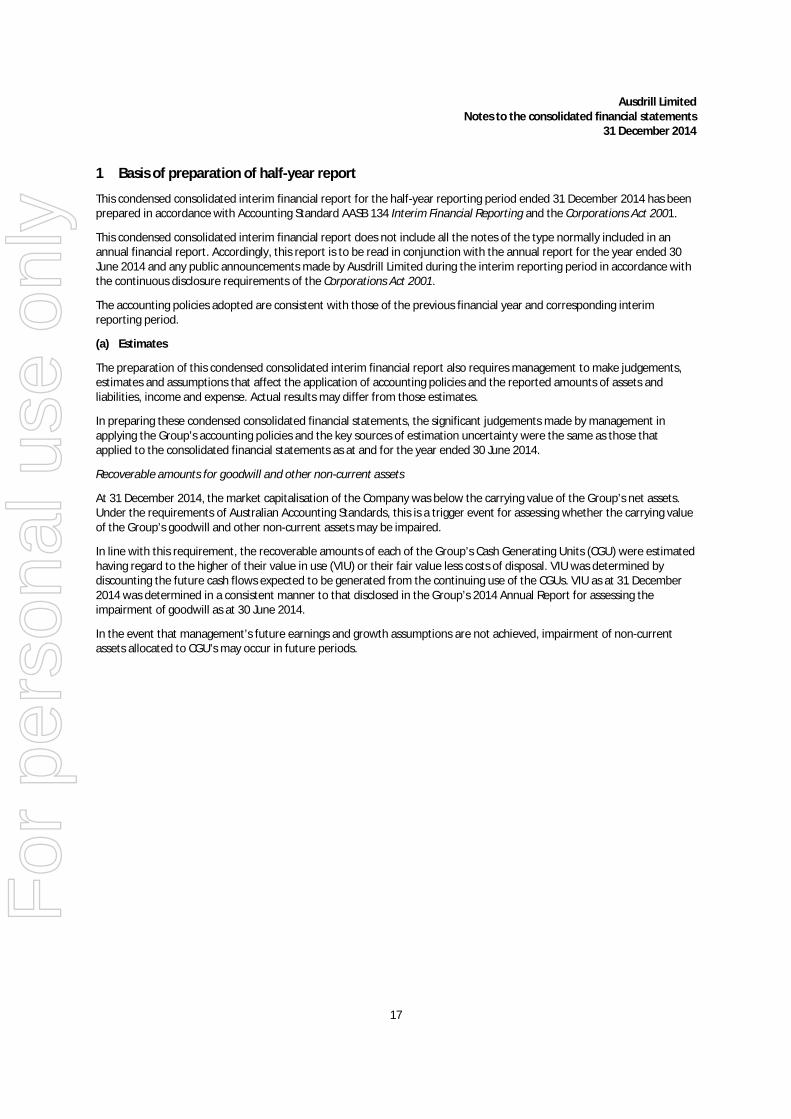
1 Basis of preparation of half-year report
This condensed consolidated interim financial report for the half-year reporting period ended 31 December 2014 has beenprepared in accordance with Accounting Standard AASB 134 Interim Financial Reporting and the Corporations Act 2001.
This condensed consolidated interim financial report does not include all the notes of the type normally included in anannual financial report. Accordingly, this report is to be read in conjunction with the annual report for the year ended 30June 2014 and any public announcements made by Ausdrill Limited during the interim reporting period in accordance withthe continuous disclosure requirements of the Corporations Act 2001.
The accounting policies adopted are consistent with those of the previous financial year and corresponding interimreporting period.
(a) Estimates
The preparation of this condensed consolidated interim financial report also requires management to make judgements,estimates and assumptions that affect the application of accounting policies and the reported amounts of assets andliabilities, income and expense. Actual results may differ from those estimates.
In preparing these condensed consolidated financial statements, the significant judgements made by management inapplying the Group’s accounting policies and the key sources of estimation uncertainty were the same as those thatapplied to the consolidated financial statements as at and for the year ended 30 June 2014.
Recoverable amounts for goodwill and other non-current assets
At 31 December 2014, the market capitalisation of the Company was below the carrying value of the Group’s net assets.Under the requirements of Australian Accounting Standards, this is a trigger event for assessing whether the carrying valueof the Group’s goodwill and other non-current assets may be impaired.
In line with this requirement, the recoverable amounts of each of the Group’s Cash Generating Units (CGU) were estimatedhaving regard to the higher of their value in use (VIU) or their fair value less costs of disposal. VIU was determined bydiscounting the future cash flows expected to be generated from the continuing use of the CGUs. VIU as at 31 December2014 was determined in a consistent manner to that disclosed in the Group’s 2014 Annual Report for assessing theimpairment of goodwill as at 30 June 2014.
In the event that management’s future earnings and growth assumptions are not achieved, impairment of non-currentassets allocated to CGU's may occur in future periods.
17
For
per
sona
l use
onl
y

Ausdrill LimitedNotes to the consolidated financial statements
31 December 2014(continued)
2 Segment information
(a) Description of segments
Management has determined the operating segments based on the internal reports reviewed by the Board that are usedto make strategic decisions. The Board assesses the performance of the operating segments based on revenue, EBIT,EBITDA and profit or loss before tax.
The operating segments are identified by the Board based on the nature of the services provided. The Board considers thebusiness from a geographic perspective, similarity of the services provided and the nature of risks and returns associatedwith each business. The entity is organised into the following divisions by service type:
Mining Services Australia:The provision of mining services including drilling and blasting, in-pit grade control, exploration drilling, earthmoving,waterwell drilling, energy drilling, equipment hire, equipment parts and sales and mineral analysis in Australia.
Contract Mining Services Africa:The provision of mining services including drilling and blasting, in-pit grade control, exploration drilling and earthmoving inAfrica.
Manufacturing:The manufacture of drilling rods and consumables, drill rigs and dump truck tray bodies.
Supply and Logistics:The provision of mining supplies and logistics services.
All other segmentsOperating segments which do not meet the aggregation criteria for the current segments. This segment also includesGroup central functions like treasury, financing and administration.
Intersegment eliminationsRepresents transactions which are eliminated on consolidation.
18
For
per
sona
l use
onl
y

Ausdrill LimitedNotes to the consolidated financial statements
31 December 2014(continued)
2 Segment information (continued)
(b) Segment information provided to the Board
Half-year ended31 December 2014
MiningServices
Australia
ContractMining
ServicesAfrica
#Manu-facturing
*Supply &Logistics
All othersegments
Inter-segment
Eliminations Consolidated$'000 $'000 $'000 $'000 $'000 $'000 $'000
Segment revenueSales to external customers 226,930 127,516 35,495 14,408 9,207 - 413,556
Intersegment sales 2,299 - 19,465 6,001 98 (27,863) -
Total sales revenue 229,229 127,516 54,960 20,409 9,305 (27,863) 413,556
Other revenue 259 153 28 25 15,155 (14,511) 1,109
Segment revenue 229,488 127,669 54,988 20,434 24,460 (42,374) 414,665
Segment EBITDA 33,389 28,806 3,879 306 (7,246) - 59,134Depreciation expense (23,775) (16,740) (2,375) (38) (841) - (43,769)Amortisation expense (101) - (305) - - - (406)Impairment of intangible assets - - (10,314) - - - (10,314)
Impairment of assets (110,282) (67,000) (9,686) - - - (186,968)
Segment EBIT (100,769) (54,934) (18,801) 268 (8,087) - (182,323)Interest income 259 153 28 25 15,155 (14,511) 1,109
Interest expense (9,473) (5,263) (1,887) (138) (16,921) 14,511 (19,171)
Segment result (109,983) (60,044) (20,660) 155 (9,853) - (200,385)
Income tax benefit 22,995
Loss for the half-year (177,390)
Segment assets 1,035,836 552,040 98,177 15,998 480,968 (1,004,513) 1,178,506
Segment liabilities 246,210 251,087 61,720 10,516 838,211 (792,638) 615,106
Other segment information
Investments in joint ventures - 74,984 - - - - 74,984
Share of profit from joint ventures - 2,219 - - - - 2,219
Acquisition of property, plant andequipment, intangibles and othernon-current assets 1,346 9,986 638 27 706 - 12,703
# This segment operates in the Australian region.
* This segment predominantly operates in the African region.
19
For
per
sona
l use
onl
y

Ausdrill LimitedNotes to the consolidated financial statements
31 December 2014(continued)
2 Segment information (continued)
(b) Segment information provided to the Board (continued)
Half-year ended31 December 2013
MiningServices
Australia
ContractMining
ServicesAfrica
#Manu-facturing
*Supply &Logistics
All othersegments
Inter-segment
Eliminations Consolidated$'000 $'000 $'000 $'000 $'000 $'000 $'000
Segment revenueSales to external customers 240,850 134,691 21,991 16,613 9,287 - 423,432
Intersegment sales 439 - 24,254 5,083 32 (29,808) -
Total sales revenue 241,289 134,691 46,245 21,696 9,319 (29,808) 423,432
Other revenue 196 167 30 68 15,506 (15,218) 749
Total segment revenue 241,485 134,858 46,275 21,764 24,825 (45,026) 424,181
Segment EBITDA 49,136 44,514 2,356 453 (2,370) - 94,089Depreciation expense (31,822) (17,672) (2,582) (63) (1,017) - (53,156)Amortisation expense (93) - (304) - - - (397)
Impairment of assets (5,844) - - - - - (5,844)
Segment EBIT 11,377 26,842 (530) 390 (3,387) - 34,692Interest income 196 167 30 68 15,506 (15,218) 749
Interest expense (9,856) (8,396) (1,730) (333) (16,378) 15,218 (21,475)
Segment result 1,717 18,613 (2,230) 125 (4,259) - 13,966
Income tax expense (624)
Profit for the half-year 13,342
Segment assets 1,123,403 577,908 110,906 18,396 634,447 (956,197) 1,508,863
Segment liabilities 253,717 310,740 63,974 13,171 797,971 (756,888) 682,685
Other segment information
Investments in joint ventures - 75,996 - - - - 75,996
Share of profit from joint ventures - 5,253 - - - - 5,253
Acquisition of property, plant andequipment, intangibles and othernon-current assets 25,325 5,938 1,077 7 351 - 32,698
# This segment operates in the Australian region.
* This segment predominantly operates in the African region.
20
For
per
sona
l use
onl
y

Ausdrill LimitedNotes to the consolidated financial statements
31 December 2014(continued)
3 Revenue
31 December2014
$'000
31 December2013$'000
From continuing operationsSales revenueSale of goods 47,192 35,360
Services 366,364 388,072
413,556 423,432
Other revenueInterest - Others 949 569
Interest - Related Parties 160 180
1,109 749
414,665 424,181
4 Individually significant items
The following items are significant to the financial performance of the group, and so are listed separately here.
Note
31 December2014
$'000
31 December2013$'000
Impairment of non-current assetsPlant and equipment 4(a) 186,968 5,844
Impairment of intangible assetsImpairment of goodwill and other intangible assets 4(b) 10,314 -
(a) Impairment of non-current assets
The Company has experienced challenging market conditions during the six months to 31 December 2014 as a result of anumber of factors, including falling commodity prices and adverse weather conditions in key operating regions and reflectthe continuation of a challenging environment for the resources industry which are expected to continue for the remainderof the year.
As a result the Company has made estimates associated with the recoverable amount of its cash generating units (CGU) todetermine whether there was any impairment in relation to their carrying value. Determining a CGU’s recoverable amountwas completed via the following methods:
(a) Assets are firstly considered individually to determine whether there is any impairment related to specific assetsdue to factors such as technical obsolescence, declining market value, physical condition or saleability within areasonable timeframe;
(b) For certain CGU’s the recoverability of its assets is completed via a fair value less costs of disposal calculation;(c) For certain CGU’s the recoverability of its assets is completed via a value in use methodology.
21
For
per
sona
l use
onl
y

Ausdrill LimitedNotes to the consolidated financial statements
31 December 2014(continued)
4 Individually significant items (continued)
(a) Impairment of non-current assets (continued)
The recoverable amount of a CGU is calculated as the higher of its fair value less costs of disposal or its value in use. TheCompany has sourced an external valuation where a fair value less costs of disposal has been adopted. In the instanceswhere this has been adopted, the valuation technique and fair value hierarchy is noted below.
The recoverable amount of a CGU determined by a value in use calculation requires the use of assumptions. Cash flowprojections are calculated using EBITDA, changes in working capital and capital expenditure to get to a “free cash flow”estimate. These projections are based on actual operating results, a Board approved FY15 business plan and subsequentfinancial forecasts prepared by management. Future cash flows are extrapolated by applying conservative growth rates foreach segment and terminal growth rates not exceeding 3%. The methodology is consistent with that used at 30 June 2014.
Key assumptions used for value in use calculations
The calculation of value in use for the CGUs is most sensitive to the following assumptions:a) EBITDA/sales marginsb) Discount ratesc) Growth rates used to extrapolate cash flows beyond the forecast period
EBITDA margin
EBITDA margin is based on management’s best estimate of the CGU’s performance, taking into account past performancewith changes where appropriate for expected market conditions and efficiency improvements.
Working capital has been adjusted, in particular inventory levels, to return to and reflect what would be considered anormal operating level to support the underlying business.
Capital expenditure
Capital expenditure with an emphasis on replacement capital only, has been kept to a minimum as idle machinery willgradually return to work to sustain the assumed levels of activity. The resulting expenditure has been compared against theannual depreciation charge to ensure that it is reasonable.
Growth rate estimates and discount rates
Growth Rate
CGU FY15 FY16 FY17 FY18-FY19Terminal
Year
Post TaxDiscount
Rate
Pre TaxDiscount
Rate
Kalgoorlie & SynegexCGU (35.3%) (10.3-11.3%) 2.0%-3.0% 2.0%-3.0% 2.0%-3.0% 11.1%-11.7%15.7%-16.1%
Ausdrill Northwest(ANW) & Connector CGU (22.7%) 1.1% 24.8%-25.1% 2.0%-3.0% 2.0%-3.0% 11.1%-11.7%15.4%-16.1%
BTP Equipment (BTPE)CGU (32.0%) 0.0% 0.0% 2.0%-3.0% 2.0%-3.0% 11.1%-11.7%16.6%-17.3%
Contract Mining ServicesAfrica (CMSA) CGU 19.4% 8.7% 26.2% 2.0% 2.0% 11.7%-12.3%15.9%-16.7%
Kalgoorlie & Synegex CGU
This CGU is included in the Mining Services Australia (MSA) operating segment. Impairment testing at 31 December 2014resulted in this CGU being impaired. Its estimated recoverable amount was $132,500,000. As a result a plant andequipment impairment charge of $20,000,000 was made.
22
For
per
sona
l use
onl
y

Ausdrill LimitedNotes to the consolidated financial statements
31 December 2014(continued)
4 Individually significant items (continued)
(a) Impairment of non-current assets (continued)
ANW & Connector CGU
This CGU is included in the MSA operating segment. Impairment testing at 31 December 2014 resulted in this CGU beingimpaired. Its estimated recoverable amount was $61,500,000. As a result a plant and equipment impairment charge of$43,000,000 was made.
BTPE CGU
This CGU is included in the MSA operating segment. Impairment testing at 31 December 2014 resulted in this CGU beingimpaired. Its estimated recoverable amount was $46,500,000. As a result a plant and equipment impairment charge of$20,000,000 was made.
Further a review was undertaken of the value of the idle hire equipment of BTP Equipment by testing their carrying valuesagainst the net present value of expected rental streams over the remaining useful lives of the individual assets.Consideration was given to the analysis of the limited observed orderly sales transactions for equipment in the market. Inthe absence of an orderly market, a review was also undertaken of the value of idle equipment with a comparison tomarket values, where available, historical sales, or if new, to current quotes for the same equipment. This review hasresulted in an impairment charge of $12,457,000.
CMSA CGU
This CGU is a reportable operating segment. Impairment testing at 31 December 2014 resulted in this CGU being impaired.Its estimated recoverable amount was $321,500,000. As a result a plant and equipment impairment charge of $67,000,000was made.
Impact of reasonably possible changes in key assumptions
As all of these CGU’s are written down to their recoverable amounts at 31 December 2014, any future adverse change inthe key assumptions will result in further impairment.
Fair Value less Costs of Disposal
Energy Drilling Australia (EDA) CGU
This CGU is included in the MSA operating segment. Impairment testing at 31 December 2014 resulted in this CGU beingimpaired. Its estimated recoverable amount was $42,500,000. To determine the recoverable amount of this CGU theCompany engaged an independent external valuer to undertake a fair market valuation. The market approach, a Level 2input in the fair value hierarchy, was employed for this valuation as credible comparisons were on hand to support thisapproach. As a result a plant and equipment impairment charge of $13,796,000 was made.
Ausdrill Underground Mining Services Australia (AUMSA) CGU
This CGU is included in the MSA operating segment. Impairment testing at 31 December 2014 resulted in this CGU beingimpaired. Its estimated recoverable amount was $12,613,000. To determine the recoverable amount of this CGU theCompany engaged an independent external valuer to undertake a fair market valuation. The cost approach, a Level 2 inputin the fair value hierarchy, was employed for this valuation. This approach begins with the replacement cost new anddeducts all forms of depreciation to determine an estimate of value. It considers the maximum value of a property to aknowledgeable buyer would be the amount currently required to construct a new one of equal utility, adjusting thedifferences in age, condition and any other forms of depreciation and obsolescence factors. As a result a plant andequipment impairment charge of $868,000 was made.
23
For
per
sona
l use
onl
y
Ausdrill LimitedNotes to the consolidated financial statements
31 December 2014(continued)
4 Individually significant items (continued)
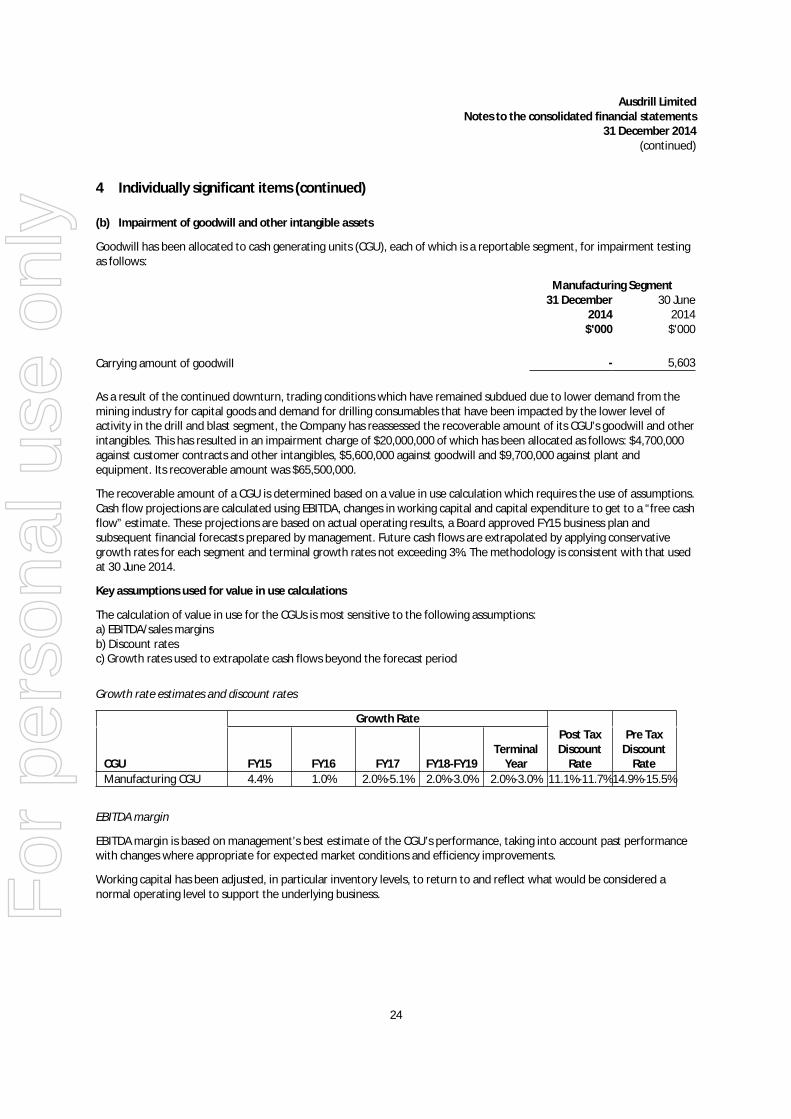
(b) Impairment of goodwill and other intangible assets
Goodwill has been allocated to cash generating units (CGU), each of which is a reportable segment, for impairment testingas follows:
Manufacturing Segment31 December 30 June
2014 2014$'000 $'000
Carrying amount of goodwill - 5,603
As a result of the continued downturn, trading conditions which have remained subdued due to lower demand from themining industry for capital goods and demand for drilling consumables that have been impacted by the lower level ofactivity in the drill and blast segment, the Company has reassessed the recoverable amount of its CGU’s goodwill and otherintangibles. This has resulted in an impairment charge of $20,000,000 of which has been allocated as follows: $4,700,000against customer contracts and other intangibles, $5,600,000 against goodwill and $9,700,000 against plant andequipment. Its recoverable amount was $65,500,000.
The recoverable amount of a CGU is determined based on a value in use calculation which requires the use of assumptions.Cash flow projections are calculated using EBITDA, changes in working capital and capital expenditure to get to a “free cashflow” estimate. These projections are based on actual operating results, a Board approved FY15 business plan andsubsequent financial forecasts prepared by management. Future cash flows are extrapolated by applying conservativegrowth rates for each segment and terminal growth rates not exceeding 3%. The methodology is consistent with that usedat 30 June 2014.
Key assumptions used for value in use calculations
The calculation of value in use for the CGUs is most sensitive to the following assumptions:a) EBITDA/sales marginsb) Discount ratesc) Growth rates used to extrapolate cash flows beyond the forecast period
Growth rate estimates and discount rates
Growth Rate
CGU FY15 FY16 FY17 FY18-FY19Terminal
Year
Post TaxDiscount
Rate
Pre TaxDiscount
Rate
Manufacturing CGU 4.4% 1.0% 2.0%-5.1% 2.0%-3.0% 2.0%-3.0% 11.1%-11.7%14.9%-15.5%
EBITDA margin
EBITDA margin is based on management’s best estimate of the CGU’s performance, taking into account past performancewith changes where appropriate for expected market conditions and efficiency improvements.
Working capital has been adjusted, in particular inventory levels, to return to and reflect what would be considered anormal operating level to support the underlying business.
24
For
per
sona
l use
onl
y
Ausdrill LimitedNotes to the consolidated financial statements
31 December 2014(continued)
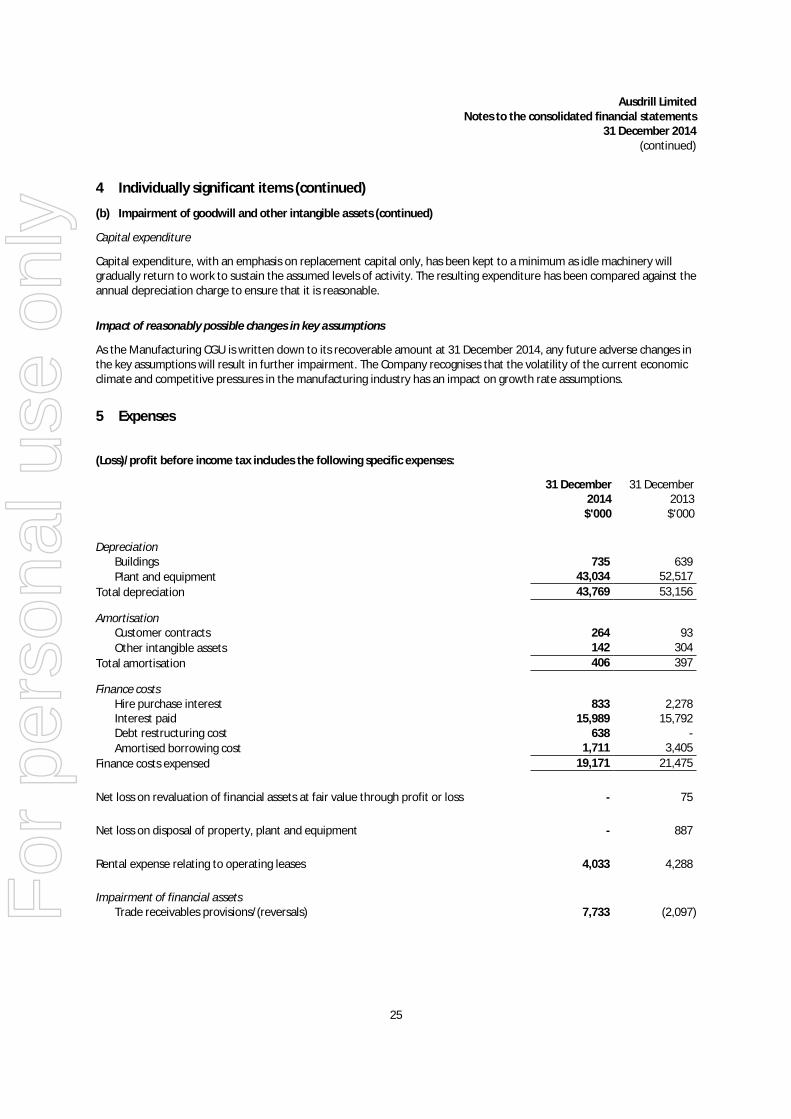
4 Individually significant items (continued)
(b) Impairment of goodwill and other intangible assets (continued)
Capital expenditure
Capital expenditure, with an emphasis on replacement capital only, has been kept to a minimum as idle machinery willgradually return to work to sustain the assumed levels of activity. The resulting expenditure has been compared against theannual depreciation charge to ensure that it is reasonable.
Impact of reasonably possible changes in key assumptions
As the Manufacturing CGU is written down to its recoverable amount at 31 December 2014, any future adverse changes inthe key assumptions will result in further impairment. The Company recognises that the volatility of the current economicclimate and competitive pressures in the manufacturing industry has an impact on growth rate assumptions.
5 Expenses
(Loss)/profit before income tax includes the following specific expenses:
31 December2014
$'000
31 December2013$'000
DepreciationBuildings 735 639
Plant and equipment 43,034 52,517
Total depreciation 43,769 53,156
AmortisationCustomer contracts 264 93
Other intangible assets 142 304
Total amortisation 406 397
Finance costsHire purchase interest 833 2,278Interest paid 15,989 15,792Debt restructuring cost 638 -
Amortised borrowing cost 1,711 3,405
Finance costs expensed 19,171 21,475
Net loss on revaluation of financial assets at fair value through profit or loss - 75
Net loss on disposal of property, plant and equipment - 887
Rental expense relating to operating leases 4,033 4,288
Impairment of financial assetsTrade receivables provisions/(reversals) 7,733 (2,097)
25
For
per
sona
l use
onl
y
Ausdrill LimitedNotes to the consolidated financial statements
31 December 2014(continued)
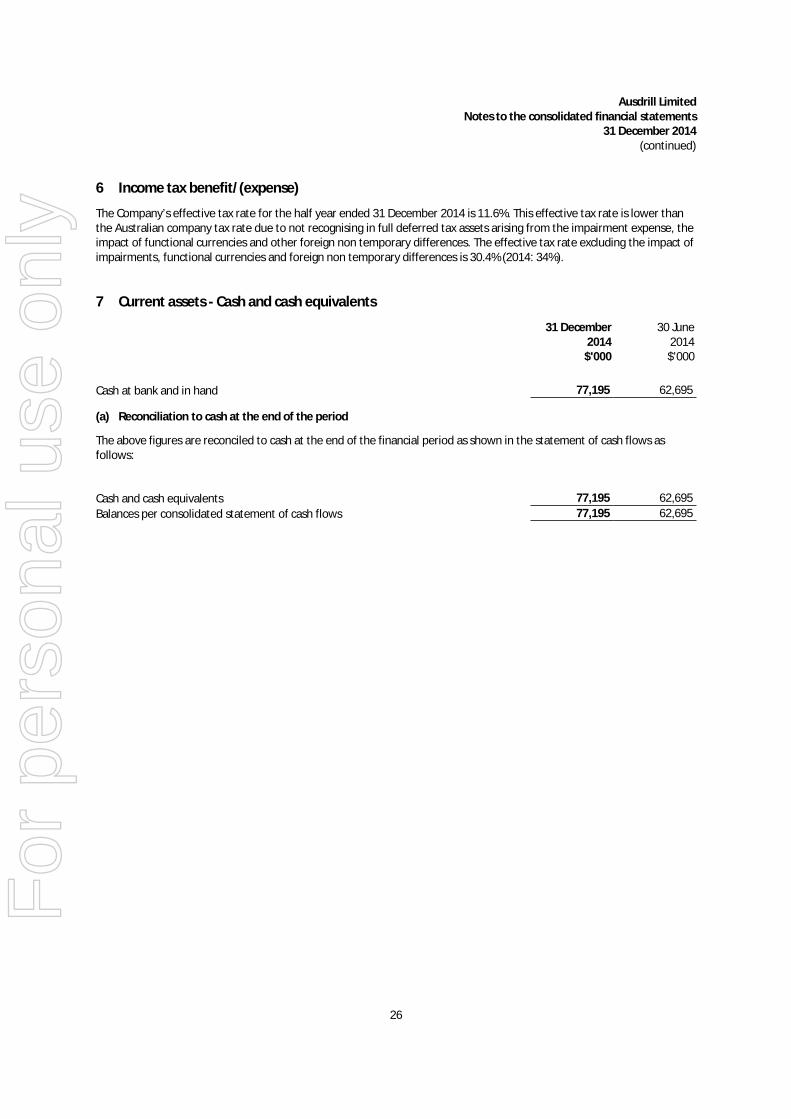
6 Income tax benefit/(expense)
The Company’s effective tax rate for the half year ended 31 December 2014 is 11.6%. This effective tax rate is lower thanthe Australian company tax rate due to not recognising in full deferred tax assets arising from the impairment expense, theimpact of functional currencies and other foreign non temporary differences. The effective tax rate excluding the impact ofimpairments, functional currencies and foreign non temporary differences is 30.4% (2014: 34%).
7 Current assets - Cash and cash equivalents
31 December2014
$'000
30 June2014$'000
Cash at bank and in hand 77,195 62,695
(a) Reconciliation to cash at the end of the period
The above figures are reconciled to cash at the end of the financial period as shown in the statement of cash flows asfollows:
Cash and cash equivalents 77,195 62,695
Balances per consolidated statement of cash flows 77,195 62,695
26
For
per
sona
l use
onl
y
Ausdrill LimitedNotes to the consolidated financial statements
31 December 2014(continued)
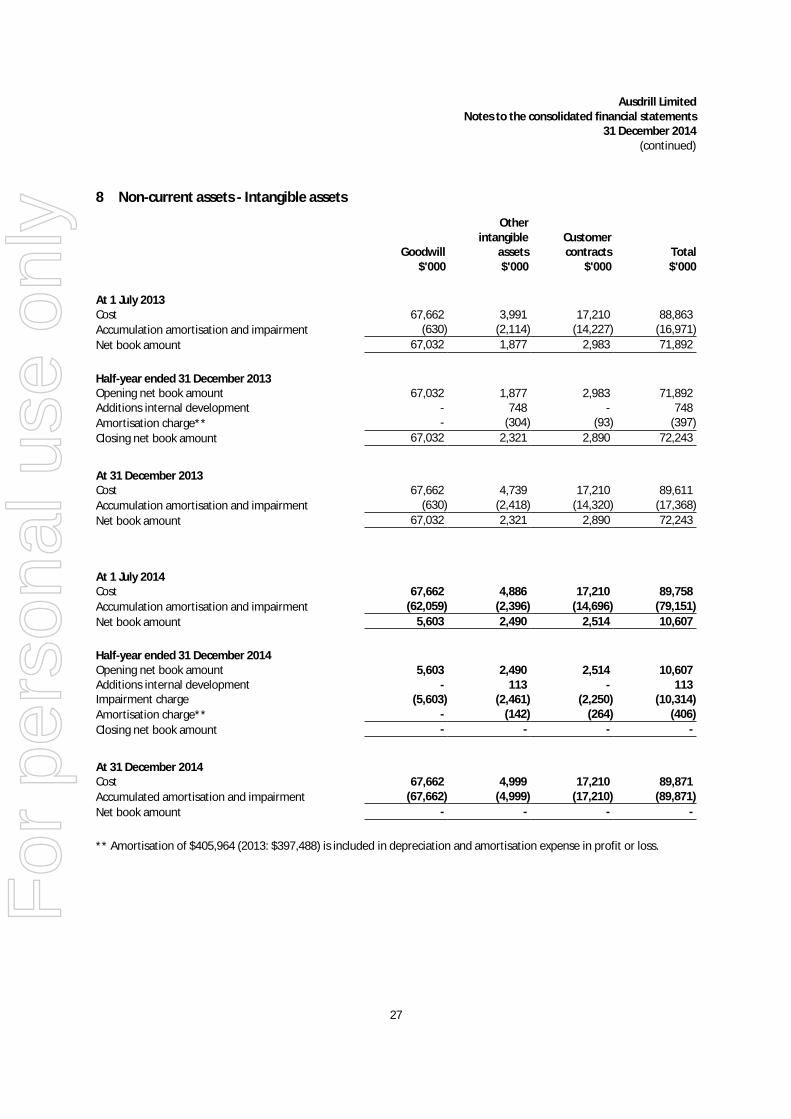
8 Non-current assets - Intangible assets
Goodwill$'000
Otherintangible
assets$'000
Customercontracts
$'000Total$'000
At 1 July 2013Cost 67,662 3,991 17,210 88,863
Accumulation amortisation and impairment (630) (2,114) (14,227) (16,971)
Net book amount 67,032 1,877 2,983 71,892
Half-year ended 31 December 2013Opening net book amount 67,032 1,877 2,983 71,892Additions internal development - 748 - 748
Amortisation charge** - (304) (93) (397)
Closing net book amount 67,032 2,321 2,890 72,243
At 31 December 2013Cost 67,662 4,739 17,210 89,611
Accumulation amortisation and impairment (630) (2,418) (14,320) (17,368)
Net book amount 67,032 2,321 2,890 72,243
At 1 July 2014Cost 67,662 4,886 17,210 89,758
Accumulation amortisation and impairment (62,059) (2,396) (14,696) (79,151)
Net book amount 5,603 2,490 2,514 10,607
Half-year ended 31 December 2014Opening net book amount 5,603 2,490 2,514 10,607Additions internal development - 113 - 113Impairment charge (5,603) (2,461) (2,250) (10,314)
Amortisation charge** - (142) (264) (406)
Closing net book amount - - - -
At 31 December 2014Cost 67,662 4,999 17,210 89,871
Accumulated amortisation and impairment (67,662) (4,999) (17,210) (89,871)
Net book amount - - - -
** Amortisation of $405,964 (2013: $397,488) is included in depreciation and amortisation expense in profit or loss.
27
For
per
sona
l use
onl
y
Ausdrill LimitedNotes to the consolidated financial statements
31 December 2014(continued)
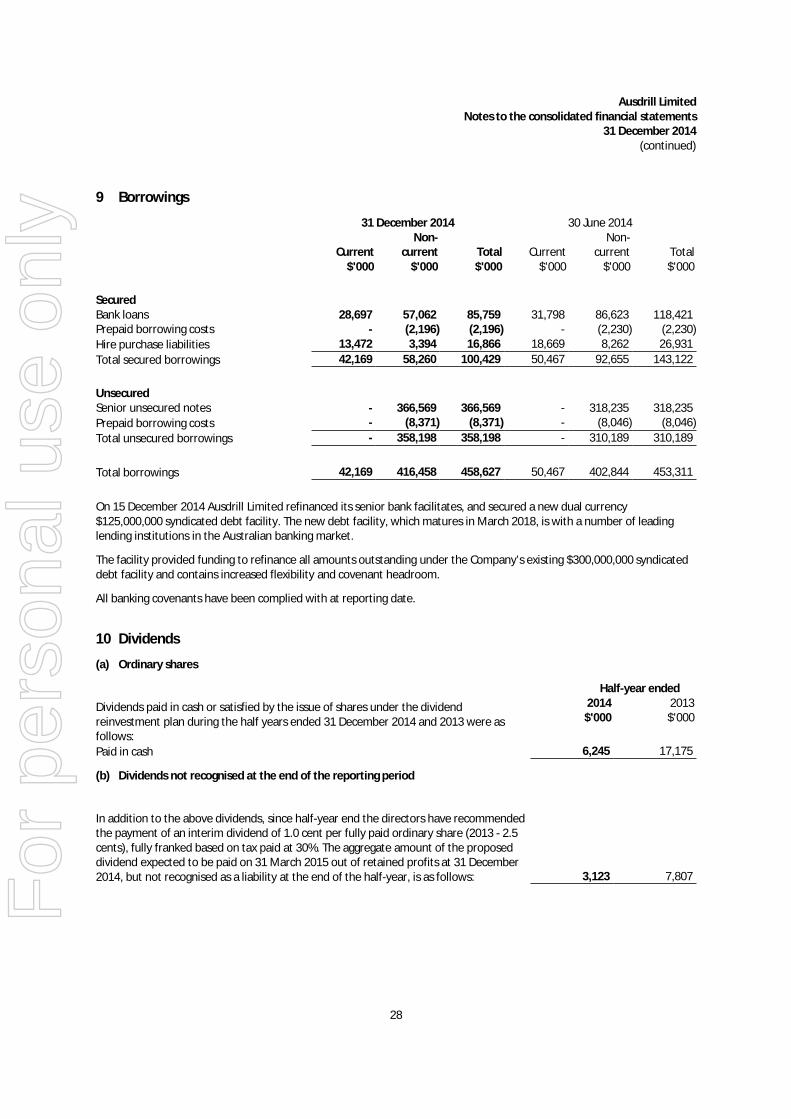
9 Borrowings
31 December 2014 30 June 2014
Current$'000
Non-current
$'000Total$'000
Current$'000
Non-current
$'000Total$'000
SecuredBank loans 28,697 57,062 85,759 31,798 86,623 118,421Prepaid borrowing costs - (2,196) (2,196) - (2,230) (2,230)
Hire purchase liabilities 13,472 3,394 16,866 18,669 8,262 26,931
Total secured borrowings 42,169 58,260 100,429 50,467 92,655 143,122
UnsecuredSenior unsecured notes - 366,569 366,569 - 318,235 318,235
Prepaid borrowing costs - (8,371) (8,371) - (8,046) (8,046)
Total unsecured borrowings - 358,198 358,198 - 310,189 310,189
Total borrowings 42,169 416,458 458,627 50,467 402,844 453,311
On 15 December 2014 Ausdrill Limited refinanced its senior bank facilitates, and secured a new dual currency$125,000,000 syndicated debt facility. The new debt facility, which matures in March 2018, is with a number of leadinglending institutions in the Australian banking market.
The facility provided funding to refinance all amounts outstanding under the Company’s existing $300,000,000 syndicateddebt facility and contains increased flexibility and covenant headroom.
All banking covenants have been complied with at reporting date.
10 Dividends
(a) Ordinary shares
Half-year ended
Dividends paid in cash or satisfied by the issue of shares under the dividendreinvestment plan during the half years ended 31 December 2014 and 2013 were asfollows:
2014$'000
2013$'000
Paid in cash 6,245 17,175
(b) Dividends not recognised at the end of the reporting period
In addition to the above dividends, since half-year end the directors have recommendedthe payment of an interim dividend of 1.0 cent per fully paid ordinary share (2013 - 2.5cents), fully franked based on tax paid at 30%. The aggregate amount of the proposeddividend expected to be paid on 31 March 2015 out of retained profits at 31 December2014, but not recognised as a liability at the end of the half-year, is as follows: 3,123 7,807
28
For
per
sona
l use
onl
y
Ausdrill LimitedNotes to the consolidated financial statements
31 December 2014(continued)
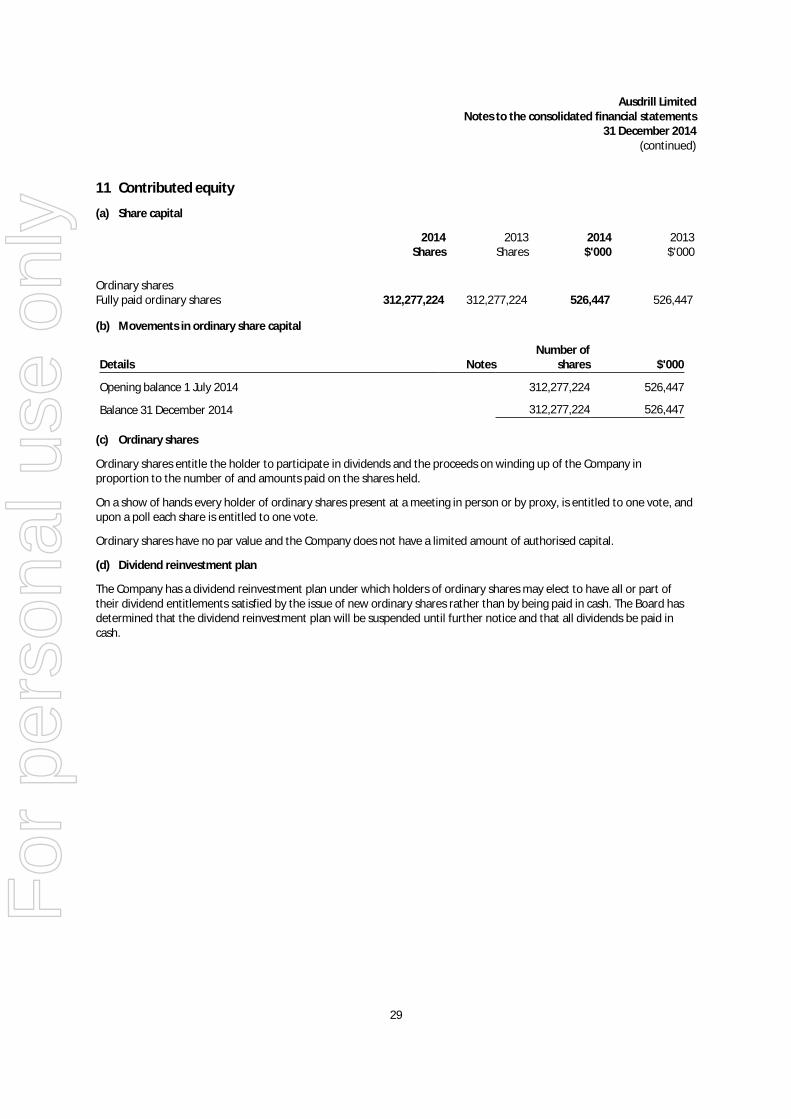
11 Contributed equity
(a) Share capital
2014Shares
2013Shares
2014$'000
2013$'000
Ordinary sharesFully paid ordinary shares 312,277,224 312,277,224 526,447 526,447
(b) Movements in ordinary share capital
Number ofDetails Notes shares $'000
Opening balance 1 July 2014 312,277,224 526,447
Balance 31 December 2014 312,277,224 526,447
(c) Ordinary shares
Ordinary shares entitle the holder to participate in dividends and the proceeds on winding up of the Company inproportion to the number of and amounts paid on the shares held.
On a show of hands every holder of ordinary shares present at a meeting in person or by proxy, is entitled to one vote, andupon a poll each share is entitled to one vote.
Ordinary shares have no par value and the Company does not have a limited amount of authorised capital.
(d) Dividend reinvestment plan
The Company has a dividend reinvestment plan under which holders of ordinary shares may elect to have all or part oftheir dividend entitlements satisfied by the issue of new ordinary shares rather than by being paid in cash. The Board hasdetermined that the dividend reinvestment plan will be suspended until further notice and that all dividends be paid incash.
29
For
per
sona
l use
onl
y
Ausdrill LimitedNotes to the consolidated financial statements
31 December 2014(continued)
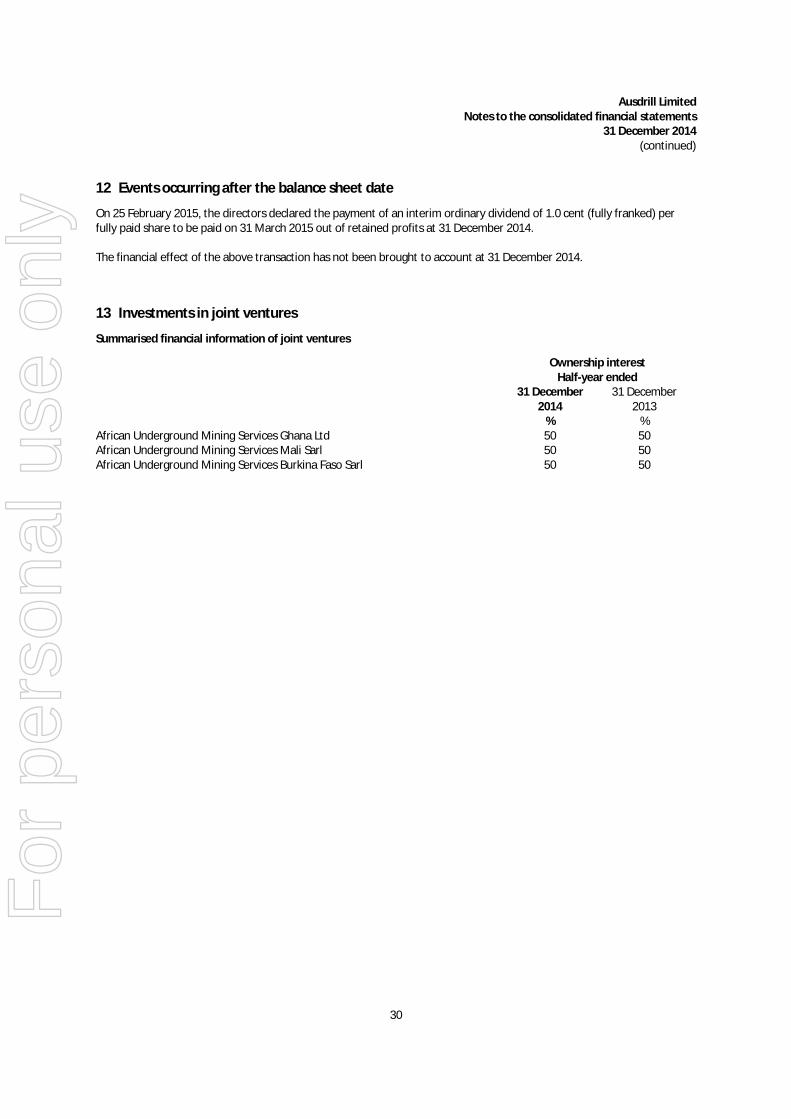
12 Events occurring after the balance sheet date
On 25 February 2015, the directors declared the payment of an interim ordinary dividend of 1.0 cent (fully franked) perfully paid share to be paid on 31 March 2015 out of retained profits at 31 December 2014.
The financial effect of the above transaction has not been brought to account at 31 December 2014.
13 Investments in joint ventures
Summarised financial information of joint ventures
Ownership interestHalf-year ended
31 December 31 December2014 2013
% %African Underground Mining Services Ghana Ltd 50 50African Underground Mining Services Mali Sarl 50 50African Underground Mining Services Burkina Faso Sarl 50 50
30
For
per
sona
l use
onl
y
Ausdrill LimitedNotes to the consolidated financial statements
31 December 2014(continued)
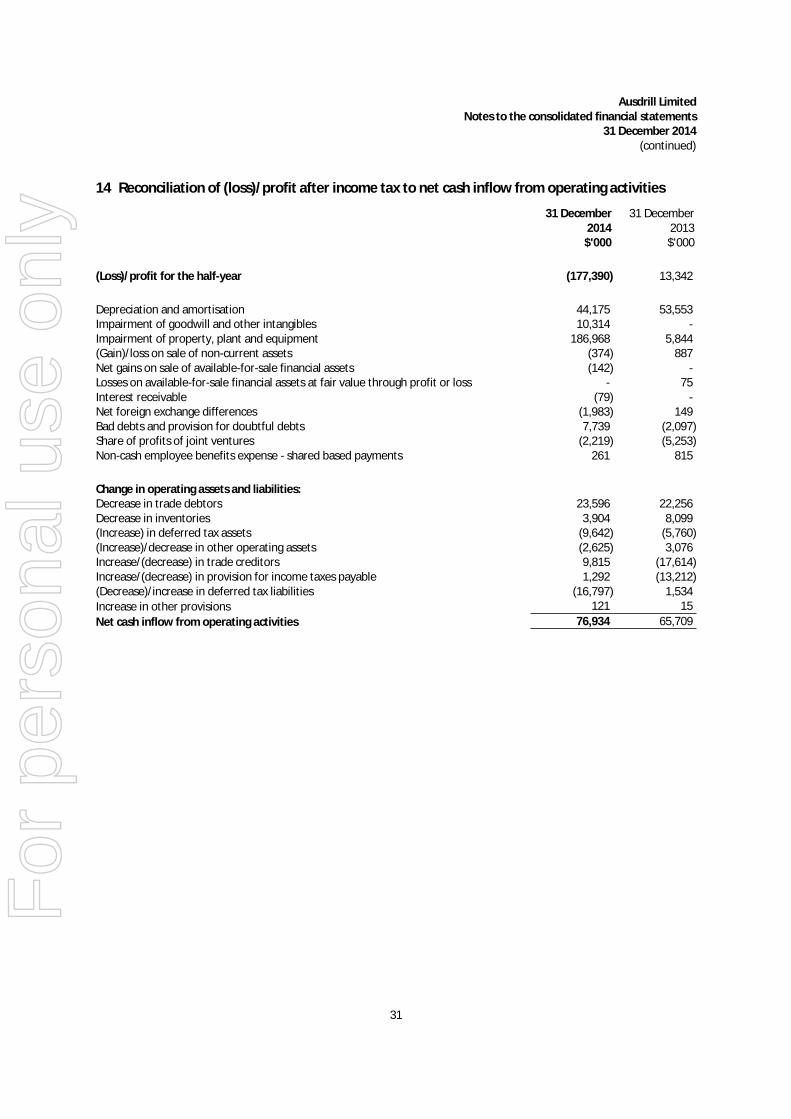
14 Reconciliation of (loss)/profit after income tax to net cash inflow from operating activities
31 December2014
$'000
31 December2013$'000
(Loss)/profit for the half-year (177,390) 13,342
Depreciation and amortisation 44,175 53,553Impairment of goodwill and other intangibles 10,314 -Impairment of property, plant and equipment 186,968 5,844(Gain)/loss on sale of non-current assets (374) 887Net gains on sale of available-for-sale financial assets (142) -Losses on available-for-sale financial assets at fair value through profit or loss - 75Interest receivable (79) -Net foreign exchange differences (1,983) 149Bad debts and provision for doubtful debts 7,739 (2,097)Share of profits of joint ventures (2,219) (5,253)Non-cash employee benefits expense - shared based payments 261 815
Change in operating assets and liabilities:Decrease in trade debtors 23,596 22,256Decrease in inventories 3,904 8,099(Increase) in deferred tax assets (9,642) (5,760)(Increase)/decrease in other operating assets (2,625) 3,076Increase/(decrease) in trade creditors 9,815 (17,614)Increase/(decrease) in provision for income taxes payable 1,292 (13,212)(Decrease)/increase in deferred tax liabilities (16,797) 1,534
Increase in other provisions 121 15
Net cash inflow from operating activities 76,934 65,709
31
For
per
sona
l use
onl
y
Ausdrill LimitedDirectors' declaration
31 December 2014
In the directors' opinion:
(a) the financial statements and notes set out on pages 13 to 31 are in accordance with the Corporations Act 2001,including:(i) complying with Accounting Standards, the Corporations Regulations 2001 and other mandatory
professional reporting requirements, and(ii) giving a true and fair view of the consolidated entity's financial position as at 31 December 2014 and of its
performance for the half-year ended on that date, and(b) there are reasonable grounds to believe that Ausdrill Limited will be able to pay its debts as and when they become
due and payable, and(c) at the date of this declaration, there are reasonable grounds to believe that the members of the extended closed
group will be able to meet any obligations or liabilities to which they are, or may become, subject by virtue of thedeed of cross guarantee.
This declaration is made in accordance with a resolution of the directors.
Ronald George SayersManaging Director
Perth25 February 2015
32
For
per
sona
l use
onl
y

For
per
sona
l use
onl
y

For
per
sona
l use
onl
y