Embed Size (px)
Citation preview
2017 FINANCIAL IMPACT OF FRAUD STUDY:
EXPLORING THE IMPACT OF FRAUD IN A DIGITAL WORLD
September 2017
Independently produced by: Sponsored by:
2017 FINANCIAL IMPACT OF FRAUD STUDY:
EXPLORING THE IMPACT OF FRAUD IN A DIGITAL WORLD
2
javelinstrategy.com
925.225.9100
TABLE OF CONTENTS Executive Summary .................................................................................................................................................... 5
Recommendations ....................................................................................................................................... 7
Introduction ............................................................................................................................................................... 8
E-Commerce Trends .................................................................................................................................... 8
Fraud Trends ................................................................................................................................................ 9
Fraudsters’ Shifting Tactics ...................................................................................................................................... 12
Fraud Threats ............................................................................................................................................. 12
Fraud Types .............................................................................................................................................................. 16
Unauthorized Transactions ........................................................................................................................ 17
Account Takeover (ATO) ............................................................................................................................ 18
Friendly Fraud ............................................................................................................................................ 18
Merchants’ Response to Fraud ................................................................................................................................ 20
Fraud Management Investment ................................................................................................................ 20
Fraud Management Tools .......................................................................................................................... 24
3D Secure (3DS) ......................................................................................................................................... 26
Conclusion ................................................................................................................................................................ 30
Appendix .................................................................................................................................................................. 31
Methodology ............................................................................................................................................................ 34

2017 FINANCIAL IMPACT OF FRAUD STUDY:
EXPLORING THE IMPACT OF FRAUD IN A DIGITAL WORLD
3
javelinstrategy.com
925.225.9100
TABLE OF FIGURES Figure 1: U.S. Retail E-Commerce Transaction Dollar Volume and Share of Purchases made Online (Including
Online and In-App Mobile (2012-2020) ..................................................................................................................... 8
Figure 2: Total Fraud Costs as a Percentage of Revenue (2016-2017) ....................................................................... 9
Figure 3: Breakdown of Fraud-Related Costs as Percentage of Revenue (2016-2017) ........................................... 10
Figure 4: Average Fraud Management Expenditures as Percentage of Operational Costs (2016-2017) ................. 11
Figure 5: Reasons for Believing CNP Fraud Will Increase Over the Next 12 Months ............................................... 12
Figure 6: Percentage Rating Threats “Very” to “Extremely Difficult” by Merchant Type ........................................ 13
Figure 7: Authentication Used for Customer Account Access (2016-2017) ............................................................. 14
Figure 8: Average Fraud Losses by Type of Fraud .................................................................................................... 16
Figure 9: Percentage of Fraud Losses by Type of Fraud ........................................................................................... 17
Figure 10: Average Fraud Management Costs (2016-2017) .................................................................................... 20
Figure 11: Breakdown of Fraud-Related Costs as a Proportion of total Fraud Costs ............................................... 21
Figure 12: Anticipated Change in Spending on Fraud Management Expenditures ................................................. 22
Figure 13: Attitudes Around Fraud Management and Customer Experience .......................................................... 23
Figure 14: Current and Anticipated Adoption of Fraud Tools .................................................................................. 24
Figure 15: Discontinuation or Failure to Adopt Fraud Solutions .............................................................................. 25
Figure 16: Reasons Merchants are Avoiding 3D Secure ........................................................................................... 26
Figure 17: Anticipated Benefit of 3D Secure 2.0 ...................................................................................................... 27
Figure 18: Use of Security Solutions, with Expectation of Adoption in the Next 12 Months................................... 28
Figure 19: Channels Where Merchants Plan to Leverage 3DSecure ........................................................................ 29
Figure 20: Total Fraud Costs in Dollars (2016-2017) ................................................................................................ 31
Figure 21: Change in Concern About CNP Fraud Past 12 Months ............................................................................ 31
Figure 22: Percentage of all Chargeback Losses by Channel .................................................................................... 32
Figure 23: Attitudes Around Training Fraud Management Staff .............................................................................. 32
Figure 24: Reasons for Increased Fraud Management Investment ......................................................................... 33

2017 FINANCIAL IMPACT OF FRAUD STUDY:
EXPLORING THE IMPACT OF FRAUD IN A DIGITAL WORLD
4
javelinstrategy.com
925.225.9100
FOREWORD
This original research report, sponsored by Vesta, examines the challenges faced by e-commerce merchants in
balancing customer experience with the financial realities of combating fraud in a digital world. The costs
associated with fraud go far beyond direct losses and encompass the tools and personnel used along with lost
revenue from turning away legitimate customers. This research report was independently produced by Javelin
Strategy & Research. Javelin Strategy & Research maintains complete independence in its data collection findings
and analysis.
OVERVIEW Consumers are investing more and more of their spending power in the digital space, purchasing goods and services via the
online and mobile channels that they have historically bought in brick-and-mortar locations. As spending patterns have
shifted, fraudsters have followed, increasing their focus on digital merchants and developing new techniques and
technologies to exploit the online and mobile channels. Merchants are facing rising losses and growing fraud management
costs and need to be constantly evaluating and experimenting to find the best tools, personnel, and processes to combat
shifting fraud approaches while maintaining customer experience and maximizing profitability.
2017 FINANCIAL IMPACT OF FRAUD STUDY:
EXPLORING THE IMPACT OF FRAUD IN A DIGITAL WORLD
5
javelinstrategy.com
925.225.9100
EXECUTIVE SUMMARY
Key Findings Fraud is costing merchants 8% of annual revenues on
average. Merchants’ fraud costs are increasing as
transactions continue to shift to digital channels in the wake
of the conversion to the EMV chip card standard. Fraud
management, chargeback losses, and false positives are a
growing expense for all merchants. The biggest impact has
been to digital goods merchants, who have lost 9.7% of
revenue on average to fraud, an increase of 13% from 2016.
The majority of fraud expenditures are for fraud
management, which makes up 75% of fraud costs, triple the
actual fraud losses themselves.
Merchants spend 10 times as much preventing fraud as
they lose to chargebacks. Of the 8.0% of revenue that the
average merchant lost to fraud in 2017, 5.9 percentage
points represents fraud management costs, which includes
investments in areas such as technology and personnel,
while 0.6 percentage point represents the revenue lost to
fraud-related chargebacks.
Chargebacks and false positives are a growing portion of
fraud costs. Chargebacks were up 60% for digital goods
merchants and 75% for physical goods merchants, a result of
increased sophistication of fraudsters and exposure to the
EMV fraud liability shift for some physical goods merchants.
False positives continue to grow as well, albeit slightly more
slowly, at an increase of 25% for digital goods merchants and
27% for physical goods merchants.
Card-not-present fraud is an increasing concern for
merchants as fraudsters get more sophisticated. Card-not-
present fraud continues to be a strong concern for more
than 85% of merchants, with a third showing increased
concern in 2017. This increasing concern is being driven in
large part by the emergence of new fraud tactics such as
botnet attacks and fraud attempts via new delivery
techniques such as buy online, pick up in store. Of equal
concern is the impact of the EMV conversion in shifting more
fraud to digital channels and away from brick-and-mortar.
Finally, the growth in CNP transactions means more
international customers, increasing concerns about
international fraud, where existing fraud mitigation tools
may be less effective.
Merchants continue to rely heavily on vulnerable
usernames and passwords. The primary authentication tool,
used by 75% of CNP merchants, is the weak pair of username
and password, broadly exploited via data breaches and
malware. Merchants’ reliance on this approach is
understandable, given customer familiarity and comfort with
it, but to effectively combat fraud, they will need to increase
their focus on second factors of authentication such as
device fingerprinting, out-of-band authentication, and
geolocation.
Unauthorized transactions increased dramatically in 2017.
Unauthorized transactions were up 33% in 2017 and
accounted for nearly half of merchants’ average 2017 fraud
losses. Criminals continue to leverage data gained from
breaches and malware while at the same time becoming
more sophisticated, taking advantage of technologies such as
VPNs and virtual machines to disguise their locations and
devices.
Merchant spending on fraud management grew more than
15%. Average fraud management spend by merchants
increased 17% in 2017, most notably for digital goods
merchants, whose spend was up 42% year over year. Half of
all chargeback losses occurring at online stores and as fraud
continues to migrate to digital channels following the EMV
transition, the pressures on online merchants to combat

2017 FINANCIAL IMPACT OF FRAUD STUDY:
EXPLORING THE IMPACT OF FRAUD IN A DIGITAL WORLD
6
javelinstrategy.com
925.225.9100
fraud will only increase. While the need to invest in fraud
prevention and management tools will be critical across all
merchant types, the need will be greatest for digital goods
merchants.
People, technology, and outsourcing will attract increased
investment in 2018. Fraud management technology is the
main area of increased investment for all merchant types,
with nearly two-thirds of digital goods and hybrid merchants
allocating more spend here along with half of physical goods
merchants. This is closely followed by increased spend on
fraud management personnel, which is of greatest
importance to hybrid merchants, given the complexities of
navigating fraud mitigation across product types.
Outsourcing is an appealing option for many merchants.
Outsourcing is becoming a more popular method of
managing fraud, with 24% of merchants currently
outsourcing some or all of their fraud mitigation efforts and
nearly half of digital goods and hybrid merchants expecting
to do so in the near future. With 21% of operational spend
allocated to fraud management in 2017, merchants are
taking a comprehensive look at the internal costs of
combating fraud and evaluating the benefits of hiring an
expert third party to manage fraud on their behalf.
Newer anti-fraud measures have a strong appeal for
merchants. While merchants continue to rely on remedial
fraud mitigation solutions such as customer identity
verification and card security code (CVC2 or CVV2),
behavioral analytics and device fingerprinting are anticipated
to make the greatest strides in adoption in the coming years.
These newer and less intrusive solutions promise to help
merchants better combat fraud attempts without degrading
the customer experience and thus alienating customers.
3-D Secure is likely to see increased adoption in the coming
year. The introduction of 3-D Secure 2.0, with its promise of
greater fraud prevention with reduced disruption to the
customer experience, is persuading a growing number of
merchants to give the solution a second chance. About 63%
of merchants – some of which have an international
presence – expect to have the solution in place in the coming
year, with particular interest in implementations for the
mobile channel, with the expectation that enough has been
done to improve the user experience as well as to integrate
mobile wallets and in-app transactions.

2017 FINANCIAL IMPACT OF FRAUD STUDY:
EXPLORING THE IMPACT OF FRAUD IN A DIGITAL WORLD
7
javelinstrategy.com
925.225.9100
Recommendations Evaluate additional authentication approaches beyond
those using static data elements. The majority of merchants
continue to rely on username and password, card security
codes and address verification to mitigate fraud. Merchants
need to invest in more dynamic tools as alternative or
second factors for authenticating customers, particularly
those tools that are minimally disruptive to the customer
experience. Tools that evaluate customer behavior, monitor
device information, or provide comparisons against prior
customer purchasing activity are all well-suited to combat
fraud attempts on digital transactions.
Invest in comprehensive and ongoing training of fraud
management personnel. With the constant evolution of
fraud tools and techniques, it is critical that fraud
management staff be informed and up to date on the latest
fraud threats as well as the newest fraud mitigation
approaches required to safeguard the profitability of their
businesses.
Implement “invisible” fraud management tools to
maximize fraud prevention while minimizing impact to
customer experience. Merchants should look to implement
some of the newer fraud mitigation tools such as
behaviometrics, machine learning, device fingerprinting, and
the newest version of 3-D Secure. These tools promise
increased success at mitigating fraud attempts while having
very little impact on the customer’s experience during the
sale and checkout process.
Consider outsourcing some or all fraud management
functions. Fraud tools and techniques are evolving at
lightning speed, making it challenging for even those fully
dedicated to managing fraud to keep up with the many new
approaches fraudsters are using. Merchants, especially those
with a high volume of digital transactions, should evaluate
their options for outsourcing some or all fraud management
activities. This will require a comprehensive look at the
internal costs of combating fraud weighed against the costs
and benefits of outsourcing.
2017 FINANCIAL IMPACT OF FRAUD STUDY:
EXPLORING THE IMPACT OF FRAUD IN A DIGITAL WORLD
8
javelinstrategy.com
925.225.9100
INTRODUCTION
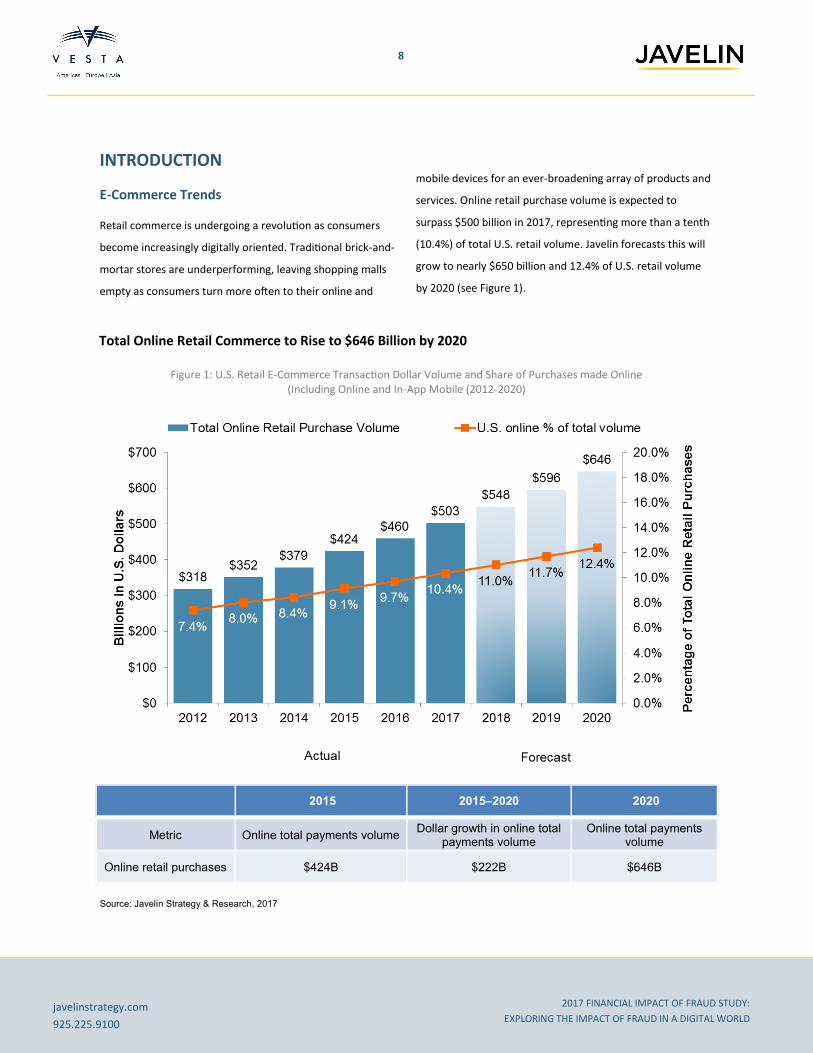
E-Commerce Trends Retail commerce is undergoing a revolution as consumers
become increasingly digitally oriented. Traditional brick-and-
mortar stores are underperforming, leaving shopping malls
empty as consumers turn more often to their online and
mobile devices for an ever-broadening array of products and
services. Online retail purchase volume is expected to
surpass $500 billion in 2017, representing more than a tenth
(10.4%) of total U.S. retail volume. Javelin forecasts this will
grow to nearly $650 billion and 12.4% of U.S. retail volume
by 2020 (see Figure 1).
Total Online Retail Commerce to Rise to $646 Billion by 2020
Figure 1: U.S. Retail E-Commerce Transaction Dollar Volume and Share of Purchases made Online (Including Online and In-App Mobile (2012-2020)
2015 2015–2020 2020
Metric Online total payments volume Dollar growth in online total
payments volume Online total payments
volume
Online retail purchases $424B $222B $646B
Source: Javelin Strategy & Research, 2017

2017 FINANCIAL IMPACT OF FRAUD STUDY:
EXPLORING THE IMPACT OF FRAUD IN A DIGITAL WORLD
9
javelinstrategy.com
925.225.9100
Fraud Trends This continuing shift to e-commerce, via both the online and
mobile channels, is making fraud management an
increasingly critical challenge for merchants. As compared to
physical point-of-sale transactions, e-commerce transactions
can involve unique kinds of products, along with differing
marketing approaches and delivery methods. As volume
continues to shift to the digital channels, fraudsters will
focus more of their efforts on identifying and exploiting the
unique attributes of e-commerce, and merchants will have to
remain nimble and vigilant to maintain their revenues and
profit margins.
Vigilance requires ongoing and increasing investment, and
average merchant‘s total fraud costs in 2017 grew
accordingly, totaling $15.5 million, up 6% from last year
($14.6 million) (see Appendix). This represents a greater
proportion of revenue than last year dedicated to
confronting the challenges of fraud attempts (8.0% in 2017
vs. 7.6% in 2016) (see Figure 2). This follows a year of
significant investment for many physical goods and hybrid
merchants who became EMV-capable at POS.
Fraud Consumed More of the Average Merchant’s Revenue in 2017
Figure 2: Total Fraud Costs as a Percentage of Revenue (2016-17)
“We are in a journey right now where we are
trying to [put] a lot of lipstick on the pig and
modernize it. We have invested a lot in the
infrastructure but are not there yet. A lot of
the bells and whistles aren’t there yet. We
would love to get to a situation where it is a
known customer, and we have all their infor-
mation, give them a one-click checkout, but we
aren’t there yet.”
- Fraud executive, hybrid merchant
Source: Javelin Strategy & Research, 2017
2017 FINANCIAL IMPACT OF FRAUD STUDY:
EXPLORING THE IMPACT OF FRAUD IN A DIGITAL WORLD
10
javelinstrategy.com
925.225.9100
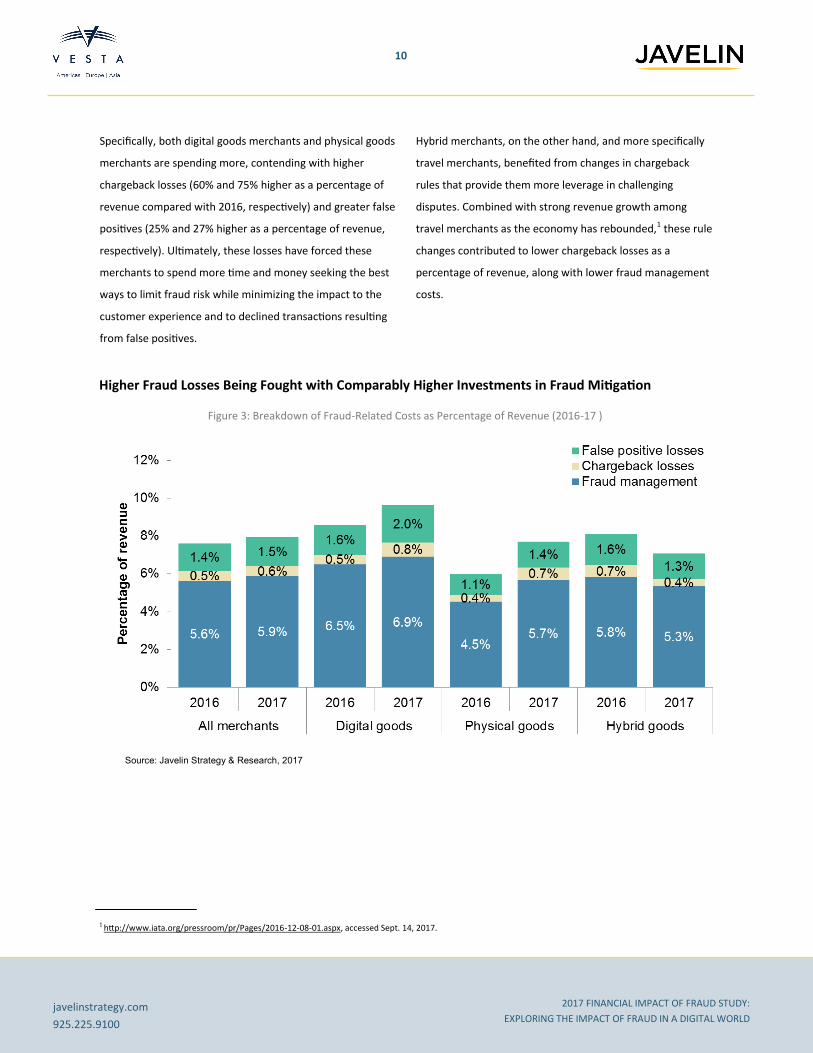
Specifically, both digital goods merchants and physical goods
merchants are spending more, contending with higher
chargeback losses (60% and 75% higher as a percentage of
revenue compared with 2016, respectively) and greater false
positives (25% and 27% higher as a percentage of revenue,
respectively). Ultimately, these losses have forced these
merchants to spend more time and money seeking the best
ways to limit fraud risk while minimizing the impact to the
customer experience and to declined transactions resulting
from false positives.
Hybrid merchants, on the other hand, and more specifically
travel merchants, benefited from changes in chargeback
rules that provide them more leverage in challenging
disputes. Combined with strong revenue growth among
travel merchants as the economy has rebounded,1 these rule
changes contributed to lower chargeback losses as a
percentage of revenue, along with lower fraud management
costs.
Higher Fraud Losses Being Fought with Comparably Higher Investments in Fraud Mitigation
Figure 3: Breakdown of Fraud-Related Costs as Percentage of Revenue (2016-17 )
1 http://www.iata.org/pressroom/pr/Pages/2016-12-08-01.aspx, accessed Sept. 14, 2017.
Source: Javelin Strategy & Research, 2017
2017 FINANCIAL IMPACT OF FRAUD STUDY:
EXPLORING THE IMPACT OF FRAUD IN A DIGITAL WORLD
11
javelinstrategy.com
925.225.9100
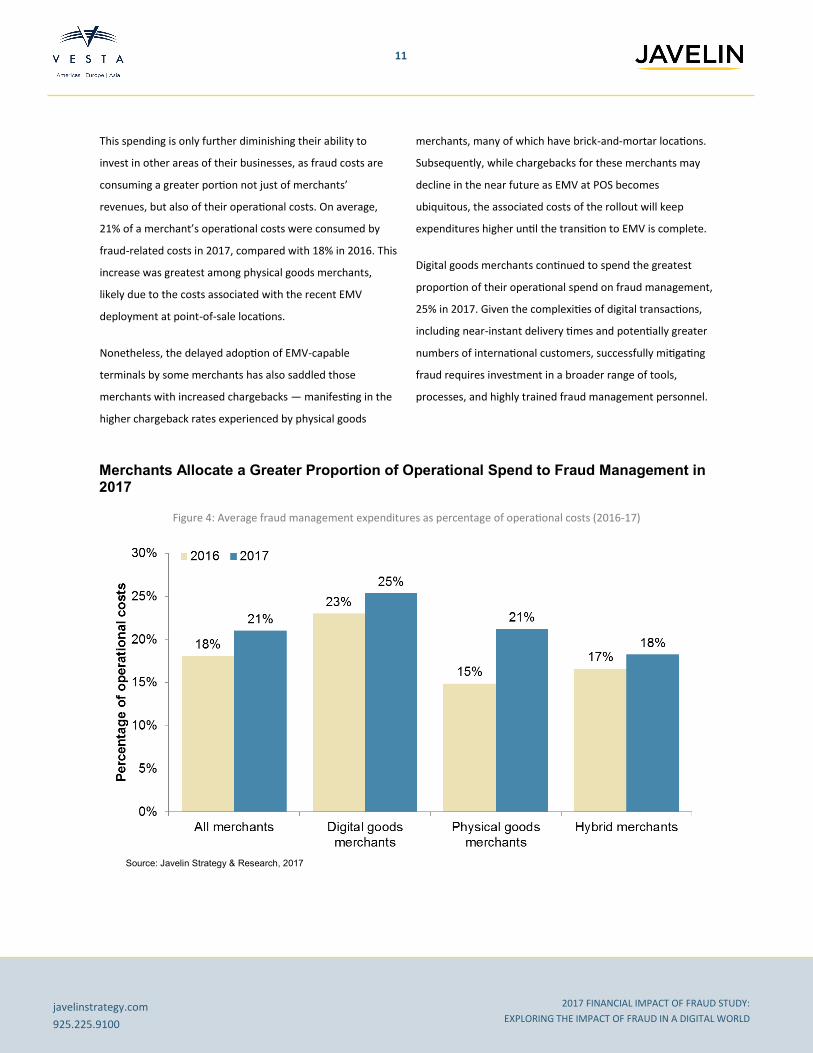
This spending is only further diminishing their ability to
invest in other areas of their businesses, as fraud costs are
consuming a greater portion not just of merchants’
revenues, but also of their operational costs. On average,
21% of a merchant’s operational costs were consumed by
fraud-related costs in 2017, compared with 18% in 2016. This
increase was greatest among physical goods merchants,
likely due to the costs associated with the recent EMV
deployment at point-of-sale locations.
Nonetheless, the delayed adoption of EMV-capable
terminals by some merchants has also saddled those
merchants with increased chargebacks — manifesting in the
higher chargeback rates experienced by physical goods
merchants, many of which have brick-and-mortar locations.
Subsequently, while chargebacks for these merchants may
decline in the near future as EMV at POS becomes
ubiquitous, the associated costs of the rollout will keep
expenditures higher until the transition to EMV is complete.
Digital goods merchants continued to spend the greatest
proportion of their operational spend on fraud management,
25% in 2017. Given the complexities of digital transactions,
including near-instant delivery times and potentially greater
numbers of international customers, successfully mitigating
fraud requires investment in a broader range of tools,
processes, and highly trained fraud management personnel.
Merchants Allocate a Greater Proportion of Operational Spend to Fraud Management in 2017
Figure 4: Average fraud management expenditures as percentage of operational costs (2016-17)
Source: Javelin Strategy & Research, 2017
2017 FINANCIAL IMPACT OF FRAUD STUDY:
EXPLORING THE IMPACT OF FRAUD IN A DIGITAL WORLD
12
javelinstrategy.com
925.225.9100
FRAUDSTERS’ SHIFTING TACTICS
Fraud Threats Though card-not-present (CNP) transactions provide an
opportunity to drive business — and increased revenues —
to the merchant that would not be possible with card-
present transactions alone, 1 in 3 merchants is growing more
concerned that CNP fraud will increase in the next 12
months (see Appendix). These merchants are balancing the
tradeoff between increasing revenues and managing the
associated fraud risks and growing management costs and
losses associated with CNP transactions.
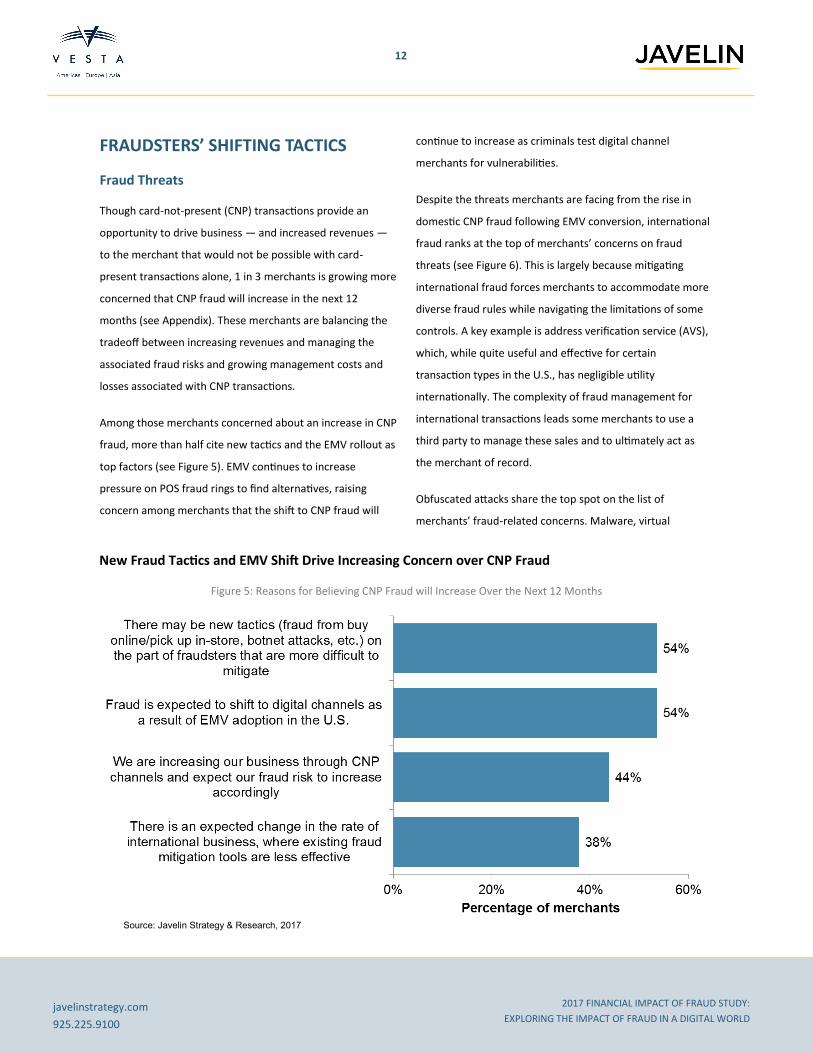
Among those merchants concerned about an increase in CNP
fraud, more than half cite new tactics and the EMV rollout as
top factors (see Figure 5). EMV continues to increase
pressure on POS fraud rings to find alternatives, raising
concern among merchants that the shift to CNP fraud will
continue to increase as criminals test digital channel
merchants for vulnerabilities.
Despite the threats merchants are facing from the rise in
domestic CNP fraud following EMV conversion, international
fraud ranks at the top of merchants’ concerns on fraud
threats (see Figure 6). This is largely because mitigating
international fraud forces merchants to accommodate more
diverse fraud rules while navigating the limitations of some
controls. A key example is address verification service (AVS),
which, while quite useful and effective for certain
transaction types in the U.S., has negligible utility
internationally. The complexity of fraud management for
international transactions leads some merchants to use a
third party to manage these sales and to ultimately act as
the merchant of record.
Obfuscated attacks share the top spot on the list of
merchants’ fraud-related concerns. Malware, virtual
New Fraud Tactics and EMV Shift Drive Increasing Concern over CNP Fraud
Figure 5: Reasons for Believing CNP Fraud will Increase Over the Next 12 Months
Source: Javelin Strategy & Research, 2017

2017 FINANCIAL IMPACT OF FRAUD STUDY:
EXPLORING THE IMPACT OF FRAUD IN A DIGITAL WORLD
13
javelinstrategy.com
925.225.9100
machines, and remote access undermine merchants’ ability
to ascertain whether they are dealing with a known
legitimate customer, on a known device, in a trusted
location, or instead dealing with a criminal. By their very
design, these types of attacks disguise the fingerprint or
location of the customer’s device, undermining the tools that
merchants rely on to mitigate fraud.
Interestingly, physical goods merchants’ top concern is
account takeover fraud, while hybrid and digital goods
merchants are most concerned about international fraud,
obfuscated attacks, and friendly fraud. The concern on
account takeover among physical goods merchants is
intriguing given that these merchants have the additional
validation point of a physical address to protect against fraud
attempts. Their concern may be due to increasing
sophistication among fraudsters at introducing fraudulent
physical addresses but more likely is due to the rise of
innovative delivery techniques like buy online, pick up in-
store.
Controlling International Fraud and Fraud from Obfuscated Devices is Keeping Merchants Up at Night
Figure 6: Percentage Rating Threats “Very” to “Extremely Difficult” by Merchant Type
“They aren’t one-offs working by themselves.
Instead, they are criminal syndicates. There
are larger concerns outside of that – they have
gotten really good, and we would hate to see
that used for other purposes such as terror or
other security risks.”
- Fraud executive, digital goods
Source: Javelin Strategy & Research, 2017

2017 FINANCIAL IMPACT OF FRAUD STUDY:
EXPLORING THE IMPACT OF FRAUD IN A DIGITAL WORLD
14
javelinstrategy.com
925.225.9100
A key area of concern, particularly for digital goods
merchants, is automated attacks (also known as credential
stuffing). This type of fraud targets existing merchant
accounts, eliminating the need for criminals to directly
compromise card information. Automated attacks are fueled
by large-scale password breaches, and there is a high
probability of password reuse across accounts even with
several-year-old breaches. Fraudsters feed credentials into
scripts that automatically target the largest financial
institutions and merchants.
The growing popularity among consumers of buy online, pick
up in-store (BOPIS), offered by large retailers such as Wal-
Mart, Target, and Home Depot, has merchants concerned as
well. Consumers like BOPIS as it allows them to avoid
shipping fees and provides the convenience of having the
item ready for pickup without the wait for delivery.
Fraudsters, however, are continuing to rely on and take
advantage of BOPIS as an intermediate step between POS
and CNP fraud, relying on an established network of runners
to pick up goods purchased online rather than having to
navigate the process of having products delivered and
potentially setting off a merchant’s fraud controls.
Merchants Increase Use of 2FA, but at Same Time Increase Reliance on Broken Usernames and Passwords
Figure 7: Authentication Used for Customer Account Access (2016-17)
“Our account ID is email address, so obviously
people are using the same passwords, so we
see that. We have fraud rules specifically
around certain attributes being changed
around an order, such as adding a new ad-
dress on the account, different address than
accountholder, etc.”
- Fraud executive, digital goods
Source: Javelin Strategy & Research, 2017

2017 FINANCIAL IMPACT OF FRAUD STUDY:
EXPLORING THE IMPACT OF FRAUD IN A DIGITAL WORLD
15
javelinstrategy.com
925.225.9100
Concerns about CNP fraud are complicated by the fact that
new — and often less sophisticated — merchants continue
to flood the digital channel and offer customers the ability to
create online accounts. Their first authentication tool is the
weak pair of username and password, used by 75% of
merchants in 2017, up from 65% in 2016. The choice of
username and password is an understandable one in spite of
its shortcomings, given consumer familiarity and comfort
level with this authentication approach.
As merchants are in no position to eliminate passwords,
defending against automated attacks requires them to invest
in a variety of supplemental controls such as:
Device recognition — identifying devices associated
with botnets and blocking suspicious access attempts
Offering authentication solutions that cannot be easily
breached or replayed (e.g., non-text-based one-time
passwords and biometrics)
Minimizing information provided to fraudsters in
unsuccessful attempts — if criminals know the
username is correct but the password is not, they can
initiate additional attacks, possibly using password reset
pathways
2017 FINANCIAL IMPACT OF FRAUD STUDY:
EXPLORING THE IMPACT OF FRAUD IN A DIGITAL WORLD
16
javelinstrategy.com
925.225.9100
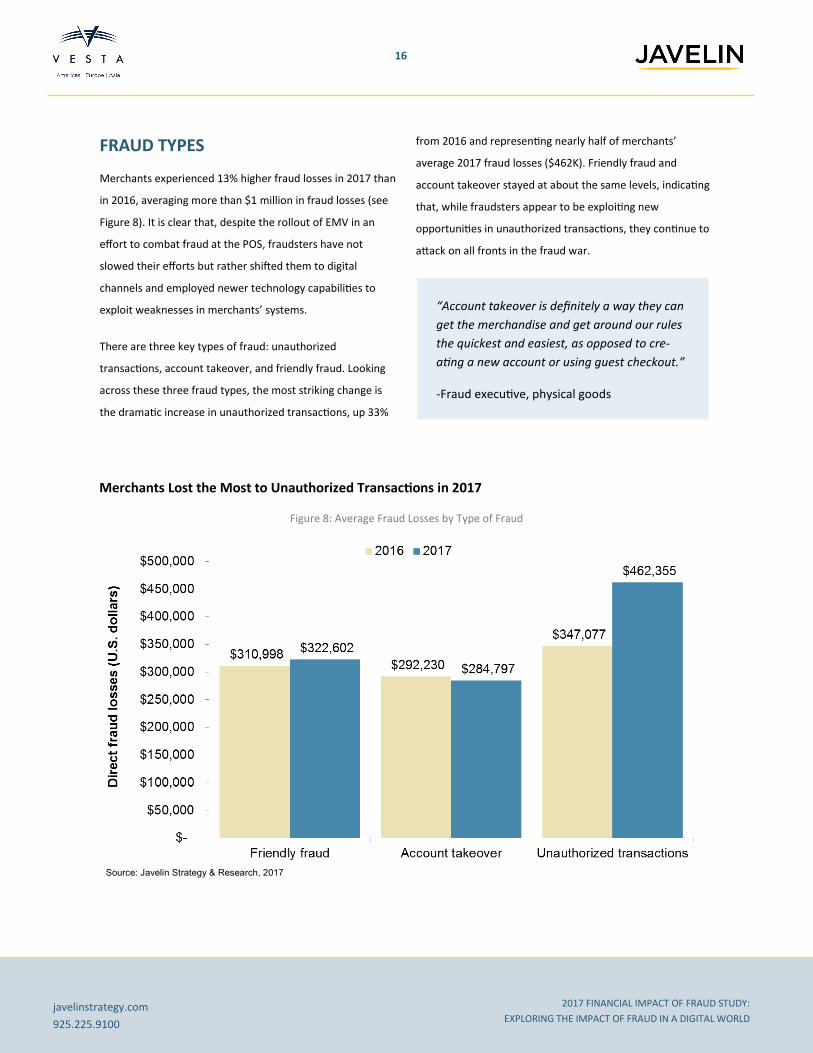
FRAUD TYPES Merchants experienced 13% higher fraud losses in 2017 than
in 2016, averaging more than $1 million in fraud losses (see
Figure 8). It is clear that, despite the rollout of EMV in an
effort to combat fraud at the POS, fraudsters have not
slowed their efforts but rather shifted them to digital
channels and employed newer technology capabilities to
exploit weaknesses in merchants’ systems.
There are three key types of fraud: unauthorized
transactions, account takeover, and friendly fraud. Looking
across these three fraud types, the most striking change is
the dramatic increase in unauthorized transactions, up 33%
from 2016 and representing nearly half of merchants’
average 2017 fraud losses ($462K). Friendly fraud and
account takeover stayed at about the same levels, indicating
that, while fraudsters appear to be exploiting new
opportunities in unauthorized transactions, they continue to
attack on all fronts in the fraud war.
Merchants Lost the Most to Unauthorized Transactions in 2017
Figure 8: Average Fraud Losses by Type of Fraud
“Account takeover is definitely a way they can
get the merchandise and get around our rules
the quickest and easiest, as opposed to cre-
ating a new account or using guest checkout.”
-Fraud executive, physical goods
Source: Javelin Strategy & Research, 2017

2017 FINANCIAL IMPACT OF FRAUD STUDY:
EXPLORING THE IMPACT OF FRAUD IN A DIGITAL WORLD
17
javelinstrategy.com
925.225.9100
Unauthorized transactions Unauthorized transactions are made possible through the
use of stolen card or payment credentials, which allow
fraudsters to pose as the customer to purchase merchandise
on the stolen card or payment account. As criminals migrate
from the POS as a result of the rollout of EMV, e-commerce
merchants are being increasingly targeted, resulting in a
flood of unauthorized transactions over the past 12 months.
Unauthorized transactions have become a larger proportion
of losses than in 2016, representing 40% or more of losses
across all merchant segments (see Figure 9).
Criminals who were already in the channel are compounding
the challenge as they become more sophisticated. They are
taking advantage of technologies such as VPNs and virtual
machines to disguise their locations and devices. These new
technologies have combined with results from breaches and
malware targeting CNP card data, with the result that credit
card and debit card numbers are now the most
compromised type of data, impacting 70% of data breach
victims.
In addition, the ongoing EMV transition has left some
physical goods merchants exposed to fraud losses at the
point of sale that they had not previously been responsible
for. These merchant locations make attractive targets for
criminals looking to conduct fraudulent magnetic stripe
payment card transactions. This has driven up the rate of
unauthorized transactions for these merchants, though this
is expected to decline in the next few years.
Unauthorized Transactions Have Become a Larger Problem
Figure 9: Percentage of Fraud Losses by Type of Fraud
32% 30% 34% 28% 32% 32% 31% 29%
30%26%
27%26%
30% 24%33%
27%
36%42% 36% 43%
38%40%
34%43%
0%
10%
20%
30%
40%
50%
60%
70%
80%
90%
100%
2016 2017 2016 2017 2016 2017 2016 2017
All merchants Digital goods Physical goods Digital and physicalgoods
Perc
en
tag
e o
f fr
au
d lo
sses
Friendly fraud Account takeover Unauthorized transactions Other
©2017 GA Javelin LLCSource: Javelin Strategy & Research, 2017

2017 FINANCIAL IMPACT OF FRAUD STUDY:
EXPLORING THE IMPACT OF FRAUD IN A DIGITAL WORLD
18
javelinstrategy.com
925.225.9100
Account Takeover (ATO)
Account takeover occurs when a fraudster uses another
person's account information (e.g., username and password)
to obtain products and services using that person’s existing
accounts. This is different from unauthorized transactions in
that the criminal uses the stolen account data to take control
of the person’s account by resetting username and
password, often changing the physical address or phone
number listed on the account as well to prevent the
legitimate accountholder from discovering the theft. Social
engineering plays a large role in account takeover, whether it
be targeted at gathering personal information from the
legitimate accountholder or at bypassing the controls of the
issuer or merchant. While ATO may represent a smaller
proportion of total fraud losses than in 2016, this fraud type
still accounts for an average of $285K in annual fraud losses
for merchants (see Figure 8).
Impacting merchants’ ability to fight ATO is the rise of
secondary account takeover, in which criminals compromise
non-financial accounts to facilitate account takeover of
merchant or financial accounts. One popular target of
secondary account takeover is mobile accounts, by which
criminals can intercept alerts, password resets, and SMS-
delivered one-time passwords. They can then use this
information to figure out usernames and passwords, to
successfully address knowledge-based authentication
questions, or to initiate password resets, giving them full
access to the targeted accounts. Mobile account takeover
has been growing in recent years, with twice as many
consumers having their mobile phone accounts taken over in
2016 compared with 2015.
Account takeover often takes longer to detect than other
fraud types, as it can be more difficult to confirm there was
actually fraudulent activity. It takes an average of 53 days to
detect account takeover fraud vs. an average of 30 days
across all fraud types. Often consumers do not realize ATO
has happened until their account is emptied or their credit
card is over the credit limit. Knowledge-based authentication
questions may not fully distinguish between the real
customer and the fraudster if the latter has obtained
sufficient data on the real customer to successfully answer
the questions.
Device recognition technologies, session analytics, and
behaviometrics can be effective methods of combating
account takeover fraud. A primary benefit of these methods
is that they remain largely invisible to the customer, thereby
contributing to fraud prevention with minimal disruption to
the customer shopping experience. However, leveraging
these newer fraud management techniques requires
merchants — most frequently digital goods merchants — to
increase their fraud technology spending to facilitate real-
time integration into their authorization systems.
Friendly Fraud Friendly fraud occurs when the fraudsters are the actual
cardholders. This type of fraud arises through a combination
of factors. First and most egregious is the intentional,
premeditated abuse of the chargeback system, amounting to
a sort of cyber-shoplifting.
Less egregious but no less impactful is a response to buyer’s
remorse in which legitimate customers change their mind
about a purchase and instead of returning the purchased
item to the merchant for a refund choose to contact their
issuer to dispute the transaction. This approach can be easier
for the customer, often involving merely clicking the
“dispute” button on the issuer’s website, while at the same
time bypassing merchant return and refund policies.
2017 FINANCIAL IMPACT OF FRAUD STUDY:
EXPLORING THE IMPACT OF FRAUD IN A DIGITAL WORLD
19
javelinstrategy.com
925.225.9100
Unintentional purchases and unrecognized purchases are
also major contributors to friendly fraud. Often consumers
will see a charge on their credit card statement and not
recognize the merchant or the amount of the charge.
Purchases may be unrecognizable due to unclear merchant
names on transaction registers or to differences in
transaction dates vs. posting dates. Unintentional purchases
can result from shopping cart errors, accidental clicking on
the “purchase” button, or through children’s use of in-app
purchases.
Chargebacks initiated following legitimate purchases pose a
consistent problem for merchants, with average losses of
$323K in 2017, up 4% from 2016. Preventing friendly fraud
poses a notable challenge because, as the buyer is the
legitimate accountholder, the person will pass all fraud
prevention/identity proofing challenges. It can be time-
consuming and expensive for a merchant to fight a
chargeback claim, and quite often the merchant will just
choose to take the loss as the least costly option. Beyond
pure cost considerations, these cases need to be handled
with kid gloves to avoid alienating good customers, which
undoubtedly forces merchants to absorb friendly fraud
losses.
“The real change we are seeing is in friendly
fraud. These guys are double-dipping or simply
lost and go on to dispute it. I feel like card
companies aren’t doing enough, but we eat
the loss.”
- Fraud executive, digital goods
2017 FINANCIAL IMPACT OF FRAUD STUDY:
EXPLORING THE IMPACT OF FRAUD IN A DIGITAL WORLD
20
javelinstrategy.com
925.225.9100
MERCHANTS’ RESPONSE TO FRAUD
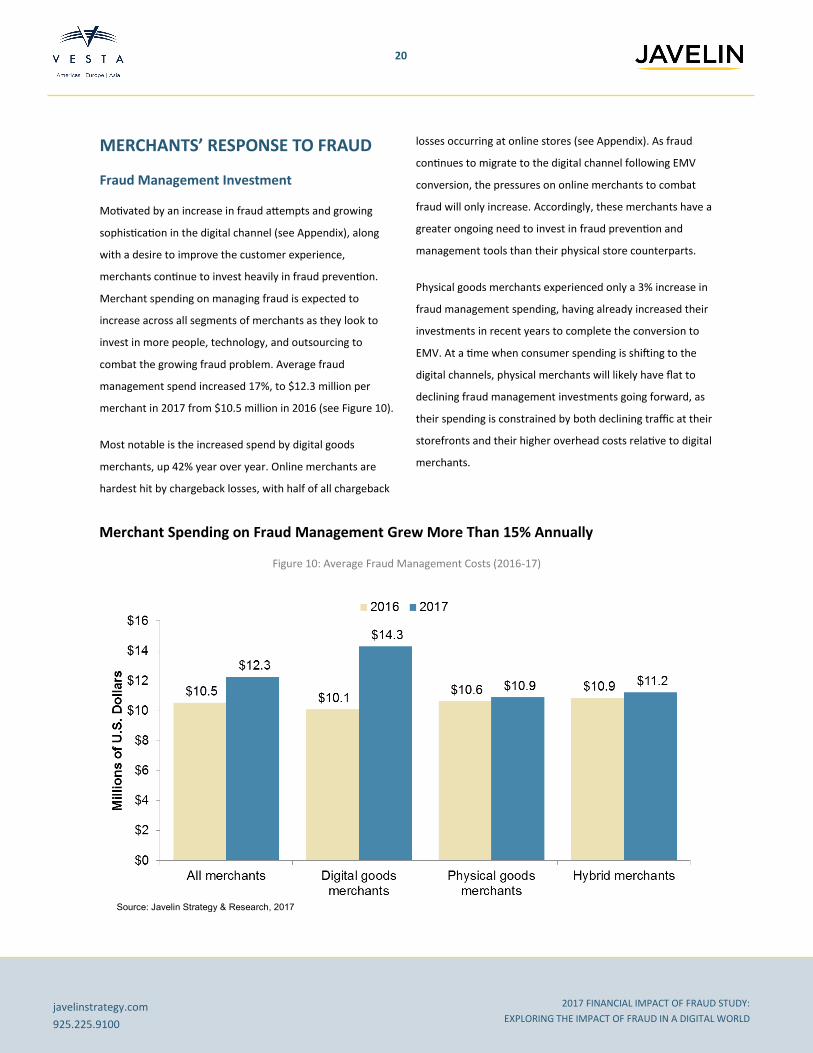
Fraud Management Investment Motivated by an increase in fraud attempts and growing
sophistication in the digital channel (see Appendix), along
with a desire to improve the customer experience,
merchants continue to invest heavily in fraud prevention.
Merchant spending on managing fraud is expected to
increase across all segments of merchants as they look to
invest in more people, technology, and outsourcing to
combat the growing fraud problem. Average fraud
management spend increased 17%, to $12.3 million per
merchant in 2017 from $10.5 million in 2016 (see Figure 10).
Most notable is the increased spend by digital goods
merchants, up 42% year over year. Online merchants are
hardest hit by chargeback losses, with half of all chargeback
losses occurring at online stores (see Appendix). As fraud
continues to migrate to the digital channel following EMV
conversion, the pressures on online merchants to combat
fraud will only increase. Accordingly, these merchants have a
greater ongoing need to invest in fraud prevention and
management tools than their physical store counterparts.
Physical goods merchants experienced only a 3% increase in
fraud management spending, having already increased their
investments in recent years to complete the conversion to
EMV. At a time when consumer spending is shifting to the
digital channels, physical merchants will likely have flat to
declining fraud management investments going forward, as
their spending is constrained by both declining traffic at their
storefronts and their higher overhead costs relative to digital
merchants.
Merchant Spending on Fraud Management Grew More Than 15% Annually
Figure 10: Average Fraud Management Costs (2016-17)
Source: Javelin Strategy & Research, 2017
2017 FINANCIAL IMPACT OF FRAUD STUDY:
EXPLORING THE IMPACT OF FRAUD IN A DIGITAL WORLD
21
javelinstrategy.com
925.225.9100
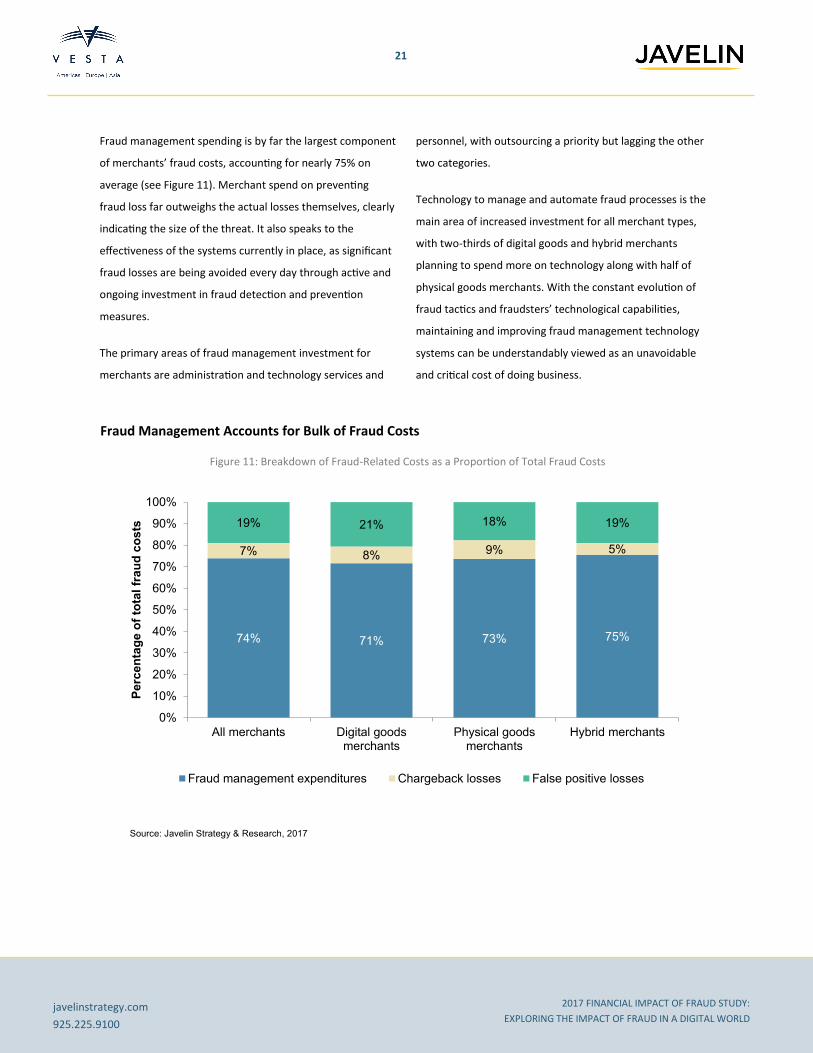
Fraud management spending is by far the largest component
of merchants’ fraud costs, accounting for nearly 75% on
average (see Figure 11). Merchant spend on preventing
fraud loss far outweighs the actual losses themselves, clearly
indicating the size of the threat. It also speaks to the
effectiveness of the systems currently in place, as significant
fraud losses are being avoided every day through active and
ongoing investment in fraud detection and prevention
measures.
The primary areas of fraud management investment for
merchants are administration and technology services and
personnel, with outsourcing a priority but lagging the other
two categories.
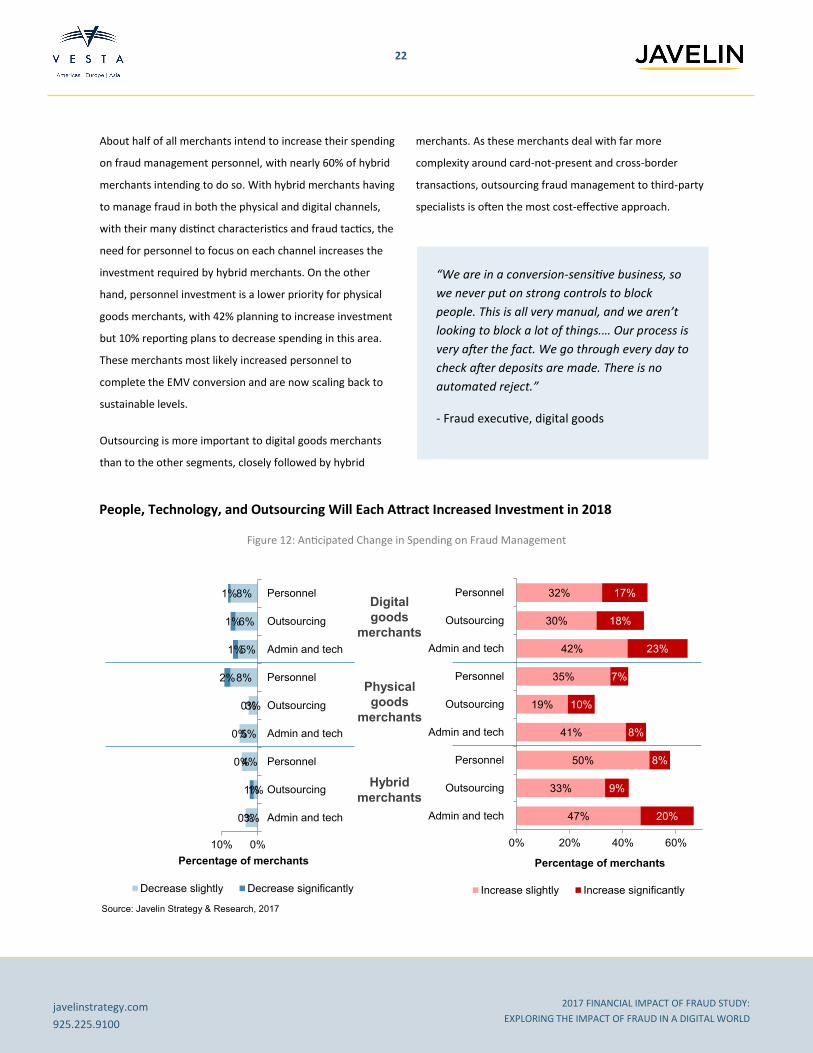
Technology to manage and automate fraud processes is the
main area of increased investment for all merchant types,
with two-thirds of digital goods and hybrid merchants
planning to spend more on technology along with half of
physical goods merchants. With the constant evolution of
fraud tactics and fraudsters’ technological capabilities,
maintaining and improving fraud management technology
systems can be understandably viewed as an unavoidable
and critical cost of doing business.
Fraud Management Accounts for Bulk of Fraud Costs
Figure 11: Breakdown of Fraud-Related Costs as a Proportion of Total Fraud Costs
74% 71% 73% 75%
7% 8% 9% 5%
19% 21% 18% 19%
0%
10%
20%
30%
40%
50%
60%
70%
80%
90%
100%
All merchants Digital goodsmerchants
Physical goodsmerchants
Hybrid merchants
Pe
rce
nta
ge
of
tota
l fr
au
d c
os
ts
Fraud management expenditures Chargeback losses False positive losses
Source: Javelin Strategy & Research, 2017
2017 FINANCIAL IMPACT OF FRAUD STUDY:
EXPLORING THE IMPACT OF FRAUD IN A DIGITAL WORLD
22
javelinstrategy.com
925.225.9100
About half of all merchants intend to increase their spending
on fraud management personnel, with nearly 60% of hybrid
merchants intending to do so. With hybrid merchants having
to manage fraud in both the physical and digital channels,
with their many distinct characteristics and fraud tactics, the
need for personnel to focus on each channel increases the
investment required by hybrid merchants. On the other
hand, personnel investment is a lower priority for physical
goods merchants, with 42% planning to increase investment
but 10% reporting plans to decrease spending in this area.
These merchants most likely increased personnel to
complete the EMV conversion and are now scaling back to
sustainable levels.
Outsourcing is more important to digital goods merchants
than to the other segments, closely followed by hybrid
merchants. As these merchants deal with far more
complexity around card-not-present and cross-border
transactions, outsourcing fraud management to third-party
specialists is often the most cost-effective approach.
People, Technology, and Outsourcing Will Each Attract Increased Investment in 2018
Figure 12: Anticipated Change in Spending on Fraud Management
3%
1%
4%
5%
3%
8%
5%
6%
8%
0%
1%
0%
0%
0%
2%
1%
1%
1%
0%10%
Admin and tech
Outsourcing
Personnel
Admin and tech
Outsourcing
Personnel
Admin and tech
Outsourcing
Personnel
Decrease slightly Decrease significantly
47%
33%
50%
41%
19%
35%
42%
30%
32%
20%
9%
8%
8%
10%
7%
23%
18%
17%
0% 20% 40% 60%
Admin and tech
Outsourcing
Personnel
Admin and tech
Outsourcing
Personnel
Admin and tech
Outsourcing
Personnel
Increase slightly Increase significantly
Percentage of merchants
Digital
goods
merchants
Physical
goods
merchants
Hybrid
merchants
Percentage of merchants
“We are in a conversion-sensitive business, so
we never put on strong controls to block
people. This is all very manual, and we aren’t
looking to block a lot of things.… Our process is
very after the fact. We go through every day to
check after deposits are made. There is no
automated reject.”
- Fraud executive, digital goods
Source: Javelin Strategy & Research, 2017
2017 FINANCIAL IMPACT OF FRAUD STUDY:
EXPLORING THE IMPACT OF FRAUD IN A DIGITAL WORLD
23
javelinstrategy.com
925.225.9100
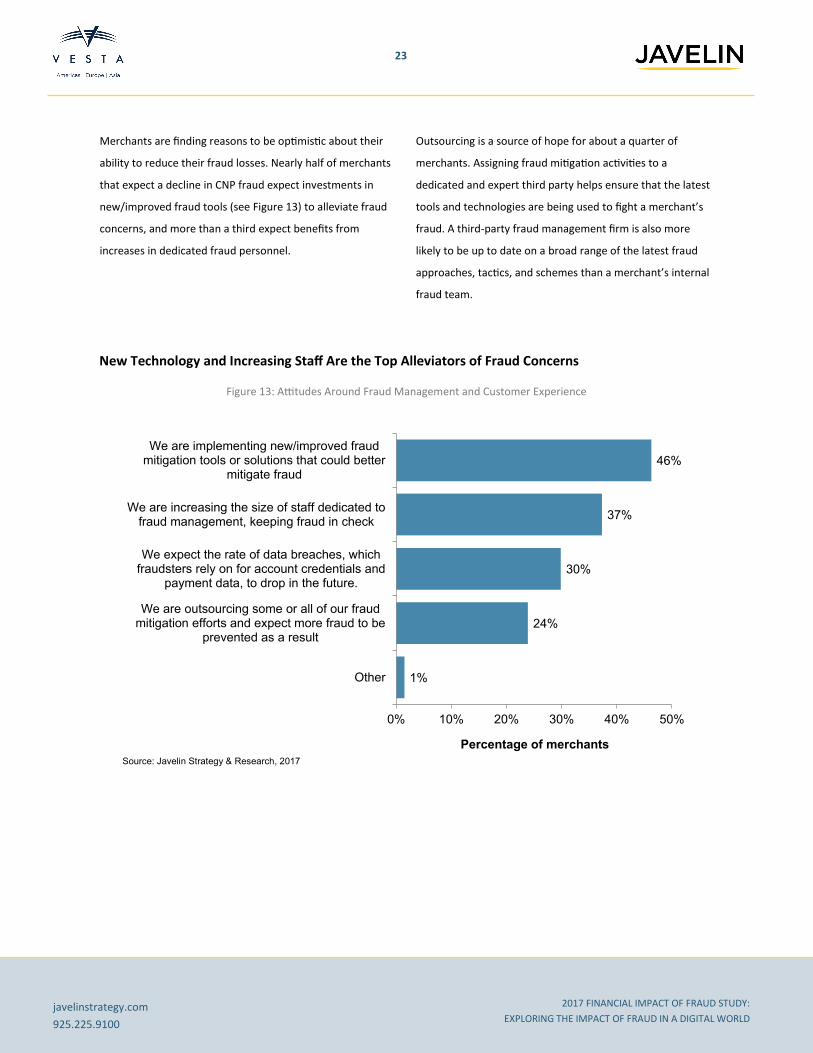
Merchants are finding reasons to be optimistic about their
ability to reduce their fraud losses. Nearly half of merchants
that expect a decline in CNP fraud expect investments in
new/improved fraud tools (see Figure 13) to alleviate fraud
concerns, and more than a third expect benefits from
increases in dedicated fraud personnel.
Outsourcing is a source of hope for about a quarter of
merchants. Assigning fraud mitigation activities to a
dedicated and expert third party helps ensure that the latest
tools and technologies are being used to fight a merchant’s
fraud. A third-party fraud management firm is also more
likely to be up to date on a broad range of the latest fraud
approaches, tactics, and schemes than a merchant’s internal
fraud team.
New Technology and Increasing Staff Are the Top Alleviators of Fraud Concerns
Figure 13: Attitudes Around Fraud Management and Customer Experience
1%
24%
30%
37%
46%
0% 10% 20% 30% 40% 50%
Other
We are outsourcing some or all of our fraudmitigation efforts and expect more fraud to be
prevented as a result
We expect the rate of data breaches, whichfraudsters rely on for account credentials and
payment data, to drop in the future.
We are increasing the size of staff dedicated tofraud management, keeping fraud in check
We are implementing new/improved fraudmitigation tools or solutions that could better
mitigate fraud
Percentage of merchants
Source: Javelin Strategy & Research, 2017
2017 FINANCIAL IMPACT OF FRAUD STUDY:
EXPLORING THE IMPACT OF FRAUD IN A DIGITAL WORLD
24
javelinstrategy.com
925.225.9100
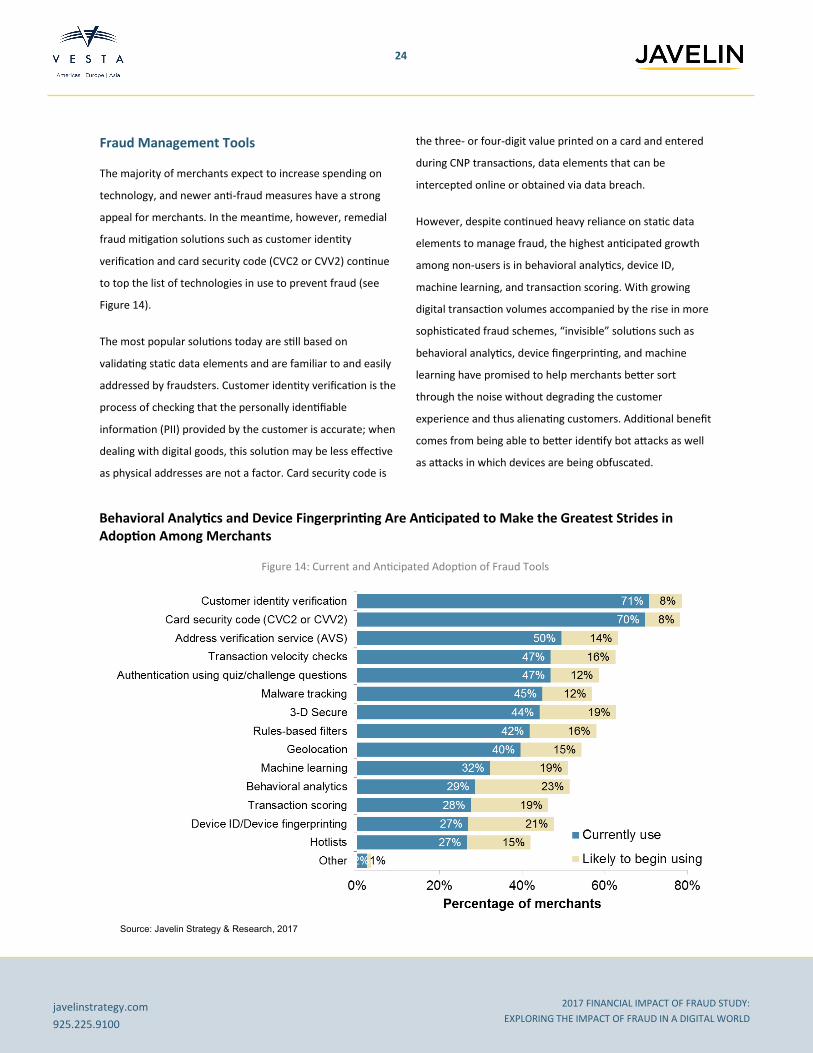
Fraud Management Tools The majority of merchants expect to increase spending on
technology, and newer anti-fraud measures have a strong
appeal for merchants. In the meantime, however, remedial
fraud mitigation solutions such as customer identity
verification and card security code (CVC2 or CVV2) continue
to top the list of technologies in use to prevent fraud (see
Figure 14).
The most popular solutions today are still based on
validating static data elements and are familiar to and easily
addressed by fraudsters. Customer identity verification is the
process of checking that the personally identifiable
information (PII) provided by the customer is accurate; when
dealing with digital goods, this solution may be less effective
as physical addresses are not a factor. Card security code is
the three- or four-digit value printed on a card and entered
during CNP transactions, data elements that can be
intercepted online or obtained via data breach.
However, despite continued heavy reliance on static data
elements to manage fraud, the highest anticipated growth
among non-users is in behavioral analytics, device ID,
machine learning, and transaction scoring. With growing
digital transaction volumes accompanied by the rise in more
sophisticated fraud schemes, “invisible” solutions such as
behavioral analytics, device fingerprinting, and machine
learning have promised to help merchants better sort
through the noise without degrading the customer
experience and thus alienating customers. Additional benefit
comes from being able to better identify bot attacks as well
as attacks in which devices are being obfuscated.
Behavioral Analytics and Device Fingerprinting Are Anticipated to Make the Greatest Strides in Adoption Among Merchants
Figure 14: Current and Anticipated Adoption of Fraud Tools
Source: Javelin Strategy & Research, 2017

2017 FINANCIAL IMPACT OF FRAUD STUDY:
EXPLORING THE IMPACT OF FRAUD IN A DIGITAL WORLD
25
javelinstrategy.com
925.225.9100
At the same time, behavioral analytics and machine learning
are among the solutions that merchants were most likely to
test but not adopt or to adopt but discontinue (see Figure
15). This implies that, despite the promise of reduced fraud
combined with minimizing customer inconvenience, the
return on investment may still be insufficient relative to
more traditional solutions.
Similarly, transaction scoring is the least sticky product
among merchants, with nearly a third of merchants having
tested or adopted the solution but no longer using it.
Considering that transaction scoring traditionally involves or
even requires participation on the part of the merchant to
set rules, a lack of in-house expertise can effectively
undermine the ROI of this solution as well. Despite the
planned investments in personnel discussed above, this
dynamic is unlikely to change as 6 in 10 merchants believe
that fraud training is too expensive (see Appendix).
Nearly a Third of Merchants Test or Adopt Advanced Solutions but Do Not Continue Using Them
Figure 15: Discontinuation or Failure to Adopt Fraud Solutions
Source: Javelin Strategy & Research, 2017
2017 FINANCIAL IMPACT OF FRAUD STUDY:
EXPLORING THE IMPACT OF FRAUD IN A DIGITAL WORLD
26
javelinstrategy.com
925.225.9100
3D Secure (3DS) 3-D Secure, branded as MasterCard SecureCode, Verified by
Visa, and Amex SafeKey, is one of the most widely used fraud
prevention solutions globally, in large part due to mandates
requiring its usage for online transactions. In many markets,
3-D Secure offers strong benefits to merchants in terms of
lower interchange rates, fraud liability shift to the issuer, and
subsequently fewer chargebacks. However, there is a risk of
higher issuer declines as well as higher shopping cart
abandonment due to the additional authentication step the
solution introduces into the checkout process. Merchants
must balance the fraud prevention benefits against the
potential loss of sales.
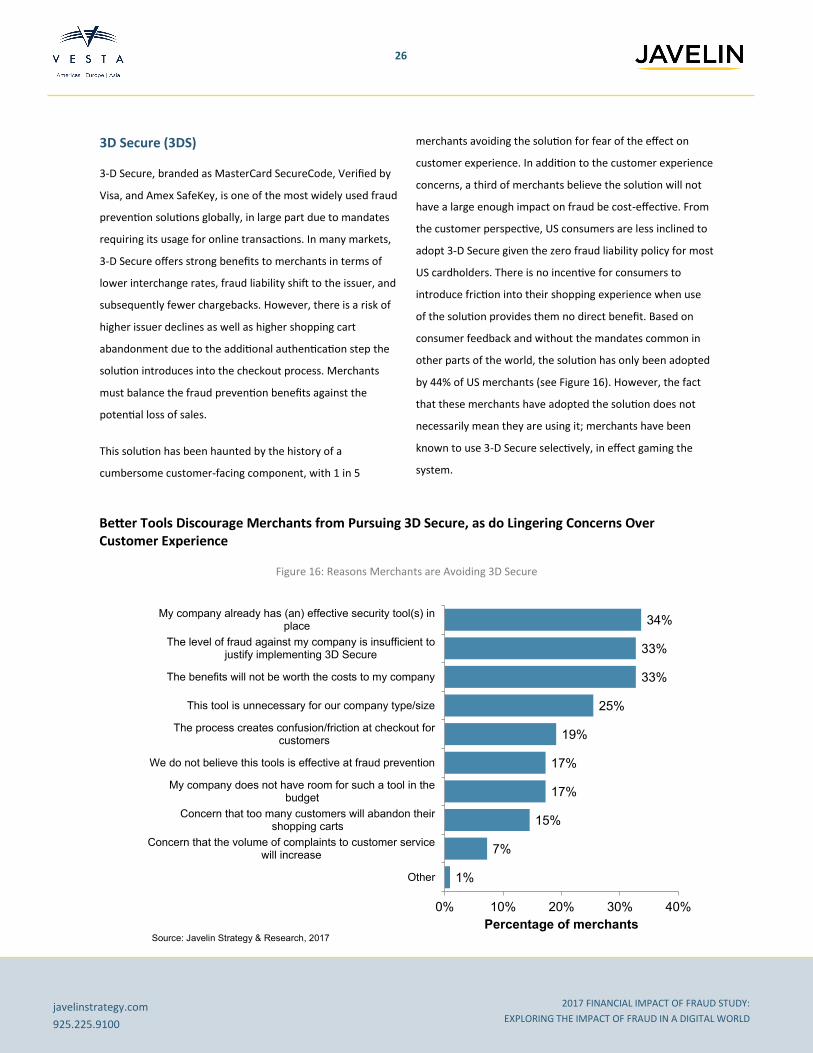
This solution has been haunted by the history of a
cumbersome customer-facing component, with 1 in 5
merchants avoiding the solution for fear of the effect on
customer experience. In addition to the customer experience
concerns, a third of merchants believe the solution will not
have a large enough impact on fraud be cost-effective. From
the customer perspective, US consumers are less inclined to
adopt 3-D Secure given the zero fraud liability policy for most
US cardholders. There is no incentive for consumers to
introduce friction into their shopping experience when use
of the solution provides them no direct benefit. Based on
consumer feedback and without the mandates common in
other parts of the world, the solution has only been adopted
by 44% of US merchants (see Figure 16). However, the fact
that these merchants have adopted the solution does not
necessarily mean they are using it; merchants have been
known to use 3-D Secure selectively, in effect gaming the
system.
Better Tools Discourage Merchants from Pursuing 3D Secure, as do Lingering Concerns Over Customer Experience
Figure 16: Reasons Merchants are Avoiding 3D Secure
1%
7%
15%
17%
17%
19%
25%
33%
33%
34%
0% 10% 20% 30% 40%
Other
Concern that the volume of complaints to customer servicewill increase
Concern that too many customers will abandon theirshopping carts
My company does not have room for such a tool in thebudget
We do not believe this tools is effective at fraud prevention
The process creates confusion/friction at checkout forcustomers
This tool is unnecessary for our company type/size
The benefits will not be worth the costs to my company
The level of fraud against my company is insufficient tojustify implementing 3D Secure
My company already has (an) effective security tool(s) inplace
Percentage of merchantsSource: Javelin Strategy & Research, 2017
2017 FINANCIAL IMPACT OF FRAUD STUDY:
EXPLORING THE IMPACT OF FRAUD IN A DIGITAL WORLD
27
javelinstrategy.com
925.225.9100
3D Secure 2.0 has evolved the 3D Secure technology to
enable a real-time, risk-based authentication approach that
merchants can use to send transaction attributes that the
issuer can use to authenticate customers more accurately
without asking for a static password or slowing down the
transaction unless the risk analysis shows a need. According
to some reports, these improvements in the 3-D Secure
process have helped to decrease the pain at the point of
(virtual) sale, reducing the number of transactions subject to
additional authentication and decreasing abandonment
relative to the earlier version of 3D Secure.
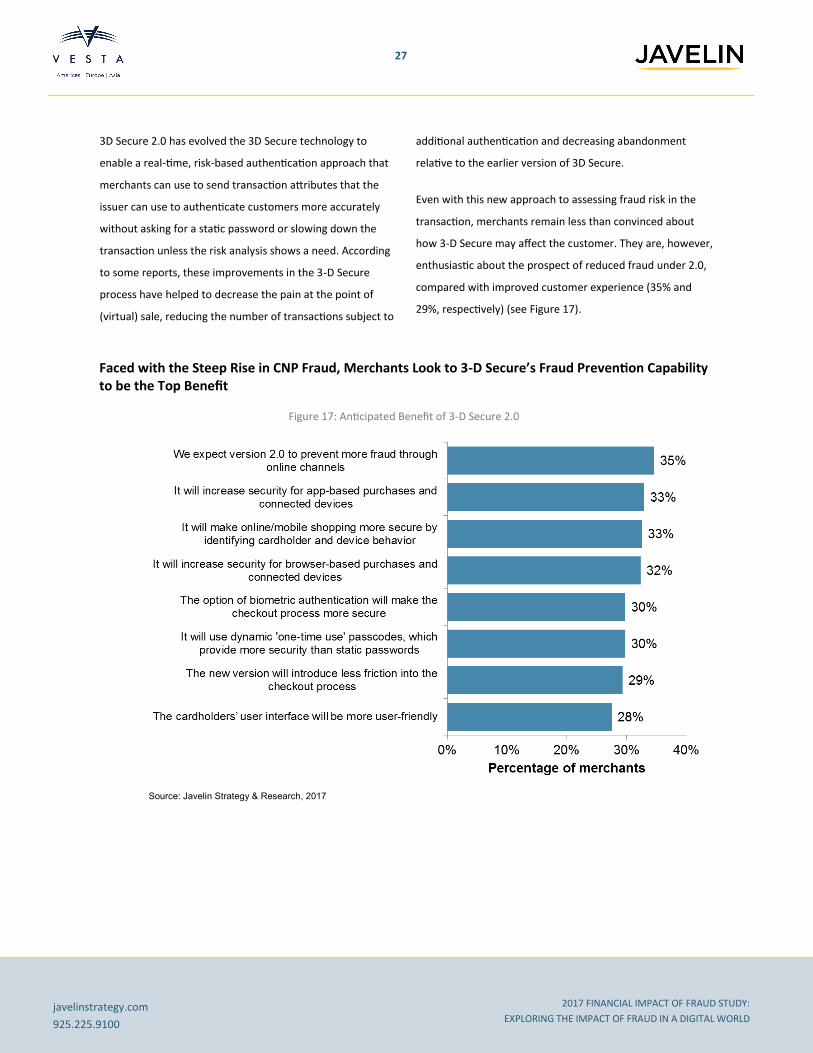
Even with this new approach to assessing fraud risk in the
transaction, merchants remain less than convinced about
how 3-D Secure may affect the customer. They are, however,
enthusiastic about the prospect of reduced fraud under 2.0,
compared with improved customer experience (35% and
29%, respectively) (see Figure 17).
Faced with the Steep Rise in CNP Fraud, Merchants Look to 3-D Secure’s Fraud Prevention Capability to be the Top Benefit
Figure 17: Anticipated Benefit of 3-D Secure 2.0
Source: Javelin Strategy & Research, 2017
2017 FINANCIAL IMPACT OF FRAUD STUDY:
EXPLORING THE IMPACT OF FRAUD IN A DIGITAL WORLD
28
javelinstrategy.com
925.225.9100
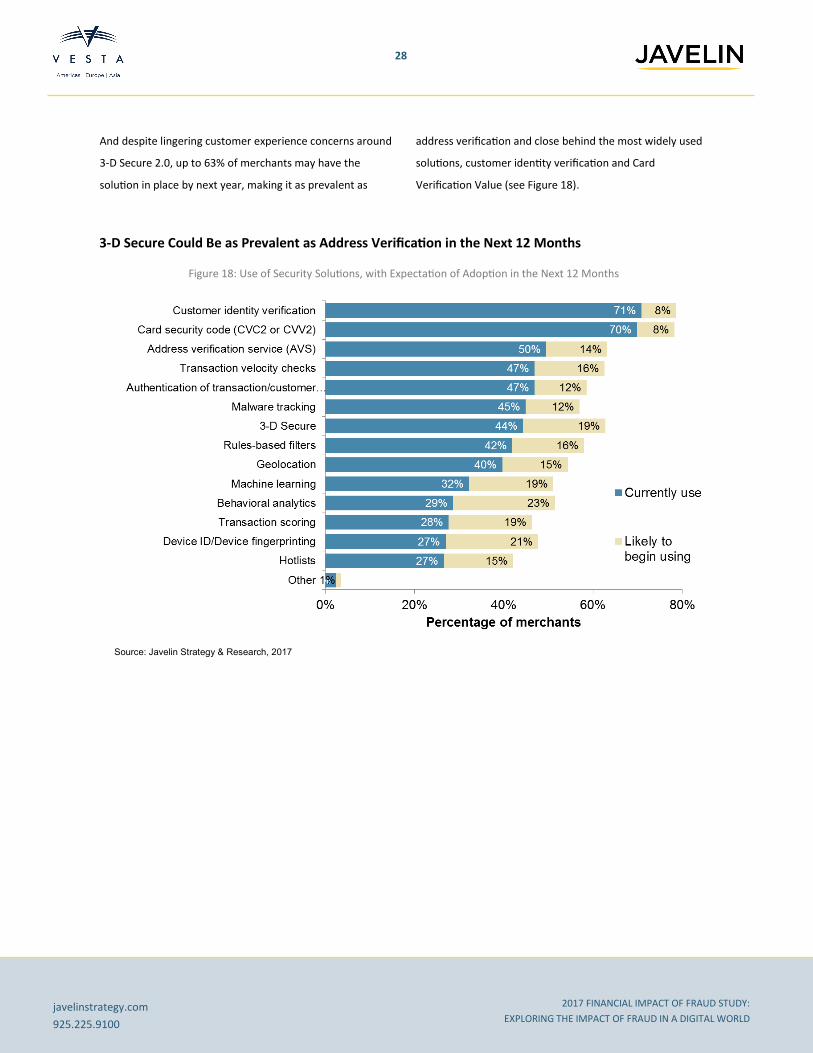
And despite lingering customer experience concerns around
3-D Secure 2.0, up to 63% of merchants may have the
solution in place by next year, making it as prevalent as
address verification and close behind the most widely used
solutions, customer identity verification and Card
Verification Value (see Figure 18).
3-D Secure Could Be as Prevalent as Address Verification in the Next 12 Months
Figure 18: Use of Security Solutions, with Expectation of Adoption in the Next 12 Months
Source: Javelin Strategy & Research, 2017
2017 FINANCIAL IMPACT OF FRAUD STUDY:
EXPLORING THE IMPACT OF FRAUD IN A DIGITAL WORLD
29
javelinstrategy.com
925.225.9100
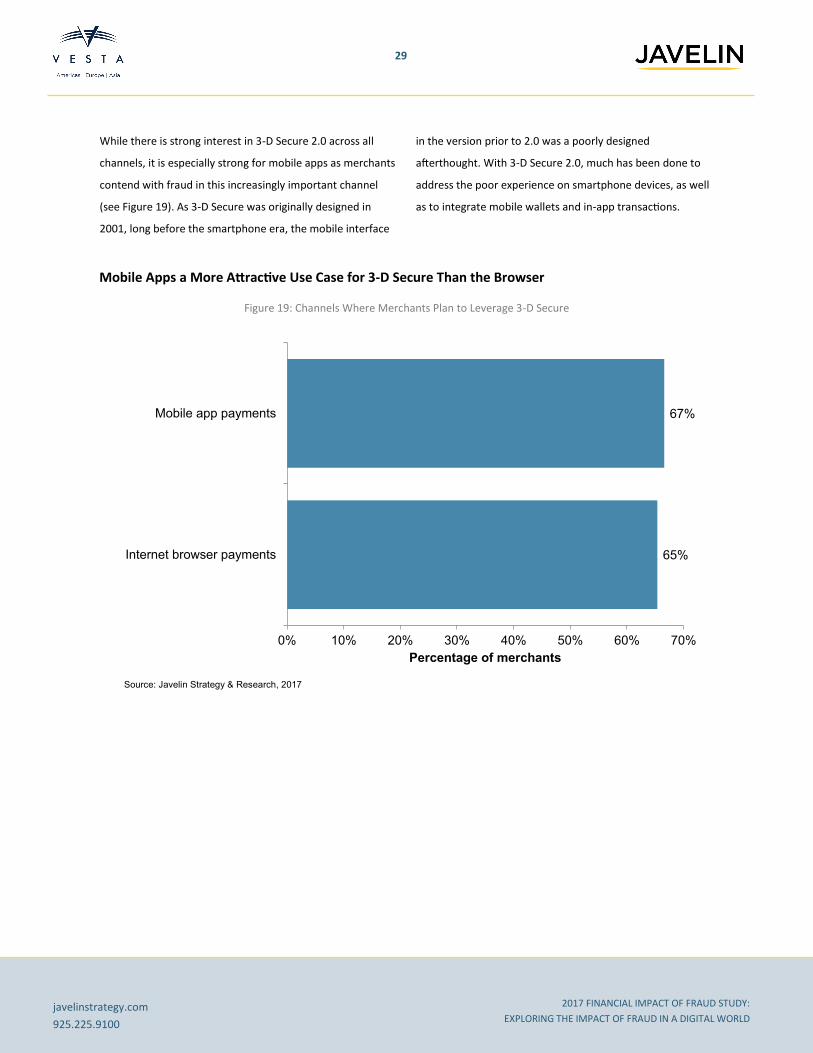
While there is strong interest in 3-D Secure 2.0 across all
channels, it is especially strong for mobile apps as merchants
contend with fraud in this increasingly important channel
(see Figure 19). As 3-D Secure was originally designed in
2001, long before the smartphone era, the mobile interface
in the version prior to 2.0 was a poorly designed
afterthought. With 3-D Secure 2.0, much has been done to
address the poor experience on smartphone devices, as well
as to integrate mobile wallets and in-app transactions.
Mobile Apps a More Attractive Use Case for 3-D Secure Than the Browser
Figure 19: Channels Where Merchants Plan to Leverage 3-D Secure
65%
67%
0% 10% 20% 30% 40% 50% 60% 70%
Internet browser payments
Mobile app payments
Percentage of merchants
Source: Javelin Strategy & Research, 2017

2017 FINANCIAL IMPACT OF FRAUD STUDY:
EXPLORING THE IMPACT OF FRAUD IN A DIGITAL WORLD
30
javelinstrategy.com
925.225.9100
CONCLUSION As consumers increasingly purchase goods and services via
the online and mobile channels, merchants are offering a
broader range of products, purchasing methods, and delivery
options to attract consumers to their websites and apps.
While this presents merchants a tremendous opportunity to
grow revenues and attract new customer segments, it also is
combining with the impact of the EMV conversion at the
point of sale to push more fraud activity online.
As the risks to their businesses increase, merchants must
dedicate a growing portion of operational spend to
mitigating fraud activity, striking a balance between securing
and authenticating customer transactions and maintaining
the customer experience and maximizing profitability. Many
merchants will consider outsourcing their fraud
management activities to a dedicated and expert third party,
enabling those merchants to effectively combat fraud while
focusing more on attracting new customers and growing
their revenues via emerging channels.
Fraud tools and techniques evolve very quickly, and
merchants can expect fraud attempts to continue to increase
both in number and in type. Fraudsters have the motives,
skills, and tools they need to represent a considerable
challenge to merchants' fraud controls and ability to
accurately authorize a transaction.
Fraud management will continue to be a critical area of
investment for the foreseeable future.

2017 FINANCIAL IMPACT OF FRAUD STUDY:
EXPLORING THE IMPACT OF FRAUD IN A DIGITAL WORLD
31
javelinstrategy.com
925.225.9100
APPENDIX
Concern over CNP Fraud Has Increased Among 1 in 3 Merchants
Figure 21: Change in concern about CNP fraud past 12 months
Merchants on Average Spent Almost $1 Million More on Fraud-Related Costs in 2017
Figure 20: Average total fraud costs in dollars (2016-17 )
Source: Javelin Strategy & Research, 2017
Source: Javelin Strategy & Research, 2017

2017 FINANCIAL IMPACT OF FRAUD STUDY:
EXPLORING THE IMPACT OF FRAUD IN A DIGITAL WORLD
32
javelinstrategy.com
925.225.9100
Online Merchants Still Hit Hardest by Online Fraud
Figure 22: Percentage of all chargeback losses by channel
Source: Javelin Strategy & Research, 2017
Merchants are Generally Pessimistic About Training Staff for Fraud
Figure 23: Attitudes around training fraud management staff
Source: Javelin Strategy & Research, 2017

2017 FINANCIAL IMPACT OF FRAUD STUDY:
EXPLORING THE IMPACT OF FRAUD IN A DIGITAL WORLD
33
javelinstrategy.com
925.225.9100
Growth in Digital Channel Fraud Top Motivator for Increased Investment
Figure 24: Reasons for increased fraud management investment
Source: Javelin Strategy & Research, 2017

2017 FINANCIAL IMPACT OF FRAUD STUDY:
EXPLORING THE IMPACT OF FRAUD IN A DIGITAL WORLD
34
javelinstrategy.com
925.225.9100
METHODOLOGY
In June 2017, Vesta retained Javelin Strategy & Research to conduct a comprehensive independent study on merchant
spending on all operations associated with fraud and chargeback management.
Javelin Strategy & Research conducted an online survey of 497 e-commerce merchants earning $1 million or more annually,
falling into key merchant segments:
142 merchants selling only digital goods
155 merchants selling only physical goods
200 hybrid merchants, selling both types of goods
Additionally, in-depth interviews were conducted with industry executives in roles influencing operational expenses related to
fraud and chargeback management.
2017 FINANCIAL IMPACT OF FRAUD STUDY:
EXPLORING THE IMPACT OF FRAUD IN A DIGITAL WORLD
35
javelinstrategy.com
925.225.9100
ABOUT JAVELIN STRATEGY & RESEARCH Javelin Strategy & Research, a Greenwich Associates LLC company, is a research-based consulting firm that
advises its clients to make smarter business decisions in a digital financial world. Our analysts offer unbiased,
actionable insights and unearth opportunities that help financial institutions, government entities, payment
companies, merchants, and other technology providers sustainably increase profits.
Authors: Al Pascual, Research Director and Head of Fraud & Security
Kyle Marchini, Senior Analyst, Fraud & Security
Ginger Schmeltzer, Senior Advisor
Publication Date: September 2017
ABOUT VESTA Vesta Corporation is the global leader of revenue-generating payment solutions for enterprise partners in the
telecommunications, media, financial, and digital sectors. The company’s patented fraud protection technology is
proven to increase conversion and acceptance while eliminating fraudulent transactions and merchant liability.
Vesta has been recognized as a leading innovator in payments technologies, holds multiple patents, and has won
numerous awards as one of America’s fastest growing companies. Founded in 1995 and headquartered in
Portland, Vesta’s operations span the Americas, Europe and Asia. For more information, visit trustvesta.com.
© 2017 GA Javelin LLC (dba as “Javelin Strategy & Research”) is a Greenwich Associates LLC company. All rights reserved. No portion of these materials may be copied, reproduced, distributed or transmitted, electronically or otherwise, to external parties or publicly without the written permission of Javelin Strategy & Research. GA Javelin may also have rights in certain other marks used in these materials.