Embed Size (px)
Citation preview
HAL Id: hal-00925070https://hal.inria.fr/hal-00925070
Submitted on 8 Jan 2014
HAL is a multi-disciplinary open accessarchive for the deposit and dissemination of sci-entific research documents, whether they are pub-lished or not. The documents may come fromteaching and research institutions in France orabroad, or from public or private research centers.
L’archive ouverte pluridisciplinaire HAL, estdestinée au dépôt et à la diffusion de documentsscientifiques de niveau recherche, publiés ou non,émanant des établissements d’enseignement et derecherche français ou étrangers, des laboratoirespublics ou privés.
Interaction with Information for Visual Reasoning(Dagstuhl Seminar 13352)
David Ebert, Brian Fisher, Petra Isenberg
To cite this version:David Ebert, Brian Fisher, Petra Isenberg. Interaction with Information for Visual Reasoning(Dagstuhl Seminar 13352). Dagstuhl Reports, Schloss Dagstuhl–Leibniz-Zentrum fuer Informatik,2013, 3 (8), pp.151–167. <http://drops.dagstuhl.de/opus/volltexte/2013/4346>. <10.4230/Da-gRep.3.8.151>. <hal-00925070>
Report from Dagstuhl Seminar 13352
Interaction with Information for Visual Reasoning
Edited by
David S. Ebert1, Brian D. Fisher2, and Petra Isenberg3
1 Purdue University, US, [email protected]
2 Simon Fraser University – Surrey, CA, [email protected]
3 INRIA Saclay – Île-de-France – Orsay, FR, [email protected]
Abstract
From August 26–August 30, 2013 Seminar 13352 was held at Dagstuhl on the topic of “Interaction
with Information for Visual Reasoning.” The seminar brought together a group of cognitive sci-
entists, psychologists, and computer scientists in the area of scientific visualization, information
visualization, and visual analytics who were carefully selected for their theoretical and method-
ological capabilities and history of interdisciplinary collaboration. During the seminar seven
discussion groups were formed during which the role of interaction for visualization was carefully
reflected on. We discussed in particular the value, structure, and different types of interaction but
also how to evaluate visualization and the idea of ’narrative’ as applied to visual analytics. This
report documents the program and short summaries of the discussion groups for the seminar.
Seminar 26.–30. August, 2013 – www.dagstuhl.de/13352
1998 ACM Subject Classification H.5.2 [Information Interfaces and Presentation]: User In-
terfaces – Graphical User Interfaces (GUI), I.3.6 [Computer Graphics]: Methodology and
Techniques – Interaction Techniques
Keywords and phrases Interaction, visualization, visual analytics, cognitive science, psychology
Digital Object Identifier 10.4230/DagRep.3.8.151
1 Executive Summary
David S. Ebert
Brian D. Fisher
Petra Isenberg
License Creative Commons BY 3.0 Unported license© David S. Ebert, Brian D. Fisher, and Petra Isenberg
Scientific and information visualization researchers routinely build and evaluate interactive
visualization systems to aid human reasoning. However, this work is often disconnected from
the methodological and theoretical tools developed by the cognitive and social sciences to
address the complexities of human thought processes. Those tools and methods can help
us to understand human perception and understanding of data visualization, but typically
do not address how rich interaction with computational processes could be engineered to
support better decision-making. Yet, an increasing number of researchers are turning to the
question of how to best engineer interaction techniques for visualization and how to best
study and understand their influence on cognition, insight formation, and also efficiency and
effectiveness of work. The goal of this seminar was to bring together researchers in cognitive
science and psychology with researchers in the field of visualization to discuss the value that
interaction can bring to visualization, how best to study it, and how research on interaction
in cognitive science can be best integrated into visualization tools and systems to the benefit
of domain experts or casual users of these tools.
Except where otherwise noted, content of this report is licensed
under a Creative Commons BY 3.0 Unported license
Interaction with Information for Visual Reasoning, Dagstuhl Reports, Vol. 3, Issue 8, pp. 151–167
Editors: David S. Ebert, Brian D. Fisher, and Petra Isenberg
Dagstuhl Reports
Schloss Dagstuhl – Leibniz-Zentrum für Informatik, Dagstuhl Publishing, Germany
152 13352 – Interaction with Information for Visual Reasoning
2 Table of Contents
Executive SummaryDavid S. Ebert, Brian D. Fisher, and Petra Isenberg . . . . . . . . . . . . . . . . . 151
About the Seminar . . . . . . . . . . . . . . . . . . . . . . . . . . . . . . . . . . . . 154
Overview of Talks . . . . . . . . . . . . . . . . . . . . . . . . . . . . . . . . . . . . . 156
Interacting with Information – Overview of Past & Current Work
Simon Attfield . . . . . . . . . . . . . . . . . . . . . . . . . . . . . . . . . . . . . . . 156
Cognitive Science of Representational Systems
Peter C.-H. Cheng . . . . . . . . . . . . . . . . . . . . . . . . . . . . . . . . . . . . 157
Flexible Perception of Structure in Viz & Education
Steve Franconeri . . . . . . . . . . . . . . . . . . . . . . . . . . . . . . . . . . . . . 157
A Sample of Sketching Research in Cognitive Science
Steve Franconeri . . . . . . . . . . . . . . . . . . . . . . . . . . . . . . . . . . . . . 157
Human Interactions in Abstract Visual Spaces
Wayne D. Gray . . . . . . . . . . . . . . . . . . . . . . . . . . . . . . . . . . . . . . 158
Interacting with Visual Representatives
David Kirsh . . . . . . . . . . . . . . . . . . . . . . . . . . . . . . . . . . . . . . . . 158
Sketching and Embodied Cognition
David Kirsh . . . . . . . . . . . . . . . . . . . . . . . . . . . . . . . . . . . . . . . . 158
Toward Systematic Design of Different Interactive Visualization Components
Kamran Sedig . . . . . . . . . . . . . . . . . . . . . . . . . . . . . . . . . . . . . . . 159
Working Groups . . . . . . . . . . . . . . . . . . . . . . . . . . . . . . . . . . . . . 159
Visual Narratives
Simon Attfield, Jörn Kohlhammer, Catherine Plaisant, Margit Pohl, Huamin Qu,
and Michelle X. Zhou . . . . . . . . . . . . . . . . . . . . . . . . . . . . . . . . . . 159
Evaluating Interaction for Visual Reasoning
Anastasia Bezerianos, Mary Czerwinski, Brian D. Fisher, Steve Franconeri, Wayne
Gray, Petra Isenberg, Bongshin Lee, and Jinwook Seo . . . . . . . . . . . . . . . . . 161
The Landscape of Explanations for the Value of Interaction for Visual Reasoning
Sheelagh Carpendale, Anastasia Bezerianos, Peter Cheng, Brian D. Fisher, Steve
Franconeri, Daniel Keefe, Bongshin Lee, and Chris North . . . . . . . . . . . . . . 161
Mixed Initative Interaction
Christopher Collins, Simon Attfield, Fanny Chevalier, Mary Czerwinski, Heidi Lam,
Catherine Plaisant, Christian Tominski, and Michelle X. Zhou . . . . . . . . . . . 162
Conceptual Structures of Interaction for Visual Reasoning
Kelly Gaither, David S. Ebert, Thomas Ertl, Hans Hagen, Petra Isenberg, Tobias
Isenberg, Jörn Kohlhammer, Margit Pohl, and Kamran Sedig . . . . . . . . . . . . 164
Magic Interactions with Information for Visual Reasoning
Daniel Keefe, Sheelagh Carpendale, Peter Cheng, Fanny Chevalier, Christopher
Collins, Tobias Isenberg, David Kirsh, Heidi Lam, Chris North, Kamran Sedig,
Christian Tominski, and Xiaoru Yuan . . . . . . . . . . . . . . . . . . . . . . . . . 165

David S. Ebert, Brian D. Fisher, and Petra Isenberg 153
Crowd Interaction in Visual Reasoning
David Kirsh, Jinwook Seo, and Xiaoru Yuan . . . . . . . . . . . . . . . . . . . . . . 166
Participants . . . . . . . . . . . . . . . . . . . . . . . . . . . . . . . . . . . . . . . . . 167
13352
154 13352 – Interaction with Information for Visual Reasoning
3 About the Seminar
Participants
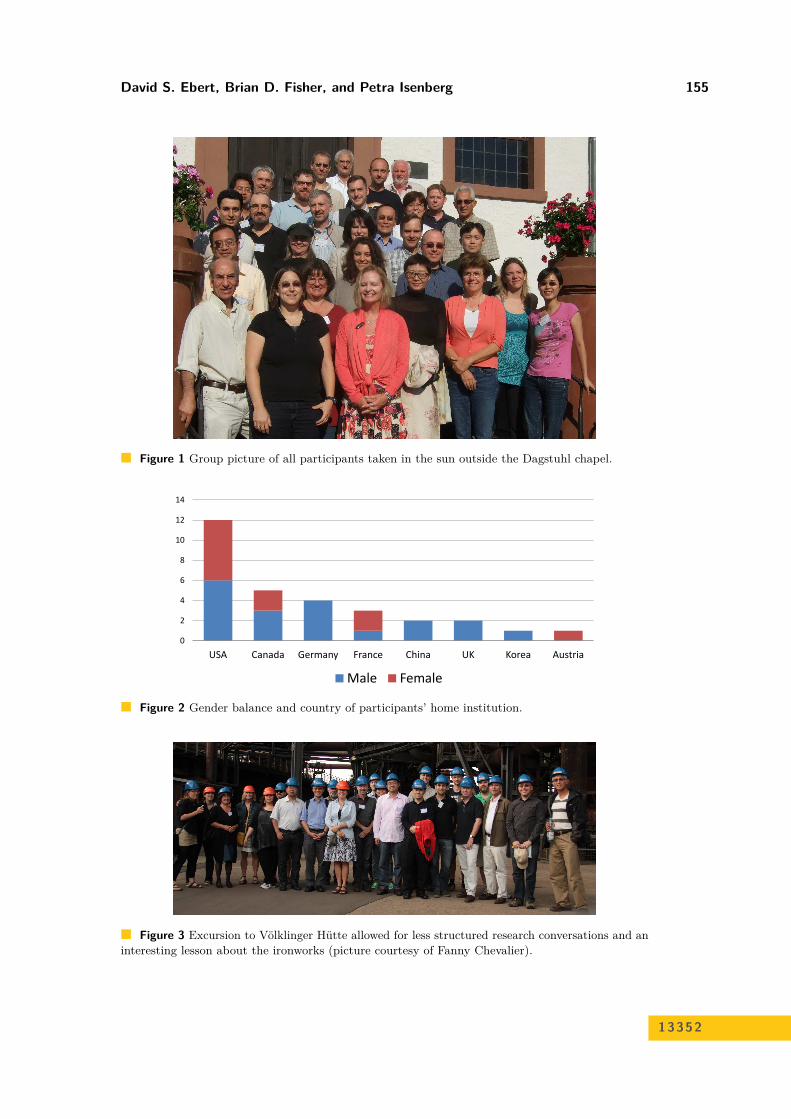
The seminar brought together a diverse group of international cognitive scientists, psycholo-
gists, and computer scientists in the area of scientific visualization, information visualization,
visual analytics, and human computer interaction. All participants (see Figure 1) were
carefully selected for their theoretical and methodological capabilities and history of interdis-
ciplinary collaboration. Thirty participants joined the seminar, out of which seven had a
background in psychology and the remainder were primarily computer scientists in training.
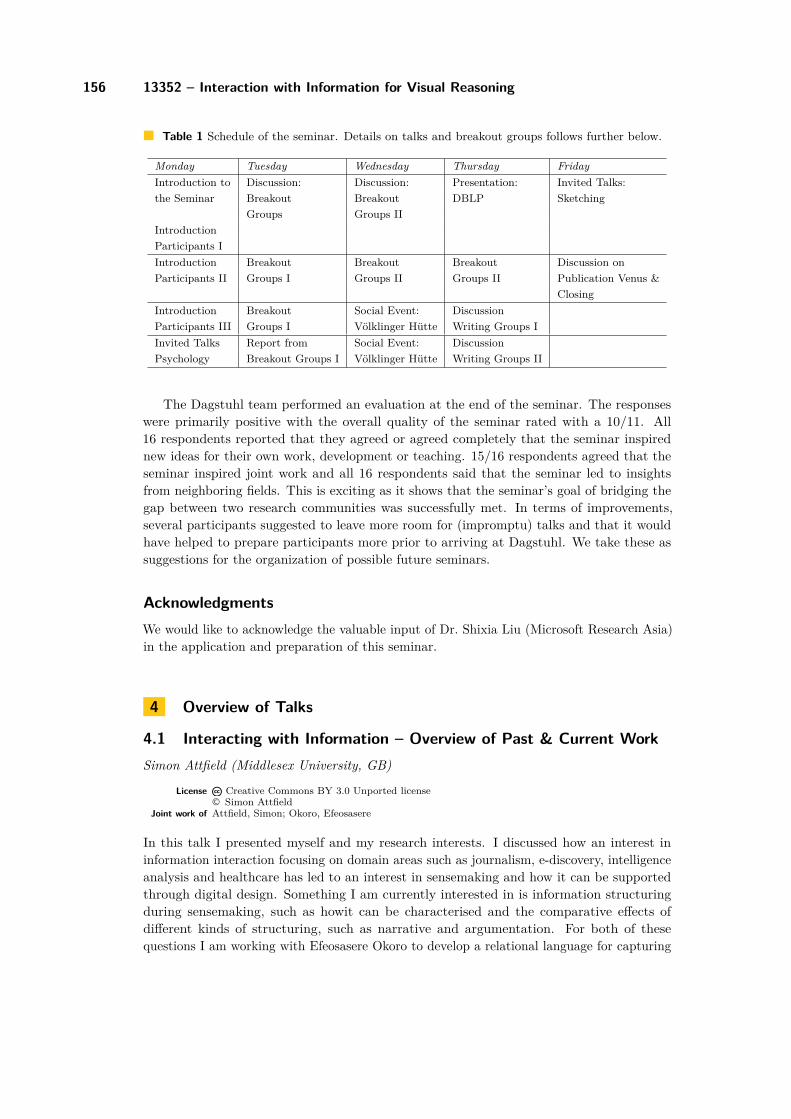
Eleven participants were female and three in total came from industry. For about one third
of participants this seminar was their first Dagstuhl event. Figure 2 shows gender balance
and country statistics for all participants.
Format
The seminar followed a format largely based on breakout groups. The first day of the seminar
involved short introduction slides for each participant with longer 15 minute invited talks
from the domains of cognitive science and psychology. Tuesday the first four breakout groups
discussed topics on mixed initiative interaction, crowd interaction, the value of interaction,
and conceptual structures of interaction. Each breakout group was comprised of participants
with mixed backgrounds in computer science and cognitive science/psychology and had the
goal to work on a specific problem related to the title of the breakout group. Wednesday,
each participant switched to a second breakout group on topics: evaluation of interaction,
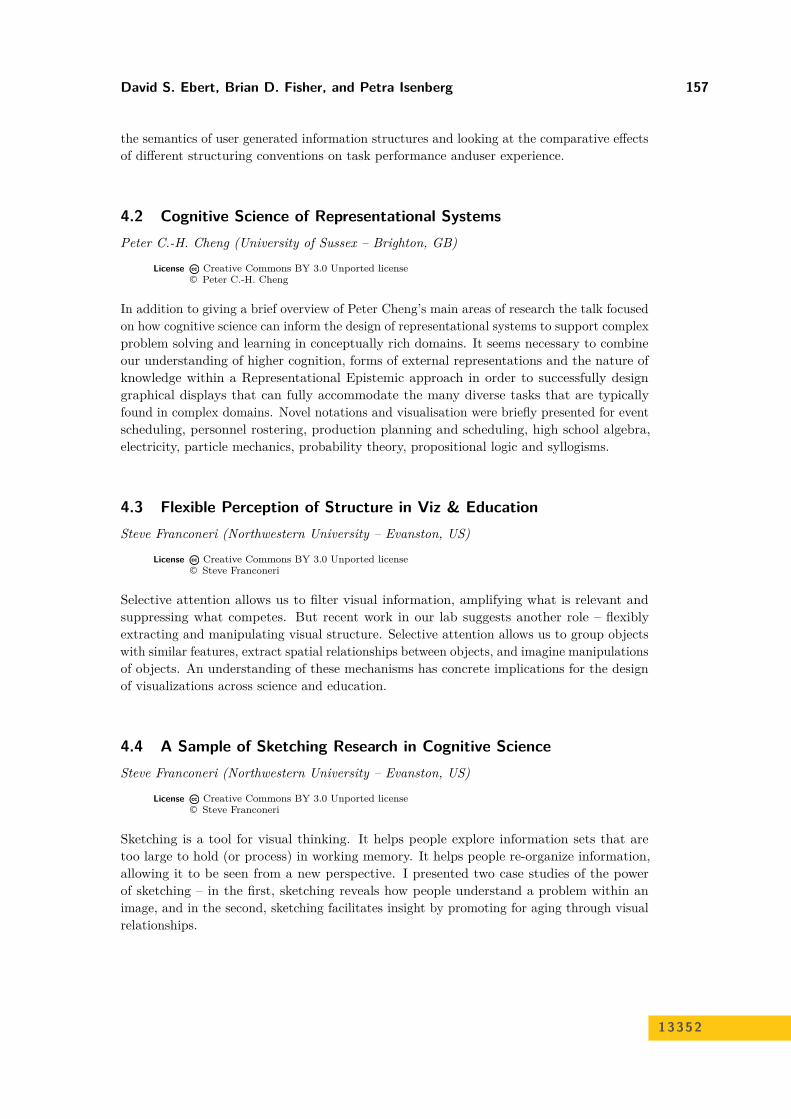
magical interaction, and visual narrative. Almost all participants then went together on
a social event to visit the Völklinger Hütte (see Figure 3). Thursday morning we heard a
presentation about DBLP, and continued with the second breakout group sessions. Thursday
ended with discussion in the breakout groups about publishable results from the seminar
and working towards establishing a publication plan of action. These were then presented in
front of the whole group. Two invited talks started the day on Friday which ended with a
discussion on publication venues that would be beneficial for both the computer scientists
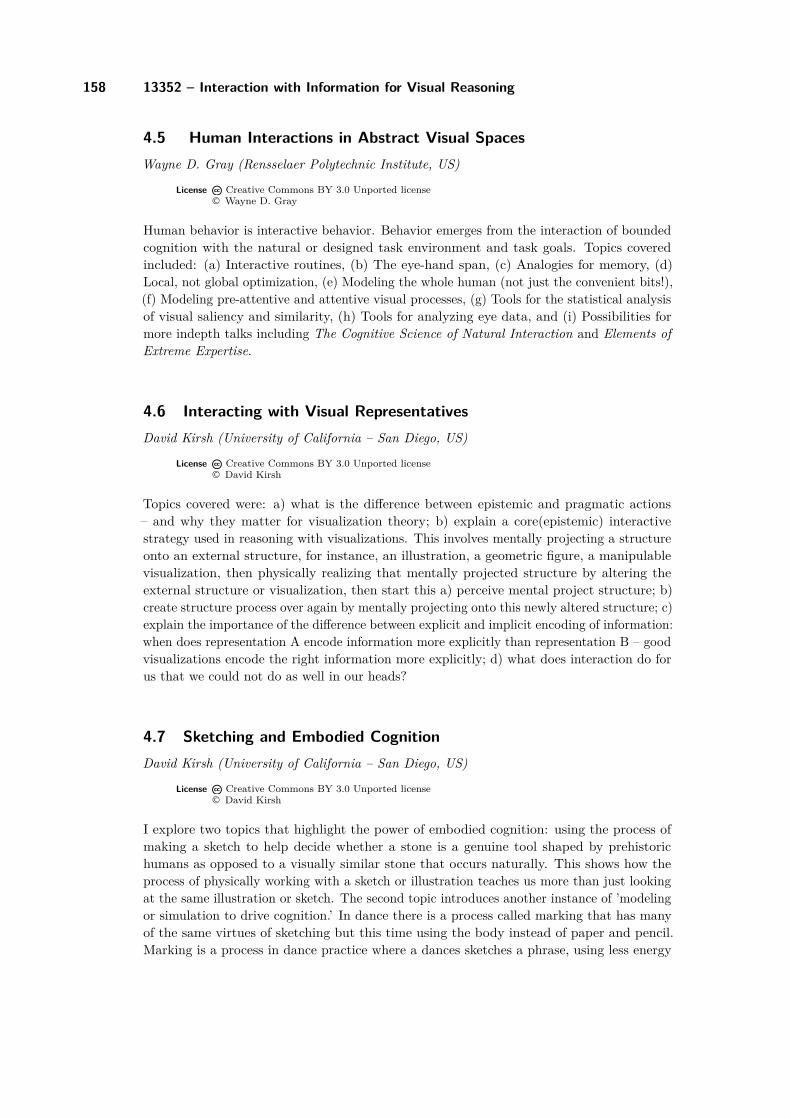
and cognitive scientists/psychologist. Table 1 gives an overview of the seminar schedule and
the following list includes the titles of the individual breakout groups.
Mixed Initiative Interaction
Crowd Interaction in Visual Reasoning
Magical Interaction
Evaluating Interaction for Visual Reasoning
Conceptual Structures of Interaction for Visual Reasoning
Visual Narrative
The Landscape of Explanations for the Value of Interaction for Visual Reasoning
Output
The organizers and participants planned to publish results from the breakout groups as
a Morgan Claypool mini series on interaction for which David Ebert is the series editor.
Working groups have been invited to publish their results there. Furthermore we are in contact
with an international journal for an open-call special issue to further push the importance of
interaction for visual reasoning as an emerging topic in the domain of visualization.
David S. Ebert, Brian D. Fisher, and Petra Isenberg 155
Figure 1 Group picture of all participants taken in the sun outside the Dagstuhl chapel.
0
2
4
6
8
10
12
14
USA Canada Germany France China UK Korea Austria
Male Female
Figure 2 Gender balance and country of participants’ home institution.
Figure 3 Excursion to Völklinger Hütte allowed for less structured research conversations and aninteresting lesson about the ironworks (picture courtesy of Fanny Chevalier).
13352
156 13352 – Interaction with Information for Visual Reasoning
Table 1 Schedule of the seminar. Details on talks and breakout groups follows further below.
Monday Tuesday Wednesday Thursday Friday
Introduction to Discussion: Discussion: Presentation: Invited Talks:
the Seminar Breakout Breakout DBLP Sketching
Groups Groups II
Introduction
Participants I
Introduction Breakout Breakout Breakout Discussion on
Participants II Groups I Groups II Groups II Publication Venus &
Closing
Introduction Breakout Social Event: Discussion
Participants III Groups I Völklinger Hütte Writing Groups I
Invited Talks Report from Social Event: Discussion
Psychology Breakout Groups I Völklinger Hütte Writing Groups II
The Dagstuhl team performed an evaluation at the end of the seminar. The responses
were primarily positive with the overall quality of the seminar rated with a 10/11. All
16 respondents reported that they agreed or agreed completely that the seminar inspired
new ideas for their own work, development or teaching. 15/16 respondents agreed that the
seminar inspired joint work and all 16 respondents said that the seminar led to insights
from neighboring fields. This is exciting as it shows that the seminar’s goal of bridging the
gap between two research communities was successfully met. In terms of improvements,
several participants suggested to leave more room for (impromptu) talks and that it would
have helped to prepare participants more prior to arriving at Dagstuhl. We take these as
suggestions for the organization of possible future seminars.
Acknowledgments
We would like to acknowledge the valuable input of Dr. Shixia Liu (Microsoft Research Asia)
in the application and preparation of this seminar.
4 Overview of Talks
4.1 Interacting with Information – Overview of Past & Current Work
Simon Attfield (Middlesex University, GB)
License Creative Commons BY 3.0 Unported license© Simon Attfield
Joint work of Attfield, Simon; Okoro, Efeosasere
In this talk I presented myself and my research interests. I discussed how an interest in
information interaction focusing on domain areas such as journalism, e-discovery, intelligence
analysis and healthcare has led to an interest in sensemaking and how it can be supported
through digital design. Something I am currently interested in is information structuring
during sensemaking, such as howit can be characterised and the comparative effects of
different kinds of structuring, such as narrative and argumentation. For both of these
questions I am working with Efeosasere Okoro to develop a relational language for capturing
David S. Ebert, Brian D. Fisher, and Petra Isenberg 157
the semantics of user generated information structures and looking at the comparative effects
of different structuring conventions on task performance anduser experience.
4.2 Cognitive Science of Representational Systems
Peter C.-H. Cheng (University of Sussex – Brighton, GB)
License Creative Commons BY 3.0 Unported license© Peter C.-H. Cheng
In addition to giving a brief overview of Peter Cheng’s main areas of research the talk focused
on how cognitive science can inform the design of representational systems to support complex
problem solving and learning in conceptually rich domains. It seems necessary to combine
our understanding of higher cognition, forms of external representations and the nature of
knowledge within a Representational Epistemic approach in order to successfully design
graphical displays that can fully accommodate the many diverse tasks that are typically
found in complex domains. Novel notations and visualisation were briefly presented for event
scheduling, personnel rostering, production planning and scheduling, high school algebra,
electricity, particle mechanics, probability theory, propositional logic and syllogisms.
4.3 Flexible Perception of Structure in Viz & Education
Steve Franconeri (Northwestern University – Evanston, US)
License Creative Commons BY 3.0 Unported license© Steve Franconeri
Selective attention allows us to filter visual information, amplifying what is relevant and
suppressing what competes. But recent work in our lab suggests another role – flexibly
extracting and manipulating visual structure. Selective attention allows us to group objects
with similar features, extract spatial relationships between objects, and imagine manipulations
of objects. An understanding of these mechanisms has concrete implications for the design
of visualizations across science and education.
4.4 A Sample of Sketching Research in Cognitive Science
Steve Franconeri (Northwestern University – Evanston, US)
License Creative Commons BY 3.0 Unported license© Steve Franconeri
Sketching is a tool for visual thinking. It helps people explore information sets that are
too large to hold (or process) in working memory. It helps people re-organize information,
allowing it to be seen from a new perspective. I presented two case studies of the power
of sketching – in the first, sketching reveals how people understand a problem within an
image, and in the second, sketching facilitates insight by promoting for aging through visual
relationships.
13352
158 13352 – Interaction with Information for Visual Reasoning
4.5 Human Interactions in Abstract Visual Spaces
Wayne D. Gray (Rensselaer Polytechnic Institute, US)
License Creative Commons BY 3.0 Unported license© Wayne D. Gray
Human behavior is interactive behavior. Behavior emerges from the interaction of bounded
cognition with the natural or designed task environment and task goals. Topics covered
included: (a) Interactive routines, (b) The eye-hand span, (c) Analogies for memory, (d)
Local, not global optimization, (e) Modeling the whole human (not just the convenient bits!),
(f) Modeling pre-attentive and attentive visual processes, (g) Tools for the statistical analysis
of visual saliency and similarity, (h) Tools for analyzing eye data, and (i) Possibilities for
more indepth talks including The Cognitive Science of Natural Interaction and Elements of
Extreme Expertise.
4.6 Interacting with Visual Representatives
David Kirsh (University of California – San Diego, US)
License Creative Commons BY 3.0 Unported license© David Kirsh
Topics covered were: a) what is the difference between epistemic and pragmatic actions
– and why they matter for visualization theory; b) explain a core(epistemic) interactive
strategy used in reasoning with visualizations. This involves mentally projecting a structure
onto an external structure, for instance, an illustration, a geometric figure, a manipulable
visualization, then physically realizing that mentally projected structure by altering the
external structure or visualization, then start this a) perceive mental project structure; b)
create structure process over again by mentally projecting onto this newly altered structure; c)
explain the importance of the difference between explicit and implicit encoding of information:
when does representation A encode information more explicitly than representation B – good
visualizations encode the right information more explicitly; d) what does interaction do for
us that we could not do as well in our heads?
4.7 Sketching and Embodied Cognition
David Kirsh (University of California – San Diego, US)
License Creative Commons BY 3.0 Unported license© David Kirsh
I explore two topics that highlight the power of embodied cognition: using the process of
making a sketch to help decide whether a stone is a genuine tool shaped by prehistoric
humans as opposed to a visually similar stone that occurs naturally. This shows how the
process of physically working with a sketch or illustration teaches us more than just looking
at the same illustration or sketch. The second topic introduces another instance of ’modeling
or simulation to drive cognition.’ In dance there is a process called marking that has many
of the same virtues of sketching but this time using the body instead of paper and pencil.
Marking is a process in dance practice where a dances sketches a phrase, using less energy
David S. Ebert, Brian D. Fisher, and Petra Isenberg 159
and working on aspects of that phrase rather than performing the whole phrase in all its
complexity and with all the effort and speed required for full out performance. Our study
of marking showed that marking can help a person explore aspects of a movement, one
by one; it also allows a person to bring certain elements or dimensions of the phrase into
focus. This idea that modeling or imperfectly simulating a complex process can lead to
insight that is hard or impossible to obtain by studying the fullprocess is found in practices
other than dance and lithic sketching. In painting artists make practice sketches in order to
explore elements they want to highlight or get just right. By making simplified models they
bring aspects or elements or dimensions of the complex thing they want to paint into better
focus, ensuring they capture features they might otherwise have missed. Attached is a paper
published on marking and other issues related to interactivity “Embodied Cognition and the
Magical Future of Interaction design.”
4.8 Toward Systematic Design of Different Interactive VisualizationComponents
Kamran Sedig (University of Western Ontario, CA)
License Creative Commons BY 3.0 Unported license© Kamran Sedig
Visualization tools can support and enhance the performance of cognitive activities such
as sense making, problem solving, and analytical reasoning. To do so effectively, however,
a human-centered approach to their design and evaluation is required. This presentation
highlights a number of different issues that we have been investigating in order to identify
some of the main components of interactive visualizations in order to develop a systematic
approach for their design and analysis. A few of the issues that are discussed include:
Interaction, interactivity, cognitive activities (i. e., reasoning), and visual representations. A
recent paper dealing with interaction design for visual representations is also uploaded.
5 Working Groups
5.1 Visual Narratives
Simon Attfield (Middlesex University, GB), Jörn Kohlhammer (Fraunhofer IGD – Darmstadt,
DE), Catherine Plaisant (University of Maryland – College Park, US), Margit Pohl (TU
Wien, AT), Huamin Qu (The Hong Kong University of Science & Technology, HK), Michelle
X. Zhou (IBM Almaden Center – San José, US)
License Creative Commons BY 3.0 Unported license© Simon Attfield, Jörn Kohlhammer, Catherine Plaisant, Margit Pohl, Huamin Qu, and MichelleX. Zhou
As a group we explored the application of the notion of ’narrative’ to visual analytics. We
defined narrative as, ’A sequence of events connected in a meaningful structure where the
connecting principles are time, causation, logic, rationale and/or entity relationships.’ We
considered that a ’visual narrative’ is the visual rendering of this, and that an ’Interactive
visual narrative’ is a visual narrative where interaction occurs during construction and/or
presentation. For the construction phase some key considerations are element selection and
13352
160 13352 – Interaction with Information for Visual Reasoning
editing and annotating the narrative. For presentation some key considerations are pace,
branching, overview and detail, and annotation.
We agreed that narrative can bring structure to information and that this can support
comprehension, recall, personal and public audit of an analysis, and also help support analytic
systematicity and influence decisions.
We agreed on at least four kinds of narrative as applied to visual analytics. These are:
Stories in the data – Stories which recount temporal and/or causal sequences within data.
This is relevant where the data has a temporal dimension or when time is used to ’unfold’
data. It is a selective and possibly interpreted account of what the data ’says’ structured
around temporal associations. It may provide a ’natural’ way of thinking about data when
it comes to identifying particular kinds of pattern, generating causal explanations, making
predictions of the future and for supporting higher-level categorisation (e. g. determining
intent of actors during legal cases for crime classification).
The stories of analysis – Stories which communicate the provenance of an analytic outcome
by way of a history of the analytic process. It depicts the process through which an
analysis was conducted and conclusions reached. Visibility of this story can offer support
to the analyst and to others either during or after an analysis for reflecting what was
done, auditing and interpreting outcomes. To support construct of this story, data
might be gathered during the analysis by automated logging and/or manual annotation.
Considerations in abstracting a meaningful narrative include: What are the meaningful
agents and objects? What are the meaningful units of activity? How do you detect
and represent analytic branching? How do you make a narrative engaging and build in
’Dramaturgie’ (crisis/outcome, tension/release)? How do you map from low-level events
(as captured by logging) to a meaningful story of progressive sensemaking?
The ’logic’ of the conclusion – This is a story which recounts the (probably informal) logic
of an analytic outcome. It links elements in terms of premises (both observed and
assumed) and conclusions into a coherent argument. It is different from a ’story in the
data’ and a ’story of the analysis’ in that it specifically links elements in terms of the
way that one proposition supports another, rather than how one event led to another.
It is a sequence of ideas akin to a logical or mathematical proof in which the relations
between ideas are determined by relations of implication and not the chronology in which
they occurred. An advantage of this kind of story is that its form can make explicit
assumptions which might otherwise remain implicit.
Educational narratives – A story generated for pedagogical motives intended for teaching
others how to perform or interpret an analysis or how to use complex analytic tools. A
key role of story in this case is to lead the student through a series of ideas which may
progressively build in a way that is engaging, accessible and memorable. Where the
learning supports informed decision making, for example in the case of educating patients,
there may be considerations of how presentational elements, such as order, might affect
bias.
Finally, we discussed interaction issues as these relate to narrative in visual analytics. We
identified three phases of user involvement which deserve consideration. They are: Datagathering, raising questions of how this is done; Narrative construction, raising questions
of how this is done and when; and Presentation, raising questions about the provision
of overviews for the sake of coherent user mental models, the level of user involvement in
interaction (lean forward vs lean back), the pace of presentation, granularity and abstraction
of the narrative, and the tension between telling an engaging and representative story.
David S. Ebert, Brian D. Fisher, and Petra Isenberg 161
5.2 Evaluating Interaction for Visual Reasoning
Anastasia Bezerianos (University Paris South, FR), Mary Czerwinski (Microsoft Research –
Redmond, US), Brian D. Fisher (Simon Fraser University – Surrey, CA), Steve Franconeri
(Northwestern University – Evanston, US), Wayne Gray (Rensselaer Polytechnic Institute,
US), Petra Isenberg (INRIA – Saclay, FR), Bongshin Lee (Microsoft Research – Redmond,
US), Jinwook Seo (Seoul National University, KR)
License Creative Commons BY 3.0 Unported license© Anastasia Bezerianos, Mary Czerwinski, Brian D. Fisher, Steve Franconeri, Wayne Gray, PetraIsenberg, Bongshin Lee, and Jinwook Seo
One of the main challenges in designing interactive visual analytics systems is to measure
the effectiveness of their interaction designs. Traditional performance measures such as task
completion time and error rate often fail to demonstrate the value of interacting with visual
representations and the effect of interaction on the analysts’ reasoning process. Measuring
insights is also limited in that it is hard to replicate and quantify, and it does not capture
the role of the interactive system in the process that leads to the insightful moments. The
role of interaction is thus difficult to tease out with an insight based evaluation. The goal of
this paper is to present to the visual analytics community alternative measures related to
interaction, human reasoning and analysis processes, borrowed and adapted from the field of
cognitive psychology. The article that will be written based on the discussion at Dagstuhl
will be structured around the design of a study to evaluate different interaction modalities
for visual reasoning. It will discuss both high level questions, such as the formation and
evolution of a research question, and low level aspects including the choice of evaluation tasks
and methodologies. This article will serve both as an introduction to alternative evaluation
measures and methodologies adapted from cognitive psychology, as well as a walkthrough
example for researchers on how to formalize research hypotheses and structure evaluations
around them.
5.3 The Landscape of Explanations for the Value of Interaction forVisual Reasoning
Sheelagh Carpendale (University of Calgary, CA), Anastasia Bezerianos (University Paris
South, FR), Peter Cheng (University of Sussex – Brighton, GB), Brian D. Fisher (Simon
Fraser University – Surrey, CA), Steve Franconeri (Northwestern University – Evanston,
US), Daniel Keefe (University of Minnesota – Twin Cities, US), Bongshin Lee (Microsoft
Research – Redmond, US), Chris North (Virginia Polytechnic Institute – Blacksburg, US)
License Creative Commons BY 3.0 Unported license© Sheelagh Carpendale, Anastasia Bezerianos, Peter Cheng, Brian D. Fisher, Steve Franconeri,Daniel Keefe, Bongshin Lee, and Chris North
Our intuition tells us that interaction is a really important factor for visual reasoning. As
a community we have generated a wealth of examples of interaction techniques. However,
there is little consensus about how to explain how interactions actually create these benefits.
By examining a series of diverse interaction techniques in light of visual reasoning we will
begin mapping the landscape of explanations of how these interactions add value in terms
of visual reasoning. We will use a semi-structure knowledge acquisition process to gather a
series of interaction examples that each have three parts: a short stop motion storyboard, an
accompanying verbal explanation of the task and system; and, in particular, the creators
13352
162 13352 – Interaction with Information for Visual Reasoning
explanations of the perceived benefits in terms of visual reasoning. By intentionally both
sampling for diversity and analyzing from the perspectives of multiple research disciplines
we hope to add richness to this discussion. The contribution of this paper is an exploration
the space of alternative explanations to expand our understanding of the value of interaction
for visual reasoning.
5.4 Mixed Initative Interaction
Christopher Collins (University of Ontario, CA), Simon Attfield (Middlesex University, GB),
Fanny Chevalier (University of Toronto, CA), Mary Czerwinski (Microsoft Research – Red-
mond, US), Heidi Lam (Google Inc. – Mountain View, US), Catherine Plaisant (University
of Maryland – College Park, US), Christian Tominski (Universität Rostock, DE), Michelle
X. Zhou (IBM Almaden Center – San José, US)
License Creative Commons BY 3.0 Unported license© Christopher Collins, Simon Attfield, Fanny Chevalier, Mary Czerwinski, Heidi Lam, CatherinePlaisant, Christian Tominski, and Michelle X. Zhou
The group defined mixed initiative interaction as a type of interaction for visual reasoning
in which the human analyst and the visualization system both are active participants in
the interaction. In a traditional interaction scenario, the visualization software is reactive,
responding to inputs from the analyst. In MI interaction, the system would play a more active
role, for example, making suggestions about appropriate views or next steps in the analysis
process. There are then two directions of interaction: human to system, e.g. applying filters,
making selections, loading new data; system to human, e.g. suggesting views, suggesting
next steps, automatic highlighting of potentially interesting part of a view.
Mixed initiative interaction has been studied for several years, but remains on the
periphery of mainstream visualization research. Systems in this area are often called ’smart
visualization’ or ’intelligent user interfaces’. However, it seems the community is skeptical due
to the cost of error: if a smart visualization system suggests a particular representation type,
or an analysis process which is inappropriate to the data or current task requirements, then an
analyst could become frustrated, or, worse, may come to incorrect conclusions, biased by the
underlying interaction model. Other challenges in this research include being able to gather
appropriate and sufficient user data to create a model of the user, such as understanding their
level of experience, preferences, prior domain knowledge, etc. As this sort of data is difficult
to gather and often inconclusive, we focussed our discussion on MI interaction possibilities in
scenarios where we do not have prior knowledge about the analyst. Our discussions lead
to a list of factors which can be used to evaluate the success of system-initiated interaction
prompts:
Are they timely? Are suggestions provided at the right time or do they interrupt the
analyst’s flow?
Does the system take initiative sparingly? If the system takes the initiative too often,
the analyst may become fatigued and ignore suggestions.
Are system suggestions appropriate? Is the system suggesting views, prompts, or other
cues which enhance the analysis experience and potential for insight? Or do they lead to
incorrect conclusions about the data?
Is the provenance of system suggestions transparent? Can the human analyst understand
why the system makes any given suggestion?
David S. Ebert, Brian D. Fisher, and Petra Isenberg 163
Scenarios where MI interaction may be useful include a new analyst using a system for
the first time and requiring tutorial-style guidance. In this scenario, the system may not
know much about the characteristics, prior knowledge, interaction styles and preferences of
the analyst and has to provide assistance based on characteristics of the data and the current
interaction session, and perhaps a crowd-driven model of the way other analysts have used
the system.
Human to System Interaction (Human Initiative)
We called the types of traditional interactions, such as selecting data items, panning and
zooming a view, “explicit interactions”. Newer forms of interaction, such as ’model steering’
by repositioning items in a visualization to indicate prior knowledge about their relatedness,
are also important inputs to a mixed initiative system.
Where we focused our discussion was on new forms of cues which may be gathered by
the system in a mixed initiative interaction model to improve the quality and timeliness of
prompts and suggestions. We called these inputs ’implicit interactions’. We enumerated the
following list of potential ’implicit interactions’ which could be tracked by a visualization
system and used to decide when and how to take initiative:
Dwell time (eye gaze, touch, or mouse cursor)
Facial gestures
Highlighting / copying behaviour
Repeated actions
Body position / gestures (proxemics)
Thrashing—changing actions / direction
Emotional indicators
Physiological indicators
Mouse signatures
Keyboard signatures
Repositioning items on the screen
The history of what they have explored already (the analysis process)
These implicit interactions could provide a wealth of data to a mixed initiative system,
but would also have drawbacks which need to be investigated, including privacy concerns,
potential for reinforcing actions (encouraging ’tunnel vision’), or ambiguity of the meaning
of the indicators. For example, physiological and behavioural indicators of excitement and
annoyance may be quite similar. Which implicit interactions would be most important and
how they could work together to create a profile of the analyst state are areas of future
research inspired by our discussions.
System to Human Interaction (System Initiative)
Others have researched system-initiated interaction driven by user profiles and data char-
acteristics, so we targeted our discussions on the types of feedback a system could provide
based on analysis of implicit interaction data. The timing of system-initiated interaction
is crucial: ideally it is timely, does not interrupt the flow of analysis and human-initiated
interaction, and is appropriate to the data and task. Design decisions to consider in future
work include: (a) how to present interaction and analysis suggestions, (b) how to reveal the
provenance of guidance (why a suggestion is made by the system), (c) how to encode the
confidence level the system has in a suggestion, etc. We recommended that system feedback
13352
164 13352 – Interaction with Information for Visual Reasoning
could also be subtle or implicit. For example, if the system senses the analyst is “lost” or
“stressed”, rather than asking “are you stressed?” it could simply provide additional on screen
help, adjust or simplify the interface, and suggest alternative views.
We explored a variety of system responses which may be appropriate if the indicators
strongly point to the need for system-initiated interaction. Specifically, we looked at possible
responses to various detected emotional states, such as frustration, confusion, boredom,
interest, and engagement. System responses may include: show more views like the current
view, show views different from the current view, show what other people (all people /
people like me / experts) did in similar situations, offer help, or simplify the view (remove
a data dimension or perform aggregation). MI interaction should be flexible and perhaps
system-initiation should be turned off automatically after the analyst does not acknowledge
or use system suggestions over a long period of time.
To conclude our meetings, the group brainstormed about a paper outline reporting on
our mixed initiative interaction for visual reasoning ideas, and assigned next steps to the
participants.
5.5 Conceptual Structures of Interaction for Visual Reasoning
Kelly Gaither (University of Texas – Austin, US), David S. Ebert (Purdue University, US),
Thomas Ertl (Universität Stuttgart, DE), Hans Hagen (TU Kaiserslautern, DE), Petra
Isenberg (INRIA Saclay, FR), Tobias Isenberg (INRIA Saclay, FR), Jörn Kohlhammer
(Fraunhofer IGD – Darmstadt, DE), Margit Pohl (TU Wien, AT), Kamran Sedig (University
of Western Ontario, CA)
License Creative Commons BY 3.0 Unported license© Kelly Gaither, David S. Ebert, Thomas Ertl, Hans Hagen, Petra Isenberg, Tobias Isenberg, JörnKohlhammer, Margit Pohl, and Kamran Sedig
Interaction is a fundamental element of successful visualization methods and tools. In
visualization, interaction can support many low-level and high-level tasks and goals, can
support different representation and interaction intends, and can be realized by different
techniques. The specific incarnations of the interaction design, however, are driven by the
specific application domain, by the tasks being supported, by the type of data being analyzed,
by the specific representations being chosen, by potential limitations of computability, and
by the needs and requirements of the users. The question that we aimed to analyze is if we
can identify general principles of interactions that bridge different domains and are common
among tasks, data types, and representations. Can we formulate or propose a language or
schema of interaction that is common for most if not all visualization tools and methods,
potentially with different dialects?
David S. Ebert, Brian D. Fisher, and Petra Isenberg 165
5.6 Magic Interactions with Information for Visual Reasoning
Daniel Keefe (University of Minnesota – Twin Cities, US), Sheelagh Carpendale (University
of Calgary, CA), Peter Cheng (University of Sussex – Brighton, GB), Fanny Chevalier
(University of Toronto, CA), Christopher Collins (University of Ontario, CA), Tobias
Isenberg (INRIA Saclay, FR), David Kirsh (University of California – San Diego, US),
Heidi Lam (Google Inc. – Mountain View, US), Chris North (Virginia Polytechnic Institute –
Blacksburg, US), Kamran Sedig (University of Western Ontario, CA), Christian Tominski
(Universität Rostock, DE), Xiaoru Yuan (Peking University, CN)
License Creative Commons BY 3.0 Unported license© Daniel Keefe, Sheelagh Carpendale, Peter Cheng, Fanny Chevalier, Christopher Collins, TobiasIsenberg, David Kirsh, Heidi Lam, Chris North, Kamran Sedig, Christian Tominski, and XiaoruYuan
Today, there is much excitement around the concept of “natural user interfaces.” The interest
is sparked in part by the widespread availability of multi-touch devices, including smart
phones and tablets. However, the trend is not limited to these new commercial devices; a
variety of recently developed user interface techniques that enable seemingly more direct ways
of interfacing with computers have been dubbed “natural.” Will these natural interactions
define the future of computing? As user interface designers, and in particular as designers and
researchers interesting in supporting users as they reason about super-complex information,
we have to ask, is “natural” actually the right target? Do we really want to design natural
interactions or do we want something else? How about “supernatural” or even “magical”
interactions? Our Dagstuhl working group found that the more we thought about the systems
and human-computer interfaces that have most influenced us or impacted our work, the
more we recognized that (at least the first few times we used these systems) they all felt
magical. Some examples include: (1) clicking and dragging a drawing of a cartoon character
who then responds “intelligently” by changing his pose in direct response to the user’s input,
understanding how to move as if by magic; (2) Browsing video data by clicking directly on
characters in the video rather than using a slider; (3) Bumping mobile devices to transfer files;
and (4) Selecting 3D point clouds just by drawing a 2D lasso. All of these interactions have
“the power of apparently influencing the course of events by using mysterious or supernatural
forces” and “a quality that makes something seem removed from everyday life, esp. in a way
that gives delight” – two properties taken directly from the definition of the word magic.
Grounded in findings from the cognitive science research community, we developed several
explanations for when and why “magical interactions” seem to work well, including the
notions of a different cognitive cost structure for natural vs. magical interactions, superpower
and amplification, context/temporal appropriateness, and working with underspecified and
imprecise data or applications. Based on these insights, we call for a new research focus
that moves beyond “natural user interfaces” and instead targets magic interactions with
information.
13352
166 13352 – Interaction with Information for Visual Reasoning
5.7 Crowd Interaction in Visual Reasoning
David Kirsh (University of California – San Diego, US), Huamin Qu (The Hong Kong
University of Science & Technology, HK), Jinwook Seo (Seoul National University, KR),
Xiaoru Yuan (Peking University, CN)
License Creative Commons BY 3.0 Unported license© David Kirsh, Jinwook Seo, and Xiaoru Yuan
How can we harness the intelligent capacity of crowds to reason visually about a topic?
In recent years real-time posting of images, video and tweets by citizens in the midst of a
natural disaster has provided better information to first responders than information from
helicopters and their own officials on the ground. That new source of local information is
just starting. It presents a great opportunity for data mining but also for visual reasoning.
There are major challenges. How should we enable intelligent aggregation of visual and other
qualitative data? How should we make visual and textual summaries to communicate ideas?
How might we use groups to preprocess data to support interactive visualizations?
The basic methods of crowd sourcing in use to date are far removed from our goal of
using crowds to create meaningful visualizations. Currently, crowds are used for judging the
plausibility of statements, for making value judgments, for giving aggregate views, but as yet
not for creating visual narratives, intelligent visualizations, or preprocessing qualitative data.
In our group we identified problems that need to be solved to harness crowd power
for visual reasoning and qualitative argumentation. Beside aggregation and intelligent
summarizing we considered questions of coordination: how should the identification and
disbursement of tasks be intelligently managed? Can this be done automatically or can we
use Turkers to make themselves into a self-organizing system? How can Turkers be unleashed
on a problem and generate requests that when answered in the right way are amenable to
visualizing complex problems?

David S. Ebert, Brian D. Fisher, and Petra Isenberg 167
Participants
Simon AttfieldMiddlesex University, GB
Anastasia BezerianosUniversity Paris South, FR
Sheelagh CarpendaleUniversity of Calgary, CA
Peter C.-H. ChengUniv. of Sussex – Brighton, GB
Fanny ChevalierUniversity of Toronto, CA
Christopher CollinsUniversity of Ontario, CA
Mary CzerwinskiMicrosoft Res. – Redmond, US
David S. EbertPurdue University, US
Thomas ErtlUniversität Stuttgart, DE
Brian D. FisherSimon Fraser Univ. – Surrey, CA
Steve FranconeriNorthwestern University –Evanston, US
Kelly GaitherUniversity of Texas – Austin, US
Wayne D. GrayRensselaer Polytechnic, US
Hans HagenTU Kaiserslautern, DE
Petra IsenbergINRIA Saclay – Île-de-France –Orsay, FR
Tobias IsenbergINRIA Saclay – Île-de-France –Orsay, FR
Daniel KeefeUniversity of Minnesota –Duluth, US
David KirshUniversity of California – SanDiego, US
Jörn KohlhammerFraunhofer IGD –Darmstadt, DE
Heidi LamGoogle Inc. –Mountain View, US
Bongshin LeeMicrosoft Res. – Redmond, US
Chris NorthVirginia Polytechnic Institute –Blacksburg, US
Catherine PlaisantUniversity of Maryland – CollegePark, US
Margit PohlTU Wien, AT
Huamin QuThe Hong Kong University ofScience & Technology, HK
Kamran SedigUniv. of Western Ontario, CA
Jinwook SeoSeoul Nat. University, KR
Christian TominskiUniversität Rostock, DE
Xiaoru YuanPeking University, CN
Michelle X. ZhouIBM Almaden Center –San José, US
13352