Embed Size (px)
Citation preview
HAL Id: hal-00530550https://hal-mines-paristech.archives-ouvertes.fr/hal-00530550
Submitted on 29 Oct 2010
HAL is a multi-disciplinary open accessarchive for the deposit and dissemination of sci-entific research documents, whether they are pub-lished or not. The documents may come fromteaching and research institutions in France orabroad, or from public or private research centers.
L’archive ouverte pluridisciplinaire HAL, estdestinée au dépôt et à la diffusion de documentsscientifiques de niveau recherche, publiés ou non,émanant des établissements d’enseignement et derecherche français ou étrangers, des laboratoirespublics ou privés.
Forecasting of regional wind generation by a dynamicfuzzy-neural networks based upscaling approach
Pierre Pinson, Nils Siebert, Georges Kariniotakis
To cite this version:Pierre Pinson, Nils Siebert, Georges Kariniotakis. Forecasting of regional wind generation by a dy-namic fuzzy-neural networks based upscaling approach. EWEC 2003 (European Wind energy andconference), Jun 2003, Madrid, Spain. 5 p. - CD ROM, 2003. <hal-00530550>
European Wind Energy Conference & Exhibition EWEC 2003, Madrid, Spain.
Forecasting of Regional Wind Generation by a Dynamic Fuzzy-Neural Networks Based Upscaling Approach.
P. Pinson, N. Siebert, G. Kariniotakis* Ecole des Mines de Paris, Center for Energy Studies,
France * [email protected], tel: +33 4 93957501, Ecole des Mines de Paris, Centre d’Energétique, BP 207, 06904 Sophia-Antipolis, France.
Abstract-Short-term wind power forecasting is recognized nowadays as a major requirement for a secure and economic integration of wind power in a power system. In the case of large-scale integration, end users such as transmission system operators focus on the prediction of regional or even national wind power up to 48 hours ahead. At a European level such predictions will be required in the future for planning power exchanges between regions or countries. The main difficulty for predicting regional wind power is that on-line information is not available for all concerned wind farms. Predictions have to be based on a limited number of representative wind farms for which SCADA data and/or Numerical Weather Predictions are available and then extrapolated (“upscaled”) to predict the total wind power. In this work several approaches were developed for upscaling ranging from simple to more complex ones (i.e. based on artificial intelligence methods such as fuzzy-neural networks). Evaluation results are provided for the case of the Irish power system. Predictions for the output of eleven wind farms are made from a number of one up to five representative wind parks. The performance of the various approaches is evaluated using one year of data. Useful conclusions are derived for the impact of the “smoothing effect” on the performance of Persistence and that of advanced models.
Keywords-Wind power, short-term forecasting, upscaling, adaptive fuzzy-neural networks, regional forecasting.
I. INTRODUCTION HE actual large-scale integration of wind energy in several European countries, as well as the perspectives for future
development on the Continent (i.e. EWEA projections for 45-60 GW by 2010), require the development of accurate tools for wind power prediction at a regional or even at a national level. Wind power forecasting, up to 48 hours ahead, is recognized by wind farm operators, utilities, transmission system operators, and other end-users, as a major contribution for a reliable integration of wind generation in a power system. In a liberalized market environment, prediction tools enhance the position of wind energy compared to other dispatchable forms of generation.
Predicting the output of each single wind farm in a region/country can be very costly, even prohibitive, in terms of data management, while it can be constrained by the reliability of data acquisition systems, when large number of wind park installations exist. To overcome this problem, “upscaling” approaches need to be developed to predict regional/national wind power from a sample of reference wind farms. Moreover, it appears that aggregated power forecasts permit to lower the prediction error thanks to spatial smoothing effects [1].
The main idea of upscaling is to extrapolate the total wind generated power from predictions made for a number of representative wind farms for which Numerical Weather Predictions (NWPs) and/or online measurements are accessible by the prediction system.
Upscaling is usually applied to predict power at a national level. Then, the reference wind farms may represent a low share w.r.t. the total power. In the present paper, we consider the case where the reference wind farms represent an important part of the total installed power. This problem is denoted as “regional” upscaling.
Up to now several upscaling approaches have been developed mainly for application in countries that witness large-scale wind integration (i.e. Denmark, Germany). The upscaling algorithm proposed in [2], [3] takes into account the site description (i.e. hub height, turbine type, terrain description). This approach can be classified as a “physical” one. In [4], a transformation algorithm that is designed for on-line monitoring of aggregated power output is also used to predict the total wind power from a group of representative wind farms. Another approach described in [5] is as follows: firstly predict the wind power production for representative wind farms and then use an upscaling function, secondly directly produce an area forecast using NWPs for the area and offline power measurements; finally, a weighted average of these two forecasts gives the total wind generation prediction.
The aim of this paper is to develop and evaluate several approaches for regional upscaling, based on artificial intelligence and that can rely on one or more representative wind farms. The advanced methods are evaluated against simple methods like Persistence or simple regression. Persistence is a simple method according to which the wind production in the future will be the same as the production now. It is worthwhile to implement an advanced method only if it outperforms Persistence. This reference method is discussed in Section VI since in the context of upscaling new considerations have to be made.
II. DYNAMIC FUZZY-NEURAL NETWORKS BASED UPSCALING APPROACHES
A. Definition of reference wind farms
As it is a common practice to extrapolate the regional wind power from predictions made for reference wind farms, two types
T
European Wind Energy Conference & Exhibition EWEC 2003, Madrid, Spain.
of representative wind farms will be distinguished in the approaches developed here according to the available data: - Type 1: wind farms for which Numerical Weather Predictions
(NWPs) and on-line SCADA (Supervisory Control and Data Acquisition) data are available,
- Type 2: wind farms with NWPs only.
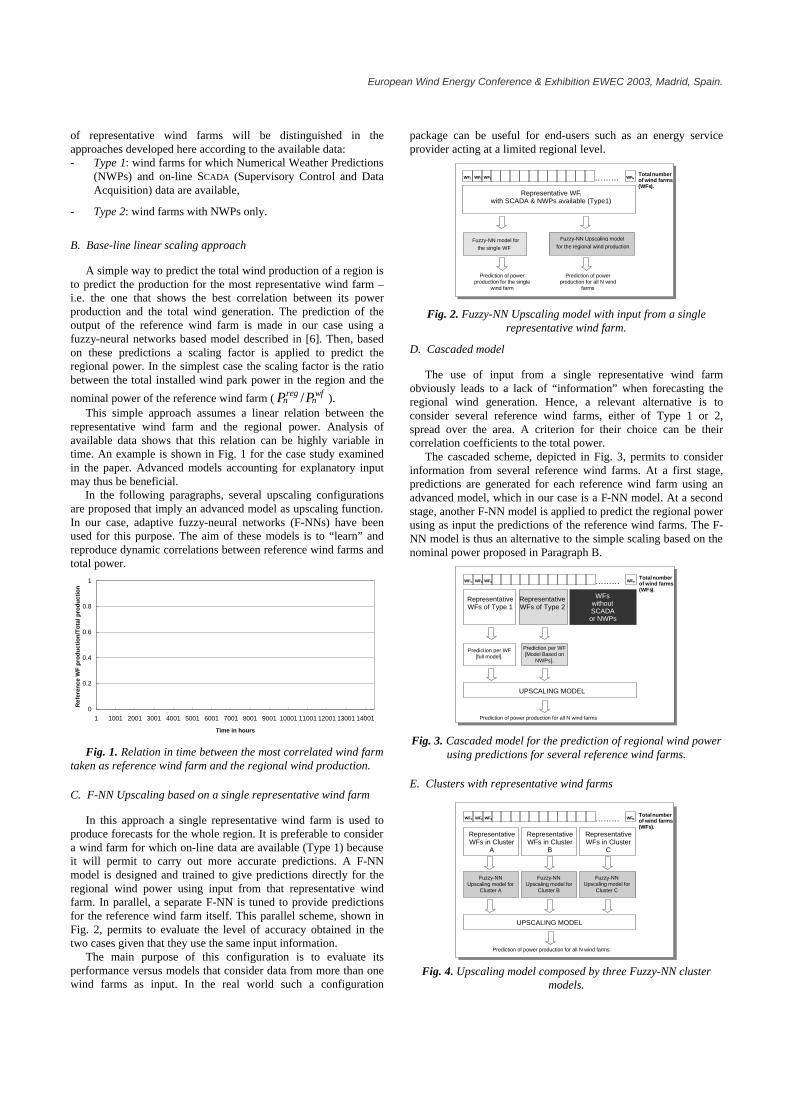
B. Base-line linear scaling approach
A simple way to predict the total wind production of a region is to predict the production for the most representative wind farm – i.e. the one that shows the best correlation between its power production and the total wind generation. The prediction of the output of the reference wind farm is made in our case using a fuzzy-neural networks based model described in [6]. Then, based on these predictions a scaling factor is applied to predict the regional power. In the simplest case the scaling factor is the ratio between the total installed wind park power in the region and the
nominal power of the reference wind farm ( wfn
regn PP / ).
This simple approach assumes a linear relation between the representative wind farm and the regional power. Analysis of available data shows that this relation can be highly variable in time. An example is shown in Fig. 1 for the case study examined in the paper. Advanced models accounting for explanatory input may thus be beneficial.
In the following paragraphs, several upscaling configurations are proposed that imply an advanced model as upscaling function. In our case, adaptive fuzzy-neural networks (F-NNs) have been used for this purpose. The aim of these models is to “learn” and reproduce dynamic correlations between reference wind farms and total power.
0
0.2
0.4
0.6
0.8
1
1 1001 2001 3001 4001 5001 6001 7001 8001 9001 10001 11001 12001 13001 14001
Time in hours
Ref
eren
ce W
F p
rod
uct
ion
/To
tal p
rod
uct
ion
Fig. 1. Relation in time between the most correlated wind farm taken as reference wind farm and the regional wind production.
C. F-NN Upscaling based on a single representative wind farm
In this approach a single representative wind farm is used to produce forecasts for the whole region. It is preferable to consider a wind farm for which on-line data are available (Type 1) because it will permit to carry out more accurate predictions. A F-NN model is designed and trained to give predictions directly for the regional wind power using input from that representative wind farm. In parallel, a separate F-NN is tuned to provide predictions for the reference wind farm itself. This parallel scheme, shown in Fig. 2, permits to evaluate the level of accuracy obtained in the two cases given that they use the same input information.
The main purpose of this configuration is to evaluate its performance versus models that consider data from more than one wind farms as input. In the real world such a configuration
package can be useful for end-users such as an energy service provider acting at a limited regional level.
Total number of wind farms ( WFs ).
Representative WFi with SCADA & NWPs available (Type1)
……… WF 1 WF 2 WF 3 WF N
Prediction of power production for the single
wind farm
Prediction of power production for all N wind
farms
Fuzzy-NN model for the single WF
Fuzzy-NN Upscaling model for the regional wind production
Fig. 2. Fuzzy-NN Upscaling model with input from a single representative wind farm.
D. Cascaded model
The use of input from a single representative wind farm obviously leads to a lack of “information” when forecasting the regional wind generation. Hence, a relevant alternative is to consider several reference wind farms, either of Type 1 or 2, spread over the area. A criterion for their choice can be their correlation coefficients to the total power.
The cascaded scheme, depicted in Fig. 3, permits to consider information from several reference wind farms. At a first stage, predictions are generated for each reference wind farm using an advanced model, which in our case is a F-NN model. At a second stage, another F-NN model is applied to predict the regional power using as input the predictions of the reference wind farms. The F-NN model is thus an alternative to the simple scaling based on the nominal power proposed in Paragraph B.
Total number of wind farms ( WFs ).
Representative WFs of Type 1
WFs without SCADA or NWPs
Prediction per WF [full model]. Prediction per WF
[Model Based on NWPs].
UPSCALING MODEL
………
Prediction of power production for all N wind farms
WF 1 WF 2 WF 3 WF N Representative WFs of Type 2
Fig. 3. Cascaded model for the prediction of regional wind power using predictions for several reference wind farms.
E. Clusters with representative wind farms
Total number of wind farms ( WFs ). ……… WF 1 WF 2 WF 3 WF N
Prediction of power production for all N wind farms
RepresentativeWFs in Cluster
A RepresentativeWFs in Cluster
B RepresentativeWFs in Cluster
C
Fuzzy-NN Upscaling model for
Cluster A Fuzzy-NN
Upscaling model for Cluster B
Fuzzy-NN Upscaling model for
Cluster C
UPSCALING MODEL
Fig. 4. Upscaling model composed by three Fuzzy-NN cluster
models.
European Wind Energy Conference & Exhibition EWEC 2003, Madrid, Spain.
This approach is based on the classification of the wind farms into clusters containing neighboring wind farms. The classification is performed following correlation analysis of available information (NWPs and measured data). Then a fuzzy neural networks upscaling model is developed for each cluster based on input (NWP and/or SCADA) from the reference wind farms for that cluster. Finally, the sum of the clusters’ productions provides the total power for the region (Fig. 4).
F. On-line tuning based on reference wind farms.
The fuzzy neural network models can operate in an autoadaptive mode when power measurements are available on-line. This, in the case of single-wind farms, permits to improve the accuracy for the first hours ahead and outperform persistence. In the case of upscaling, on-line tuning is not possible due to the fact that the total power is not measured. In the approaches presented here, on-line adaptation is active for the reference wind farms. For the total power on-line tuning is applied based on a pseudo error, which is estimated using the prediction errors of the reference wind farms. First evaluation of this approach gave satisfactory results when a sufficient number of reference wind farms were considered.
III. CASE STUDY
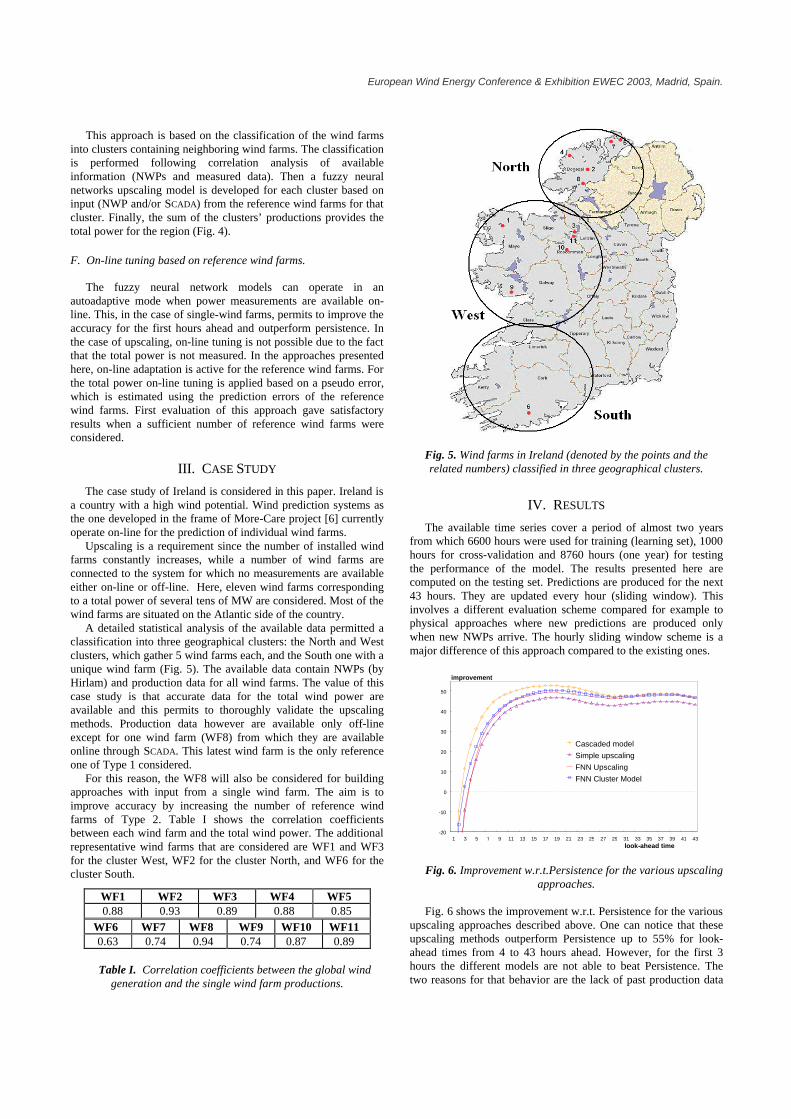
The case study of Ireland is considered in this paper. Ireland is a country with a high wind potential. Wind prediction systems as the one developed in the frame of More-Care project [6] currently operate on-line for the prediction of individual wind farms.
Upscaling is a requirement since the number of installed wind farms constantly increases, while a number of wind farms are connected to the system for which no measurements are available either on-line or off-line. Here, eleven wind farms corresponding to a total power of several tens of MW are considered. Most of the wind farms are situated on the Atlantic side of the country.
A detailed statistical analysis of the available data permitted a classification into three geographical clusters: the North and West clusters, which gather 5 wind farms each, and the South one with a unique wind farm (Fig. 5). The available data contain NWPs (by Hirlam) and production data for all wind farms. The value of this case study is that accurate data for the total wind power are available and this permits to thoroughly validate the upscaling methods. Production data however are available only off-line except for one wind farm (WF8) from which they are available online through SCADA. This latest wind farm is the only reference one of Type 1 considered.
For this reason, the WF8 will also be considered for building approaches with input from a single wind farm. The aim is to improve accuracy by increasing the number of reference wind farms of Type 2. Table I shows the correlation coefficients between each wind farm and the total wind power. The additional representative wind farms that are considered are WF1 and WF3 for the cluster West, WF2 for the cluster North, and WF6 for the cluster South.
WF1 WF2 WF3 WF4 WF5 0.88 0.93 0.89 0.88 0.85
WF6 WF7 WF8 WF9 WF10 WF11 0.63 0.74 0.94 0.74 0.87 0.89
Table I. Correlation coefficients between the global wind
generation and the single wind farm productions.
Fig. 5. Wind farms in Ireland (denoted by the points and the related numbers) classified in three geographical clusters.
IV. RESULTS
The available time series cover a period of almost two years from which 6600 hours were used for training (learning set), 1000 hours for cross-validation and 8760 hours (one year) for testing the performance of the model. The results presented here are computed on the testing set. Predictions are produced for the next 43 hours. They are updated every hour (sliding window). This involves a different evaluation scheme compared for example to physical approaches where new predictions are produced only when new NWPs arrive. The hourly sliding window scheme is a major difference of this approach compared to the existing ones.
Fig. 6. Improvement w.r.t.Persistence for the various upscaling approaches.
Fig. 6 shows the improvement w.r.t. Persistence for the various
upscaling approaches described above. One can notice that these upscaling methods outperform Persistence up to 55% for look-ahead times from 4 to 43 hours ahead. However, for the first 3 hours the different models are not able to beat Persistence. The two reasons for that behavior are the lack of past production data
-20
-10
0
10
20
30
40
50
1 3 5 7 9 11 13 15 17 19 21 23 25 27 29 31 33 35 37 39 41 43look-ahead time
improvement
Cascaded modelSimple upscalingFNN Upscaling FNN Cluster Model
European Wind Energy Conference & Exhibition EWEC 2003, Madrid, Spain.
0
10
20
30
40
50
60
70
80
1 3 5 7 9 11 13 15 17 19 21 23 25 27 29 31 33 35 37 39 41 43
look-ahead time (h)
power (% of total power)
predicted power
85% confidence lower interval 85% confidence upper interval measured power
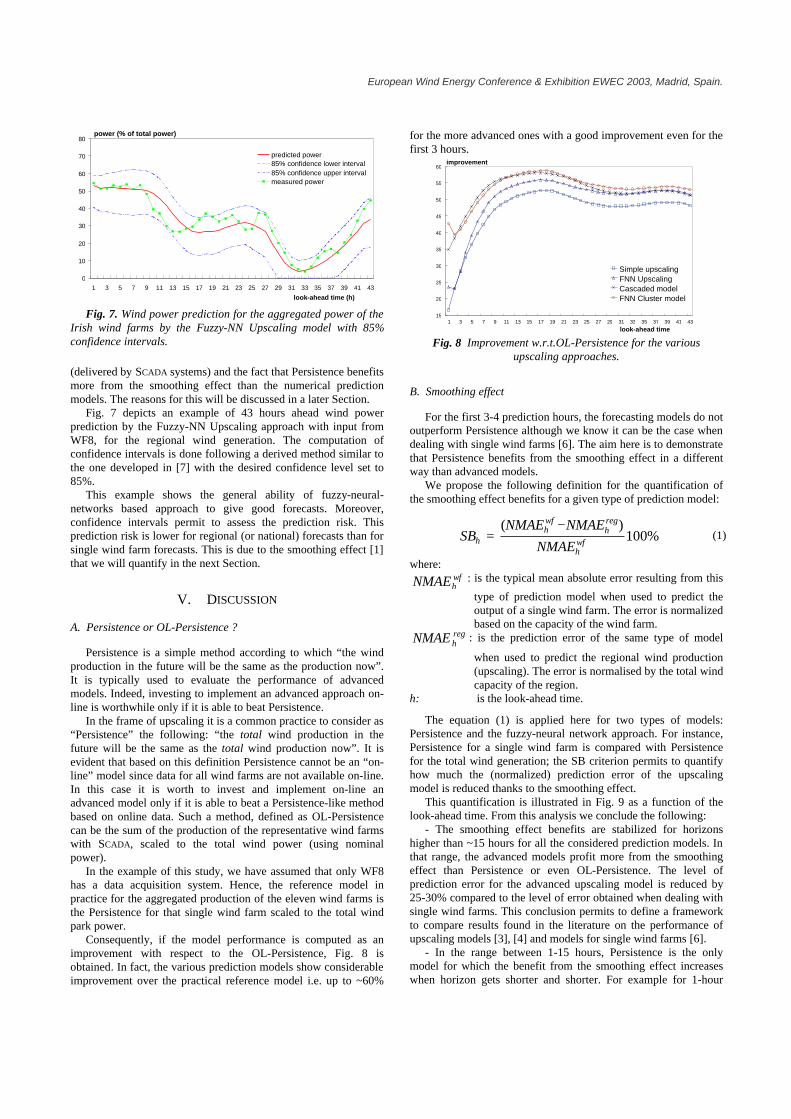
Fig. 7. Wind power prediction for the aggregated power of the Irish wind farms by the Fuzzy-NN Upscaling model with 85% confidence intervals.
(delivered by SCADA systems) and the fact that Persistence benefits more from the smoothing effect than the numerical prediction models. The reasons for this will be discussed in a later Section.
Fig. 7 depicts an example of 43 hours ahead wind power prediction by the Fuzzy-NN Upscaling approach with input from WF8, for the regional wind generation. The computation of confidence intervals is done following a derived method similar to the one developed in [7] with the desired confidence level set to 85%.
This example shows the general ability of fuzzy-neural-networks based approach to give good forecasts. Moreover, confidence intervals permit to assess the prediction risk. This prediction risk is lower for regional (or national) forecasts than for single wind farm forecasts. This is due to the smoothing effect [1] that we will quantify in the next Section.
V. DISCUSSION
A. Persistence or OL-Persistence ?
Persistence is a simple method according to which “the wind production in the future will be the same as the production now”. It is typically used to evaluate the performance of advanced models. Indeed, investing to implement an advanced approach on-line is worthwhile only if it is able to beat Persistence.
In the frame of upscaling it is a common practice to consider as “Persistence” the following: “the total wind production in the future will be the same as the total wind production now”. It is evident that based on this definition Persistence cannot be an “on-line” model since data for all wind farms are not available on-line. In this case it is worth to invest and implement on-line an advanced model only if it is able to beat a Persistence-like method based on online data. Such a method, defined as OL-Persistence can be the sum of the production of the representative wind farms with SCADA, scaled to the total wind power (using nominal power).
In the example of this study, we have assumed that only WF8 has a data acquisition system. Hence, the reference model in practice for the aggregated production of the eleven wind farms is the Persistence for that single wind farm scaled to the total wind park power.
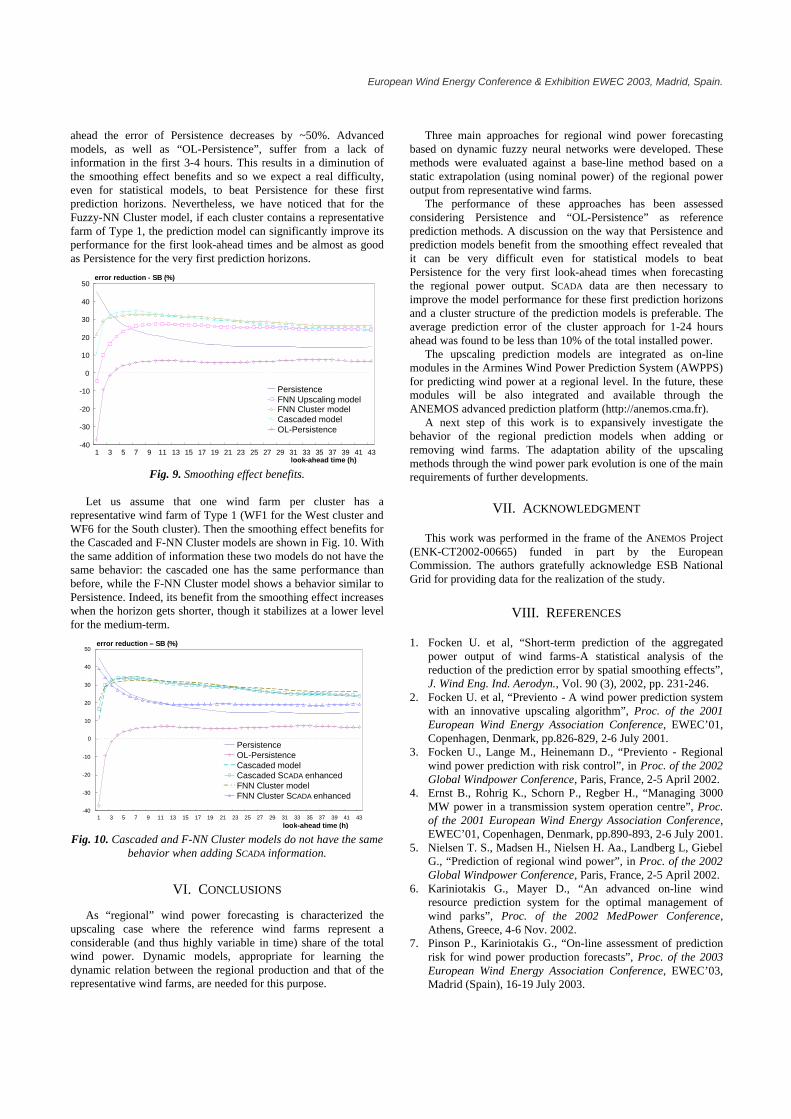
Consequently, if the model performance is computed as an improvement with respect to the OL-Persistence, Fig. 8 is obtained. In fact, the various prediction models show considerable improvement over the practical reference model i.e. up to ~60%
for the more advanced ones with a good improvement even for the first 3 hours.
Fig. 8 Improvement w.r.t.OL-Persistence for the various
upscaling approaches.
B. Smoothing effect
For the first 3-4 prediction hours, the forecasting models do not outperform Persistence although we know it can be the case when dealing with single wind farms [6]. The aim here is to demonstrate that Persistence benefits from the smoothing effect in a different way than advanced models.
We propose the following definition for the quantification of the smoothing effect benefits for a given type of prediction model:
%100)(⋅
−= wf
h
regh
wfh
h NMAE
NMAENMAESB (1)
where: wfhNMAE : is the typical mean absolute error resulting from this
type of prediction model when used to predict the output of a single wind farm. The error is normalized based on the capacity of the wind farm.
reghNMAE : is the prediction error of the same type of model
when used to predict the regional wind production (upscaling). The error is normalised by the total wind capacity of the region.
h: is the look-ahead time.
The equation (1) is applied here for two types of models: Persistence and the fuzzy-neural network approach. For instance, Persistence for a single wind farm is compared with Persistence for the total wind generation; the SB criterion permits to quantify how much the (normalized) prediction error of the upscaling model is reduced thanks to the smoothing effect.
This quantification is illustrated in Fig. 9 as a function of the look-ahead time. From this analysis we conclude the following:
- The smoothing effect benefits are stabilized for horizons higher than ~15 hours for all the considered prediction models. In that range, the advanced models profit more from the smoothing effect than Persistence or even OL-Persistence. The level of prediction error for the advanced upscaling model is reduced by 25-30% compared to the level of error obtained when dealing with single wind farms. This conclusion permits to define a framework to compare results found in the literature on the performance of upscaling models [3], [4] and models for single wind farms [6].
- In the range between 1-15 hours, Persistence is the only model for which the benefit from the smoothing effect increases when horizon gets shorter and shorter. For example for 1-hour
improvement (%)
15
20
25
30
35
40
45
50
55
60
1 3 5 7 9 11 13 15 17 19 21 23 25 27 29 31 33 35 37 39 41 43 look-ahead time
Simple upscaling FNN Upscaling Cascaded model FNN Cluster model
European Wind Energy Conference & Exhibition EWEC 2003, Madrid, Spain.
ahead the error of Persistence decreases by ~50%. Advanced models, as well as “OL-Persistence”, suffer from a lack of information in the first 3-4 hours. This results in a diminution of the smoothing effect benefits and so we expect a real difficulty, even for statistical models, to beat Persistence for these first prediction horizons. Nevertheless, we have noticed that for the Fuzzy-NN Cluster model, if each cluster contains a representative farm of Type 1, the prediction model can significantly improve its performance for the first look-ahead times and be almost as good as Persistence for the very first prediction horizons.
-40 -30 -20 -10
0 10 20 30 40 50
1 3 5 7 9 11 13 15 17 19 21 23 25 27 29 31 33 35 37 39 41 43 look-ahead time (h)
error reduction - SB (%)
Persistence FNN Upscaling model FNN Cluster model Cascaded model OL-Persistence
Fig. 9. Smoothing effect benefits.
Let us assume that one wind farm per cluster has a
representative wind farm of Type 1 (WF1 for the West cluster and WF6 for the South cluster). Then the smoothing effect benefits for the Cascaded and F-NN Cluster models are shown in Fig. 10. With the same addition of information these two models do not have the same behavior: the cascaded one has the same performance than before, while the F-NN Cluster model shows a behavior similar to Persistence. Indeed, its benefit from the smoothing effect increases when the horizon gets shorter, though it stabilizes at a lower level for the medium-term.
-40 -30 -20 -10
0 10 20 30 40 50
1 3 5 7 9 11 13 15 17 19 21 23 25 27 29 31 33 35 37 39 41 43 look-ahead time (h)
error reduction – SB (%)
Persistence OL-Persistence Cascaded model Cascaded SCADA enhanced FNN Cluster model FNN Cluster SCADA enhanced
Fig. 10. Cascaded and F-NN Cluster models do not have the same
behavior when adding SCADA information.
VI. CONCLUSIONS
As “regional” wind power forecasting is characterized the upscaling case where the reference wind farms represent a considerable (and thus highly variable in time) share of the total wind power. Dynamic models, appropriate for learning the dynamic relation between the regional production and that of the representative wind farms, are needed for this purpose.
Three main approaches for regional wind power forecasting based on dynamic fuzzy neural networks were developed. These methods were evaluated against a base-line method based on a static extrapolation (using nominal power) of the regional power output from representative wind farms.
The performance of these approaches has been assessed considering Persistence and “OL-Persistence” as reference prediction methods. A discussion on the way that Persistence and prediction models benefit from the smoothing effect revealed that it can be very difficult even for statistical models to beat Persistence for the very first look-ahead times when forecasting the regional power output. SCADA data are then necessary to improve the model performance for these first prediction horizons and a cluster structure of the prediction models is preferable. The average prediction error of the cluster approach for 1-24 hours ahead was found to be less than 10% of the total installed power.
The upscaling prediction models are integrated as on-line modules in the Armines Wind Power Prediction System (AWPPS) for predicting wind power at a regional level. In the future, these modules will be also integrated and available through the ANEMOS advanced prediction platform (http://anemos.cma.fr).
A next step of this work is to expansively investigate the behavior of the regional prediction models when adding or removing wind farms. The adaptation ability of the upscaling methods through the wind power park evolution is one of the main requirements of further developments.
VII. ACKNOWLEDGMENT This work was performed in the frame of the ANEMOS Project
(ENK-CT2002-00665) funded in part by the European Commission. The authors gratefully acknowledge ESB National Grid for providing data for the realization of the study.
VIII. REFERENCES 1. Focken U. et al, “Short-term prediction of the aggregated
power output of wind farms-A statistical analysis of the reduction of the prediction error by spatial smoothing effects”, J. Wind Eng. Ind. Aerodyn., Vol. 90 (3), 2002, pp. 231-246.
2. Focken U. et al, “Previento - A wind power prediction system with an innovative upscaling algorithm”, Proc. of the 2001 European Wind Energy Association Conference, EWEC’01, Copenhagen, Denmark, pp.826-829, 2-6 July 2001.
3. Focken U., Lange M., Heinemann D., “Previento - Regional wind power prediction with risk control”, in Proc. of the 2002 Global Windpower Conference, Paris, France, 2-5 April 2002.
4. Ernst B., Rohrig K., Schorn P., Regber H., “Managing 3000 MW power in a transmission system operation centre”, Proc. of the 2001 European Wind Energy Association Conference, EWEC’01, Copenhagen, Denmark, pp.890-893, 2-6 July 2001.
5. Nielsen T. S., Madsen H., Nielsen H. Aa., Landberg L, Giebel G., “Prediction of regional wind power”, in Proc. of the 2002 Global Windpower Conference, Paris, France, 2-5 April 2002.
6. Kariniotakis G., Mayer D., “An advanced on-line wind resource prediction system for the optimal management of wind parks”, Proc. of the 2002 MedPower Conference, Athens, Greece, 4-6 Nov. 2002.
7. Pinson P., Kariniotakis G., “On-line assessment of prediction risk for wind power production forecasts”, Proc. of the 2003 European Wind Energy Association Conference, EWEC’03, Madrid (Spain), 16-19 July 2003.