Embed Size (px)
Citation preview
1
INTER-CARBON NANOTUBE CONTACT IN THERMAL
TRANSPORT OF CONTROLLED-MORPHOLOGY
POLYMER NANOCOMPOSITES
Hai M. Duong1*, Namiko Yamamoto1, Dimitrios V. Papavassiliou2, Shigeo Maruyama3
and Brian L. Wardle1 1Department of Aeronautics and Astronautics, Massachusetts Institute of Technology, USA 2School of Chemical, Biological and Materials Engineering, University of Oklahoma, USA 3Department of Mechanical Engineering, The University of Tokyo, Tokyo, JAPAN
*Email: [email protected]
Abstract: Directional thermal conductivities of aligned carbon nanotube (CNT) polymer
nano-composites were calculated using a random walk simulation with and without inter-
carbon nanotube contact effects. The CNT-contact effect has not been explored for its role in
thermal transport, and it is shown here to significantly affect the effective transport properties
including anisotropy ratios. The primary focus of the paper is on the non-isotropic heat
conduction in aligned-CNT polymeric composites, because this geometry is an ideal thermal
layer as well as it constitutes a representative volume element of CNT-reinforced polymer
matrices in hybrid advanced composites under development. The effects of CNT orientation,
type (single vs. multi-wall), inter-CNT contact, volume fraction and thermal boundary
resistance on the effective conductivities of CNT-composites are quantified. It is found that
when the CNT-CNT thermal contact is taken into account, the maximum effective thermal
conductivity of the nanocomposite decreases ~4 times and ~2 times for the single-walled and
the multi-walled CNTs, respectively, at 20% CNT volume fraction.
Key words: carbon nanotube, composite, thermal property, thermal boundary resistance,
random walk, CNT contact
PACS: 82.20.Wt, 61.46.-w
2
1. Introduction
Carbon nanotubes (CNT) have attracted much attention as promising materials for next generation
thermal and electrical devices due to their superior thermal, mechanical and electrical properties [1, 2].
Furthermore, aligned CNTs combined with existing advanced composites are being explored for macro-
scale aerospace structures that benefit from thermal tailoring and light weight [3, 4]. Accurate thermal
transport models within different polymer nanocomposites, and larger-scale and complex composites,
remain to be developed. Few investigations have focused on thermal conductivities of aligned CNT-
containing composites, and classic models described the effective thermal conductivity based on
microscopic rather than nanoscale considerations. Thermal boundary resistance, playing a dominant role
in the determination of the effective conductivities of a composite or a suspension containing high
surface-to-volume constituents, needs to be taken into account. As there is no universally accepted
analytical solution currently available to accurately predict the thermal conductivity of CNT-containing
composites including thermal boundary resistances, it is useful to systematically study the thermal
properties of both single-walled and multi-walled CNT composites by numerical methods.
Tomadakis and Sotirchos [5,6] developed a Monte Carlo algorithm to predict the thermal conductivity of
randomly-dispersed cylinders-in-polymer without taking account of the thermal boundary resistance or
the ratio of length to diameter of the dispersed phase. Duong et al. [7,8] developed a new algorithm by
taking into account the thermal boundary resistance at the interfaces between CNTs and polymeric
matrix. None of the prior work including Duong et al.’s work has considered CNT-to-CNT contact,
which is a common occurrence when CNTs form bundles (e.g., sometimes called ropes for SWNTs) and
when SWNTs and MWNTs grown into forests, which are wavy and in touch. In this paper, the random-
walk approach is utilized to simulate heat transfer through CNTs in contact with each other, and to study
the effect of CNT-CNT heat transfer interactions on the effective thermal transport properties of polymer
nanocomposites (PNCs).
In the Duong et al. model, resistance to heat transfer at the matrix-CNT interface, known as the Kapitza
resistance, is considered explicitly in the prediction of the thermal conductivity of multi-walled CNT
(MWNT) [7] and single-walled CNT (SWNT) composites [8]. Simulation results have compared
favorably with experimental data of SWNT-polymer composites [9,10]. Since the CNT thermal
conductivity is several orders of magnitude larger than the thermal conductivity of the matrix surrounding
the CNTs, the model employs a uniform distribution of thermal walkers inside each CNT, which is
equivalent to the assumption of an infinite thermal conductivity of the CNTs relative to the matrix.
Typical conductivities for individual CNTs are in the range of 100-5,000 W/mK whereas typical thermal
conductivities for polymers are ~0.2 W/mK. As there is no experimental work measuring the thermal
boundary resistance across inter CNT contact, Maruyama et al. [11] applied molecular dynamics (MD)
simulations to estimate the thermal boundary resistance between SWNTs in a bundle. The thermal
boundary resistance, Rbd between SWNTs in a bundle was estimated to be 24.8 × 10⁻⁸ m2K/W (or the
thermal boundary conductance, Kbd = 1/Rbd = 4.04 MW/m2K). Later, Zhong et al. [12] reported systematic
MD studies of the effect of contact morphology on the thermal boundary resistance. The calculated values
range between 8 × 10⁻⁸ ∼ 11 × 10-8 m2K/W, and are slightly smaller than Maruyama et al. [11]. We used
Rbd = 24.8 × 10⁻⁸ m2K/W calculated for the natural contact morphology of bundles of SWNTs [11]. This
value is higher than the other reported boundary resistances 1.0 × 10⁻⁸ m2K/W (Kbd-PMMA=104.9
MW/m2K) for SWNT-PMMA [8] and 4.3 × 10⁻⁸ m2K/W (Kbd-epoxy = 23.4 MW/m2K) for SWNT-epoxy
[8], and it is also higher than the range of matrix-SWNT thermal boundary resistance used for simulations
in this work (see Table 1).
According to the acoustic theory for the interpretation of thermal resistance [13], the average probability
for transmission of phonons across the interface between the carbon nanotubes, fCN-CN or between the
CNT and the matrix, fm-CN is given by
ibdimiiCNi RCC
fρ
4=− (1)
where i can be the CNT or matrix; ρ is the density; C is the specific heat; Cm is the velocity of sound and
Rbd is the thermal boundary resistance.
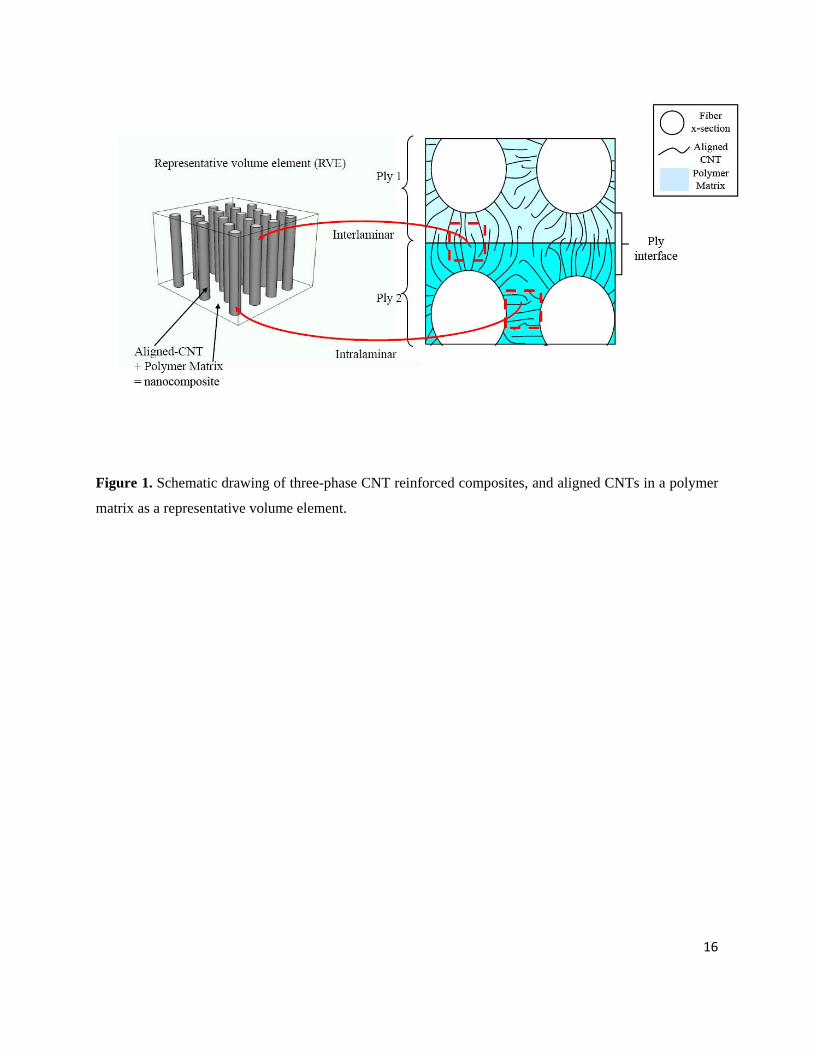
In order to model the geometrically complex system of CNT-enhanced composites, aligned CNTs in
polymer are chosen here as a representative volume element (RVE) for such composites, as shown in
Figure 1. The properties of an RVE of an aligned-CNT nanocomposite must be understood to
appropriately model the more complicated 3D hybrid composite. Here, the Duong et al. [8] model is
modified to take into account inter-CNT contact. A primary focus is the non-isotropic heat conduction in
aligned-CNT PNCs that are of interest for various heat conducting applications, and also because this
geometry constitutes a representative volume element of CNT-reinforced polymer matrices in hybrid
advanced composites (“nano-engineered” composites) under development [14]. The resistance to heat
transfer at the inter-CNT contact should become important when the matrix material has low thermal
conductivity and/or the CNT-matrix interface has a large boundary resistance. The present model is
applied for predicting and comparing thermal properties of both SWNT- and MWNT-PNCs of different
3
volume fractions with and without inter-CNT contact. Random walk simulations of thermal walkers are
used to study the effects of the interfacial resistance to heat flow inside the PNCs in the directions parallel
and perpendicular to the CNT alignment axis.
2. Simulation algorithm
The computation of the effective transport coefficients is based on an off-lattice Monte Carlo simulation
of the motion of a large number of walkers that are carriers of heat and are traveling in a computational
cell until steady-state is achieved. The computational domain for the numerical simulation is a rectangular
box with CNTs organized in the polymer matrix. The computational cell is heated from one surface (the x
= 0 plane) with the release of 90,000 hot walkers distributed uniformly on that surface at each time step.
Once the walkers contact the PNC edge, they are distributed randomly inside the CNTs and progress into
the matrix. The temperature distribution is calculated from the number of walkers found in discretized
bins in the domain after steady-state is reached. The walkers exit at the surface opposite to the heated
surface. The cell is periodic in the other two directions. The walkers move through the matrix material by
Brownian motion [15]. The Brownian motion in each space direction is simulated with random jumps that
each walker executes at each time step. These jumps take values from a normal distribution with a zero
mean and a standard deviation
tDmΔ= 2σ (2)
where Dm is the thermal diffusivity of the matrix material and Dt is the time increment. The adequacy of
the number of walkers, and of the size of the computational domain, for the calculation of the effective
thermal conductivity has been discussed previously [7].
The model assumptions may be summarized as: (1) walkers distribute uniformly once inside the CNTs
due to the high CNT thermal conductivity relative to the thermal conductivity of the matrix material; (2)
collisions between walkers and thermal boundary resistance between walls inside a MWNT are ignored;
(3) the transfer of heat is passive; (4) the thermal boundary resistance is the same for walkers coming in
and out the CNTs; (5) all walkers bounce back when they reach the heated surface; and (6) at the edge
boundary of the computational domain, walkers are distributed directly into the CNTs once they contact
the top CNT surface.
Once a walker in the matrix reaches the interface between the matrix and a CNT, the walker will move
into the CNT with a probability fm-CN, which represents the thermal resistance of the interface and will
stay at the previous position in the matrix with a probability (1-fm-CN). Similarly, once a walker is inside a
4
CNT, the walker will re-distribute randomly within the same CNT with a probability (1-fCN-m-fCN-CN) at
the end of a time step, and will distribute randomly in other CNTs in contact with the previous CNT with
a probability fCN-CN and will cross into the matrix phase with a probability fCN-m. In this latter case, the
walker moves first to a point anywhere on the surface of the CNT and then moves into the matrix with a
random jump whose magnitude takes values from a normal distribution that has a standard deviation
given by equation 2 above.
According to model assumption (4) above, the thermal resistance is the same when a walker moves from
one phase into the other, but this does not imply that fm-CN = fCN-m. In thermal equilibrium, the average
walker density within the CNTs must be equal to that in the matrix at any x-coordinate. Therefore, the
exit probability of thermal walkers fCN-m must be weighted such that the flux of walkers into the CNTs
equals that going out when they are in equilibrium. The weight factor depends only upon geometry and,
to maintain equilibrium, the two probabilities are related as follows [8]:
CNmc
cfmCN f
VACf −− =
σ (3)
where Ac and Vc are the surface area and the volume of a CNT respectively; s is the standard deviation of
the random jump in the matrix and Cf is a coefficient that we call the thermal equilibrium factor, which
depends on the reinforcement (SWNT and MWNT here) size and shape.
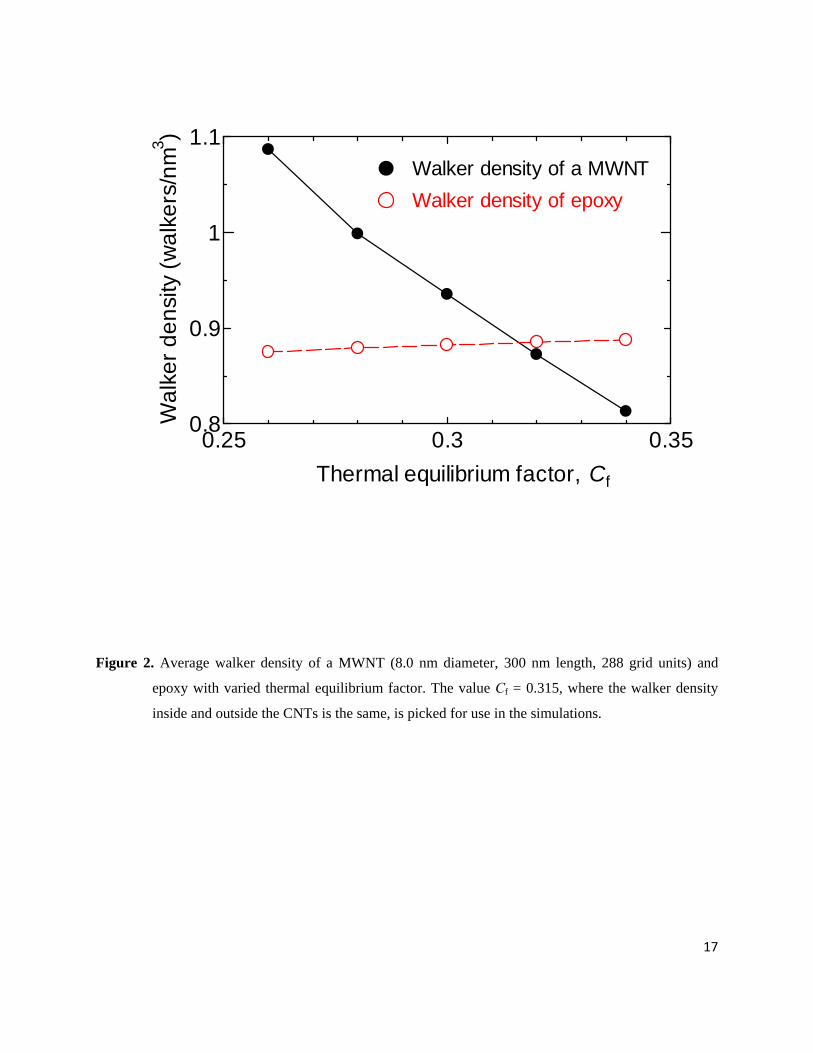
The thermal equilibrium factors Cf of the CNTs used in this work are determined numerically. The
random walk algorithm described above was used to simulate thermal equilibrium for the case of a single
CNT in the epoxy domain having length L = 300 nm and SWNT diameter DSWNT = 2.4 nm [16] and
MWNT diameter DMWNT = 8.0 nm [17]. The computation cell used was 288 × 32 × 32 (cubic grid units)
in the x, y and z directions, respectively. One CNT having its axis parallel to the x direction was placed at
the computational domain centre and thermal walkers were released uniformly (instead of being released
at x = 0) in the domain and allowed to reach equilibrium. After a simulation time that allows steady-state
to be reached, the average walker density within the CNTs should equal that in the matrix. The average
density of walkers inside and outside the MWNT is shown in Figure 2 varying with the thermal
equilibrium factor Cf. This is a geometry-dependent calculation but is not dependent on CNT aspect ratio
for high aspect ratio CNTs [18]. For the case of CNTs in contact, the Cf was calculated with the same
procedure applied to a computational box containing two CNTs in contact along their axis. The Cf values
are further confirmed by plotting the walker distribution inside the domain at different positions of the
computational cell and ensuring that there are no discontinuities in the distribution. The value of the
5
6
thermal equilibrium factor Cf is the one resulting in a uniform distribution of the walkers inside and
outside of the CNT (see also [8] for more details). In this work, Cf is assumed to be independent of the
number of CNTs in contact. In Table 1, the appropriate Cf values without the inter-CNT contact are
higher than those with the inter-CNT contact.
In order to make the calculation of the effective conductivity more rapid and straightforward, heat transfer
with constant heat flux through a domain enclosed between a hot and a cold plane is studied. In this case,
the two opposite planes release hot and cold (carrying negative energy) walkers, respectively. Further
details of the random walk algorithm can be found in [7,8]. The input simulation parameters are
summarized in Table 1. Simulation runs are conducted with different fm-CN, CNT orientation and volume
fraction of SWNTs and MWNTs in epoxy. For each CNT orientation in the computational cell and each
value of thermal boundary resistance and volume fraction of CNTs, the thermal conductivity is calculated
as the average of three simulations with different initial (randomly generated) CNT cross-sectional
locations.
3. Simulation results and discussion
3.1. Effects of volume fraction of CNTs and of thermal boundary resistance on the thermal conductivity of
the CNT-polymer composites
Heat flow was studied in a 300 × 100 × 100 nm3 (288 × 96 × 96 grid3) computational epoxy cell
containing 300-nm CNTs in length; 2.4-nm diameter SWNTs or 8.0-nm diameter MWNTs. The CNTs
were parallel or perpendicular to the direction of heat flux and extended from one end of the
computational domain to the other; in all cases the locations of the CNTs were random. The number of
CNTs in the computational cell varied from 22 to 448 (SWNTs) and from 2 to 40 (MWNTs), depending
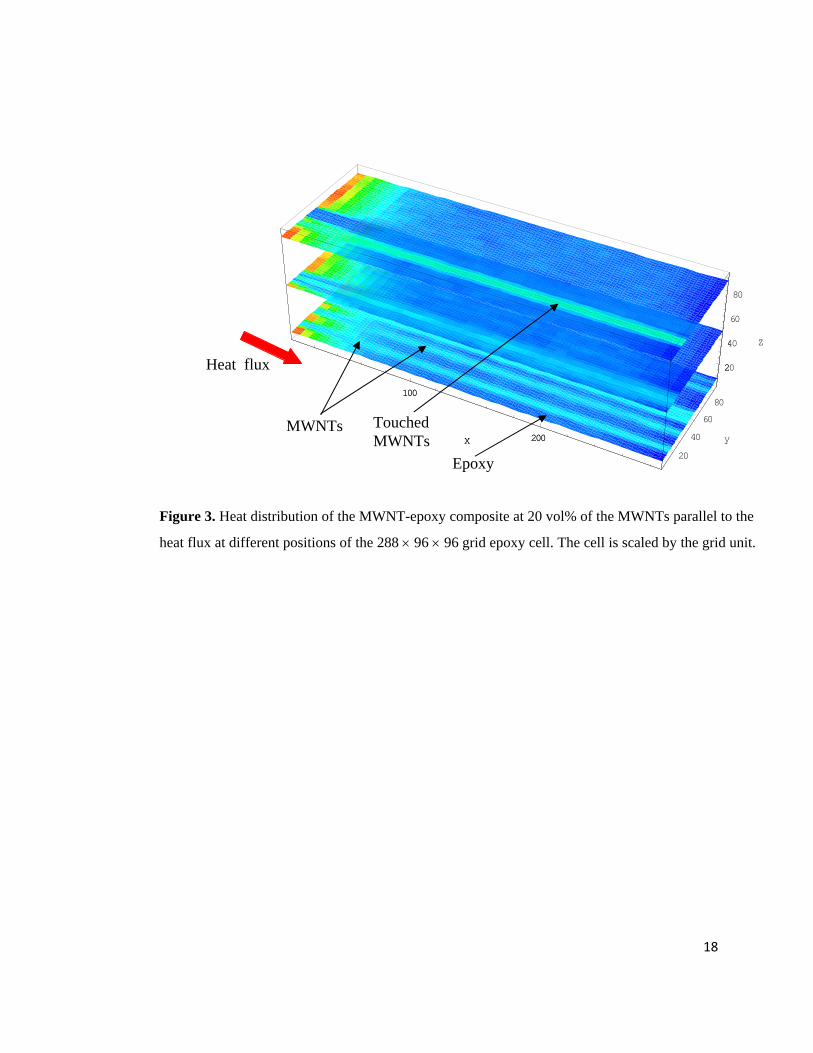
on the volume fraction of CNTs in the epoxy (1-20 vol %). The heat distribution of a MWNT-epoxy
composite is shown in Figure 3 with MWNTs parallel to the heat flux at 20 % volume fraction at different
positions in the computational cell. The simulations were conducted with different thermal resistances (fm-
CN = 1.00, 0.50, 0.20, 0.02, i.e., Rbd = 0.09, 0.17, 0.44, 4.36 [×10-8, m2K/W], respectively) and with
different CNT volume fraction (1, 8 and 20 vol %). The CNT-epoxy thermal boundary resistance values
used in this work are less than that of the CNT-CNT boundary resistance of 24.8 × 10⁻⁸ m2K/W [11] and
fall within the wider range of boundary resistance values considered by Clansy et al. [19]. The matrix
used for the simulations was epoxy with thermal conductivity Kepoxy = 0.2 W/mK.
7
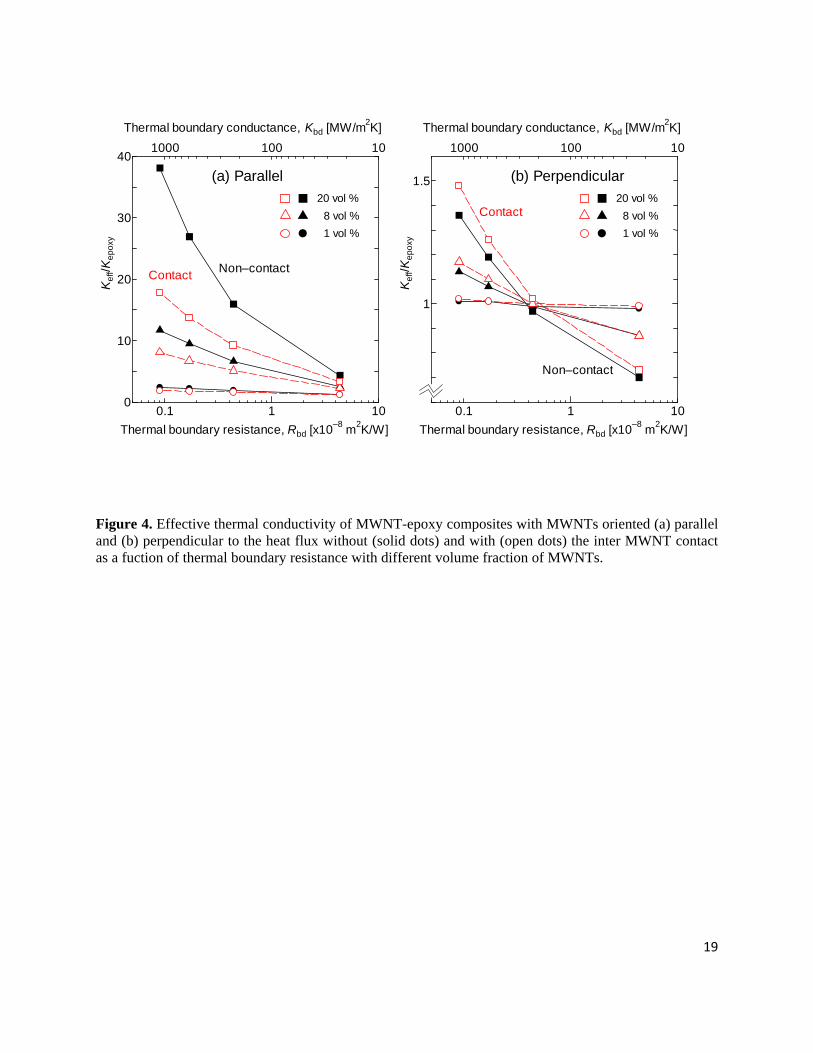
With and without the inter-CNT contact effects, the thermal conductivities of both the SWNT- and
MWNT-epoxy composites having the CNT axis parallel to heat flux are much higher than those having
CNTs perpendicular to the heat flux, as expected (see Figure 4). Similarly, increased volume fraction of
CNTs enhances all effects of transport whether in the parallel or perpendicular direction. The CNTs span
the PNC volume and therefore the PNC conductivity parallel to the CNT axis is dominated by the CNT
conductivity, and is only limited by the thermal boundary resistance. Importantly, the Rbd of the CNT-
matrix interface is the same as that for the ends of the CNTs located at the end of the computational cell.
This represents the simplest case and the CNT-domain interface resistance should be further studied and
quantified for different thermal interface materials. This explains why the conductivity in Fig 4a (along
the CNT axis) is enhanced at low Rbd but has little effect at high Rbd where heat transferred into the CNTs
from the matrix becomes vanishingly small and the CNTs act like excluded volume from a thermal
transport perspective. It follows that for the CNT-epoxy composite having CNTs perpendicular to the heat
flux, with the CNT volume fraction fixed, the thermal conductivities increase with decreasing thermal
boundary resistance. As the boundary resistance decreases, the walkers (i.e., heat) also have higher
probability of entering the CNTs and traveling (more quickly) along the radial axis of the CNTs. As
thermal boundary resistance increases (see Fig. 4b), it can dominate the perpendicular transport and a
critical value is reached (~0.5 × 10⁻⁸ m2K/W) where the CNTs do not enhance thermal conductivity in the
composite; and at higher Rbd, the CNTs reduce conductivity further. A decrease in thermal conductivity
below that of the epoxy in the transverse direction may be advantageous from a thermal tailoring
perspective and is discussed further in Fig. 5. Note that the thermal conductivity of the PNCs is lower
than that calculated from continuum theories that ignore thermal boundary resistances, e.g., the Maxwell
theory modified by Rayleigh [20]: According to the simulation results, the maximum thermal
conductivity of the MWNT-epoxy composites with 20 vol % is 7.62 W/mK, while the Maxwell theory
gives a thermal conductivity of ~600 W/mK (assuming thermal conductivity of the MWNTs of 3000
W/mK). The trend in Fig. 4b of decreased perpendicular conductivity with increased CNT volume
fraction at high Rbd is opposite that predicted by such continuum theories. Thus, depending on the values
of the boundary resistance, the trend can agree or disagree with the classical theories indicating the
importance of the thermal boundary resistances and underscoring the need for better experimental
quantification of these parameters.
3.2. Effects of inter-CNT contact
The effects of the inter-CNT contact on the effective thermal conductivity of MWNT-epoxy (in Figures
4a and 4b) and SWNT-epoxy (in Figures 7a and 7b) are discussed here. When CNTs are parallel to the
8
heat flux, the effective thermal conductivities predicted from the simulations that account for the inter-
CNT contact are smaller than those of the model without the inter-CNT contact effect, as shown in Figure
4a. The reasons for this finding are: (1) walkers in the matrix do not see as much CNT surface area to go
into, and therefore the walkers stay in the matrix longer; and (2) relatively more walkers travel along the
CNT radius and cross into adjacent CNTs rather than along the CNT axis, reducing dispersion of heat in
the direction of the heat flux. This is an interesting result that needs to be validated with experimental
measurements. Very recent results by Peters et al. [21] indicate that the thermal conductivity of SWNT-
polystyrene composites does not increase with the volume fraction of the CNTs as much as one would
predict. The reason might very well be the increase of the SWNT-SWNT contact points in the composite,
or the value of the thermal boundary resistance. When CNT-CNT contact is considered in our model, the
effective thermal conductivity decreases at a higher rate when the volume fraction of the CNTs increases,
or when the thermal boundary resistance decreases, as can be seen for example at the point for 20%
volume fraction in Figure 4a (2.1× decrease when CNT-CNT contact is considered).
For the CNTs perpendicular to the heat flux as shown in Figure 4b, with the same thermal boundary
resistance and volume fraction of the CNTs, the effective thermal conductivities of the CNT composites
when the inter-CNT transfer is taken into account is slightly higher than those without the inter-CNT
contact. This is because now thermal walkers can enter through the interface region of the CNT contact
and transfer faster along the CNT radius, cross into the next CNTs in contact, and continue along the CNT
radius (perpendicular) direction. The inter-CNT contact effect causes significant enhancement of the
effective thermal conductivity when the volume fraction of the CNTs increases and thermal boundary
resistance decreases. At 20 vol % of the MWNTs and the minimum thermal boundary resistance (fm-CN =
1.0), the effective thermal conductivity of the MWNT epoxy composites with inter CNT contact is ~1.1
times higher than that without the CNT contact effect for heat flux perpendicular to the CNTs. It is
hypothesized that the effect of CNT-CNT contact is similar to effectively increasing the radius of the
CNT: the trends considering CNT-CNT contact in both the parallel and perpendicular directions are
directly comparable to the trends observed between SWNT vs. MWNT PNCs as discussed subsequently.
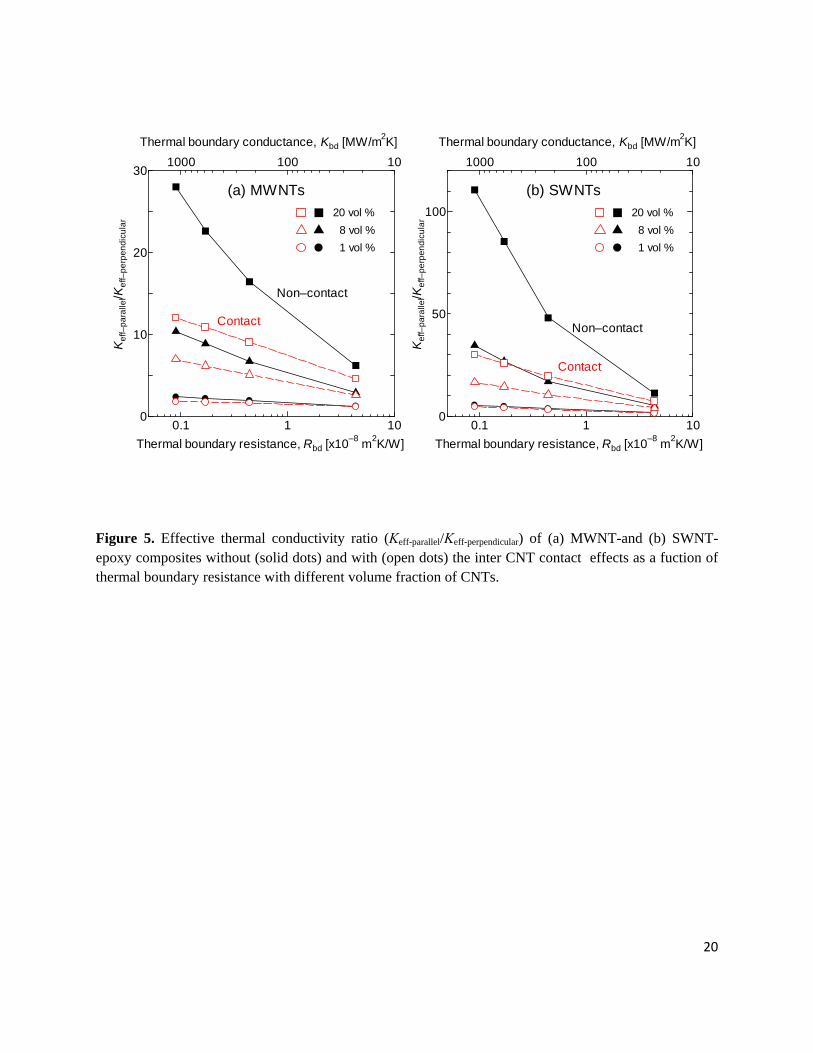
The anisotropy ratio of the effective thermal conductivities (Keff-parallel/Keff-perpendicular) of MWNT- and
SWNT-epoxy composites with CNTs parallel and perpendicular to the heat flux without and with the
inter-CNT contact are shown in Figures 5a and 5b, respectively, as a function of CNT volume fraction
and thermal boundary resistance. This anisotropy ratio represents the ratio of the largest to the smallest
eigenvalue of the effective thermal conductivity tensor, sometimes called the condition number of the
9
tensor. With the same CNT volume fraction as shown in Figure 5a, the (Keff-parallel/Keff-perpendicular) ratios of
the MWNT-epoxy composites with and without the inter-CNT contact increase at lower values of CNT-
epoxy thermal boundary resistance as expected. This trend is significant with higher volume fraction. In
all cases the anisotropy ratio is larger than unity but approaches to unity at high values of Rbd where the
CNTs act more and more like non-contributing inclusions. CNT-CNT contact effects are noted to follow
the same trend in Figures 5 as that of increasing CNT diameter. Consider the trend at the lowest value of
Rbd at 20 % vol. fraction where the SWNTs have the highest anisotropy ratio (Fig. 5b) that is reduced
substantially if CNT-CNT contact is considered. A similar decrease is noted for MWNTs. The anisotropy
ratio also decreases as CNT-CNT contact is allowed for the MWNT in Fig. 5a. The effect of CNT-CNT
contact is thus noted to be similar to increasing the effective radius of the CNT, diminishing the surface-
to-volume ratio of the conductive CNT phase. These trends and observations are consistent with the
detailed calculations presented in the next section comparing SWNT and MWNT conductivities.
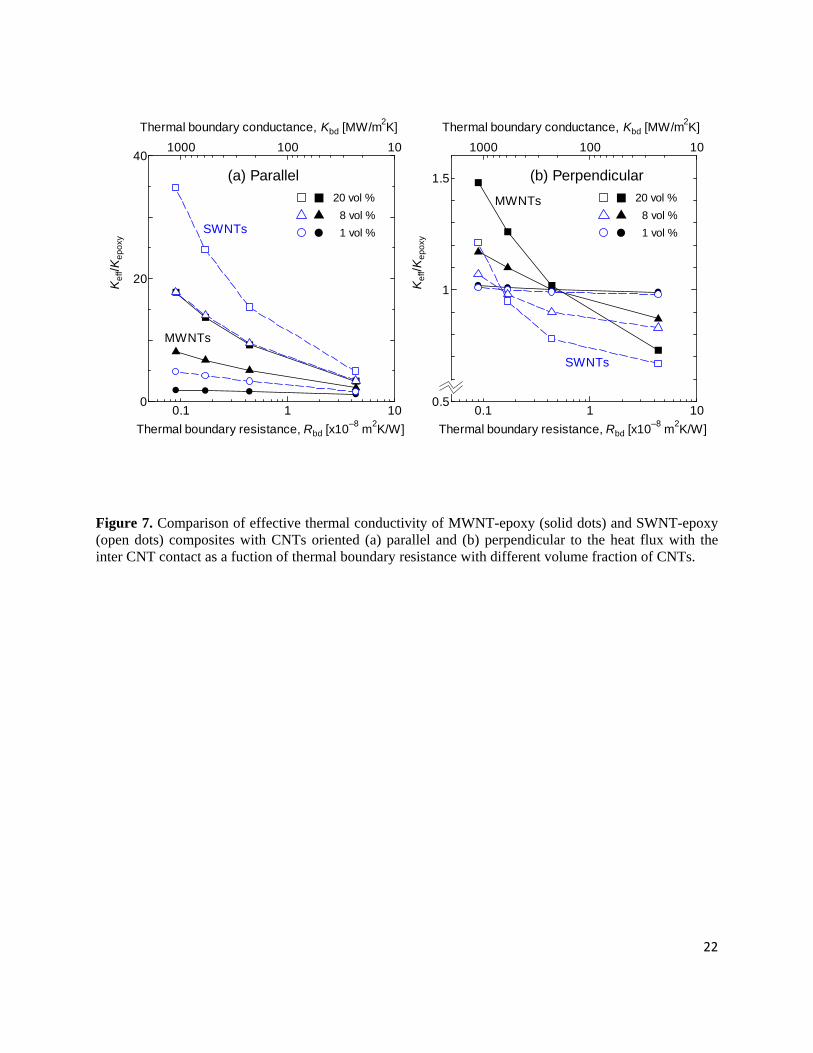
3.3. Comparison of effective thermal conductivities of SWNT- and MWNT- composites with and without
inter-carbon nanotube contact.
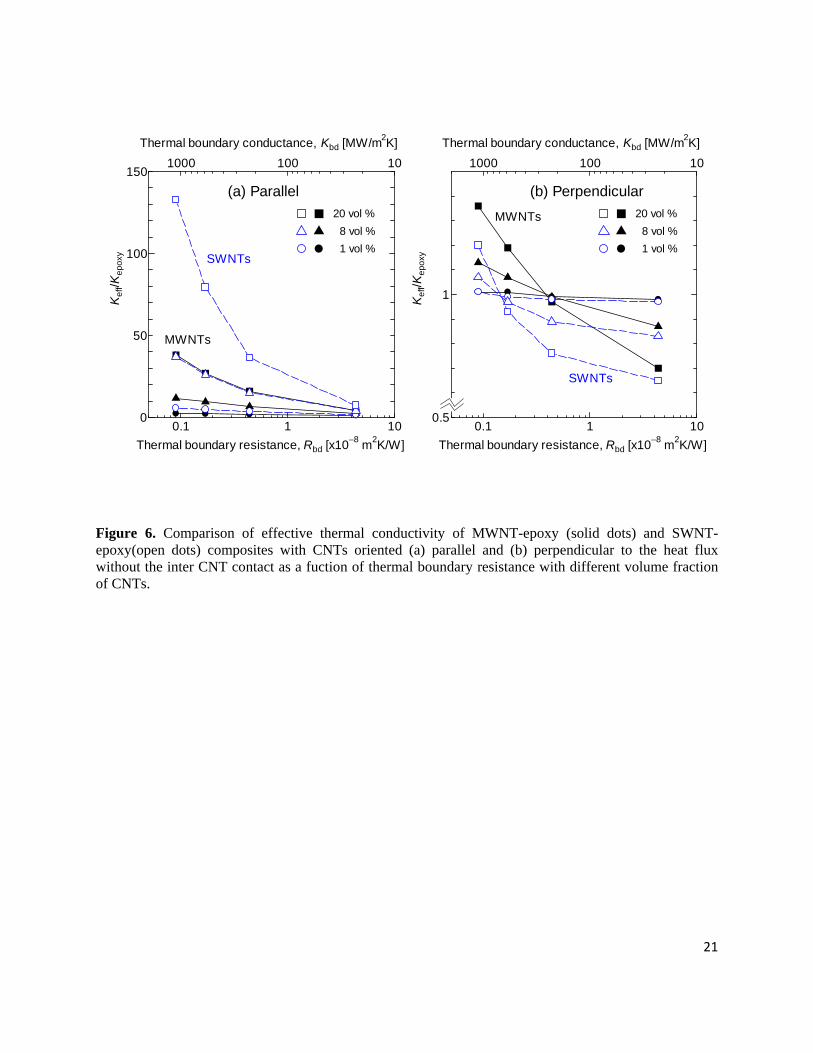
The ratio of the effective thermal conductivities without the inter-CNT contact effects for SWNT- and
MWNT-epoxy composites normalized by the thermal conductivity of the pure epoxy is shown in Figure
6. Both cases of CNTs oriented parallel and perpendicular to the heat flux are also shown in Figure 6. The
same type of data, but taking into account the inter-CNT contact, are presented as Figure 7. As the CNT
volume fraction increases, the thermal conductivity enhancement in the direction parallel to the CNTs is
more significant for SWNT-epoxy composites than MWNT-epoxy composites as seen in Figures 6a and
7a. The maximum thermal conductivity of the SWNT-polymer composite is ~3.5 times and ~2.0 times
higher than that of the MWNT-epoxy composite at 20 vol % CNT without and with the inter-CNT contact,
respectively. This can be explained because at the same CNT volume fraction, the surface to volume ratio
of the SWNTs is higher than that of the MWNTs, and, therefore, the area available for heat transfer
between the matrix and the CNTs is higher for SWNTs. Considering in Lagrangian terms, the heat
walkers are allowed more chances to come into the CNTs with the same matrix probability and therefore
they can move more rapidly along the direction of the CNT axis. It is apparent that the CNT size plays an
important role in the thermal conductivity enhancement. The same reasoning applies for the increasing
thermal conductivity with the increasing CNT volume fraction. For the CNTs perpendicular to the heat
flux as seen in Figures 6b and 7b, with the same volume fraction and thermal boundary resistance, the
thermal conductivity of the MWNT-epoxy composites is higher than that of the SWNT-epoxy ones. This
happens as the larger MWNTs allow more heat to be transferred along their radius. For a relatively small
10
thermal boundary resistance, MWNT-epoxy composites have enhanced conductivity in the perpendicular
direction relative to SWNT-epoxy composites. The above observations are consistent with the results both
with and without the inter-CNT contact.
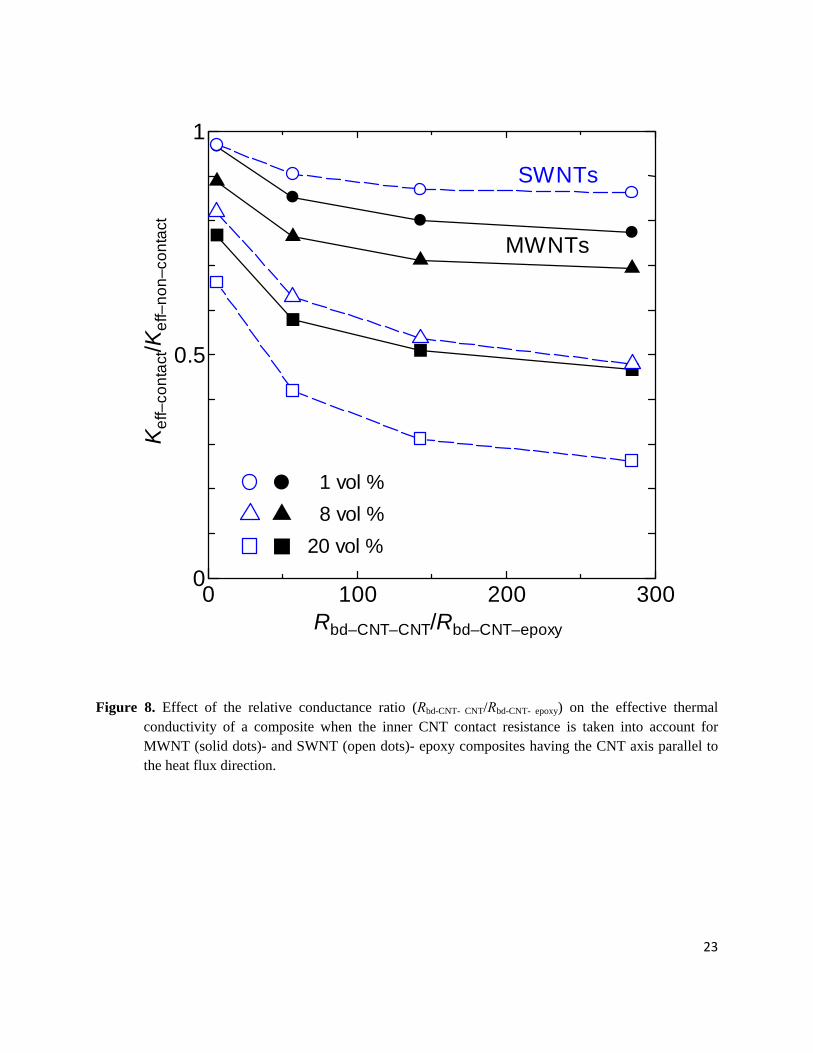
The ratio of effective thermal conductivities with and without the inter-CNT contact of the MWNT- and
SWNT-composites as a function of the relative size of the thermal boundary conductance expressed as the
ratio (Rbd-CNT-CNT/Rbd-CNT-epoxy) at different CNT volume fractions is shown in Figure 8. The thermal
boundary resistance, Rbd-CNT-CNT between SWNTs was estimated to be 24.8 × 10⁻⁸ m2K/W (Kbd-CNT-CNT =
4.04 MW/m2K) [11], much higher than the other boundary resistances Rbd-CNT-PMMA= 1.0 × 10⁻⁸ m2K/W
(Kbd-CNT-PMMA = 104.9 MW/m2K) for SWNT-PMMA [8] and Rbd-CNT-epoxy = 4.3 × 10⁻⁸ m2K/W (Kbd-CNT-epoxy
= 23.4 MW/m2K) for SWNT-epoxy [8]. The CNTs are parallel to the direction of the heat flux, which is
the case that yields the maximum effective thermal conductivity. All values of the effective thermal
conductivity ratio are less than one, indicating that the resistance to heat transfer at the CNT-CNT contact
is reducing Keff for both SWNT and MWNT composites. Furthermore, the higher the difference between
the resistance at the CNT-CNT contact and the resistance at the CNT-matrix interface, the larger the
reduction of Keff. A high Rbd-CNT-CNT effectively prohibits inter-CNT heat exchange, or equivalently, heat
transfer is blocked around part of the radius of non-contacting CNTs, thereby reducing transport in and
out of the CNT relative to the case without CNT contact.
4. Conclusions
A computational model for systematically studying the thermal conductivity of both SWNT- and MWNT-
polymer nanocomposites using a random walk algorithm has been developed. This model is more realistic
than previous random walk models, because it can take into account CNT-CNT contact points that are
important in high volume fraction CNT composites and in cases where CNTs are in bundles, as in
SWNTs. The simulation results show that the maximum thermal conductivity of the CNT composites
decreases when there is CNT-CNT contact, for the case where the thermal resistance between CNTs is
higher than that between CNTs and the polymer. This CNT-CNT resistance can dominate thermal
transport at very high volume % CNTs. The thermal conductivity of the SWNT composites is higher
(parallel to the heat flux case) and less (perpendicular to the heat flux case) than that of MWNT
composites under the same simulation conditions, with SWNTs having higher thermal anisotropy ratios
than MWNTs at otherwise equivalent simulation conditions. In addition to validating the simulation
results with experiments, further research should be conducted to determine (a) what is the range of
thermal resistance for heat transfer between CNTs; (b) what is the size of this resistance relative to the
11
thermal resistance between CNTs and the matrix material, and (c) what is the degree of CNT contacts that
causes the effective conductivity of the composite to decrease.
Acknowledgements
This work was supported by the National Computational Science Alliance under CTS-040023 and by the
TeraGrid under TG-CTS070037T. This work was also supported by Airbus S.A.S., Boeing, Embraer,
Lockheed Martin, Saab AB, Spirit AeroSystems, Textron Inc., Composite Systems Technology, and
TohoTenax through MIT’s Nano-Engineered Composite aerospace STructures (NECST) Consortium.
Namiko Yamamoto acknowledges support from MIT’s Linda and Richard (1958) Hardy Fellowship.
Dimitrios Papavassiliou acknowledges support from the DoE-funded Center for Applications of Single-
Walled Carbon Nanotubes – (Award Register#: ER64239 0012293). Shigeo Maruyama acknowledges
support from Grant-in-Aid for Scientific Research (19206024) from the Japan Society for the Promotion
of Science, SCOPE (051403009) from the Ministry of Internal Affairs and Communications and NEDO
(Japan).
References
[1] Ajayan P M, Schadler L S, Giannaris C and Rubio A 2000 Adv. Mater. 12 750
[2] Choi S U S, Zhang Z G, Yu W, Lockwood F E and Grulke E A 2001 Appl. Phys. Lett. 79 2252
[3] Garcia E J, Wardle B L, Hart J, and Slocum A 2008 Composites Part A 39 (6) 1065
[4] Garcia E J, Wardle B L, Hart J, Yamamoto N and Slocum A 2008 Comp. Sci. Tech. 68 (9) 2034
[5] Tomadakis M M and Sotirchos S V 1992 J. Chem. Phys. 98 616
[6] Tomadakis M M and Sotirchos S V 1992 J. Chem. Phys. 104 6893
[7] Duong M H, Papavassiliou D V, Mullen J K and Lee L L 2005 App. Phys. Lett. 87 013101
[8] Duong M H, Papavassiliou D V, Mullen J K and Maruyama S 2008 Nanotechnology 19 065702
[9] Bryning M B, Milkie D E, Kikkawa J M and Yodh A G 2005 Appl. Phys. Lett. 87 161909
[10] Du F, Guthy C, Kashiwagi T, Fischer J E and Winey K I 2006 J. Pol. Sci.: Part B Pol. Phys. 44 1513
[11] Maruyama S, Igarashi Y, Taniguchi Y and Shiomi J 2006 J. Ther. Sci. Tech. 1 138
[12] Zhong H and Lukes J R 2006 Phys. Rev. B 74 125403
[13] Swartz E T and Pohl R O 1989 Rev. Modern Phys. 61 605
[14] Wardle B L, Saito D S, Garcia E J, Hart A J and Guzman de Villoria R 2008 Adv. Mater. 20 2707
[15] Einstein A 1905 Ann. d. Phys. 17 549
[16] Murakami Y, Einarsson E, Edamura T and Maruyama S 2005 Carbon 43 1664
12
[17] Hart A J 2005 PhD thesis, Massachusetts Institute of Technology, p80
[18] Duong H M, Papavassiliou D V, Mullen J K, Wardle B L and Maruyama S 2008 J. Phys. Chem. C in
press
[19] Clancy T C and Gate T S 2006 Polymer 47 5990
[20] Bird R B, Stewart W S and Lightfoot E N 2002 Transport Phenomena, 2nd edition ed. New York:
John Wiley & Sons Inc.
[21] Peters J E, Papavassiliou D V and Grady B P 2008 Macromolecules accepted
[22] Collins P G and Phaedon A2000 Scientific American 67, 68 and 69
[23] Hone J, Whitney M and Zettl A 1999 Syn. Metals. 103 2499
[24] Hepplestone S P, Ciavarella A M, Janke C and Srivastava G P 2006 Surface Science 600 3633
[25] Yutopian, Thermal and Mechanical Properties of Epoxy, 2000, June 2008
http://www.yutopian.com/Yuan/prop/Epoxy.html
[26] Bick A and Dorfmueller T 1989 NATO ASI Ser., Ser. C 291 389
13
Tables
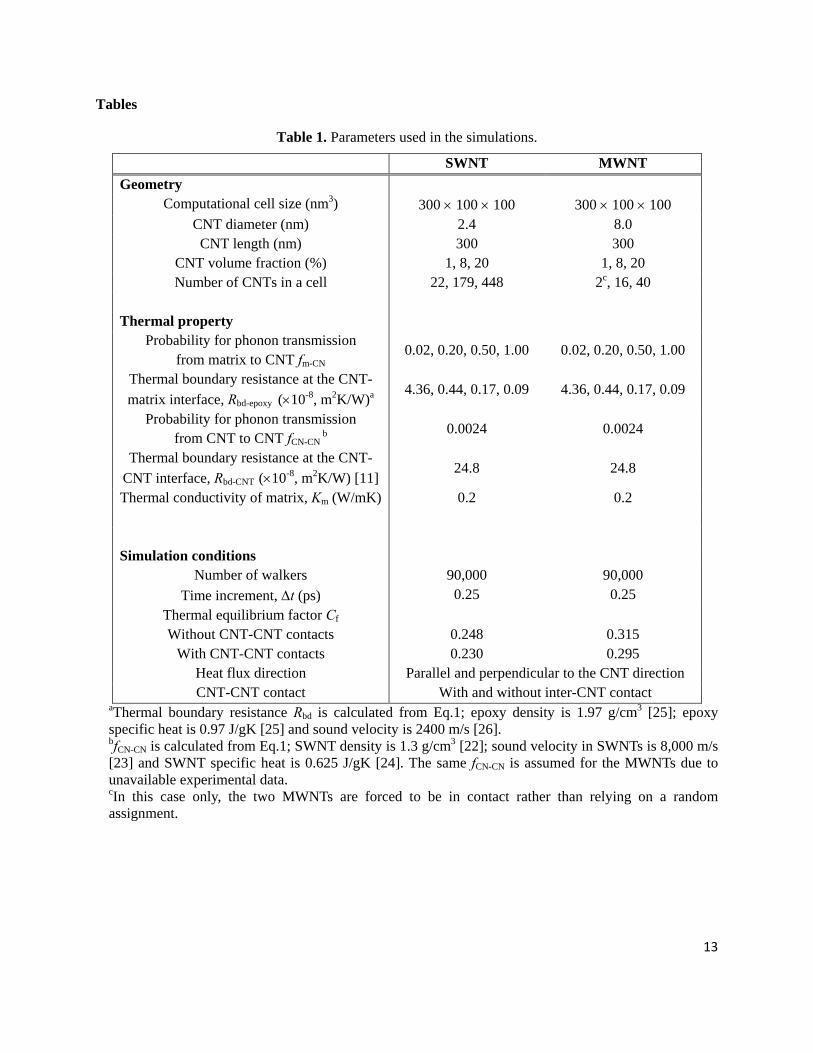
Table 1. Parameters used in the simulations.
SWNT MWNT Geometry
Computational cell size (nm3) 300 × 100 × 100 300 × 100 × 100 CNT diameter (nm) 2.4 8.0 CNT length (nm) 300 300
CNT volume fraction (%) 1, 8, 20 1, 8, 20 Number of CNTs in a cell 22, 179, 448 2c, 16, 40
Thermal property
Probability for phonon transmission from matrix to CNT fm-CN
0.02, 0.20, 0.50, 1.00 0.02, 0.20, 0.50, 1.00
Thermal boundary resistance at the CNT-matrix interface, Rbd-epoxy
(×10-8, m2K/W)a 4.36, 0.44, 0.17, 0.09 4.36, 0.44, 0.17, 0.09
Probability for phonon transmission from CNT to CNT fCN-CN
b 0.0024 0.0024
Thermal boundary resistance at the CNT-CNT interface, Rbd-CNT
(×10-8, m2K/W) [11]
24.8 24.8
Thermal conductivity of matrix, Km (W/mK) 0.2 0.2
Simulation conditions
Number of walkers Time increment, Δt (ps)
90,000 0.25
90,000 0.25
Thermal equilibrium factor Cf Without CNT-CNT contacts
With CNT-CNT contacts
0.248 0.230
0.315 0.295
Heat flux direction Parallel and perpendicular to the CNT direction CNT-CNT contact With and without inter-CNT contact
aThermal boundary resistance Rbd is calculated from Eq.1; epoxy density is 1.97 g/cm3 [25]; epoxy specific heat is 0.97 J/gK [25] and sound velocity is 2400 m/s [26]. bfCN-CN is calculated from Eq.1; SWNT density is 1.3 g/cm3 [22]; sound velocity in SWNTs is 8,000 m/s [23] and SWNT specific heat is 0.625 J/gK [24]. The same fCN-CN is assumed for the MWNTs due to unavailable experimental data. cIn this case only, the two MWNTs are forced to be in contact rather than relying on a random assignment.
14
Figure Captions
Figure 1. Schematic drawing of three-phase CNT reinforced composites, and aligned CNTs in a polymer
as a representative volume element.
Figure 2. Average walker density of a MWNT (8.0 nm diameter, 300 nm length, 288 grid units) and
epoxy with varied thermal equilibrium factor. The value Cf = 0.315, where the walker density
inside and outside the CNTs is the same, is picked for use in the simulations.
Figure 3. Heat distribution of the MWNT-epoxy composite at 20 vol % of the MWNTs parallel to the
heat flux at different positions of the 288 × 96 × 96 grid epoxy cell. The cell is scaled by the grid
unit.
Figure 4. Effective thermal conductivity of MWNT-epoxy composites with MWNTs oriented (a) parallel
and (b) perpendicular to the heat flux without (solid dots) and with (open dots) the inter MWNT
contact as a fuction of thermal boundary resistance with different volume fraction of MWNTs.
Figure 5. Effective thermal conductivity ratio (Keff-parallel/Keff-perpendicular) of (a) MWNT-and (b) SWNT-
epoxy composites without (solid dots) and with (open dots) the inter CNT contact effects as a
fuction of thermal boundary resistance with different volume fraction of CNTs.
Figure 6. Comparison of effective thermal conductivity of MWNT-epoxy (solid dots) and SWNT-epoxy
(open dots) composites with CNTs oriented (a) parallel and (b) perpendicular to the heat flux
without the inter CNT contact as a fuction of thermal boundary resistance with different volume
fraction of CNTs.
Figure 7. Comparison of effective thermal conductivity of MWNT-epoxy (solid dots) and SWNT-epoxy
(open dots) composites with CNTs oriented (a) parallel and (b) perpendicular to the heat flux with
the inter CNT contact as a fuction of thermal boundary resistance with different volume fraction
of CNTs.
Figure 8. Effect of the relative conductance ratio (Rbd-CNT- CNT/Rbd-CNT- epoxy) on the effective thermal
conductivity of a composite when the inner CNT contact resistance is taken into account for
15
MWNT (solid dots)- and SWNT (open dots)- epoxy composites having the CNT axis parallel to
the heat flux direction.
16
Figure 1. Schematic drawing of three-phase CNT reinforced composites, and aligned CNTs in a polymer
matrix as a representative volume element.
0.25 0.3 0.350.8
0.9
1
1.1
Thermal equilibrium factor, Cf
Wal
ker d
ensi
ty (w
alke
rs/n
m3 )
Walker density of a MWNTWalker density of epoxy
Figure 2. Average walker density of a MWNT (8.0 nm diameter, 300 nm length, 288 grid units) and
epoxy with varied thermal equilibrium factor. The value Cf = 0.315, where the walker density
inside and outside the CNTs is the same, is picked for use in the simulations.
17
100
200X
20
40
60
80
y
20
40
60
80
Z
100
200X
20
4
Figure 3. Heat distribution of the MWNT-epoxy composite at 20 vol% of the MWNTs parallel to the
heat flux at different positions of the 288 × 96 × 96 grid epoxy cell. The cell is scaled by the grid unit.
Heat flux
MWNTs
Epoxy
TouchedMWNTs
18
19
0.1 1 100
10
20
30
401000 100 10
Thermal boundary resistance, Rbd [x10–8 m2K/W]
Kef
f/Kep
oxy
20 vol % 8 vol % 1 vol %
Thermal boundary conductance, Kbd [MW/m2K]
(a) Parallel
Non–contact
0.1 1 10
1
1.5
1000 100 10
Thermal boundary resistance, Rbd [x10–8 m2K/W]
Kef
f/Kep
oxy
20 vol % 8 vol % 1 vol %
Thermal boundary conductance, Kbd [MW/m2K]
(b) Perpendicular
Contact
Contact
Non–contact
Figure 4. Effective thermal conductivity of MWNT-epoxy composites with MWNTs oriented (a) parallel and (b) perpendicular to the heat flux without (solid dots) and with (open dots) the inter MWNT contact as a fuction of thermal boundary resistance with different volume fraction of MWNTs.
0.1 1 100
10
20
301000 100 10
Thermal boundary resistance, Rbd [x10–8 m2K/W]
Kef
f–pa
ralle
l/Kef
f–pe
rpen
dicu
lar
20 vol % 8 vol % 1 vol %
Thermal boundary conductance, Kbd [MW/m2K]
(a) MWNTs
Non–contact
0.1 1 100
50
100
1000 100 10
Thermal boundary resistance, Rbd [x10–8 m2K/W]
Kef
f–pa
ralle
l/Kef
f–pe
rpen
dicu
lar
20 vol % 8 vol % 1 vol %
Thermal boundary conductance, Kbd [MW/m2K]
(b) SWNTs
Non–contactContact
Contact
Figure 5. Effective thermal conductivity ratio (Keff-parallel/Keff-perpendicular) of (a) MWNT-and (b) SWNT-epoxy composites without (solid dots) and with (open dots) the inter CNT contact effects as a fuction of thermal boundary resistance with different volume fraction of CNTs.
20
0.1 1 100
50
100
1501000 100 10
Thermal boundary resistance, Rbd [x10–8 m2K/W]
Kef
f/Kep
oxy
20 vol % 8 vol % 1 vol %
Thermal boundary conductance, Kbd [MW/m2K]
(a) Parallel
SWNTs
MWNTs
0.1 1 100.5
1
1000 100 10
Thermal boundary resistance, Rbd [x10–8 m2K/W]
Kef
f/Kep
oxy
20 vol % 8 vol % 1 vol %
Thermal boundary conductance, Kbd [MW/m2K]
(b) Perpendicular
SWNTs
MWNTs
Figure 6. Comparison of effective thermal conductivity of MWNT-epoxy (solid dots) and SWNT-epoxy(open dots) composites with CNTs oriented (a) parallel and (b) perpendicular to the heat flux without the inter CNT contact as a fuction of thermal boundary resistance with different volume fraction of CNTs.
21
0.1 1 100
20
401000 100 10
Thermal boundary resistance, Rbd [x10–8 m2K/W]
Kef
f/Kep
oxy
20 vol % 8 vol % 1 vol %
Thermal boundary conductance, Kbd [MW/m2K]
(a) Parallel
SWNTs
MWNTs
0.1 1 100.5
1
1.5
1000 100 10
Thermal boundary resistance, Rbd [x10–8 m2K/W]K
eff/K
epox
y
20 vol % 8 vol % 1 vol %
Thermal boundary conductance, Kbd [MW/m2K]
(b) Perpendicular
SWNTs
MWNTs
Figure 7. Comparison of effective thermal conductivity of MWNT-epoxy (solid dots) and SWNT-epoxy (open dots) composites with CNTs oriented (a) parallel and (b) perpendicular to the heat flux with the inter CNT contact as a fuction of thermal boundary resistance with different volume fraction of CNTs.
22
0 100 200 3000
0.5
1
Rbd–CNT–CNT/Rbd–CNT–epoxy
Kef
f–co
ntac
t/Kef
f–no
n–co
ntac
t
20 vol % 8 vol % 1 vol %
SWNTs
MWNTs
Figure 8. Effect of the relative conductance ratio (Rbd-CNT- CNT/Rbd-CNT- epoxy) on the effective thermal
conductivity of a composite when the inner CNT contact resistance is taken into account for MWNT (solid dots)- and SWNT (open dots)- epoxy composites having the CNT axis parallel to the heat flux direction.
23