Embed Size (px)
Citation preview

INTELLIGENT GRID IN A NEW HOUSING DEVELOPMENT
W. SAMAN, E. HALAWA, L. MUDGE, J. EDWARDS
Sustainable Energy CentreInstitute for Sustainable Systems and Technologies
University of South AustraliaMawson Lakes SA 5095, Mawson Lakes – Adelaide, Australia
SEC - ISST
1. Background
2. The Lochiel Park Green Village
3. The Green Features
4. Impacts on Energy Use, Peak Demand and GHG Emission
5. Householders’ Interaction with Smart Technologies
6. Conclusions
CONTENTS

SEC - ISST
BACKGROUND
• Residential buildings represent 20% of Australia’s greenhouse gas emissions
• Residential buildings are responsible for escalating peak demand
• Lack of hard evidence of the impact of demand side management / distributed generation
• Lack of integrated technical/socioeconomic evaluation
• Australia’s CSIRO Energy Flagship Clusters program
• 3 year project: July 2008 – June 2011

South Australia’s Total System Peak Demand and averaged across
the period 1 December 2007 – 31 March 2008 (ESCOSA, 2008)
Impact on Peak Demand
BACKGROUND

Peak day load profile for the ETSA utilities system on 8 February 2001 (ESCOSA, 2007)
Impact on Peak Demand
BACKGROUND

Recent Peak Demand Related Events (Australia)
• extreme heat waves • dramatic increase in use of air conditioners • rise in state peak demand• load shedding (30 Jan 2009) – 90 MW power short fall• heat wave related deaths
• dwellings’ total reliance of on air conditioners powered by conventional centralised electricity generation
BACKGROUND

• Two year monitoring program: to enable the validation of the energy, economic and social interaction models
• Hard evidence of the benefits of the greater use of smart features and distributed generation
• Developing practical experience in incorporating smart features and distributed energy
• An integrated technical, environmental, social and economic evaluation of the impact of intelligent and distributed energy features in the housing sector
• To show how well designed homes with passive design and smart features contribute to reducing energy consumption, peak demand and GHG emissions
THE OBJECTIVES

• SA Government initiative with “a clear objective of building ecologically sustainable homes within a natural bush and parkland settings ...”
• Master plan finalised 2005
• 106 houses including social housing
• Released to market, November 06, mostly sold
As of November 2009:
• 40 homes are being built
• 14 homes occupied – 5 detailed monitoring, 9 general monitoring
THE LOCHIEL PARK GREEN VILLAGE
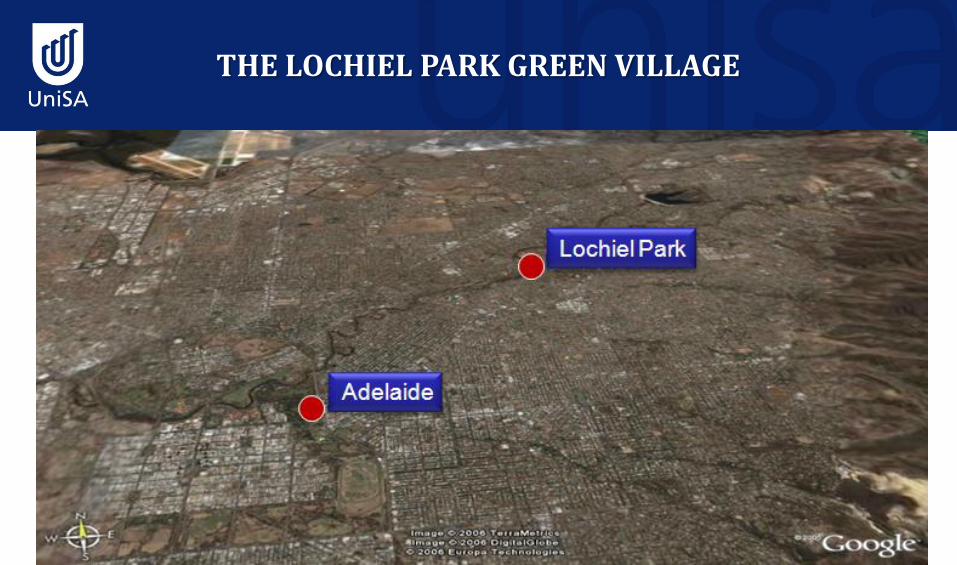
Lochiel Park
Adelaide
THE LOCHIEL PARK GREEN VILLAGE

Some Preliminary Results
• Total Site Area: 14.71 Ha
• Open Space: 10.51 Ha
• Residential/Housing: 4.20 Ha
THE LOCHIEL PARK GREEN VILLAGE

THE GREEN FEATURES
• passive design: homes with minimum 7.5 stars (using AccuRate)
• Use low embodied energy building materials
• best available energy efficient appliances
• use of solar electricity : 1 kW/100m2 of living area
• electrical load limiting devices (2, 3 or 4 kVA)
• special bundled tariff incorporating green power
• smart metering and energy usage display
• gas boosted solar hot water systems
• Day lighting, skylights and energy efficient lights
* MJ/m2-a
1 480
2 325
3 227
4 165
5 125
* MJ/m2-a
6 96
7 70
8 46
9 22
10 3
Adelaide NatHERS Star Band

IMPACTS ON ENERGY USE, PEAK DEMAND AND GHG EMISSIONS
2003: 2.5 stars 2008: 5 stars 2009:7.5 stars

SEC - ISST
IMPACTS ON ENERGY USE, PEAK DEMAND AND GHG EMISSIONS
(www.lochielpark.com)

Breakdown of energy use in the 7.5 star house
IMPACTS ON ENERGY USE, PEAK DEMAND AND GHG EMISSIONS

Item 7.5 star Home 5 star home 2.5 star Home
FloorStandard concrete with
carpet + felt underlay
Standard concrete withcarpet + felt underlay
Concrete slab
Roof insulation R4 R2.5 R2.5
Roof construction Metal deck Metal deck Terracotta tiles
CeilingR2 insulation with ceiling
fan
R2 insulation with ceiling fan
R1 insulation
no ceiling fan
External wall materialReverse brick veneer with
insulationBrick veneer un-insulated Brick single skin
Shading devices Holland blind Heavy drapes only Open weave
Windows tightness Weather-strippedAll windows gap size setto medium
All windows gap size set
to large
Door tightness Weather-strippedAll door gap sizes set tomedium
All door gap sizes set to
large
Glazing Low E double glazing Single glazing Single glazing
Specifications of the 7.5, 5 and 2.5 star rated houses
IMPACTS ON ENERGY USE, PEAK DEMAND AND GHG EMISSIONS

Roof/ceiling insulation R 4.0
External wall insulation R 3.5
External wall Reverse brick veneer with R 2.5 insulation
Floor Standard concrete with carpet and felt underlay
Windows Double glazed 4 mm clear with 12 mm argon filled
and low E film.
Door Solid construction
Area-adjusted heating requirement 15 MJ/m2-annum
Area-adjusted cooling requirement 37.5 MJ/m2-annum
Cooling / heating system Reverse cycle (6 star)
Hot water system Solar / gas boost
Installed PV system capacity 2.4 kW
Specifications of the 7.5 star rated house

Annual Energy (Electricity and Gas) Consumption and GHG emissions (in MJ)
Star Rating 2.5 5 7.5
Energy source E G E G E G
Water Heating 21240 22830 8640
Space Heating 4693 3137 1411
Space Cooling 5172 3608 2567
Cooking 2527 2246 1872
Lighting 1130 848 269
Other Appliances 11113 10883 10653
Standby Energy 2167 924 745
Total energy consumption 45516 2527 19399 25076 15645 10512
Total energy generated 15552
Total electricity consumption 45516 19399 93
Total gas energy consumption 2527 25076 10512
Emissions - electrical, kg-CO2-e 13200 5626 27
Emissions - gas, kg-CO2-e 186.5 1850.6 775.8
Total emissions 13386 7476 803
IMPACTS ON ENERGY USE, PEAK DEMAND AND GHG EMISSIONS
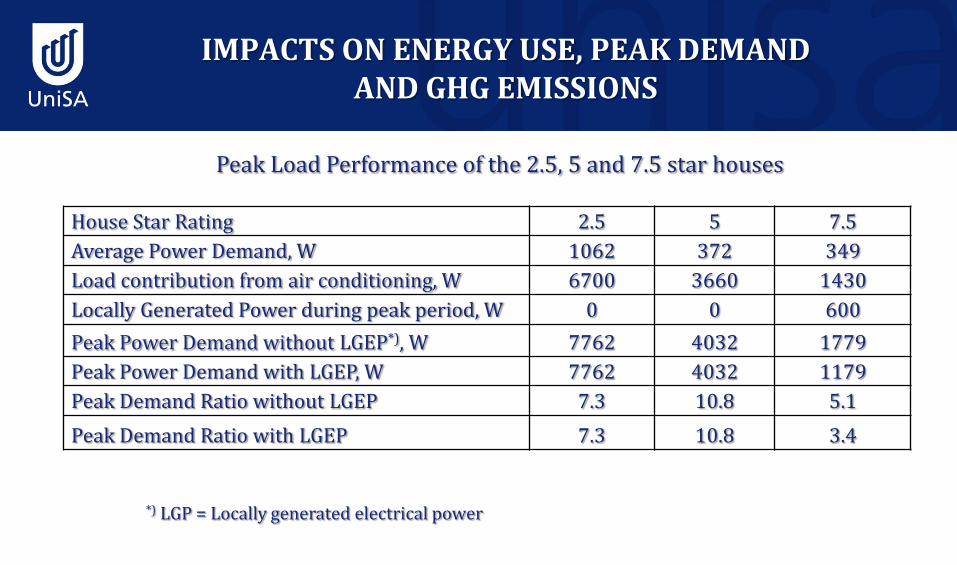
Peak Load Performance of the 2.5, 5 and 7.5 star houses
House Star Rating 2.5 5 7.5
Average Power Demand, W 1062 372 349
Load contribution from air conditioning, W 6700 3660 1430
Locally Generated Power during peak period, W 0 0 600
Peak Power Demand without LGEP*), W 7762 4032 1779
Peak Power Demand with LGEP, W 7762 4032 1179
Peak Demand Ratio without LGEP 7.3 10.8 5.1
Peak Demand Ratio with LGEP 7.3 10.8 3.4
*) LGP = Locally generated electrical power
IMPACTS ON ENERGY USE, PEAK DEMAND AND GHG EMISSIONS

0
2000
4000
6000
8000
10000
12000
14000
2.5 star 5 star 7.5 star
emissions gas
emissions electricity
IMPACTS ON ENERGY USE, PEAK DEMAND AND GHG EMISSIONS

Combined passive design, energy efficient appliances and local solar energy use will result in: • Net zero energy homes• reduced peak demand• Reduced GHG emissions
We are achieving this in theLochiel Park Green village
IMPACTS ON ENERGY USE, PEAK DEMAND AND GHG EMISSIONS

HOUSEHOLD INTERACTION WITH SMART TECHNOLOGIES
• Real time display and touch screen interaction & control• Enables householders to:
• check real time • use of energy, water and gas • energy generated by PV panels• cost of energy and water used• GHG emitted
• program the load limiting device • Under investigation – we are developing qualitative
instruments to study related human behavior and attitude• Preliminary observation:
• Householders “enjoy / exited”• Positive impact on sustainability behavior

SEC - ISST
“Just thought you might be interested. It is 14 degrees outside today. In the family room of our house, it is 24 and near the main windows, it is 30 …. We are in short sleeves today”
An email message from a Lochiel Park Green Village householder (winter 2009)
HOUSEHOLD INTERACTION WITH SMART TECHNOLOGIES

0.0
0.5
1.0
1.5
2.0
2.5
0:0
01
:30
3:0
04
:30
6:0
07
:30
9:0
01
0:3
01
2:0
01
3:3
01
5:0
01
6:3
01
8:0
01
9:3
02
1:0
02
2:3
00
:00
1:3
03
:00
4:3
06
:00
7:3
09
:00
10
:30
12
:00
13
:30
15
:00
16
:30
18
:00
19
:30
21
:00
22
:30
0:0
01
:30
3:0
04
:30
6:0
07
:30
9:0
01
0:3
01
2:0
01
3:3
01
5:0
01
6:3
01
8:0
01
9:3
02
1:0
02
2:3
0
Net grid power PV generated power
Time, hrs
Po
we
r, k
W
Electric power imported & generated: 1 – 3 April 2009
SOME PRELIMINARY DATA

Electric power imported & generated: 4 – 6 April 2009
0.0
0.5
1.0
1.5
2.0
2.5
3.0
0:0
01:1
52:3
03:4
55:0
06:1
57:3
08:4
510:0
011:1
512:3
013:4
515:0
016:1
517:3
018:4
520:0
021:1
522:3
023:4
51:0
02:1
53:3
04:4
56:0
07:1
58:3
09:4
511:0
012:1
513:3
014:4
516:0
017:1
518:3
019:4
521:0
022:1
523:3
00:4
52:0
03:1
54:3
05:4
57:0
08:1
59:3
010:4
512:0
013:1
514:3
015:4
517:0
018:1
519:3
020:4
522:0
023:1
5
Net grid power PV generated power
Time, hrs
Po
we
r, k
W
SOME PRELIMINARY DATA

Daily Gas Consumption (MJ): 6 – 12 April 2009
0
2
4
6
8
10
12
14
06
-Ap
r-0
9
07
-Ap
r-0
9
08
-Ap
r-0
9
09
-Ap
r-0
9
10
-Ap
r-0
9
11
-Ap
r-0
9
12
-Ap
r-0
9
SOME PRELIMINARY DATA

SEC - ISST
SOME PICTURES FROM LOCHIEL PARK GREEN VILLAGE

SOME PICTURES FROM LOCHIEL PARK GREEN VILLAGE
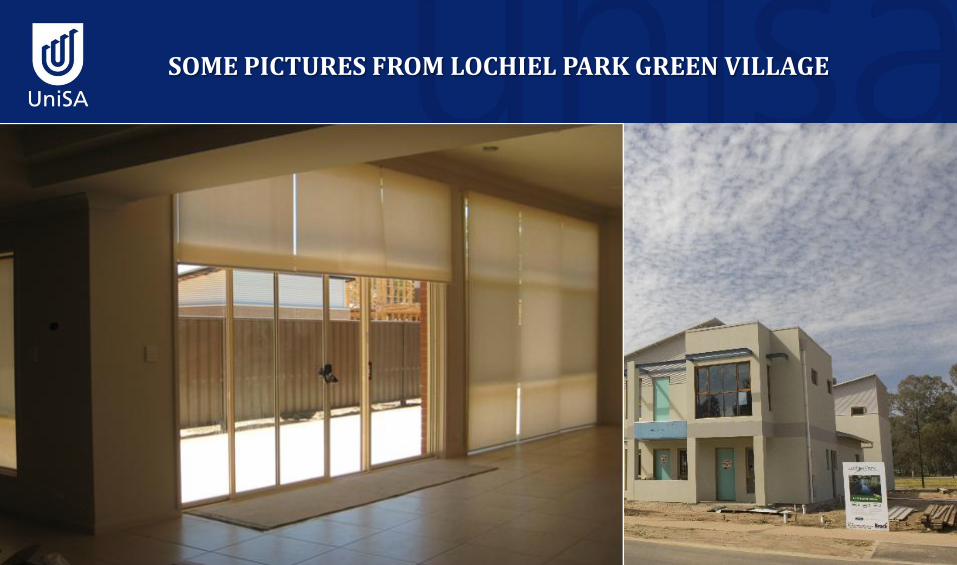
SOME PICTURES FROM LOCHIEL PARK GREEN VILLAGE

SEC - ISST
SOME PICTURES FROM LOCHIEL PARK GREEN VILLAGE

SOME PICTURES FROM LOCHIEL PARK GREEN VILLAGE

SEC - ISST
SOME PICTURES FROM LOCHIEL PARK GREEN VILLAGE

SOME PICTURES FROM LOCHIEL PARK GREEN VILLAGE

SOME PICTURES FROM LOCHIEL PARK GREEN VILLAGE

CONCLUSIONS
combined passive design, energy efficientappliances, local solar energy use andsmart features will result in:
• net zero energy homes• reduced peak demand of dwellings• reduced GHG emissions

USEFUL LINKS
• Lochiel Park Green Village:
• www.lochielpark.com.au
• www.lochielparkonline.com.au
• ISST-UniSA: www.unisa.edu.au/isst/
• CSIRO iGrid Cluster Website: www.igrid.com.au
• Contacts: Wasim Saman: [email protected] Halawa: [email protected]