Embed Size (px)
Citation preview
Authors:
Prof. Arindam Ghosh and Manjula Dewadasa
INTELLIGENT GRID
RESEARCH CLUSTER-PROJECT 7
Operation Control and Energy Management of Distributed Generation
Queensland University of Technology
1
INTELLIGENT GRID RESEARCH CLUSTER
Operation control and Energy Management of grid connected Distributed Generation in based on a microgrid
CONTENTS
EXECUTIVE SUMMARY 5
ABBREVIATIONS 10
1.INTRODUCTION 11
2.MICROGRID DROOP CONTROL 16
2.1. Conventional Frequency and Voltage Droop Control 16
2.2. Angle Droop Control for DGs 18
2.3. Proposed Integral to System Droop Line Control 22
2.4. Summary 28
3.POWER MANAGEMENT IN MICROGRIDS 29
3.1. Control Strategies for Power Management 29
3.2. Summary 31
4.CONVERTER CONTROL 32
4.1. Voltage Source Converter Structure 32
4.2. Control of Converter with Filters 34
4.3. Summary 39
5.PARALLEL OPERATION OF DGS 40
5.1. Stability Analysis with Voltage Source Model 40
5.2. Stability Analysis with Converter Model 45
5.3. Summary 55
6.MICROGRID PROTECTION 56
6.1. Protection with overcurrent relays 56
6.2. Protection using ITA relays 68
6.3. Protection using Current Differential Relays 73
2
INTELLIGENT GRID RESEARCH CLUSTER
Operation Control and Energy Management of grid connected Distributed Generation
6.4. Summary 83
7.CONCLUSIONS 88
8.REFERENCE LIST 90
LIST OF FIGURES
Figure 2. Frequency droop characteristic of a generator 17
Figure 3. Voltage droop characteristic of a generator 18
Figure 4. DG connection to microgrid 19
Figure 5. DG connection to microgrid 20
Figure 6. Frequency variation with angle droop control 22
Figure 7. Frequency variation with frequency droop control 22
Figure 8: Schematic diagram of two DGs sharing loads 24
Figure 9. Real and reactive power sharing with conventional droop controls 25
Figure 10. The variation of DG droop frequency settings 25
Figure 11. Real and reactive power sharing with integral droop 26
Figure 12. Diesel generator with two converter interfaced DGs 27
Figure 13. Power sharing with diesel generator and two converter interfaced DGs 27
Figure 14. The variation of system frequency 27
Figure 15. Frequency droop characteristics for BS and diesel generator 30
Figure 16. An H-bridge VSC 32
Figure 17. Single-phase VSC equivalent circuit with (a) LC and (b) LCL filter 33
Figure 18. Converter structure 33
Figure 19. Three different feedback control structures: (a) full state feedback, (b) partial state feedback with high-pass filter and (c) partial state feedback with feed forward control 34
Figure 20. H-bridge converter with LC filter connected to an RL plus back emf load 36
Figure 21. Closed-loop frequency response for various values of. 36
Figure 22. Closed-loop phase shift for two values of 37
Figure 23. Voltage tracking performance for a 50 Hz reference voltage 37
Figure 24. The current control structure 38
3
INTELLIGENT GRID RESEARCH CLUSTER
Operation Control and Energy Management of grid connected Distributed Generation
Figure 25. H-bridge converter with LCL filter connected to an RL plus back emf load 38
Figure 26. Current tracking with incomplete system knowledge 38
Figure 27. Single-line diagram of two converters supplying a load 40
Figure 28. Relation between d-q and D-Q frames 42
Figure 29. Eigenvalue trajectory of the two converter system 45
Figure 30. Single-phase equivalent circuit of VSC 46
Figure 31. Single-line diagram of parallel operation of two VSCs 51
Figure 32. Eigenvalues plots from stability analysis 54
Figure 33. VSC-2 output power showing stable, undamped and unstable 55
Figure 34. Proposed DG behavior during a fault 58
Figure 35. Proposed restoration characteristic for a DG 58
Figure 36. The proposed VSC control algorithm 59
Figure 37. Simulated radial feeder with DGs 62
Figure 38. Relay tripping characteristics in forward direction 63
Figure 39. DG1 response before, during and after the fault 64
Figure 40. The real and reactive power variation of DGs 65
Figure 41. Behaviour of system during reclosing 65
Figure 42. Real and reactive power variation during transition 66
Figure 43. The output current variation of DG1 67
Figure 44. The variation of DG real and reactive power 67
Figure 45. The variation of DG and induction motor power 68
Figure 46. A radial distribution feeder 69
Figure 47. The variation of normalized admittance 69
Figure 48. Relay tripping characteristic curve 70
Figure 49. Meshed network under study 71
Figure 50. Schematic diagram of the microgrid 74
Figure 51. Differential feeder protection for microgrid 75
Figure 52. Differential relay characteristic 76
Figure 53. Differential bus protection 77
Figure 54. Relays R12 and R21 response for microgrid faults 81
4
INTELLIGENT GRID RESEARCH CLUSTER
Operation Control and Energy Management of grid connected Distributed Generation
Figure 55. Relays R23 and R32 response for microgrid faults 81
Figure 56. The variation of differential and bias current 82
Figure 57. The relay response for a fault between BUS-2 and BUS-5 82
Figure 58. Relays R12 and R21 response for faults in islanded microgrid 82
LIST OF TABLES
Table 1 : System and controller parameters 21
Table 2: System parameters 24
Table 3. System parameters for converter parallel operation 45
Table 4 : system parameters 54
Table 5 : System parameters of the study system 61
Table 6 : Fault currents at different buses in forward direction 63
Table 7 : Relay settings in forward direction 63
Table 8 : OC relay settings in reverse direction 63
Table 9 : System parameters 71
Table 10 : Zone characteristics of ITA relay 72
Table 11: Zone-3 grading of ITA relays 72
Table 12 : Fault clearing time of ITA relays 73
Table 13 : System Parameters 79
Table 14 : CT ratio selection 80
5
INTELLIGENT GRID RESEARCH CLUSTER
Operation Control and Energy Management of grid connected Distributed Generation
EXECUTIVE SUMMARY
Currently, most electricity is generated in centralised generating plants and transmitted to load centres through long overhead transmission lines. These centralised facilities are built away from load for economic, environmental and health and safety reasons. Due to rapid increases in the demand for electricity, generation will need to increase and the relevant infrastructures required for electricity transmission should be upgraded.
The increased load growth can be also catered for without expanding the existing network infrastructures by building decentralised generators located closer to customer loads. This is a more economical and environmentally friendly way of generating power. These small-to-medium sized generators distributed throughout a network are known as distributed generators (DGs). Most countries including Australia, are expecting to achieve the target of 20% renewable power by 2020. The deployment of DGs will help to reduce greenhouse gas emissions. Moreover, DGs can provide benefits for both electric utilities and consumers since they can reduce power loss, improve voltage profiles and reduce transmission and distribution costs.
There are different types of DG technologies available. They include combined heat and power (CHP) plants, biodiesel generators, micro-turbines, fuel cells, wind turbines, mini-hydro power plants, solar photovoltaic arrays (PVs), as well as DGs based on biomass, geothermal and tidal sources. Some of the DG sources such as solar PVs and fuel cells produce power at direct current (DC) voltages while others like micro-turbines produce power at high frequency alternating current (AC) voltages. For sources which generate DC voltages, power converters are utilised for grid interconnection.
A number of DG technologies can be integrated to form an independent electric grid to supply local loads in the absence of the main utility grid. Small electric grid like this is known as microgrids. In this report, control, power management and protection strategies are proposed for a safe and reliable microgrid operation. The key findings of this project include:
transient stability of a microgrid using improved droop control strategies
power management strategies for a microgrid containing dispatchable DGs, non-dispatchable DGs and energy storage
control strategies for converter-controlled DGs
improved power quality of a microgrid using filters for converter interfaced DGs
the techniques to analyse a microgrid stability in the presence of multiple DGs
protection strategies for a microgrid (both radial and meshed) to ensure a safe and a reliable operation in both grid-connected and islanded modes of operation.
These key findings can be effectively used in implementing future microgrids in Australia.
Microgrids are capable of operating connected to the main utility grid (grid-connected mode) or they can operate without the presence of a utility grid (islanded or autonomous mode) without compromising power quality. DGs, especially those based on renewable energy sources such as solar and wind can be effectively integrated into a microgrid to cater for rapid growth in demand. This is one of the major advantages of forming microgrids in a distribution network. Energy storage devices can also be incorporated to enhance power management strategies in the microgrid.
A microgrid should be able to operate either in grid-connected or islanded modes. Islanding occurs
6
INTELLIGENT GRID RESEARCH CLUSTER
Operation Control and Energy Management of grid connected Distributed Generation
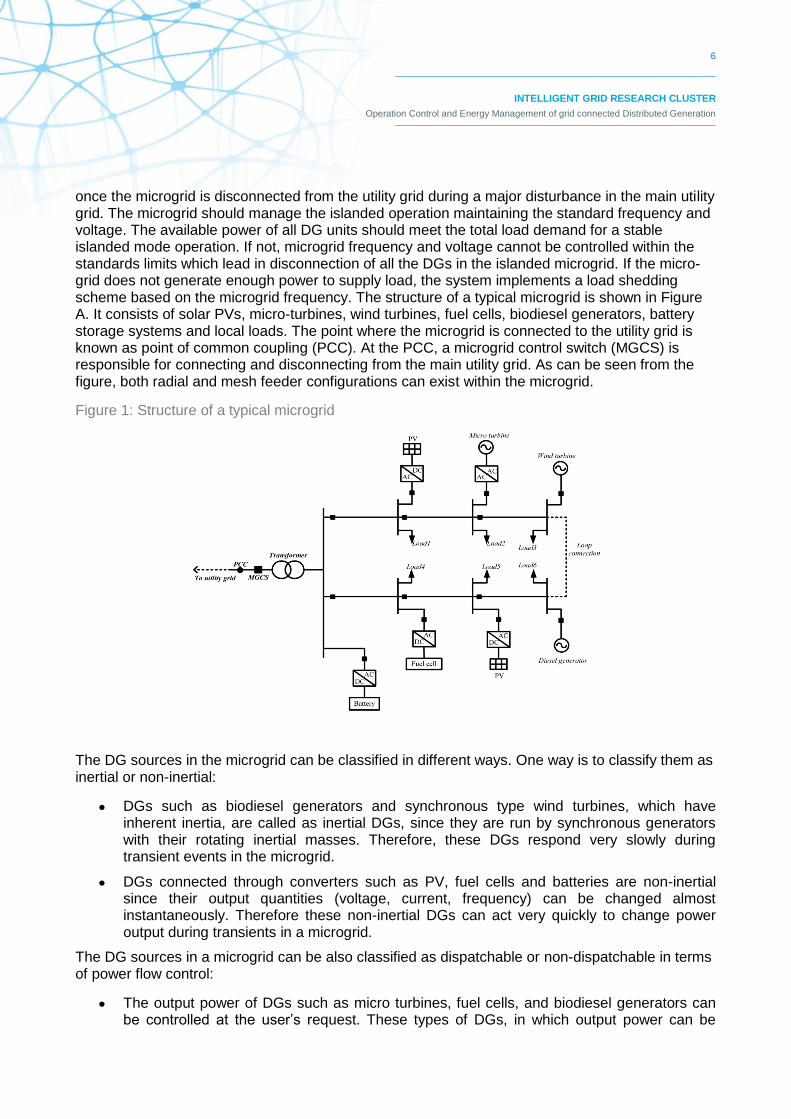
once the microgrid is disconnected from the utility grid during a major disturbance in the main utility grid. The microgrid should manage the islanded operation maintaining the standard frequency and voltage. The available power of all DG units should meet the total load demand for a stable islanded mode operation. If not, microgrid frequency and voltage cannot be controlled within the standards limits which lead in disconnection of all the DGs in the islanded microgrid. If the micro-grid does not generate enough power to supply load, the system implements a load shedding scheme based on the microgrid frequency. The structure of a typical microgrid is shown in Figure A. It consists of solar PVs, micro-turbines, wind turbines, fuel cells, biodiesel generators, battery storage systems and local loads. The point where the microgrid is connected to the utility grid is known as point of common coupling (PCC). At the PCC, a microgrid control switch (MGCS) is responsible for connecting and disconnecting from the main utility grid. As can be seen from the figure, both radial and mesh feeder configurations can exist within the microgrid.
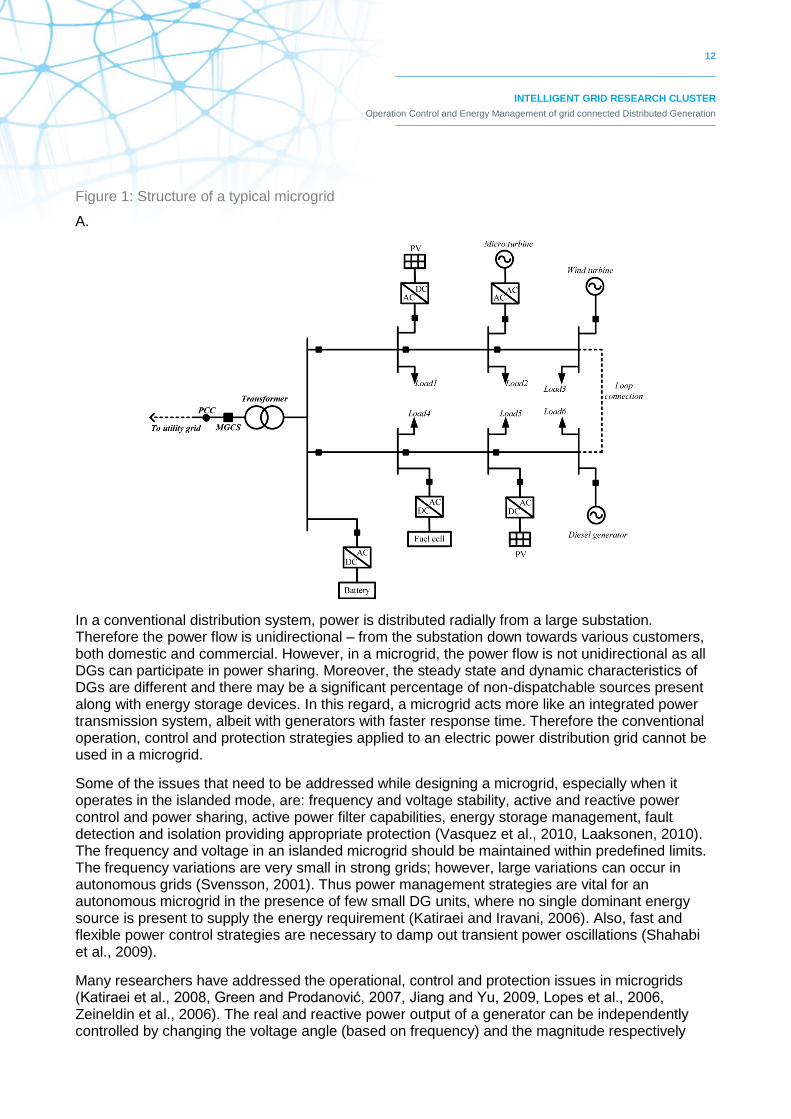
Figure 1: Structure of a typical microgrid
The DG sources in the microgrid can be classified in different ways. One way is to classify them as inertial or non-inertial:
DGs such as biodiesel generators and synchronous type wind turbines, which have inherent inertia, are called as inertial DGs, since they are run by synchronous generators with their rotating inertial masses. Therefore, these DGs respond very slowly during transient events in the microgrid.
DGs connected through converters such as PV, fuel cells and batteries are non-inertial since their output quantities (voltage, current, frequency) can be changed almost instantaneously. Therefore these non-inertial DGs can act very quickly to change power output during transients in a microgrid.
The DG sources in a microgrid can be also classified as dispatchable or non-dispatchable in terms of power flow control:
The output power of DGs such as micro turbines, fuel cells, and biodiesel generators can be controlled at the user’s request. These types of DGs, in which output power can be
7
INTELLIGENT GRID RESEARCH CLUSTER
Operation Control and Energy Management of grid connected Distributed Generation
dispatched according to requirements, are known as dispatchable DGs. Thus, dispatchable DGs can be turned on or off, or their output power can be controlled.
The output power of DGs such as wind and PVs cannot be directly controlled since primary sources associated with these DGs are intermittent. These types of DGs in which output power cannot be dispatched to meet load demand, are known as non-dispatchable DGs. It is desirable to control the non-dispatchable DGs in maximum power point tracking (MPPT) mode, thereby harnessing the maximum available power.
A microgrid can have any of these different types of DGs. The steady state and dynamic characteristics of these DGs are different and there may be a significant percentage of non-dispatchable DGs present along with energy storage devices. Therefore the conventional operation, control and protection strategies applied to an electric power distribution grid cannot be used in a microgrid, especially when it operates in islanded mode.
More importantly, the standard frequency and the voltage of an islanded microgrid should be maintained within predefined limits. If the control system fails to maintain the frequency and voltage within limits, it may create problems both for DGs and for customer loads. Also, the fluctuations of system frequency and voltage should be minimised to maintain system stability during transient events such as DG connections/disconnections, load connections/disconnections and faults.
Frequency and voltage droop controls are the most common methods used to control system frequency and voltage in the presence of multiple DGs in a microgrid. When using frequency and voltage droop controls, the real and reactive power outputs of a DG are controlled by changing the frequency and the voltage magnitude respectively. However, when both inertial and non-inertial DGs are present in the microgrid, their response rates during transients are different and this may cause transient oscillations in the system. The frequency variations are very small in strong grids, but large variations can occur in autonomous microgrids. To damp out these oscillations arising due to the different dynamic response rates of DGs, new control strategies need to be developed.
Primary sources of DGs such as solar PV or micro-turbines generate DC power or AC power at different frequencies. Therefore, converters are required at the interface between these sources and the microgrid to provide a safe interconnection. These converters are based on the topology of either current source or voltage source. Current source converters convert DC current to AC voltages, while voltage source converters convert DC voltages into AC voltages. Since many renewable energy sources produce DC voltages that need to be converted to AC, voltage source converters (VSCs) are commonly used for the grid connection of DGs.
Converters use power electronics switches such as insulated gate bipolar transistors (IGBTs) and metal oxide semiconductor field effect transistors (MOSFETs), which are turned off and on to produce the desired output voltage or current. However these converters cannot produce pure sinusoidal waveforms due to these switching operations. Thus, the output waveforms of converters usually contain odd harmonics and this may create power quality issues in the microgrid. To avoid this, inductor-capacitor (denoted by LC), or inductor-capacitor-inductor (denoted by LCL) filters are used for smoothing the output waveforms.
Therefore the analysis of filter capabilities for converter interfaced DG applications is very important for minimising power quality issues in the microgrid. Also, when operating two or more DGs parallel in the islanded mode, stability is of great concern. If higher gains are used in droop controls, this may lead to instability in the system. Therefore, a stability analysis should be performed with DGs to ensure a safe and a reliable microgrid operation.

8
INTELLIGENT GRID RESEARCH CLUSTER
Operation Control and Energy Management of grid connected Distributed Generation
Appropriate protection schemes are vital to ensure personnel and equipment safety in a microgrid. To harness its maximum benefits a microgrid should be allowed to operate in the islanded mode. In order to do so, the protection scheme employed in the microgrid should be capable of detecting and isolating faults in both modes of operation. There are some barriers that can be identified which prevent this happening when using the existing protection schemes.
Overcurrent (OC) protection is usually used to protect conventional radial feeders where power flow is unidirectional. However, the power flow within a microgrid can be bi-directional due to the presence of DG connections at different locations or due to its meshed configuration. This will create new challenges for designing appropriate protection schemes. When a microgrid operates in an islanded mode, the short circuit levels will be significantly lower than when it is connected to a strong utility grid. This change in fault current levels from grid-connected mode to islanded mode creates protection issues for protective devices which are designed to operate based on the fault current (i.e. the overcurrent). Therefore, the same protection setting used in grid connected mode cannot be used in islanded mode operation.
Furthermore, different fault current levels can be experienced due to the intermittent nature of DG primary sources (e.g., solar photovoltaic-based DGs). Therefore, the fault current level in a particular circumstance is not known and this can make the implementation of protection schemes based solely on fault current level more difficult. This is one of the major reasons why new protection strategies are required to ensure the safe islanded operation of microgrids.
During faults in the system, DGs interfaced through converters have inbuilt current limiters to protect their power switches. As a result, these DGs cannot supply sufficient current to trigger protective devices whose designs are based on fault currents in an islanded microgrid. Therefore protecting a converter-dominated microgrid is a challenging technical issue.
The reliability of a microgrid can be increased by allowing it to form meshed configurations. However, the protection schemes proposed for radial microgrids cannot be effectively deployed in meshed microgrids. The fault current seen by each relay within the mesh configuration will not be appreciably different due to short line segments in the microgrid. In these circumstances, fault detection and isolation will be difficult without employing reliable communication channels.
According to the above explanation, the major issues associated with microgrids are:
microgrid transient stability in the presence of inertial and non-inertial DGs
real and reactive power control of DGs and load power sharing in microgrids
power quality (i.e., filter capabilities) of DG converters and stability of microgrids in the presence of multiple DGs
microgrid power management which incorporates non-dispatchable and energy storage devices
Microgrid protection in both grid-connected and islanded modes of operation considering radial and meshed configurations.
In this report, operation, control and protection issues in a microgrid are thoroughly investigated and new solutions are proposed. Better strategies to incorporate DGs in microgrids are developed. The key findings of this study are discussed below.
A droop control method for a microgrid, containing converter interfaced DGs, is proposed based on the output angle of a converter. This angle droop control is capable of minimising the frequency and power fluctuations during transient events in a microgrid, making it possible to share real and

9
INTELLIGENT GRID RESEARCH CLUSTER
Operation Control and Energy Management of grid connected Distributed Generation
reactive power effectively. It is shown that the proposed angle droop method performs better than the conventional frequency droop method.
Furthermore, a modified droop control characteristic is proposed to improve the dynamic power sharing of microgrids containing both inertial and non-inertial DGs. The proposed droop control is called an ―integral-to-system droop line‖ and is only implemented on converter-interfaced DGs while conventional droop control is used in inertial DGs. This ensures the change of load is proportionally picked up by all the DGs at the same rate. In the proposed integral-to-system droop line control, steady state gain and transient gain can be set independently using an integral controller. Thus, the system can respond with a medium gain during a transient event but it can reach a steady state point corresponding to a high gain. Once an appropriate time constant is selected for the integrator, converter interfaced DGs can respond in a similar manner to inertial DGs. This results in a smooth transition to a system steady state. It is shown that the proposed integral to droop line control not only has the ability to minimise the transient instability but can also ensure proper power sharing amongst DGs.
Power management strategies required to incorporate non-dispatchable (renewable energy-based) DGs and battery storage into a microgrid are also proposed. In the proposed method, a microgrid may consist of dispatchable, non-dispatchable and energy storage (battery) devices. The proposed control enables DGs to have plug and play capability, thereby maximising the benefits of renewable energy sources. Decentralised control of DG sources is assumed since it is simple and cost effective. An intelligent control system (ICS) for the battery storage (BS) is presented to manage the charging and discharging of the battery effectively. Non-dispatchable DGs (wind and PV) are controlled in maximum power point tracking (MPPT) while dispatchable DGs (diesel, BS) are controlled using frequency and voltage droop control. The frequency droop for BS and diesel generators are defined to ensure the battery is charged when there is excess power available in the microgrid. However, an adaptive droop controller for BS is proposed to give the ICS an opportunity to enhance the flexibility of control of the BS in the microgrid.
New converter control strategies are designed based on their filter structures. Both LC and LCL filter structures and voltage and current control were investigated. Two different stability analysis techniques were used – one in which the DGs were represented by AC voltage sources and the other in which a full converter model is used assuming that it is controlled by hysteretic controllers. It has been shown that high gains have deleterious effects on system stability.
Different protection strategies are proposed to provide the appropriate protection for a microgrid. Firstly, a protection scheme for a DG connected radial network is proposed using overcurrent and communication channels. In this scheme the relay settings are changed according to available DG connections and the operation mode. Secondly, a new inverse time admittance relay characteristic is presented. This relay can detect and isolate faults irrespective of the fault level current in the network. Therefore, the same relay setting can be used in both grid-connected and islanded modes of operation with a change of fault current level. The relay performances are evaluated to assess the application of meshed microgrid protection. Finally, the protection of a meshed microgrid using current differential relays is presented. It is shown that the microgrid can be protected in both grid-connected and islanded modes of operations using a differential relay scheme.
10
INTELLIGENT GRID RESEARCH CLUSTER
Operation control and Energy Management of grid connected Distributed Generation in based on a microgrid
ABBREVIATIONS
BS – Battery storage
CB – Circuit breaker
DES – Distributed energy storage
DG – Distributed generation
ICS – Intelligent control system
ITA – Inverse time admittance
LC – Inductor-capacitor
LCL – Inductor-capacitor-inductor
LQR – Linear quadratic regulator
MGCS – Microgrid control switch
MPPT – Maximum power point tracking
OC – Overcurrent
PC – Point of connection
PCC – Point of common coupling
PLL – Phase locked loop
PV – Photovoltaic
PWM – Pulse width modulation
VSC – Voltage source converter
11
INTELLIGENT GRID RESEARCH CLUSTER
Operation Control and Energy Management of grid connected Distributed Generation
1. INTRODUCTION
A microgrid integrates distribution generation (DG), distributed energy storage (DES) and local loads to form a small self sustained electric power grid. Sources based on renewable and non-renewable energy such as solar, wind, bio-gas and diesel can be effectively integrated into a microgrid to supply rapid load growth demand. It is expected that 20% of power generation will be through renewable sources by the year 2020 (Gomez and Morcos, 2005). A microgrid can supply power to small/medium sized urban housing communities or to large rural areas. A microgrid can bring benefits to both utility and customers. It can be an economical, environment friendly and reliable way to supply power at distribution levels. Local energy requirement can be generated using DGs thereby increasing the reliability and reducing the power transmission losses.
A microgrid should be able to operate either in grid connected or islanded mode. Islanding occurs once the microgrid is disconnected from the utility grid during a major disturbance in the main utility grid. The microgrid should mange the islanded operation maintaining the standard frequency and voltage in this mode. The available power of all DG units should meet the total load demand for islanded operation; otherwise load shedding need to be implemented. With the development of smart grids, there is an increasing interest for intelligent microgrids, where they can operate and manage continuous power supply to customers in both grid-connected and islanded modes. Moreover, smarter power management strategies will be taken place in the presence of intermittent sources and energy storage devices.
Structure of a typical microgrid is shown in
Figure 1. It consists of solar photovoltaic arrays, micro-turbines, wind turbines, fuel cells, bio-diesel generators, battery storage systems and local loads. The microgrid is connected to the utility grid at point of common coupling (PCC) through microgrid control switch (MGCS). The various sources in this figure can be classified as inertial and non-inertial depending on their nature. For example, bio-diesel generators are inertial sources since they consist of rotating inertial masses. On the other hand, the sources connected through converters such as PV, fuel cell and batteries are non-inertial since their output quantities (voltage, current, frequency) can be changed almost instantaneously. Therefore these non-inertial DGs can act very fast to change power output during transients in a microgrid.
The sources in a microgrid can be also classified as dispatchable or non-dispatchable in terms of power flow control (Ahn et al., 2010, Katiraei et al., 2008). The output power of dispatchable sources such as micro turbines, fuel cells, and bio-diesel generators can be controlled thus maintaining the desired system frequency and voltage in an islanded microgrid. However, the output power of non-dispatchable sources such as wind and PV are not known in advance since the output power depends on the environmental conditions. Therefore, it is desirable to control the non-dispatchable sources in maximum power point tracking (MPPT) mode thereby enhancing the maximum available power from renewable based energy sources.
12
INTELLIGENT GRID RESEARCH CLUSTER
Operation Control and Energy Management of grid connected Distributed Generation
Figure 1: Structure of a typical microgrid
A.
In a conventional distribution system, power is distributed radially from a large substation. Therefore the power flow is unidirectional – from the substation down towards various customers, both domestic and commercial. However, in a microgrid, the power flow is not unidirectional as all DGs can participate in power sharing. Moreover, the steady state and dynamic characteristics of DGs are different and there may be a significant percentage of non-dispatchable sources present along with energy storage devices. In this regard, a microgrid acts more like an integrated power transmission system, albeit with generators with faster response time. Therefore the conventional operation, control and protection strategies applied to an electric power distribution grid cannot be used in a microgrid.
Some of the issues that need to be addressed while designing a microgrid, especially when it operates in the islanded mode, are: frequency and voltage stability, active and reactive power control and power sharing, active power filter capabilities, energy storage management, fault detection and isolation providing appropriate protection (Vasquez et al., 2010, Laaksonen, 2010). The frequency and voltage in an islanded microgrid should be maintained within predefined limits. The frequency variations are very small in strong grids; however, large variations can occur in autonomous grids (Svensson, 2001). Thus power management strategies are vital for an autonomous microgrid in the presence of few small DG units, where no single dominant energy source is present to supply the energy requirement (Katiraei and Iravani, 2006). Also, fast and flexible power control strategies are necessary to damp out transient power oscillations (Shahabi et al., 2009).
Many researchers have addressed the operational, control and protection issues in microgrids (Katiraei et al., 2008, Green and Prodanović, 2007, Jiang and Yu, 2009, Lopes et al., 2006, Zeineldin et al., 2006). The real and reactive power output of a generator can be independently controlled by changing the voltage angle (based on frequency) and the magnitude respectively
13
INTELLIGENT GRID RESEARCH CLUSTER
Operation Control and Energy Management of grid connected Distributed Generation
(Brabandere et al., 2007, Zhang et al., 2010). Therefore, frequency and voltage droop controls are the most common methods used to share the real and reactive load power in a microgrid. However, the reactive power sharing among DGs will not be precise as expected from the droop due to microgrid cable impedances (Lopes et al., 2006).
Different droop controls and converter control strategies have been proposed for microgrids. The control strategies required for converter connected islanded microgrid system is analyzed in (Lopes et al., 2006). A droop control based on the active and reactive current control is presented for parallel converters (Brabandere et al., 2007). The control of parallel converters in a standalone AC power supply without the need of communication is presented in (Chandorkar et al., 1993). The response of microgrid in the presence of a diesel generator and a converter interfaced DG has been investigated in (Krishnamurthy et al., 2008). The control of parallel converters for load sharing in a microgrid operated in both grid connected and islanded mode is presented (Majumder et al., 2008). A droop control based on angle is proposed to share the real power in a converter connected microgrid (Majumder et al., 2009a).
Most of DGs in a microgrid are connected through power electronic converters since primary sources generate DC power or ac power with different frequency. Therefore, DC-to-AC converters are utilized at the interface between these sources and the microgrid. On the other hand, sources like wind and tidal produce AC voltages with varied frequency. Therefore converters are required to produce voltages with fixed frequency. Therefore analysis of converter response during transient and steady state is important in microgrid operation studies.
Power electronics DC-AC converters are either current source type or voltage source type. Current source inverters (or converters) convert DC current to ac voltages, while voltage source converters convert DC voltages into ac voltages. Since many renewable energy sources produce DC voltages that need to be converted in AC, voltage source converters (VSCs) are commonly used for grid connection of DGs.
Voltage source converters use power electronics switches (e.g., IGBTs, MOSFETs), which are turned off and on to produce desired output voltage or current. However VSCs cannot produce smooth sinusoidal waveforms due to their switching operation. Typically the output waveforms are laced with odd harmonic components (e.g. 3rd, 5th, 7th etc.). These harmonic components must be removed to produce near sinusoidal voltages and currents. Otherwise the power quality of the supply would suffer. Typically inductor-capacitor (LC) or inductor-capacitor-inductor (LCL) filters are used for smoothing the output waveforms. It has been shown that unless the converter control is designed without taking into consideration the filter dynamics, system instability can occur (Ghosh and Ledwich, 2003). Therefore suitable feedback law needs to be designed not only to stabilize the system but also for faithful tracking of reference waveforms. Also various VSCs must operate in droop control mode in a microgrid without endangering the overall system stability. One way of ensuring this is to choose droop gains through eigenvalue analysis (Coelho et al., 2002, Pogaku et al., 2007).
Appropriate protection schemes are vital to ensure personnel and equipment safety in a microgrid. Overcurrent (OC) protection is usually used to protect conventional radial distribution networks due to its simplicity and low cost (Gomez and Morcos, 2005, J. Driesen et al., 2007). However, once a DG or several DGs are connected, many protection issues are identified and documented (Zamani et al., 2010, Cho et al., 2010, Martinez and Martin-Arnedo, 2009, Javadian et al., 2009, Cheung et al., 2009). The islanded operation of DGs in a conventional distribution system is usually not allowed since restoration by reclosing is difficult and power quality within the islanded section cannot be guaranteed (Martinez and Martin-Arnedo, 2009). Thus, due to safety issues, the present practice is to disconnect the DGs from the utility network using an islanding detection method
14
INTELLIGENT GRID RESEARCH CLUSTER
Operation Control and Energy Management of grid connected Distributed Generation
when there is a fault in the main system (Perera et al., 2008, Chowdhury et al., 2008). This is as per the IEEE recommended practice, standard 1547 (IEEE.Std.1547, 2003). However, the practice of automatic DG disconnection for a every fault during loss of main grid supply reduces the DG benefits (Chowdhury et al., 2008). To harness the maximum benefit of a microgrid, it should be allowed to operate in an islanded mode even when the supply from the main grid is removed by the opening of the switch MGCS. However, in order to do so, protection issues in a microgrid should be addressed. The protection issues related to microgrids are well documented (Driesen et al., 2007), however the solutions are not. The protection solutions of conventional power transmission and distribution networks have evolved over many years. Microgrids are still in their infancy. It is therefore expected that different protection solutions will be formed and tested for such networks in the near future. With the communication infrastructure that is readily available currently, many protection issues will be addressed using communication channels.
When a microgrid operates in an islanded mode, the short circuit levels will be significantly lower compared to when it is connected to a strong utility grid (Kumpulainen and Kauhaniemi, 2004b, Driesen et al., 2007, Gomez and Morcos, 2005). Therefore, the protection system, which is originally designed for high short circuit current levels, will not respond for faults in the islanded mode (Zamani et al., 2011). This is one of the major reasons why new protection strategies are required to ensure a safe islanded operation of a microgrid.
The power flow within a microgrid can be bi-directional due to DG connections at different locations or meshed configurations. This will create new challenges for designing suitable protection schemes. Furthermore, most of the sources are connected through power electronic converters in a microgrid (J. A. P. Lopes et al., 2006, Dewadasa et al., 2010). For example, the DC power is generated by the sources such as fuel cells, micro turbines, or photovoltaic cells, converters are utilized to convert the DC power into ac power. Due to the inbuilt current limiting features, converters cannot supply sufficient currents to operate current sensing protective devices in islanded mode (Al-Nasseri et al., 2006, Brucoli et al., 2007, Loix et al., 2009). Therefore protecting a converter dominated microgrid is a challenging technical issue (Dewadasa et al., 2009b, Brucoli et al., 2007, Nikkhajoei and Lasseter, 2007). Some of the DGs connected to a microgrid are intermittent in nature (e.g., solar photovoltaic based DGs). Therefore different fault current levels can be experienced in the microgrid depending on the number of active DG connections (Chowdhury et al., 2008). As a result, implementation of protection schemes based solely on fault current level will be made even more difficult.
The reliability of a microgrid can be increased by allowing it to form meshed configurations. However, the protection schemes proposed for radial microgrids cannot be effectively deployed in meshed microgrids (Prasai et al., 2010). The fault current seen by each relay within the meshed configuration will not have an appreciable difference due to short line segments in the microgrid. In this circumstance, fault detection and isolation will be difficult without employing reliable communication channels.
Protection strategies employed in a microgrid should work for both grid connected and islanded modes of operations. When designing an appropriate protection scheme, several factors should be carefully considered. The protective devices employed in a microgrid should be coordinated considering reliability (correct operation), selectivity (minimum system disconnection), speed of operation (minimum fault duration), simplicity (having minimum protective equipment) and economics (maximum protection under minimum cost). These coordinated actions should be implemented fast enough to prevent personal hazards and equipment damage. Generally, the protection system should consist of a primary and backup protection schemes with proper time grading between each devices.

15
INTELLIGENT GRID RESEARCH CLUSTER
Operation Control and Energy Management of grid connected Distributed Generation
In (Dewadasa et al., 2009b), a control and protection scheme is proposed for a microgrid containing converter interfaced DGs to enable both grid connected and islanded mode of operations. Authors have proposed a new relay characteristic to overcome the problems associated with current limiting of converters. In the grid connected mode, DGs supplies their rated power, while in the islanded mode, DGs share load power using proposed voltage angle droop method. In a converter dominated microgrid, fault current level is low and system voltage reduces significantly during a fault in islanded mode. Therefore, a method based on system voltage and fault direction for a low voltage microgrid is proposed using microprocessor relays (Zamani et al., 2011). A voltage based protection scheme for the islanded microgrid is designed and presented in (Loix et al., 2009). However, system voltage may not drop significantly for high impedance faults and this may result in fault directivity problems.
In (Dewadasa et al., 2010), a novel relay and a control strategy for a converter connected network are proposed to achieve islanded protection and self extinction of arc maintaining as many DG connections as possible. A protection scheme for a low voltage microgrid is proposed to achieve fast, selective and reliable operation using high-speed communication amongst protective devices (Laaksonen, 2010). Protection of meshed microgrids using differential current measurement and comparison and communication based on power line carrier (PLC) is presented in (Prasai et al., 2010).
The literature survey reveals that the most researchers have only considered operation and control of converter connected microgrids. Little attention has been given so far to the control and operational aspects of hybrid microgrids, which consist of both inertial and non-inertial sources. Analysis of dynamic behavior of a microgrid is very important to ensure it is stable in both grid connected and islanded mode of operations. Also, new power management strategies are essential in the presence of intermittent sources and energy storage devices in a microgrid. Providing appropriate protection to a microgrid in both grid connected and islanded modes of operations using the existing protection scheme is a challenging task. Therefore new protection strategies have to be devised.
In this report, control, power management and protection strategies are proposed for a safe and reliable microgrid operation. The report mainly covers:
Microgrid voltage and frequency control through droop equations in the presence of inertial and non inertial DGs.
Microgrid power management strategies in the presence of dispatchable and non-dispatchable DGs and energy storage.
Converter control and filter design.
Microgrid stability analysis in the presence of multiple VSCs.
Microgrid protection strategies with overcurrent and differential protections, using communication channels.
16
INTELLIGENT GRID RESEARCH CLUSTER
Operation control and Energy Management of grid connected Distributed Generation in based on a microgrid
2. MICROGRID DROOP CONTROL
The DGs in a microgrid should be controlled to ensure a stable operation in both grid connected and islanded modes of operations. The same control strategy cannot be used in both modes. For grid connected operation, the system frequency and voltage of the microgrid are mainly controlled by the grid. However, in the absence of grid, the DGs in the microgrid need to be controlled such that the frequency and voltage in the islanded microgrid are maintained within standard limits. Moreover, real and reactive power requirement of loads should be shared by the DGs. If the total power generation by the DGs is not sufficient, load shedding is required to maintain the stable operation without any frequency/voltage collapses. Frequency droop and voltage droop are the most common way of controlling DGs to achieve frequency/voltage control and load power sharing in an islanded microgrid.
The system stability during load sharing has been explored by many researchers (Reza et al., 2006, Guerrero et al., 2004, Chandorkar et al., 1993). Transient stability of power system with high penetration level of power electronic interfaced (converter connected) distributed generation is explored in (Reza et al., 2006). The study is performed in the presence of an infinite bus. A transient droop characteristic is used (Guerrero et al., 2002) to achieve steady state invariant frequency and good current balance. Sometimes an additional faster loop is added to program the output impedance. Both inductive and resistive output has been investigated. In the resistive output, the active power is controlled by terminal voltage where the reactive power is controlled by the source angle. A dynamic model and a control system are developed for autonomous operation of a stand-alone distributed resource (DR) in (Karimi et al., 2007). Control of the DG system is important in both grid connected and islanded modes and the system stability becomes very crucial during the transfer between grid connected and islanded modes. A seamless transfer can ensure a smooth operation with proper load sharing and quick attainment of steady state.
2.1. Conventional Frequency and Voltage Droop Control
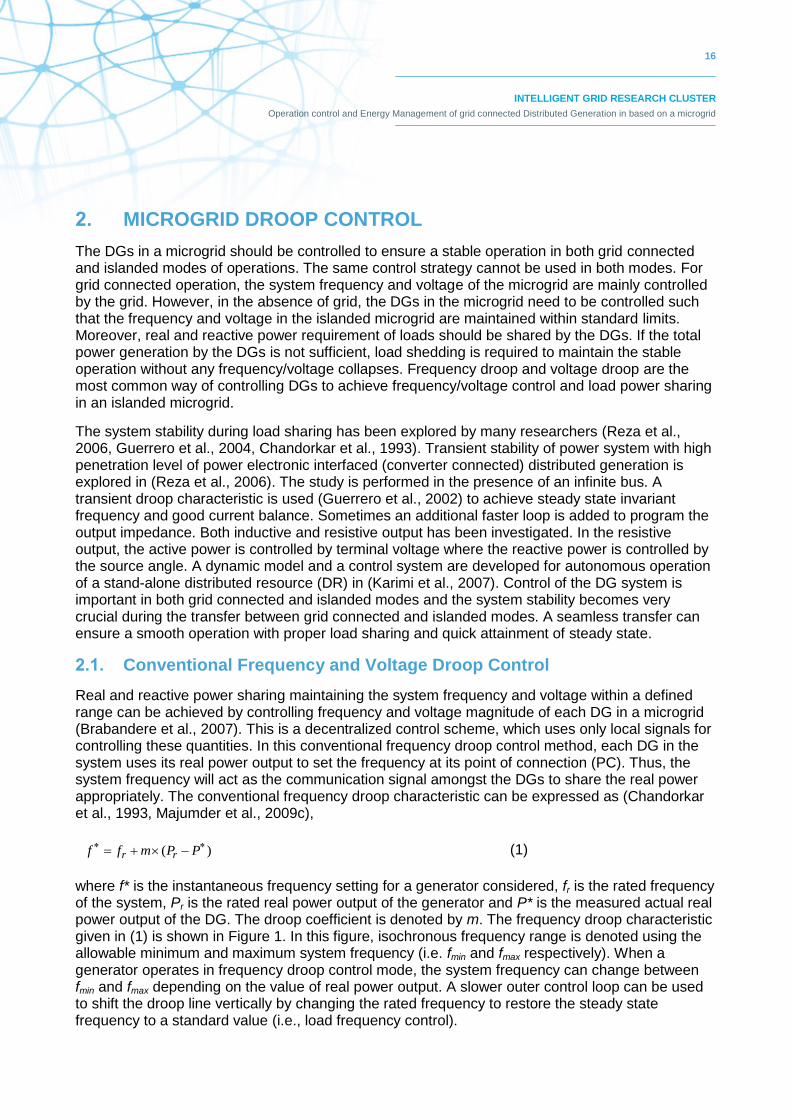
Real and reactive power sharing maintaining the system frequency and voltage within a defined range can be achieved by controlling frequency and voltage magnitude of each DG in a microgrid (Brabandere et al., 2007). This is a decentralized control scheme, which uses only local signals for controlling these quantities. In this conventional frequency droop control method, each DG in the system uses its real power output to set the frequency at its point of connection (PC). Thus, the system frequency will act as the communication signal amongst the DGs to share the real power appropriately. The conventional frequency droop characteristic can be expressed as (Chandorkar et al., 1993, Majumder et al., 2009c),
)( PPmff rr (1)
where f* is the instantaneous frequency setting for a generator considered, fr is the rated frequency of the system, Pr is the rated real power output of the generator and P* is the measured actual real power output of the DG. The droop coefficient is denoted by m. The frequency droop characteristic given in (1) is shown in Figure 1. In this figure, isochronous frequency range is denoted using the allowable minimum and maximum system frequency (i.e. fmin and fmax respectively). When a generator operates in frequency droop control mode, the system frequency can change between fmin and fmax depending on the value of real power output. A slower outer control loop can be used to shift the droop line vertically by changing the rated frequency to restore the steady state frequency to a standard value (i.e., load frequency control).
17
INTELLIGENT GRID RESEARCH CLUSTER
Operation Control and Energy Management of grid connected Distributed Generation
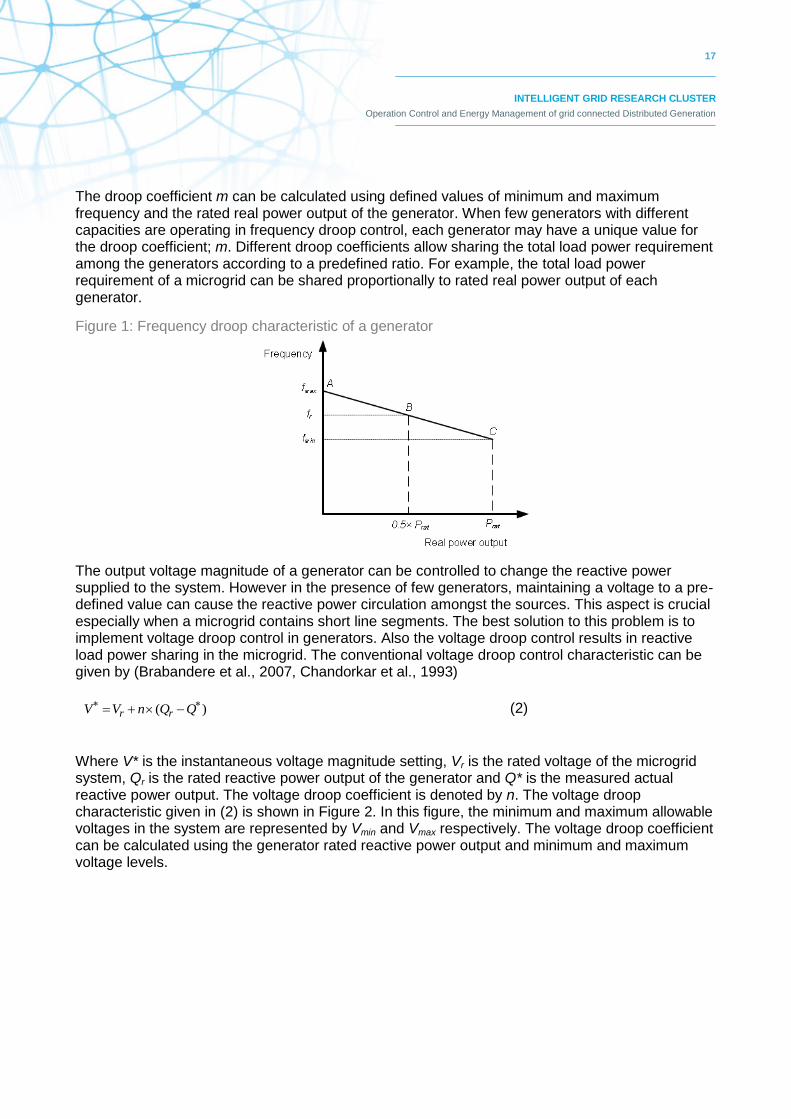
The droop coefficient m can be calculated using defined values of minimum and maximum frequency and the rated real power output of the generator. When few generators with different capacities are operating in frequency droop control, each generator may have a unique value for the droop coefficient; m. Different droop coefficients allow sharing the total load power requirement among the generators according to a predefined ratio. For example, the total load power requirement of a microgrid can be shared proportionally to rated real power output of each generator.
Figure 1: Frequency droop characteristic of a generator
The output voltage magnitude of a generator can be controlled to change the reactive power supplied to the system. However in the presence of few generators, maintaining a voltage to a pre-defined value can cause the reactive power circulation amongst the sources. This aspect is crucial especially when a microgrid contains short line segments. The best solution to this problem is to implement voltage droop control in generators. Also the voltage droop control results in reactive load power sharing in the microgrid. The conventional voltage droop control characteristic can be given by (Brabandere et al., 2007, Chandorkar et al., 1993)
)( QQnVV rr (2)
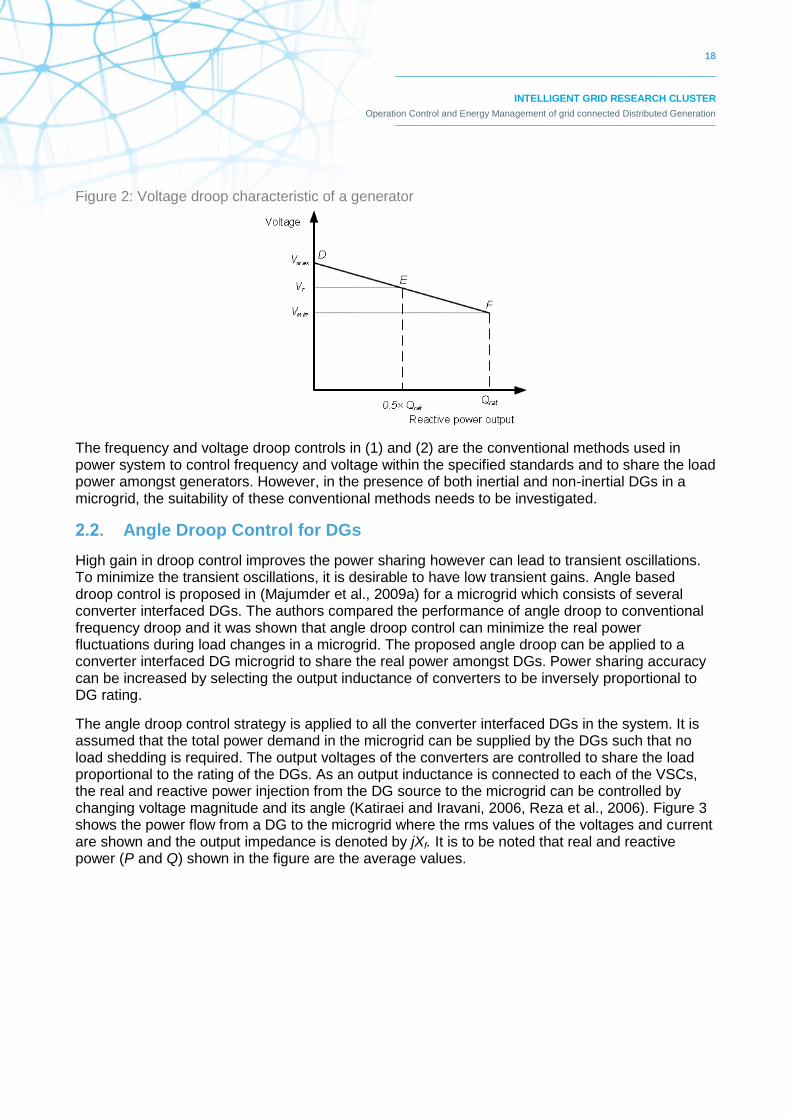
Where V* is the instantaneous voltage magnitude setting, Vr is the rated voltage of the microgrid system, Qr is the rated reactive power output of the generator and Q* is the measured actual reactive power output. The voltage droop coefficient is denoted by n. The voltage droop characteristic given in (2) is shown in Figure 2. In this figure, the minimum and maximum allowable voltages in the system are represented by Vmin and Vmax respectively. The voltage droop coefficient can be calculated using the generator rated reactive power output and minimum and maximum voltage levels.
18
INTELLIGENT GRID RESEARCH CLUSTER
Operation Control and Energy Management of grid connected Distributed Generation
Figure 2: Voltage droop characteristic of a generator
The frequency and voltage droop controls in (1) and (2) are the conventional methods used in power system to control frequency and voltage within the specified standards and to share the load power amongst generators. However, in the presence of both inertial and non-inertial DGs in a microgrid, the suitability of these conventional methods needs to be investigated.
2.2. Angle Droop Control for DGs
High gain in droop control improves the power sharing however can lead to transient oscillations. To minimize the transient oscillations, it is desirable to have low transient gains. Angle based droop control is proposed in (Majumder et al., 2009a) for a microgrid which consists of several converter interfaced DGs. The authors compared the performance of angle droop to conventional frequency droop and it was shown that angle droop control can minimize the real power fluctuations during load changes in a microgrid. The proposed angle droop can be applied to a converter interfaced DG microgrid to share the real power amongst DGs. Power sharing accuracy can be increased by selecting the output inductance of converters to be inversely proportional to DG rating.
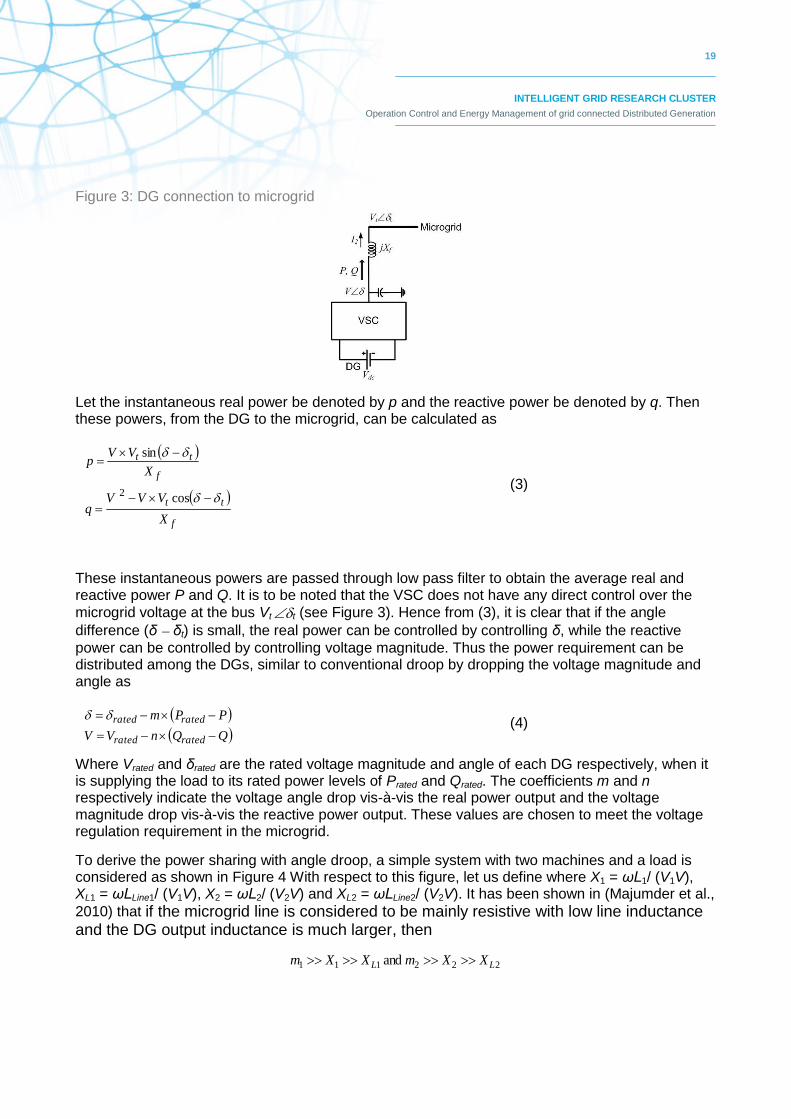
The angle droop control strategy is applied to all the converter interfaced DGs in the system. It is assumed that the total power demand in the microgrid can be supplied by the DGs such that no load shedding is required. The output voltages of the converters are controlled to share the load proportional to the rating of the DGs. As an output inductance is connected to each of the VSCs, the real and reactive power injection from the DG source to the microgrid can be controlled by changing voltage magnitude and its angle (Katiraei and Iravani, 2006, Reza et al., 2006). Figure 3 shows the power flow from a DG to the microgrid where the rms values of the voltages and current are shown and the output impedance is denoted by jXf. It is to be noted that real and reactive power (P and Q) shown in the figure are the average values.
19
INTELLIGENT GRID RESEARCH CLUSTER
Operation Control and Energy Management of grid connected Distributed Generation
Figure 3: DG connection to microgrid
Let the instantaneous real power be denoted by p and the reactive power be denoted by q. Then these powers, from the DG to the microgrid, can be calculated as
f
tt
f
tt
X
VVVq
X
VVp
cos
sin
2
(3)
These instantaneous powers are passed through low pass filter to obtain the average real and reactive power P and Q. It is to be noted that the VSC does not have any direct control over the
microgrid voltage at the bus Vt t (see Figure 3). Hence from (3), it is clear that if the angle
difference (δ δt) is small, the real power can be controlled by controlling δ, while the reactive
power can be controlled by controlling voltage magnitude. Thus the power requirement can be distributed among the DGs, similar to conventional droop by dropping the voltage magnitude and angle as
QQnVV
PPm
ratedrated
ratedrated
(4)
Where Vrated and δrated are the rated voltage magnitude and angle of each DG respectively, when it is supplying the load to its rated power levels of Prated and Qrated. The coefficients m and n respectively indicate the voltage angle drop vis-à-vis the real power output and the voltage magnitude drop vis-à-vis the reactive power output. These values are chosen to meet the voltage regulation requirement in the microgrid.
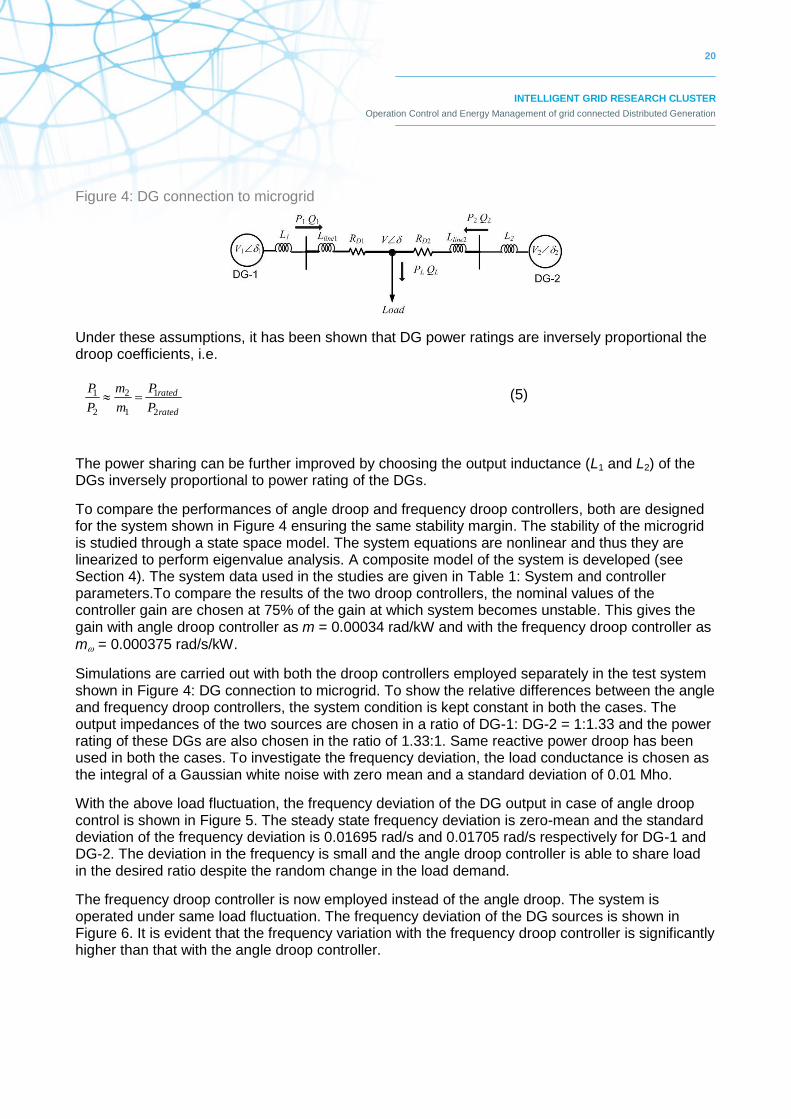
To derive the power sharing with angle droop, a simple system with two machines and a load is considered as shown in Figure 4 With respect to this figure, let us define where X1 = ωL1/ (V1V), XL1 = ωLLine1/ (V1V), X2 = ωL2/ (V2V) and XL2 = ωLLine2/ (V2V). It has been shown in (Majumder et al.,
2010) that if the microgrid line is considered to be mainly resistive with low line inductance and the DG output inductance is much larger, then
222111 and LL XXmXXm
20
INTELLIGENT GRID RESEARCH CLUSTER
Operation Control and Energy Management of grid connected Distributed Generation
Figure 4: DG connection to microgrid
Under these assumptions, it has been shown that DG power ratings are inversely proportional the droop coefficients, i.e.
rated
rated
P
P
m
m
P
P
2
1
1
2
2
1
(5)
The power sharing can be further improved by choosing the output inductance (L1 and L2) of the DGs inversely proportional to power rating of the DGs.
To compare the performances of angle droop and frequency droop controllers, both are designed for the system shown in Figure 4 ensuring the same stability margin. The stability of the microgrid is studied through a state space model. The system equations are nonlinear and thus they are linearized to perform eigenvalue analysis. A composite model of the system is developed (see Section 4). The system data used in the studies are given in Table 1: System and controller parameters.To compare the results of the two droop controllers, the nominal values of the controller gain are chosen at 75% of the gain at which system becomes unstable. This gives the gain with angle droop controller as m = 0.00034 rad/kW and with the frequency droop controller as
m = 0.000375 rad/s/kW.
Simulations are carried out with both the droop controllers employed separately in the test system shown in Figure 4: DG connection to microgrid. To show the relative differences between the angle and frequency droop controllers, the system condition is kept constant in both the cases. The output impedances of the two sources are chosen in a ratio of DG-1: DG-2 = 1:1.33 and the power rating of these DGs are also chosen in the ratio of 1.33:1. Same reactive power droop has been used in both the cases. To investigate the frequency deviation, the load conductance is chosen as the integral of a Gaussian white noise with zero mean and a standard deviation of 0.01 Mho.
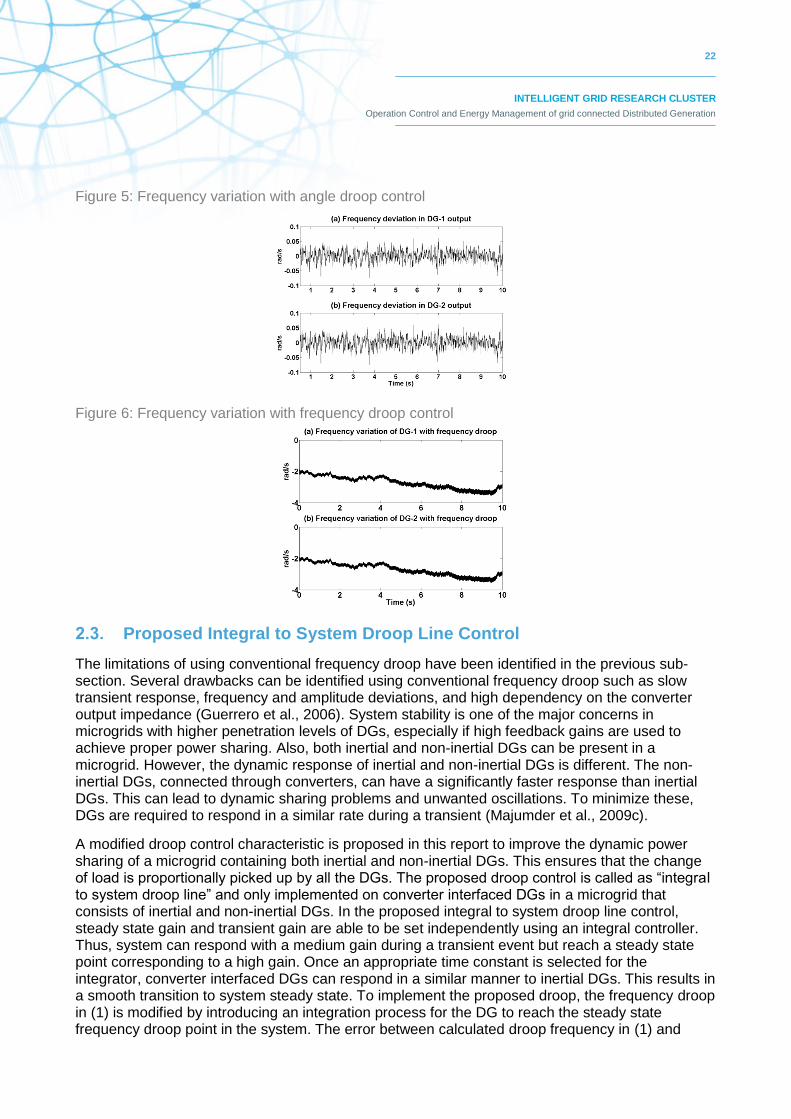
With the above load fluctuation, the frequency deviation of the DG output in case of angle droop control is shown in Figure 5. The steady state frequency deviation is zero-mean and the standard deviation of the frequency deviation is 0.01695 rad/s and 0.01705 rad/s respectively for DG-1 and DG-2. The deviation in the frequency is small and the angle droop controller is able to share load in the desired ratio despite the random change in the load demand.
The frequency droop controller is now employed instead of the angle droop. The system is operated under same load fluctuation. The frequency deviation of the DG sources is shown in Figure 6. It is evident that the frequency variation with the frequency droop controller is significantly higher than that with the angle droop controller.
21
INTELLIGENT GRID RESEARCH CLUSTER
Operation Control and Energy Management of grid connected Distributed Generation
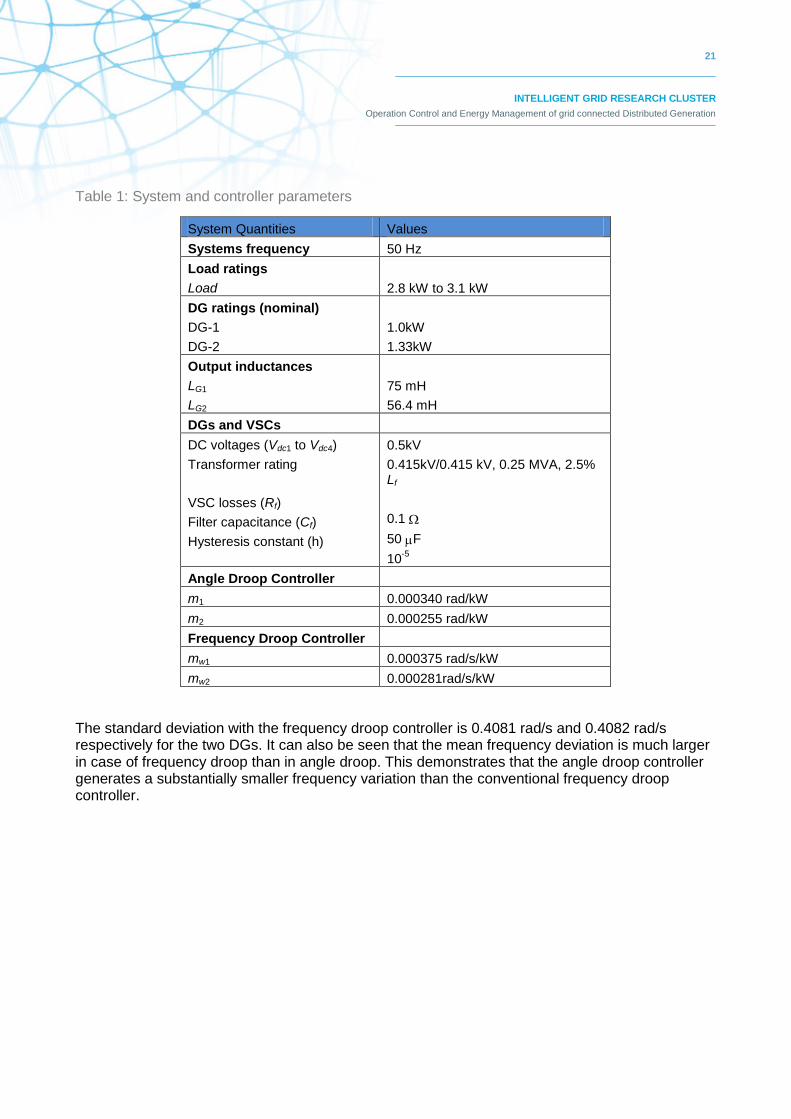
Table 1: System and controller parameters
System Quantities Values
Systems frequency 50 Hz
Load ratings
Load
2.8 kW to 3.1 kW
DG ratings (nominal)
DG-1
DG-2
1.0kW
1.33kW
Output inductances
LG1
LG2
75 mH
56.4 mH
DGs and VSCs
DC voltages (Vdc1 to Vdc4)
Transformer rating
VSC losses (Rf)
Filter capacitance (Cf)
Hysteresis constant (h)
0.5kV
0.415kV/0.415 kV, 0.25 MVA, 2.5% Lf
0.1
50 F
10-5
Angle Droop Controller
m1 0.000340 rad/kW
m2 0.000255 rad/kW
Frequency Droop Controller
mw1 0.000375 rad/s/kW
mw2 0.000281rad/s/kW
The standard deviation with the frequency droop controller is 0.4081 rad/s and 0.4082 rad/s respectively for the two DGs. It can also be seen that the mean frequency deviation is much larger in case of frequency droop than in angle droop. This demonstrates that the angle droop controller generates a substantially smaller frequency variation than the conventional frequency droop controller.
22
INTELLIGENT GRID RESEARCH CLUSTER
Operation Control and Energy Management of grid connected Distributed Generation
Figure 5: Frequency variation with angle droop control
Figure 6: Frequency variation with frequency droop control
2.3. Proposed Integral to System Droop Line Control
The limitations of using conventional frequency droop have been identified in the previous sub-section. Several drawbacks can be identified using conventional frequency droop such as slow transient response, frequency and amplitude deviations, and high dependency on the converter output impedance (Guerrero et al., 2006). System stability is one of the major concerns in microgrids with higher penetration levels of DGs, especially if high feedback gains are used to achieve proper power sharing. Also, both inertial and non-inertial DGs can be present in a microgrid. However, the dynamic response of inertial and non-inertial DGs is different. The non-inertial DGs, connected through converters, can have a significantly faster response than inertial DGs. This can lead to dynamic sharing problems and unwanted oscillations. To minimize these, DGs are required to respond in a similar rate during a transient (Majumder et al., 2009c).
A modified droop control characteristic is proposed in this report to improve the dynamic power sharing of a microgrid containing both inertial and non-inertial DGs. This ensures that the change of load is proportionally picked up by all the DGs. The proposed droop control is called as ―integral to system droop line‖ and only implemented on converter interfaced DGs in a microgrid that consists of inertial and non-inertial DGs. In the proposed integral to system droop line control, steady state gain and transient gain are able to be set independently using an integral controller. Thus, system can respond with a medium gain during a transient event but reach a steady state point corresponding to a high gain. Once an appropriate time constant is selected for the integrator, converter interfaced DGs can respond in a similar manner to inertial DGs. This results in a smooth transition to system steady state. To implement the proposed droop, the frequency droop in (1) is modified by introducing an integration process for the DG to reach the steady state frequency droop point in the system. The error between calculated droop frequency in (1) and

23
INTELLIGENT GRID RESEARCH CLUSTER
Operation Control and Energy Management of grid connected Distributed Generation
frequency at the PC is passed through an integrator to force the operating frequency of DG to reach the steady state droop point within a defined time period. The proposed method not only has the ability to minimize the transient instability but also to ensure that proper power sharing takes place amongst DGs. Moreover, the proposed droop allows using high gain in steady state droop, but reduces the droop gains during transient thereby avoiding instability. The proposed droop control is given by
dtffff pcd )(
(6)
Where fd is the modified droop frequency for the DG, f* is the droop given in (1) and fpc is the frequency at PC. The time constant of the integrator is selected according to the inertial DG dynamics (i.e., time constant of governor) to ensure a similar response from the non-inertial DGs in the system. However, it is to be noted that real power injection to the system can be controlled by changing the output voltage angle of a converter. Therefore, an angle ( ) corresponding to the
frequency deviation (i.e., the amount of real power required to inject into the system) given by (6) is calculated and used in reference generation to the converter. For example, if output feedback voltage control is used to control three phase converters, the reference voltages for three phases are generated using voltage magnitude obtained from voltage droop and calculated angle corresponding to the droop frequency in (6). In this case, the reference for phase A can be generated as
)2( tfSinVV pcma (7)
Where Vm is the voltage magnitude calculated from the voltage droop in (2), fpc is the PC frequency obtained from a phase locked loop (PLL) and is the angle corresponding to droop frequency fd in
(6). All the converter interfaced DGs are controlled using the proposed modified droop control to enhance better dynamic power sharing amongst inertial and non-inertial sources in a microgrid during a transient event.
The interaction amongst inertial and non-inertial DGs in a microgrid is investigated when conventional and proposed integral-to-droop controls are employed. In (Krishnamurthy et al., 2008) frequency oscillations in a microgrid have been observed due to controller employed in the diesel generator through experimental results. Therefore, especially in the case of mixed generation sources, the inertial generator cannot change its output frequency/power instantly unlike the converter interfaced DGs. Therefore, the slower response of diesel generator can initiate frequency and real power fluctuations in the autonomous microgrid.
Consider the microgrid system shown in Figure 6. Two DGs, DG1 and DG2 are connected at BUS-1 and BUS-3 respectively. The real and reactive power output of DG1 and DG2 are denoted by P1, Q1 and P2, Q2 respectively. The DG circuit breakers are used for synchronization and isolation purposes. Two loads, load1 and load2 are connected at BUS-2 and BUS-4. The system parameters are given in Table 2. It is to be noted that each DG and load in the microgrid are connected through a short line segment. The microgrid is modeled in PSCAD for simulation.
24
INTELLIGENT GRID RESEARCH CLUSTER
Operation Control and Energy Management of grid connected Distributed Generation
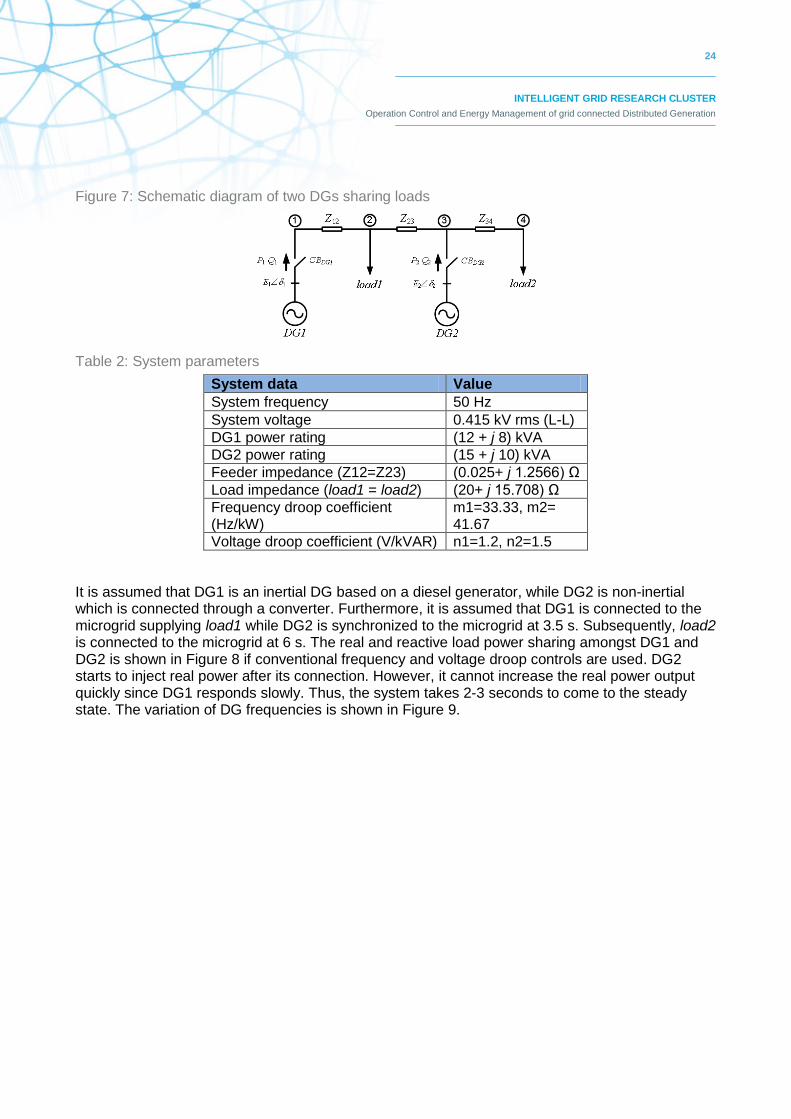
Figure 7: Schematic diagram of two DGs sharing loads
Table 2: System parameters
System data Value
System frequency 50 Hz
System voltage 0.415 kV rms (L-L)
DG1 power rating (12 + j 8) kVA
DG2 power rating (15 + j 10) kVA
Feeder impedance (Z12=Z23) (0.025+ j 1.2566) Ω
Load impedance (load1 = load2) (20+ j 15.708) Ω
Frequency droop coefficient (Hz/kW)
m1=33.33, m2= 41.67
Voltage droop coefficient (V/kVAR) n1=1.2, n2=1.5
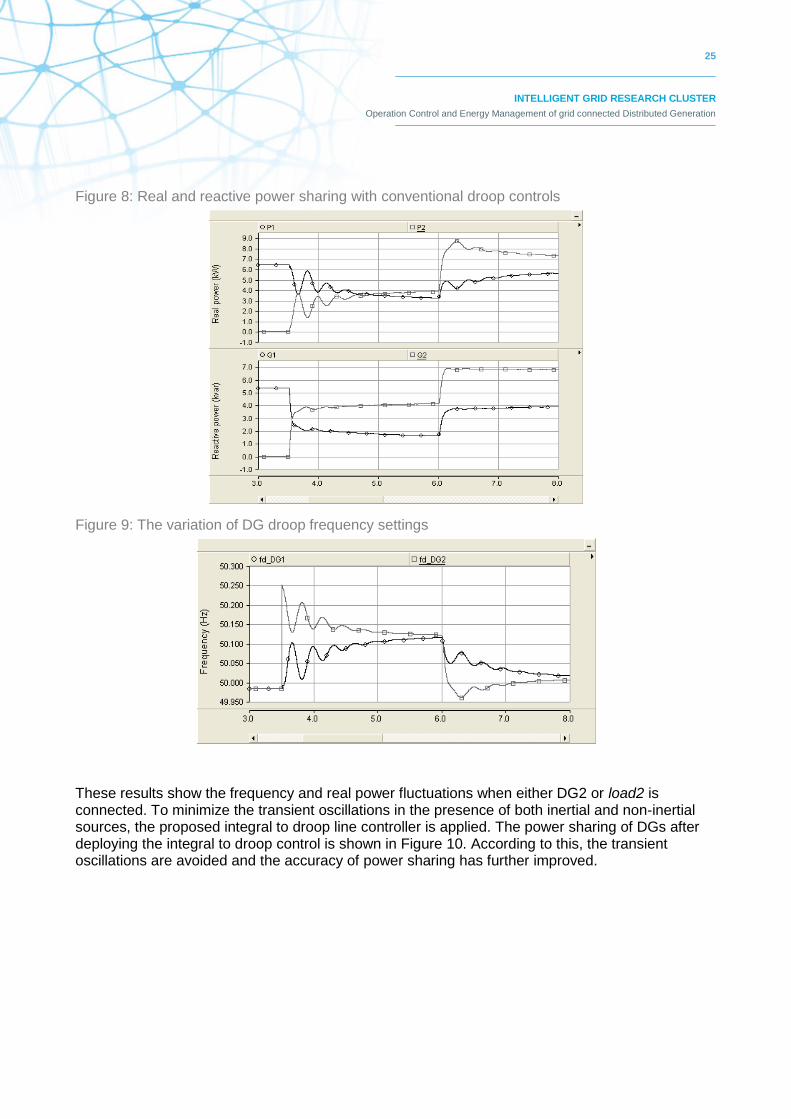
It is assumed that DG1 is an inertial DG based on a diesel generator, while DG2 is non-inertial which is connected through a converter. Furthermore, it is assumed that DG1 is connected to the microgrid supplying load1 while DG2 is synchronized to the microgrid at 3.5 s. Subsequently, load2 is connected to the microgrid at 6 s. The real and reactive load power sharing amongst DG1 and DG2 is shown in Figure 8 if conventional frequency and voltage droop controls are used. DG2 starts to inject real power after its connection. However, it cannot increase the real power output quickly since DG1 responds slowly. Thus, the system takes 2-3 seconds to come to the steady state. The variation of DG frequencies is shown in Figure 9.
25
INTELLIGENT GRID RESEARCH CLUSTER
Operation Control and Energy Management of grid connected Distributed Generation
Figure 8: Real and reactive power sharing with conventional droop controls
Figure 9: The variation of DG droop frequency settings
These results show the frequency and real power fluctuations when either DG2 or load2 is connected. To minimize the transient oscillations in the presence of both inertial and non-inertial sources, the proposed integral to droop line controller is applied. The power sharing of DGs after deploying the integral to droop control is shown in Figure 10. According to this, the transient oscillations are avoided and the accuracy of power sharing has further improved.

26
INTELLIGENT GRID RESEARCH CLUSTER
Operation Control and Energy Management of grid connected Distributed Generation
Figure 10: Real and reactive power sharing with integral droop
It can therefore be concluded that in the presence of both inertial and non-inertial sources in a microgrid, conventional frequency droop can initiate frequency and real power oscillations during the synchronization and load changes. However, these issues can be minimized by using proposed integral to droop line control in non-inertial DGs.
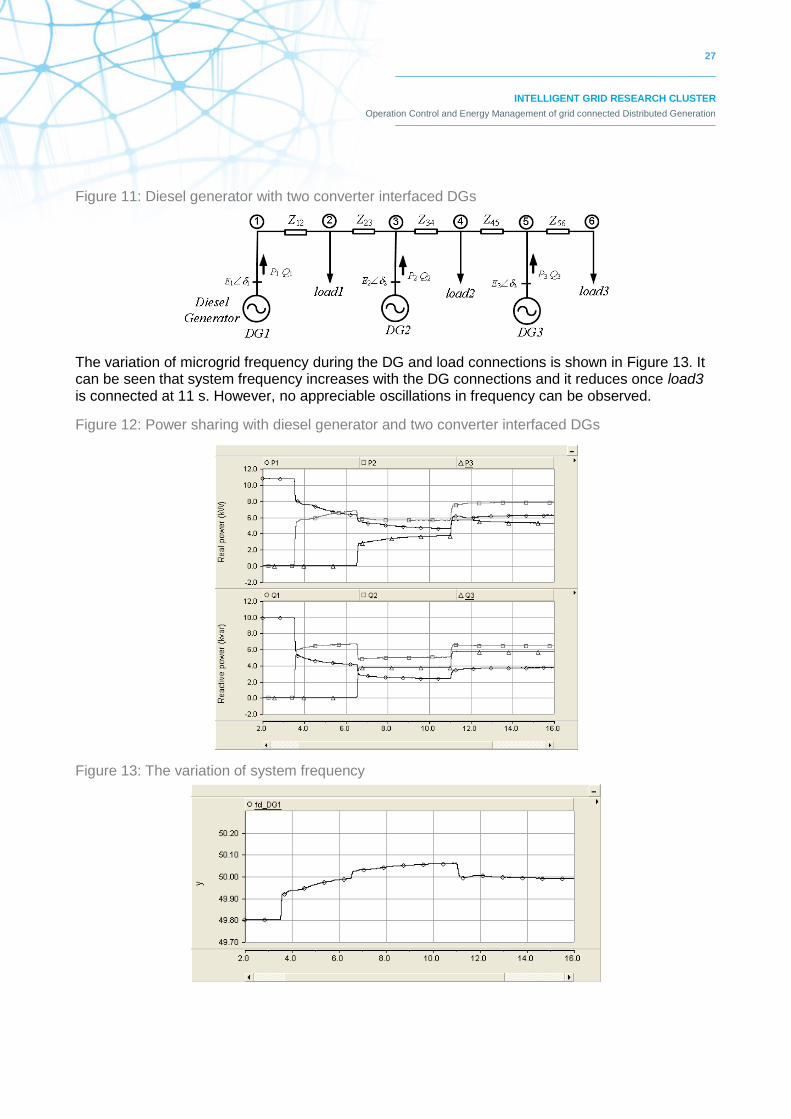
Similar investigation has been performed on a 3-DG system shown in Figure 11: Diesel generator with two converter interfaced DGs. In this system, a diesel generator is connected at BUS-1 while DG2 and DG3 which are interfaced through converters and are connected at buses 3 and 5 respectively. Three impedance type loads, load1, load2 and load3 are connected at buses 2, 4 and 6 respectively. The converter interfaced DGs are controlled using integral to droop line control.
The diesel generator supplies load1 and load2 while operating in conventional frequency and voltage droop controls. Then DG2 and DG3 are connected to the microgrid at 3.5 s and 6.5 s respectively. Subsequently, load3 is connected at 11.0 s. The real and reactive power sharing of DGs are shown in Figure 12. As can be seen from the figure, DG1, DG2 and DG3 supply 6.23 kW, 7.83 kW and 5.26 kW respectively in the steady state in accordance to their droop gains. The results show that no power oscillation during DG connections and load changes due to the employment of integral to droop line in converter interfaced DGs.
27
INTELLIGENT GRID RESEARCH CLUSTER
Operation Control and Energy Management of grid connected Distributed Generation
Figure 11: Diesel generator with two converter interfaced DGs
The variation of microgrid frequency during the DG and load connections is shown in Figure 13. It can be seen that system frequency increases with the DG connections and it reduces once load3 is connected at 11 s. However, no appreciable oscillations in frequency can be observed.
Figure 12: Power sharing with diesel generator and two converter interfaced DGs
Figure 13: The variation of system frequency

28
INTELLIGENT GRID RESEARCH CLUSTER
Operation Control and Energy Management of grid connected Distributed Generation
In the presence of both inertial and non-inertial sources, the proposed integral to droop control based on output angle for non-inertial source is capable of minimizing the transient oscillations during synchronization and load changes. It further improves the real power sharing accuracy in a hybrid microgrid.
2.4. Summary
DGs in a microgrid have different transient characteristics. The inertial based DGs show a slower response while non-inertial DGs can respond very quickly during a transient event. This mismatch of response rate in different DGs leads to create transient oscillations in an islanded microgrid when conventional droop control is used.
In this section, improved droop control strategies for a microgrid were proposed. The efficacy of angle based droop over conventional frequency based droop in a converter interfaced autonomous microgrid was presented. Furthermore, improved droop control strategy called integral to system droop line was proposed for a microgrid containing both inertial and non-inertial DGs. The results revealed that the problem associated with different response rates of DGs in an islanded microgrid can be minimised using the proposed integral to droop line control thereby improving the transient stability.

29
INTELLIGENT GRID RESEARCH CLUSTER
Operation Control and Energy Management of grid connected Distributed Generation
3. POWER MANAGEMENT IN MICROGRIDS
3.1. Control Strategies for Power Management
In this section, power management and control strategies required to incorporate non-schedulable (renewable energy based) DGs and battery storage into a microgrid are discussed. The microgrid can include diesel generator(s), battery storage (BS), wind and solar PVs. The control of microgrid should enable the plug and play capability of DG sources, thus maximizing the benefits of renewable based energy sources. Decentralized control amongst DG sources is proposed as a simple and cost effective solution. Each DG has its own local control for connection and disconnection from the microgrid, and for controlling the real and reactive power output.
The BS is connected to the microgrid through a converter ensuring bidirectional power flow between microgrid and battery. Therefore, the BS can act as either a load or a source to absorb or inject real power into the microgrid. Also, the BS can assist in controlling the microgrid frequency. Moreover, the converter associated with BS has the ability to regulate the voltage at PC by injecting reactive power into the microgrid. The converter rating determines the maximum reactive power injection capacity into the system. The BS is employed with an intelligent control system (ICS) (or battery management system (BMS)) to manage the power effectively. The ICS in BS is continuously monitoring the state of charge (SOC) of the battery. If the battery is not fully charged and there is surplus power in the microgrid, the surplus power is used to charge the batteries. The battery storage can be controlled as ―operating reserve‖ to supply or absorb any transient power during changes in generation or loads within the energy limits. For example, when the load changes in the microgrid, the BS can react very quickly to match the load power change. The ICS is responsible for managing the operating reserve in the battery and controlling the battery charging and discharging.
The DGs connected through wind and PVs are controlled using maximum power point tracking (MPPT) to enhance the benefits of renewable energy sources. Therefore, any deficit in load power is supplied by other dispatchable sources (i.e., diesel, BS) operating in frequency and voltage droop control. Voltage control of each dispatchable DG and voltage droop amongst DGs ensures the voltage regulation, stability and proper reactive power sharing, thereby avoiding reactive power circulation in the microgrid. The proposed frequency droop lines for BS and diesel generator are defined to ensure the battery is charged when there is excess power available in the microgrid.
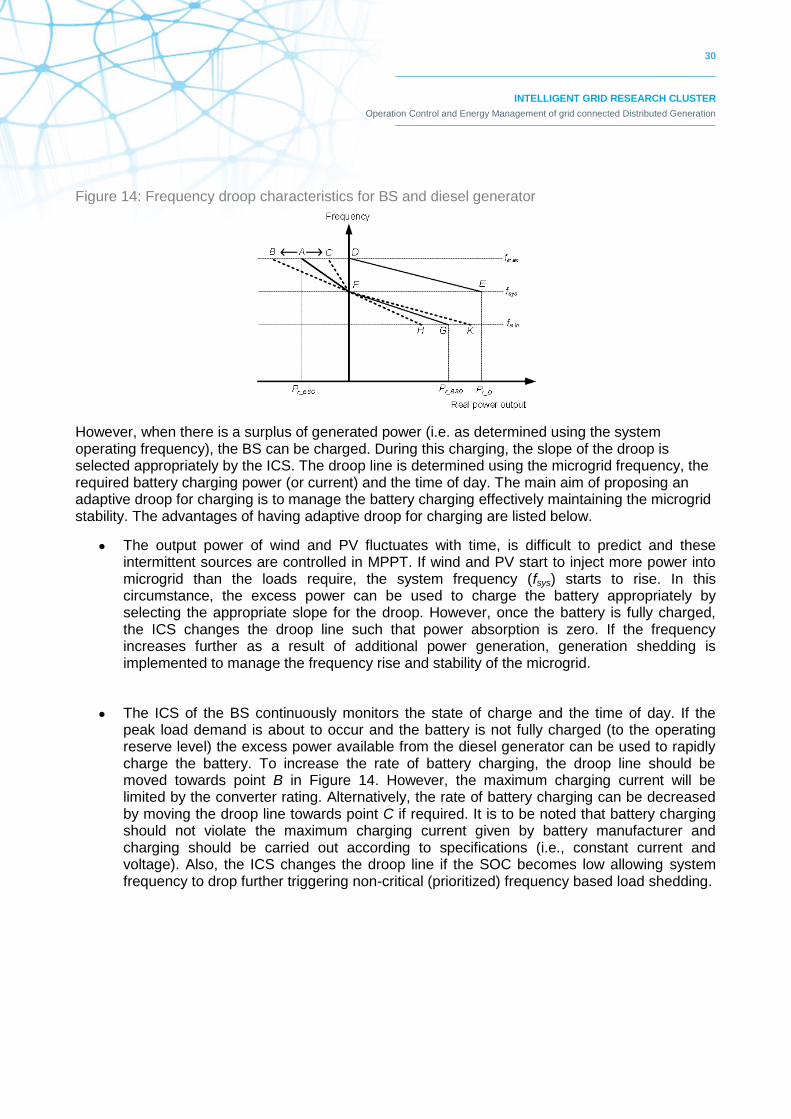
The droop lines for the diesel generator and BS are shown by DE and AFG respectively in Figure 14. The line segment AF represents the droop for battery charging while the droop for battery discharging is represented by line FG. According to the droop lines shown in the figure, BS starts to supply the load power once the diesel generator reaches its maximum power output at rated frequency. However, it is to be noted that slope of the droop line is controlled by the ICS and it can be changed towards points H or K. The reason for proposing adaptive droop slope is to give ICS an opportunity to enhance the flexibility of control of the BS in the microgrid. For example, consider the power sharing in the presence of a few BS systems in a microgrid. In this circumstance, the slope of the droop line can be changed according to SOC of the batteries to enable the power sharing effectively since power sharing according to each BS converter rating is not viable. These control actions can be embedded in the ICS to respond whenever required.
30
INTELLIGENT GRID RESEARCH CLUSTER
Operation Control and Energy Management of grid connected Distributed Generation
Figure 14: Frequency droop characteristics for BS and diesel generator
However, when there is a surplus of generated power (i.e. as determined using the system operating frequency), the BS can be charged. During this charging, the slope of the droop is selected appropriately by the ICS. The droop line is determined using the microgrid frequency, the required battery charging power (or current) and the time of day. The main aim of proposing an adaptive droop for charging is to manage the battery charging effectively maintaining the microgrid stability. The advantages of having adaptive droop for charging are listed below.
The output power of wind and PV fluctuates with time, is difficult to predict and these intermittent sources are controlled in MPPT. If wind and PV start to inject more power into microgrid than the loads require, the system frequency (fsys) starts to rise. In this circumstance, the excess power can be used to charge the battery appropriately by selecting the appropriate slope for the droop. However, once the battery is fully charged, the ICS changes the droop line such that power absorption is zero. If the frequency increases further as a result of additional power generation, generation shedding is implemented to manage the frequency rise and stability of the microgrid.
The ICS of the BS continuously monitors the state of charge and the time of day. If the peak load demand is about to occur and the battery is not fully charged (to the operating reserve level) the excess power available from the diesel generator can be used to rapidly charge the battery. To increase the rate of battery charging, the droop line should be moved towards point B in Figure 14. However, the maximum charging current will be limited by the converter rating. Alternatively, the rate of battery charging can be decreased by moving the droop line towards point C if required. It is to be noted that battery charging should not violate the maximum charging current given by battery manufacturer and charging should be carried out according to specifications (i.e., constant current and voltage). Also, the ICS changes the droop line if the SOC becomes low allowing system frequency to drop further triggering non-critical (prioritized) frequency based load shedding.

31
INTELLIGENT GRID RESEARCH CLUSTER
Operation Control and Energy Management of grid connected Distributed Generation
3.2. Summary
In this section, power management strategies were presented to incorporate dispatchable, non-dispatchable and energy storage devices. The proposed control enables DGs to have plug and play capability, thereby maximising the benefits of DG sources. In the proposal, an intelligent control system (ICS) was presented to manage the charging and discharging of the battery storage (BS) effectively. To enhance a flexible operation in the microgrid, an adaptive droop line was proposed for the BS. During the charging and discharging, the slope of the droop was selected appropriately by the BS intelligent controller. The proposed method can be effectively employed in microgrids where dispatchable, non-dispatchable and energy storage devices are present.
32
INTELLIGENT GRID RESEARCH CLUSTER
Operation Control and Energy Management of grid connected Distributed Generation
4. CONVERTER CONTROL
In this section, the structure and control of voltage source converters (VSCs) are investigated. A VSC, being a switched device, can introduce harmonics in the system due to the switching of the power semiconductor switches. To suppress these harmonics, passive filter circuits are used. The design of the filter circuits will also be discussed. While designing a switching controller, the dynamics of the filter circuit must be considered. A generalized control structure which can perform simultaneous voltage and current control is discussed. This generalized control structure can also be used for either current or voltage control.
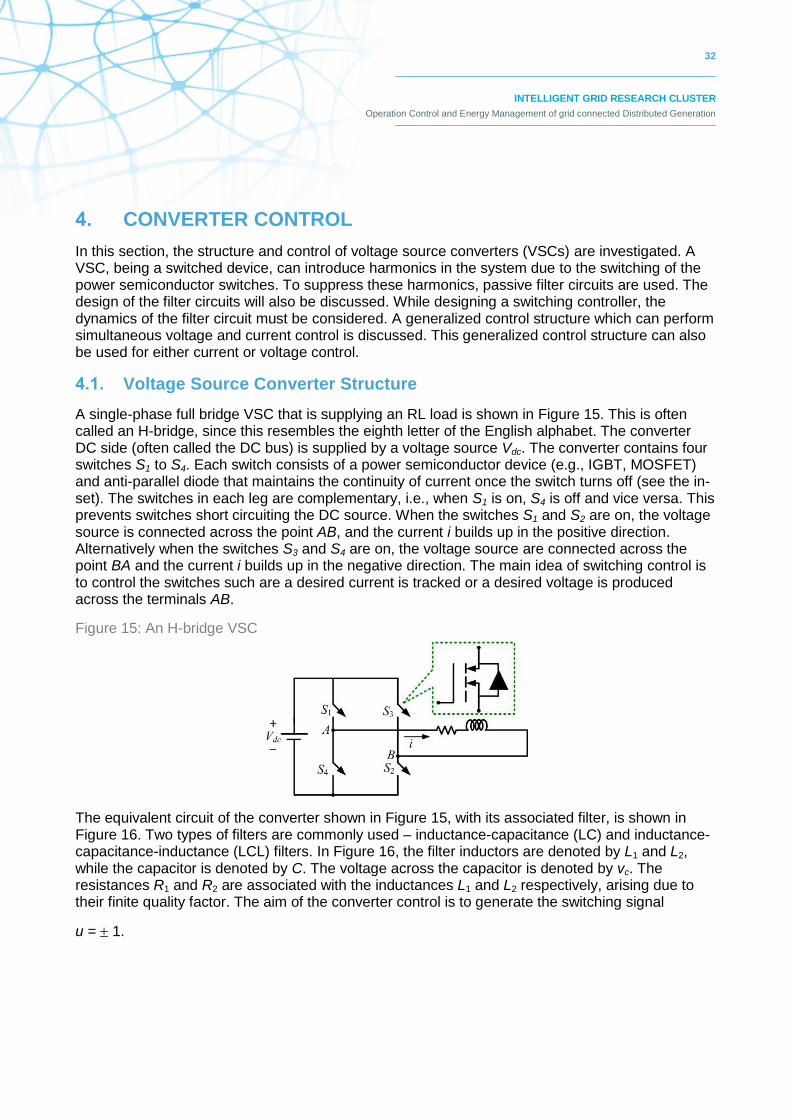
4.1. Voltage Source Converter Structure
A single-phase full bridge VSC that is supplying an RL load is shown in Figure 15. This is often called an H-bridge, since this resembles the eighth letter of the English alphabet. The converter DC side (often called the DC bus) is supplied by a voltage source Vdc. The converter contains four switches S1 to S4. Each switch consists of a power semiconductor device (e.g., IGBT, MOSFET) and anti-parallel diode that maintains the continuity of current once the switch turns off (see the in-set). The switches in each leg are complementary, i.e., when S1 is on, S4 is off and vice versa. This prevents switches short circuiting the DC source. When the switches S1 and S2 are on, the voltage source is connected across the point AB, and the current i builds up in the positive direction. Alternatively when the switches S3 and S4 are on, the voltage source are connected across the point BA and the current i builds up in the negative direction. The main idea of switching control is to control the switches such are a desired current is tracked or a desired voltage is produced across the terminals AB.
Figure 15: An H-bridge VSC
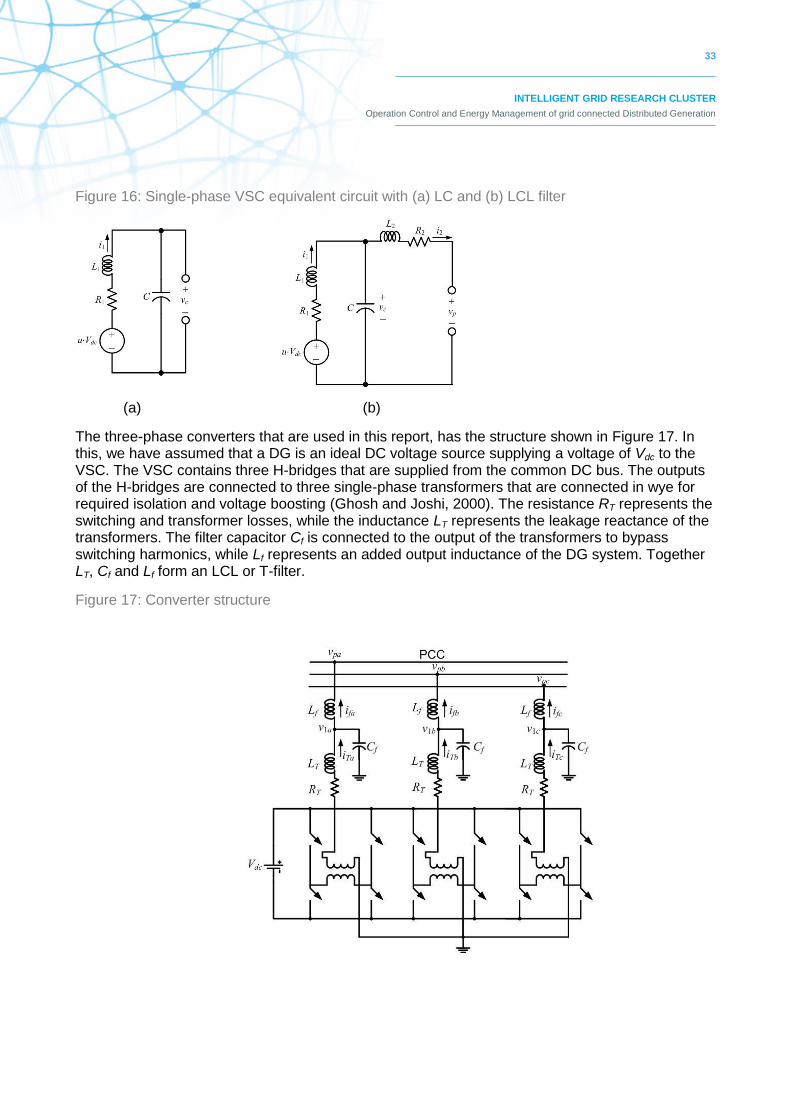
The equivalent circuit of the converter shown in Figure 15, with its associated filter, is shown in Figure 16. Two types of filters are commonly used – inductance-capacitance (LC) and inductance-capacitance-inductance (LCL) filters. In Figure 16, the filter inductors are denoted by L1 and L2, while the capacitor is denoted by C. The voltage across the capacitor is denoted by vc. The resistances R1 and R2 are associated with the inductances L1 and L2 respectively, arising due to their finite quality factor. The aim of the converter control is to generate the switching signal
u = 1.
33
INTELLIGENT GRID RESEARCH CLUSTER
Operation Control and Energy Management of grid connected Distributed Generation
Figure 16: Single-phase VSC equivalent circuit with (a) LC and (b) LCL filter
(a) (b)
The three-phase converters that are used in this report, has the structure shown in Figure 17. In this, we have assumed that a DG is an ideal DC voltage source supplying a voltage of Vdc to the VSC. The VSC contains three H-bridges that are supplied from the common DC bus. The outputs of the H-bridges are connected to three single-phase transformers that are connected in wye for required isolation and voltage boosting (Ghosh and Joshi, 2000). The resistance RT represents the switching and transformer losses, while the inductance LT represents the leakage reactance of the transformers. The filter capacitor Cf is connected to the output of the transformers to bypass switching harmonics, while Lf represents an added output inductance of the DG system. Together LT, Cf and Lf form an LCL or T-filter.
Figure 17: Converter structure

34
INTELLIGENT GRID RESEARCH CLUSTER
Operation Control and Energy Management of grid connected Distributed Generation
4.2. Control of Converter with Filters
There are various converter control strategies. However we shall adopt the linear quadratic regulator (LQR) based state feedback control. This was used in (Ghosh and Ledwich, 2003), where it was shown that hysteretic current control by neglecting the filter dynamics system can lead to an unstable operation.
Defining a state vector as xT = [vc i1], the state space equation of the system can be written as
cBuAxx (8)
Where uc is the feedback control law, based on which the converter switching signal u = 1 is
generated. Assuming that the references for the states are available and are denoted by xref = [vcref i1ref], the state feedback control law is given as
refc xxKu
(9)
Where K = [k1 k2] is the feedback gain matrix, which is computed based on LQR and design parameters. The schematic diagram of the control law is given in Figure 18 (a).
Figure 18: Three different feedback control structures: (a) full state feedback, (b) partial state feedback with high-pass filter and (c) partial state feedback with feed forward control
The LC filter structure is most suitable for tracking the output voltage, where the voltage reference (vcref) can be pre-specified. However, it is rather difficult to find a reference (i1ref) for the converter output current i1. One approach can be to set this reference to zero. This will however lead to incorrect control action. To avoid this problem, a state transformation has been used in (Ghosh and Ledwich, 2003). This is however feasible only when the overall system structure and rough estimates of the system parameters are known a priori. Therefore this solution cannot be stated as a general solution. It should be noted that the current i1 should only contain lower frequency components, while its high frequency components should be zero. Therefore, if we pass this current through a high-pass filter (HPF), then we expect the output (i1HPF) of the filter to be zero. The HPF structure is given by
s
s
i
i HPF
1
1
(10)
Where determines the cutoff frequency of the filter.
It may also be desirable to use a feed forward of the voltage reference in order to obtain better tracking characteristics. This is shown in Figure 18 (c), where the reference voltage is multiplied by
a constant and is added to the feedback signals. In any of the control schemes, the converter
switching pulses are obtained from the computed values of uc. This is discussed next.

35
INTELLIGENT GRID RESEARCH CLUSTER
Operation Control and Energy Management of grid connected Distributed Generation
Ignoring delay, it can be assumed that the average over the switch period is obtained by a linear modulator as in (Mohan et al., 2003). The PWM amplifier can then be considered as an ideal unit gain amplifier, i.e., assume uc = u. Under this condition, the open-loop is the same as given by (8). The closed-loop system model is then derived. The transfer function of the HPF is considered as given in (10). This can be written as
LPFHPF iiis
is
si 11111 1
(11)
Where i1LPF is given by
11 is
i LPF
(12)
Equation (12) can be expressed in differential equation form as
111 iiidt
dLPFLPF
(13)
A new state vector is defined as xeT = [vc i1 i1LPF]. Then combining (8) with (13), an augmented
state space equation is obtained of the form
ceeee uBxAx (14)
The discrete-time equivalent (14) is given as
kGukFxkx cee 1 (15)
where k is time index and the matrices F and G can be computed as per (Kuo, 1980)
From Figure 18 (c), the feedback control law is given by
kikkvkkvkku HPFccrefc 1211 (16)
Substituting (11) in (16), we get
kvkkxkkk
kikkikkvkkvkku
crefe
LPFccrefc
1221
121211
(17)
Combining (17) with (15), the closed-loop state equation is given by
kvBkkxkkkBAkx crefeeeee 12211 (18)
Consider the system shown in H-bridge converter with LC filter connected to an RL plus back emf load Figure 19 in which the converter is connected with an RL plus back emf load. The frequency of the triangular waveform (vtri) is taken as 15 kHz and the sampling frequency is chosen twice of this frequency, i.e., 30 kHz. The resonance frequency of the filter is around 2.2 kHz.
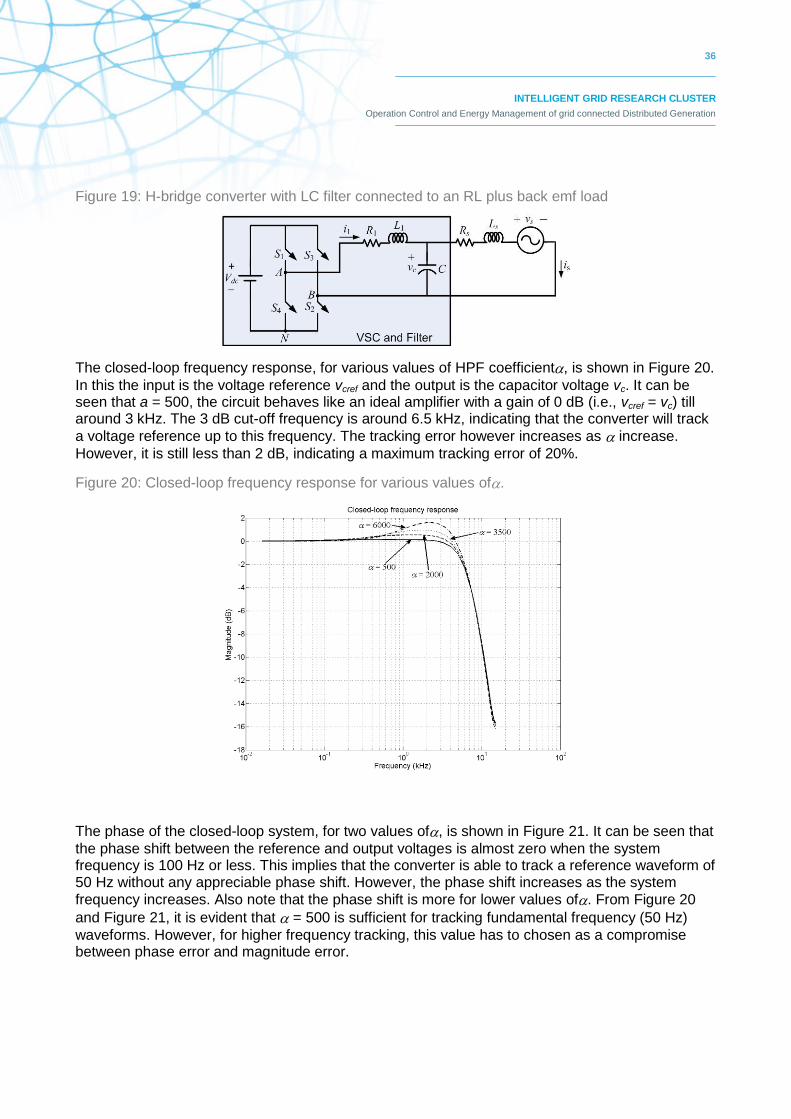
36
INTELLIGENT GRID RESEARCH CLUSTER
Operation Control and Energy Management of grid connected Distributed Generation
Figure 19: H-bridge converter with LC filter connected to an RL plus back emf load
The closed-loop frequency response, for various values of HPF coefficient, is shown in Figure 20.
In this the input is the voltage reference vcref and the output is the capacitor voltage vc. It can be seen that a = 500, the circuit behaves like an ideal amplifier with a gain of 0 dB (i.e., vcref = vc) till around 3 kHz. The 3 dB cut-off frequency is around 6.5 kHz, indicating that the converter will track
a voltage reference up to this frequency. The tracking error however increases as increase.
However, it is still less than 2 dB, indicating a maximum tracking error of 20%.
Figure 20: Closed-loop frequency response for various values of.
The phase of the closed-loop system, for two values of, is shown in Figure 21. It can be seen that
the phase shift between the reference and output voltages is almost zero when the system frequency is 100 Hz or less. This implies that the converter is able to track a reference waveform of 50 Hz without any appreciable phase shift. However, the phase shift increases as the system
frequency increases. Also note that the phase shift is more for lower values of. From Figure 20
and Figure 21, it is evident that = 500 is sufficient for tracking fundamental frequency (50 Hz)
waveforms. However, for higher frequency tracking, this value has to chosen as a compromise between phase error and magnitude error.
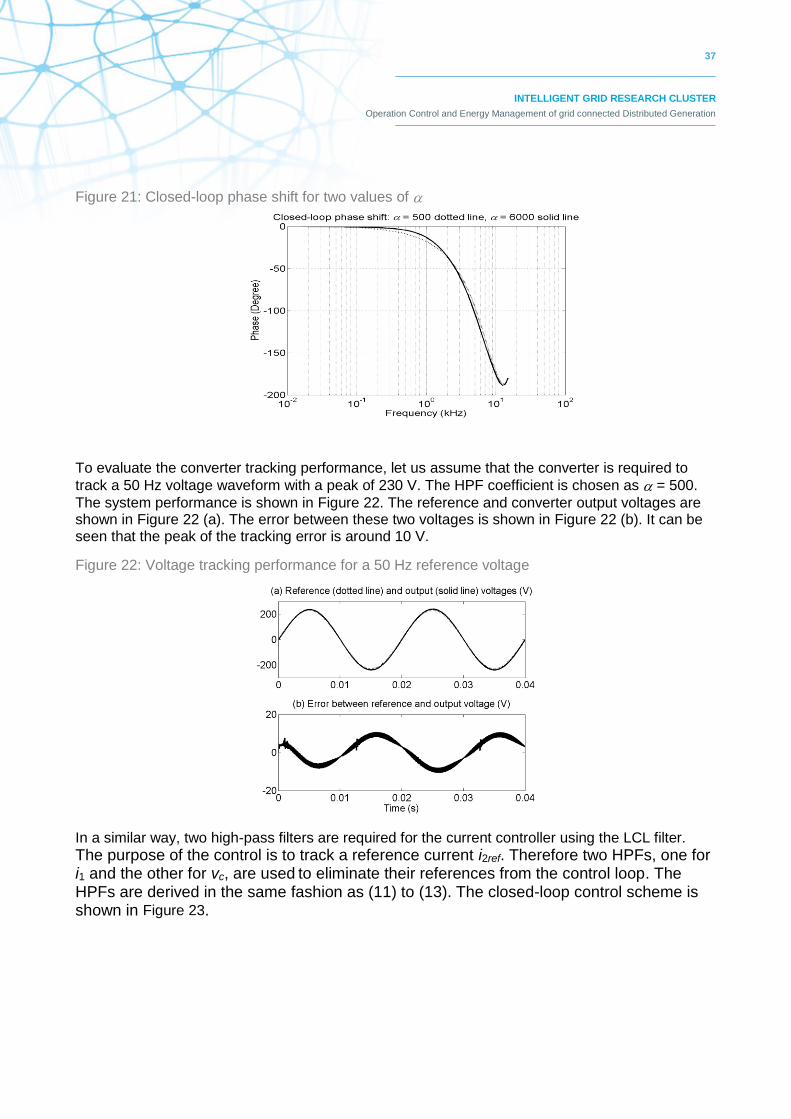
37
INTELLIGENT GRID RESEARCH CLUSTER
Operation Control and Energy Management of grid connected Distributed Generation
Figure 21: Closed-loop phase shift for two values of
To evaluate the converter tracking performance, let us assume that the converter is required to
track a 50 Hz voltage waveform with a peak of 230 V. The HPF coefficient is chosen as = 500.
The system performance is shown in Figure 22. The reference and converter output voltages are shown in Figure 22 (a). The error between these two voltages is shown in Figure 22 (b). It can be seen that the peak of the tracking error is around 10 V.
Figure 22: Voltage tracking performance for a 50 Hz reference voltage
In a similar way, two high-pass filters are required for the current controller using the LCL filter.
The purpose of the control is to track a reference current i2ref. Therefore two HPFs, one for i1 and the other for vc, are used to eliminate their references from the control loop. The HPFs are derived in the same fashion as (11) to (13). The closed-loop control scheme is shown in Figure 23.
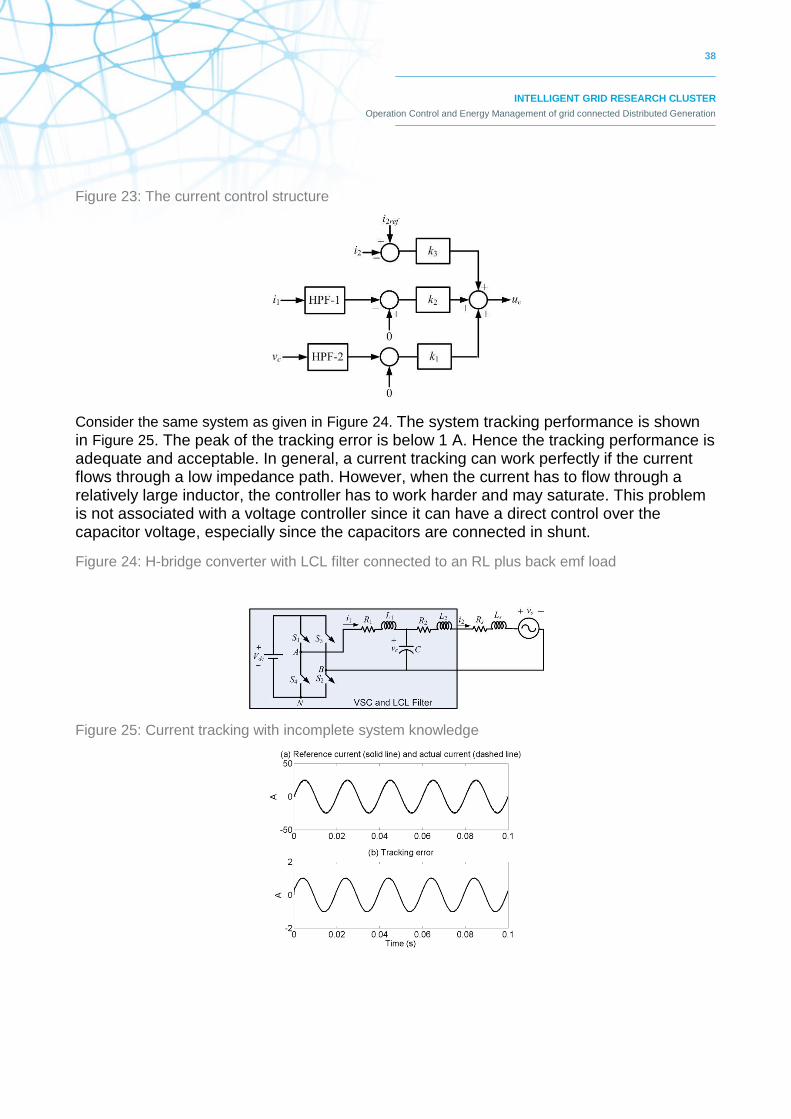
38
INTELLIGENT GRID RESEARCH CLUSTER
Operation Control and Energy Management of grid connected Distributed Generation
Figure 23: The current control structure
Consider the same system as given in Figure 24. The system tracking performance is shown in Figure 25. The peak of the tracking error is below 1 A. Hence the tracking performance is adequate and acceptable. In general, a current tracking can work perfectly if the current flows through a low impedance path. However, when the current has to flow through a relatively large inductor, the controller has to work harder and may saturate. This problem is not associated with a voltage controller since it can have a direct control over the capacitor voltage, especially since the capacitors are connected in shunt.
Figure 24: H-bridge converter with LCL filter connected to an RL plus back emf load
Figure 25: Current tracking with incomplete system knowledge

39
INTELLIGENT GRID RESEARCH CLUSTER
Operation Control and Energy Management of grid connected Distributed Generation
4.3. Summary
In this section, control strategies for a DG converter were presented considering different filter structures. This analysis is imperative since most of the sources in a microgrid are interfaced through converters. Both voltage and current control converters were considered. The converters generate harmonics and to suppress these harmonics, the design of passive filter circuits was presented.
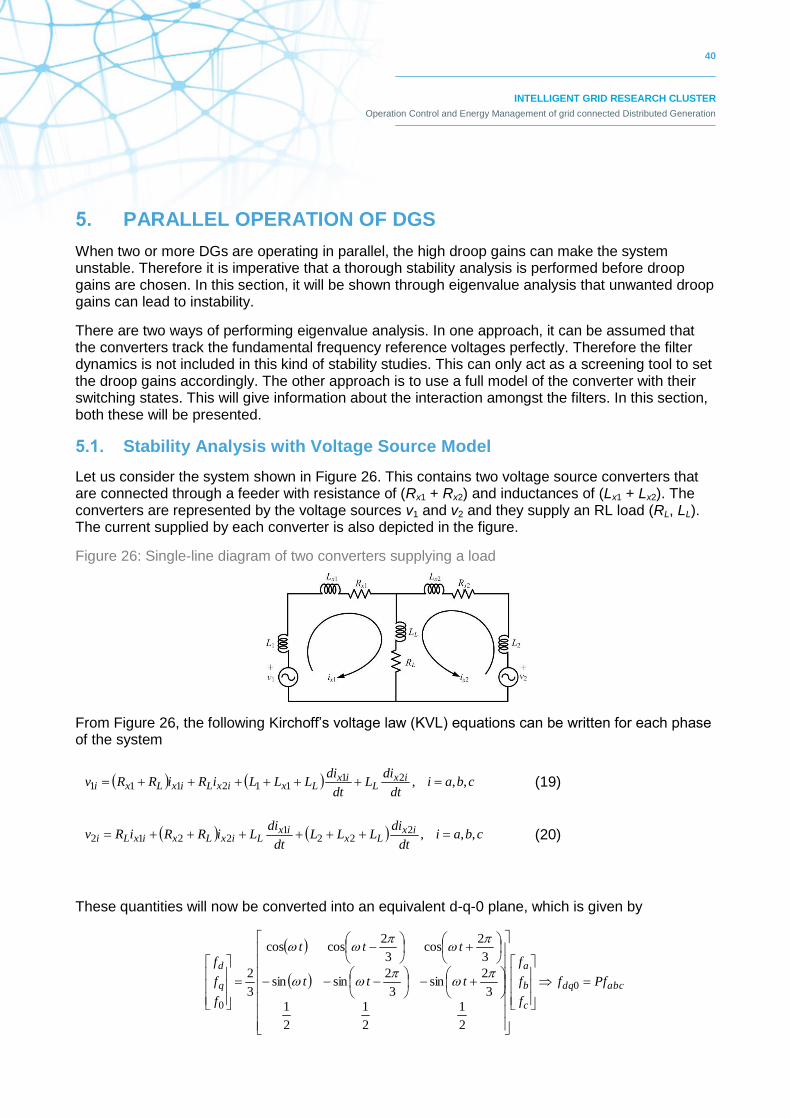
40
INTELLIGENT GRID RESEARCH CLUSTER
Operation Control and Energy Management of grid connected Distributed Generation
5. PARALLEL OPERATION OF DGS
When two or more DGs are operating in parallel, the high droop gains can make the system unstable. Therefore it is imperative that a thorough stability analysis is performed before droop gains are chosen. In this section, it will be shown through eigenvalue analysis that unwanted droop gains can lead to instability.
There are two ways of performing eigenvalue analysis. In one approach, it can be assumed that the converters track the fundamental frequency reference voltages perfectly. Therefore the filter dynamics is not included in this kind of stability studies. This can only act as a screening tool to set the droop gains accordingly. The other approach is to use a full model of the converter with their switching states. This will give information about the interaction amongst the filters. In this section, both these will be presented.
5.1. Stability Analysis with Voltage Source Model
Let us consider the system shown in Figure 26. This contains two voltage source converters that are connected through a feeder with resistance of (Rx1 + Rx2) and inductances of (Lx1 + Lx2). The converters are represented by the voltage sources v1 and v2 and they supply an RL load (RL, LL). The current supplied by each converter is also depicted in the figure.
Figure 26: Single-line diagram of two converters supplying a load
From Figure 26, the following Kirchoff’s voltage law (KVL) equations can be written for each phase of the system
cbaidt
diL
dt
diLLLiRiRRv ix
Lix
LxixLixLxi ,,,21112111
(19)
cbaidt
diLLL
dt
diLiRRiRv ix
Lxix
LixLxixLi ,,,222
12212 (20)
These quantities will now be converted into an equivalent d-q-0 plane, which is given by
abcdq
c
b
a
q
d
Pff
f
f
f
ttt
ttt
f
f
f
0
0
2
1
2
1
2
1
3
2sin
3
2sinsin
3
2cos
3
2coscos
3
2

41
INTELLIGENT GRID RESEARCH CLUSTER
Operation Control and Energy Management of grid connected Distributed Generation
Where f can be either voltage or current. Since we shall only consider balanced operation, the zero-sequence component can be taken as 0. We now define the following vectors
qx
dx
qx
dx
dq
q
d
q
d
dq
i
i
i
i
x
v
v
v
v
v
2
2
1
1
2
2
1
1
,
Then the state space equation of the state space equation of the system in d-q plane can be written as
dqdqdqdqdq vBxAx (21)
where Adq = 1 and Bdq = 1 and
LxLxLL
LxLxLL
LLLxLx
LLLxLx
RRLLLRL
LLLRRLR
RLRRLLL
LRLLLRR
222
222
111
111
LxL
LxL
LLx
LLx
LLLL
LLLL
LLLL
LLLL
22
22
11
11
00
00
00
00
Let the voltage of the three phases of converter-1 be given by
120sin,120sin,sin 111111 tVvtVvtVv mcmbma
In the frame of converter-1 output voltage, these voltages can be expressed as
11
1 0
mQ
D
Vv
v
(22)
In a similar way, choosing converter-2 voltages as
120sin,120sin,sin 222222 tVvtVvtVv mcmbma
The d-q axis voltages can be expressed in the frame of converter-2 voltage as
22
2 0
mQ
D
Vv
v
(23)
These voltages are defined in terms of the reference frame of each converter output voltage. Let us assume that the state model (21) is derived based on a common reference, from which
converter-1 voltage vector leads by 1 and converter-2 voltage vector leads by 2. The relation
between two frames that are separated by an angle is shown in Figure 27.From these figure we
can write:
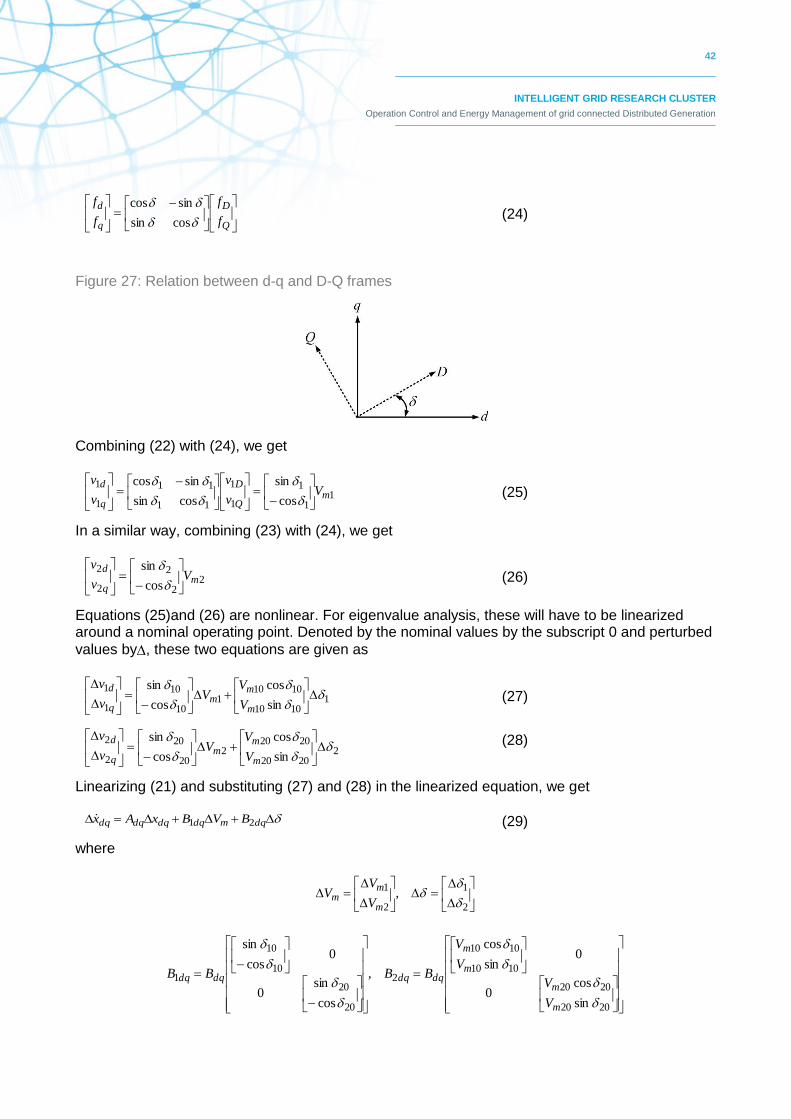
42
INTELLIGENT GRID RESEARCH CLUSTER
Operation Control and Energy Management of grid connected Distributed Generation
Q
D
q
d
f
f
f
f
cossin
sincos
(24)
Figure 27: Relation between d-q and D-Q frames
Combining (22) with (24), we get
11
1
1
1
11
11
1
1
cos
sin
cossin
sincosm
Q
D
q
dV
v
v
v
v
(25)
In a similar way, combining (23) with (24), we get
22
2
2
2
cos
sinm
q
dV
v
v
(26)
Equations (25)and (26) are nonlinear. For eigenvalue analysis, these will have to be linearized around a nominal operating point. Denoted by the nominal values by the subscript 0 and perturbed
values by, these two equations are given as
11010
10101
10
10
1
1
sin
cos
cos
sin
m
mm
q
d
V
VV
v
v
(27)
22020
20202
20
20
2
2
sin
cos
cos
sin
m
mm
q
d
V
VV
v
v (28)
Linearizing (21) and substituting (27) and (28) in the linearized equation, we get
dqmdqdqdqdq BVBxAx 21 (29)
where
2
1
2
1,
m
mm
V
VV
2020
2020
1010
1010
2
20
20
10
10
1
sin
cos0
0sin
cos
,
cos
sin0
0cos
sin
m
m
m
m
dqdqdqdq
V
V
V
V
BBBB

43
INTELLIGENT GRID RESEARCH CLUSTER
Operation Control and Energy Management of grid connected Distributed Generation
We shall now combine the angle droop equations (4) with the state model (29). The active power P and the reactive power Q are average quantities. These quantities are computed based on their instantaneous quantities using lowpass filter as per
ec
c
ec
c
Qs
Q
Ps
P
(30)
Where Pe and Qe are instantaneous measured values. Linearizing, these equations can be written in the following state space form
ecc
ecc
QQQ
PPP
(31)
The instantaneous active and reactive powers can be defined in terms of d-q axis voltages and current as
xqqxdde ivivP 2
3 (32)
xqdxdqe ivivQ 2
3 (33)
Substituting (25) in the above equations, we get for converter-1
111111 cossin2
3mqxdxe ViiP
(34)
111111 sincos2
3mqxdxe ViiQ
(35)
Linearizing the above equations we get
1141131121111 mqxdxe ViiP
(36)
1141131121111 mqxdxe ViiQ
(37)
where
1001100113101012101011 cossin2
3,cos
2
3,sin
2
3 qxdxmm iiVV
100110101014 cossin2
3 qxxdm iiV
1001100113101012101011 sincos2
3,sin
2
3,cos
2
3 qxdxmm iiVV
100110101014 cossin2
3 qxxdm iiV
To linearize the droop equations (4), it is to be noted that the derivative of the rated values are zero. Therefore, for converter-1 we get

44
INTELLIGENT GRID RESEARCH CLUSTER
Operation Control and Energy Management of grid connected Distributed Generation
111
111
QnV
Pm
m
(38)
Therefore eliminating Vm1 and 1 using (38) and combining (31) with (36) and (37), we get
1141131121111 QPiiP qxdx (39)
1141131121111 QPiiQ qxdx (40)
where
131141411312121111 ,1,, nm cccc
131141411312121111 1,,, nm cccc
In a similar fashion, we can write the following two equations for converter-2
2242232222212 QPiiP qxdx (41)
2242232222212 QPiiQ qxdx (42)
Further we eliminate Vm and from (29) using (38) to get
QBPBxAx dqdqdq 21 (43)
where
2
1
2
1,
Q
Q
PP
2
112
2
121
0
0,
0
0
n
nBB
m
mBB dqdq
We now define an extended state vector as
TTTTdq QPxx
Then combining (39) to (43), we get a homogeneous state equation of the form
xAx (44)
where
333231
232221
131211
AAA
AAA
AAA
A
21311211 ,, BABAAA dq
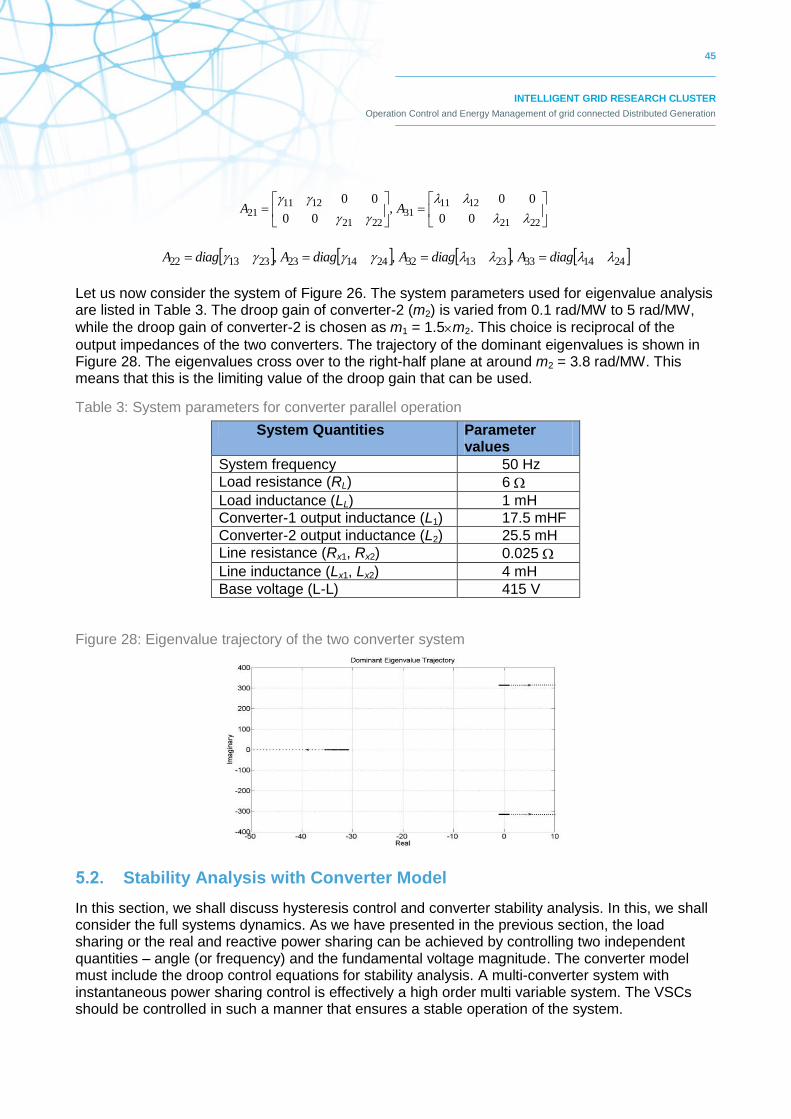
45
INTELLIGENT GRID RESEARCH CLUSTER
Operation Control and Energy Management of grid connected Distributed Generation
2221
121131
2221
121121
00
00,
00
00
AA
241433231332241423231322 ,,, diagAdiagAdiagAdiagA
Let us now consider the system of Figure 26. The system parameters used for eigenvalue analysis are listed in Table 3. The droop gain of converter-2 (m2) is varied from 0.1 rad/MW to 5 rad/MW,
while the droop gain of converter-2 is chosen as m1 = 1.5m2. This choice is reciprocal of the
output impedances of the two converters. The trajectory of the dominant eigenvalues is shown in Figure 28. The eigenvalues cross over to the right-half plane at around m2 = 3.8 rad/MW. This means that this is the limiting value of the droop gain that can be used.
Table 3: System parameters for converter parallel operation
System Quantities Parameter values
System frequency 50 Hz
Load resistance (RL) 6
Load inductance (LL) 1 mH
Converter-1 output inductance (L1) 17.5 mHF
Converter-2 output inductance (L2) 25.5 mH
Line resistance (Rx1, Rx2) 0.025
Line inductance (Lx1, Lx2) 4 mH
Base voltage (L-L) 415 V
Figure 28: Eigenvalue trajectory of the two converter system
5.2. Stability Analysis with Converter Model
In this section, we shall discuss hysteresis control and converter stability analysis. In this, we shall consider the full systems dynamics. As we have presented in the previous section, the load sharing or the real and reactive power sharing can be achieved by controlling two independent quantities – angle (or frequency) and the fundamental voltage magnitude. The converter model must include the droop control equations for stability analysis. A multi-converter system with instantaneous power sharing control is effectively a high order multi variable system. The VSCs should be controlled in such a manner that ensures a stable operation of the system.

46
INTELLIGENT GRID RESEARCH CLUSTER
Operation Control and Energy Management of grid connected Distributed Generation
In this section, the theory for the analysis of hysteretic VSCs operating in a power system is developed. Under mild assumptions, the standard line dynamic analysis tools such as eigen-study become possible. There are two main tools available to analyze converters operating in power systems. The first uses controlled fundamental frequency voltage sources, which ignores transients associated with the connecting filters (as shown in the previous section and (Coelho et al., 2002)). The second approach uses the switch state averaging of pulse width modulated signals (Pogaku et al., 2007, Ghosh et al., 2011). The quality of the hysteretic converter modeling is demonstrated in this section on the special case of two VSCs closely connected. The novel contribution here is that the widely used hysteretic converters can now be modeled as a part of a power system using linear tools, which has not been done before.
We assumed that all the DGs are ideal DC voltage source supplying a voltage of Vdc to a VSC. The structure of the VSC is shown in Figure 19.The equivalent circuit of one phase of the converter is
shown in Figure 29. In this, uVdc represents the converter output voltage, where u is the switching
function and is given by u = ± 1. The main aim of the converter control is to generate u. From the circuit of Figure 29 the following state vector is chosen
cfTT viiz
(45)
Then the state space equation of the system can be written as
pCvBuAzz (46)
where u is the switching function and
0
1
0
,
0
0,
011
100
10
f
Tdc
ff
f
TTT
LC
LV
B
CC
L
LLR
A
Figure 29: Single-phase equivalent circuit of VSC
The main aim of the converter control is to generate uc from a suitable state feedback control law such that the output voltage and current are tracked properly according to their references. It is easy to generate references for the output voltage vc and current if from the fundamental power flow requirements However, the same cannot be said about the reference for the current iT (Ghosh and Ledwich, 2003). On the other hand, once the reference for vc is obtained, it is easy to calculate a reference for the current ic through the filter capacitor (see Figure 29).

47
INTELLIGENT GRID RESEARCH CLUSTER
Operation Control and Energy Management of grid connected Distributed Generation
To facilitate this, we define a new state vector as (Ghosh and Ledwich, 2003)
cfcT viix
(47)
We then have the following state transformation matrix
zCzx P
100
010
011
(48)
The transformed state space equation is then given by combining (46) and (48) as
ppppp CvCBuCxACCx 1
(49)
If the system of (49) is sampled with a sampling time of T, then its discrete-time description can
be written in the form
kHvkGukFxkx p1
(50)
To control the converter, we shall employ a discrete time linear quadratic regulator (LQR) to obtain the control of the form
ccrefffrefccref
refrefc
vvkiikiik
kxkxkkkkxkxKku
321
321
(51)
where xref is the reference vector and K is the feedback gain matrix. From uc (k), the switching function is generated as
1 then elseif
1 then If
uhku
uhku
c
c
(52)
where h is a small number.
A Linear Quadratic Regulator is shown to produce an infinite gain margin and a phase margin of at
least 60 (Anderson and Moore, 1971). This has been used in (Aredes et al., 1997) robust
hysteretic LQR state feedback switching controller. The following example demonstrates the effectiveness of this control.
A composite model of the converter in the d-q domain is developed, which also includes the controller. Traditional sliding mode design consider a function S and control such that 0SS . Then
the system will approach S = 0, which is called the sliding line (Slotine and Li, 1991, Khalil, 2002). When a finite switch rate constraint is applied, the system will chatter around S = 0, at the switching frequency. Provided that the switch frequency is sufficiently high, the power system impact at switch frequency will be negligible. We also assume that the load disturbances are small enough that the rate of change of current is within the capability of the converter thus the model of the system being on the sliding line will be valid.
From equivalent circuit shown in Figure 29, the following equations are obtained for each of the phases of the three-phase system

48
INTELLIGENT GRID RESEARCH CLUSTER
Operation Control and Energy Management of grid connected Distributed Generation
T
dcccT
T
TT
L
Vuvi
L
R
dt
di .
(53)
f
fTc
C
ii
dt
dv
(54)
dt
diLvv
ffpc
(55)
Equations (53) to (55) are transformed into a d-q reference frame of converter output voltages, rotating at system frequency ω in the same manner as discussed in Section 6.
Defining a state vector as
TcqcdfqfdTqTdi vviiiiz ][
(56)
The state equation in the d-q frame is given by
pdqzicdqziizii vCuBzAz (57)
where ucdq and vtdq are vectors containing the d and q axis components of uc and vt and
01010
00101
10000
01000
1000
0100
ff
ff
f
f
TTT
TTT
zi
CC
CC
L
L
LLR
LLR
A
00
00
10
01
00
00
and
00
00
00
00
0
0
f
fzi
Tdc
Tdc
ziL
LC
LV
LV
B
Let us now define a new state vector as
Tcqcdfqfdcqcdi vviiiix ][
(58)
Then using dq transformation given in the previous section, we get the following state equation
pdqidqiiii vCuBxAx (59)
From (51), the d and q components of the sliding plane are given as
q
d
irefdqicq
cd
S
SxxH
u
u
(60)

49
INTELLIGENT GRID RESEARCH CLUSTER
Operation Control and Energy Management of grid connected Distributed Generation
where
321
321
000
000
kkk
kkkHi
Tcqrefcdreffqreffdrefcqrefcdrefrefdq vviiiix ][
To analyze the system, we transform the state variables to a new vector w as
Tcqcdfqfdqdi vviiSSw ][
(61)
Then, from (60), the states of (58) can be written in terms of (61) as
refdqiiirefdqi
ii
i xFxTxH
xI
Hw
64424 00
(62)
where 0n×m is an n×m null matrix and In is n×n identity matrix. From the above, we get the two following equations
refdqiiii xFwTx 1 (63)
refdqiiii xFxTw
(64)
From (71) and (76), we get
refdqipdqidqiiiii xFvCuBxATw
(65)
Substituting (75) in (77), we get
refdqipdqiidqiirefdqiiiiiiiii xFvCTuBTxFTATwTATw 11 (66)
Since udq is chosen such that Sd = Sq = 0, we can eliminate them from the state vector wi.
Let us define a new state operator such that
iiT
cqcdfqfdi wNvviiy
(67)
where
4240 INi .
Now since wi = NiTyi and NiFi = NiTiBi = 0, (78) can be re-expressed as
pdqirefdqiiii vCxByAy (68)
where
iiiiiiiiiiTiiiiii CTNCFTATNBNTATNA ,, 11
To solve the state equation (68), the reference vector xrefdq is required as input. In this sub-section, we shall discuss how they can easily be written in terms of the known quantities. We must however

50
INTELLIGENT GRID RESEARCH CLUSTER
Operation Control and Energy Management of grid connected Distributed Generation
remember that all the d-q quantities are expressed in the reference frame of the converter output voltages. Let us define the three-phase instantaneous reference converter output voltages as
120sin,120sin,sin tVvtVvtVv cmccrefcmcbrefcmcaref
Then the d-q transformation will result in
cmcqref
cdref
Vv
v 0
(69)
Consequently, the reference for the capacitor currents that are leading the corresponding voltages
by 90 are given as
0
fcm
cqref
cdref CV
i
i
(70)
Now the expression for the power and reactive power are given by (32)and (33). Let the real and reactive power that are desired to be injected to the PCC by the converter be denoted respectively by Pref and Qref. Then from (69), (32)and (33), we can write
ref
ref
cmfqref
fdref
P
Q
Vi
i
3
2
(71)
Combining (69) - (71), we form the reference vectors in terms of Vcm, Pref and Qref.
The reference quantities are defined in terms of the reference frame of the converter output voltage. These need to be converted into a common reference frame. Let us choose the PCC voltage as the common reference frame D-Q. Let also the angle between the PCC voltage and the
converter voltage be. Then using the transformation given in (24) and Figure 27, the converter
equation (68) can then be re-written as
pDQirefDQiiii vCxByAy (72)
Note that the states also get transformed into D-Q. However the subscripts are avoided here for brevity.
We now develop the model when two VSCs are operating in parallel. The single-line diagram of the system considered is shown in Figure 30. In this, the PCC is connected to an infinite bus with a
voltage of vs. A load; with an impedance of RL + jLL is connected to the PCC. The load current is
denoted by iL. The system parameters and quantities of the two VSCs are denoted by subscripts 1 and 2.

51
INTELLIGENT GRID RESEARCH CLUSTER
Operation Control and Energy Management of grid connected Distributed Generation
Figure 30: Single-line diagram of parallel operation of two VSCs
The state equations of the VSCs can be written in the form (72) as
pDQiDQrefiiii vCxByAy 111111 (73)
pDQiDQrefiiii vCxByAy 222222 (74)
Furthermore, the load current in D-Q component is given as
PQ
pD
L
L
LQ
LD
LL
LL
LQ
LD
v
v
L
L
i
i
LR
LR
i
i
dt
d
/10
0/1
(75)
Therefore defining a composite state vector as
LQLDTi
Ti
Tt iiyyx 21
We can combine (73)-(75) to form the overall state space equation of the system.
For this case, we assume that the PCC is a floating source, i.e., the voltage source vp in Figure 30 is absent and the two converters operate in parallel to share the load through droop characteristics. We consider the angle droop based on the active power and a voltage magnitude droop based on reactive power as given in (4). We shall also assume that these are filtered by the lowpass filters given in (30).
Since the PCC is not connected to an infinite bus, we have to eliminate the vector vpDQ from the state equation. From (75), we can write
LQ
LD
LL
LLL
LQ
LDL
PQ
pD
i
i
LR
LRL
i
i
dt
dL
v
v
(76)
Again, using Kirchoff’s current law (KCL) at PCC, we get
QfQfLQDfDfLD iiiiii 2121 and
(77)
Let us now define a new set of state vectors that contain only the state equations of the two converters. This is given by
Ti
Ti
Tc yyx 21

52
INTELLIGENT GRID RESEARCH CLUSTER
Operation Control and Energy Management of grid connected Distributed Generation
We can then express (88) in terms of the above state vector and its derivative as
cPcPPQ
pDxBxA
v
v
(78)
where the matrices Ap and Bp both have dimensions (2×8) and are computed from (76) and (77). From (73), (74) and (78), the model for the autonomous operation of the two VSCs is derived as
cPcPi
icrefDQ
i
ic
i
ic xBxA
C
Cx
B
Bx
A
Ax
2
1
264
641
244
441
0
0
0
0
(79)
The above equation can be regrouped to form the state space equations for the autonomous operation of the VSCs as
crefDQcccc xBxAx (80)
where
Pi
i AC
CIE
2
18
,
P
i
i
i
ic B
C
C
A
AEA
2
1
244
4411
0
0,
264
6411
0
0
i
ic
B
BEB
Since the system response obtained by the mathematical model closely matches that of the PSCAD simulation, the VSC model developed in the previous sections can be used to find an autonomous small signal model of the system discussed in the previous section. To facilitate this, we must eliminate the reference vector from (80).
From (30), (32) and (33), we can write
fqcdfdcqc
ece
fqcqfdcdc
ece
ivivQQ
ivivPP
2
3
2
3
(81)
Linearizing the above equations around an operating point, we obtain
dqfqfqcdcqfdfdcqc
ece
cqfqfqcqcdfdfdcdc
ece
viivviivQQ
viivviivPP
0000
0000
2
3
2
3
(82)
where the suffix defines a perturbed quantity and subscript 0 signifies the nominal values.
Defining a vector of active and reactive powers as
Teeeepq QPQPx 2211
equation (82) can be written as
cpqpqpqpq xBxAx (83)
Where Apq = diag (c c c c) and Bpq can be derived from (94).

53
INTELLIGENT GRID RESEARCH CLUSTER
Operation Control and Energy Management of grid connected Distributed Generation
We now replace the reference quantities by Pe and Qe. To do that, we first linearize the droop
equations as given in (38). Also transforming (69) into the common reference frame, we get
cmcQref
cDref
Vv
v 0
cossin
sincos
Linearizing the above equation and substituting (38), we get
e
e
cm
cmo
cQref
cDref
Q
P
nmV
nmV
v
v
000
00
cossin
sincos
(84)
In a similar way, we find the references for the capacitor current are given as
e
e
cQref
cDref
Q
P
i
i
0201
0201
sincos
cossin
(85)
here 1 = mCfVcm0 and 2 = nCf. Finally replacing Pref and Qref by Pe and Qe respectively in (71),
we get the linearized expressions for the injected currents as
e
e
cmfQref
fDref
Q
P
Vi
i
2221
1211
0
1
(86)
here
0022
0000021
0012
0000011
sin32
coscossin32
cos32
sincossin32
fQ
ee
fD
ee
ni
mQmP
ni
mPmQ
We can then write the reference vector in (80) as
pqccrefDQ xMx
(87)
where the elements of Mc are obtained from (84)-(86). Combing (80), (84) and (87), we get a homogeneous state space description of the complete system as
pq
c
pqpq
ccc
pq
c
x
x
AB
MBA
x
x
(88)
This homogenous model can now be used for eigenvalue analysis.
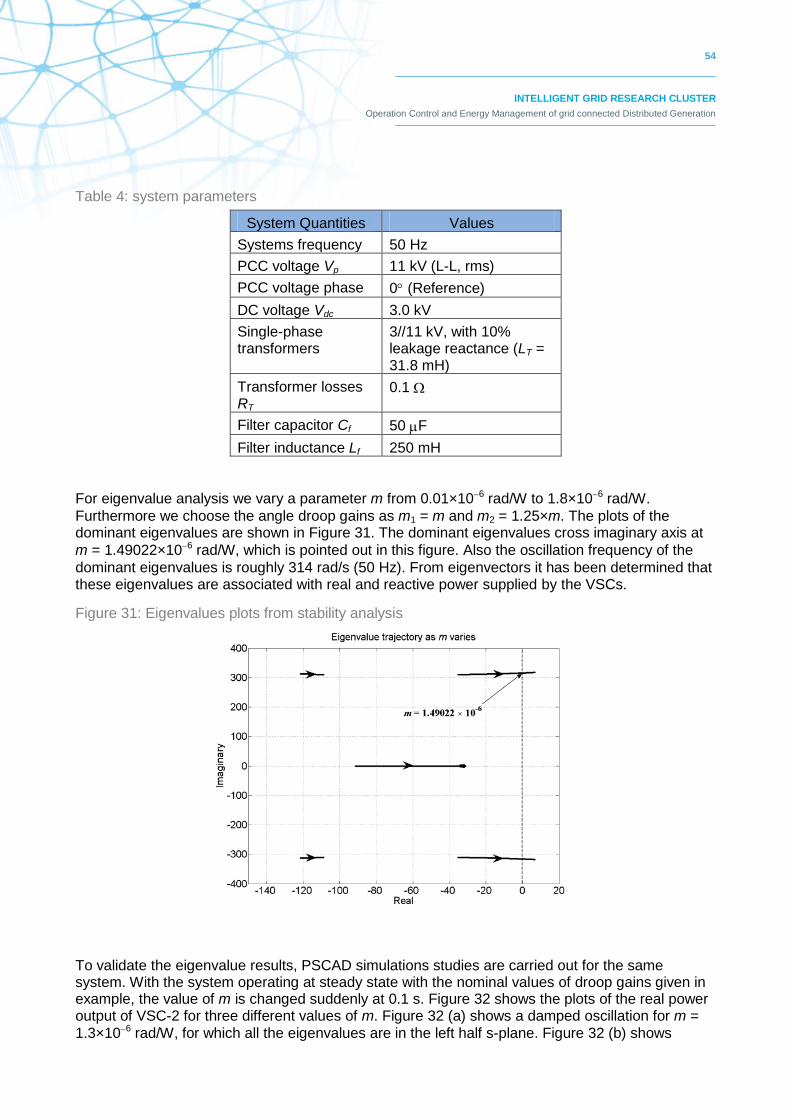
54
INTELLIGENT GRID RESEARCH CLUSTER
Operation Control and Energy Management of grid connected Distributed Generation
Table 4: system parameters
System Quantities Values
Systems frequency 50 Hz
PCC voltage Vp 11 kV (L-L, rms)
PCC voltage phase 0 (Reference)
DC voltage Vdc 3.0 kV
Single-phase transformers
3//11 kV, with 10% leakage reactance (LT = 31.8 mH)
Transformer losses RT
0.1
Filter capacitor Cf 50 F
Filter inductance Lf 250 mH
For eigenvalue analysis we vary a parameter m from 0.01×10⁶ rad/W to 1.8×10⁶ rad/W.
Furthermore we choose the angle droop gains as m1 = m and m2 = 1.25×m. The plots of the dominant eigenvalues are shown in Figure 31. The dominant eigenvalues cross imaginary axis at
m = 1.49022×10⁶ rad/W, which is pointed out in this figure. Also the oscillation frequency of the
dominant eigenvalues is roughly 314 rad/s (50 Hz). From eigenvectors it has been determined that these eigenvalues are associated with real and reactive power supplied by the VSCs.
Figure 31: Eigenvalues plots from stability analysis
To validate the eigenvalue results, PSCAD simulations studies are carried out for the same system. With the system operating at steady state with the nominal values of droop gains given in example, the value of m is changed suddenly at 0.1 s. Figure 32 shows the plots of the real power output of VSC-2 for three different values of m. Figure 32 (a) shows a damped oscillation for m =
1.3×10⁶ rad/W, for which all the eigenvalues are in the left half s-plane. Figure 32 (b) shows
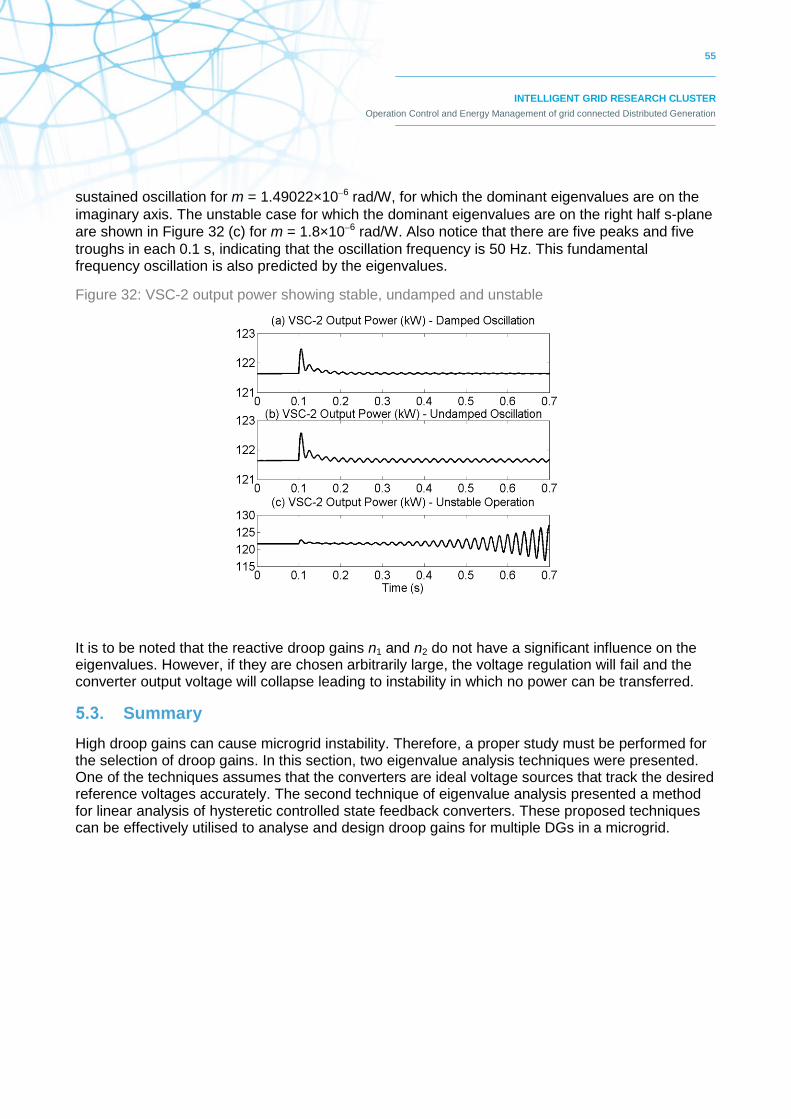
55
INTELLIGENT GRID RESEARCH CLUSTER
Operation Control and Energy Management of grid connected Distributed Generation
sustained oscillation for m = 1.49022×10⁶ rad/W, for which the dominant eigenvalues are on the
imaginary axis. The unstable case for which the dominant eigenvalues are on the right half s-plane
are shown in Figure 32 (c) for m = 1.8×10⁶ rad/W. Also notice that there are five peaks and five
troughs in each 0.1 s, indicating that the oscillation frequency is 50 Hz. This fundamental frequency oscillation is also predicted by the eigenvalues.
Figure 32: VSC-2 output power showing stable, undamped and unstable
It is to be noted that the reactive droop gains n1 and n2 do not have a significant influence on the eigenvalues. However, if they are chosen arbitrarily large, the voltage regulation will fail and the converter output voltage will collapse leading to instability in which no power can be transferred.
5.3. Summary
High droop gains can cause microgrid instability. Therefore, a proper study must be performed for the selection of droop gains. In this section, two eigenvalue analysis techniques were presented. One of the techniques assumes that the converters are ideal voltage sources that track the desired reference voltages accurately. The second technique of eigenvalue analysis presented a method for linear analysis of hysteretic controlled state feedback converters. These proposed techniques can be effectively utilised to analyse and design droop gains for multiple DGs in a microgrid.
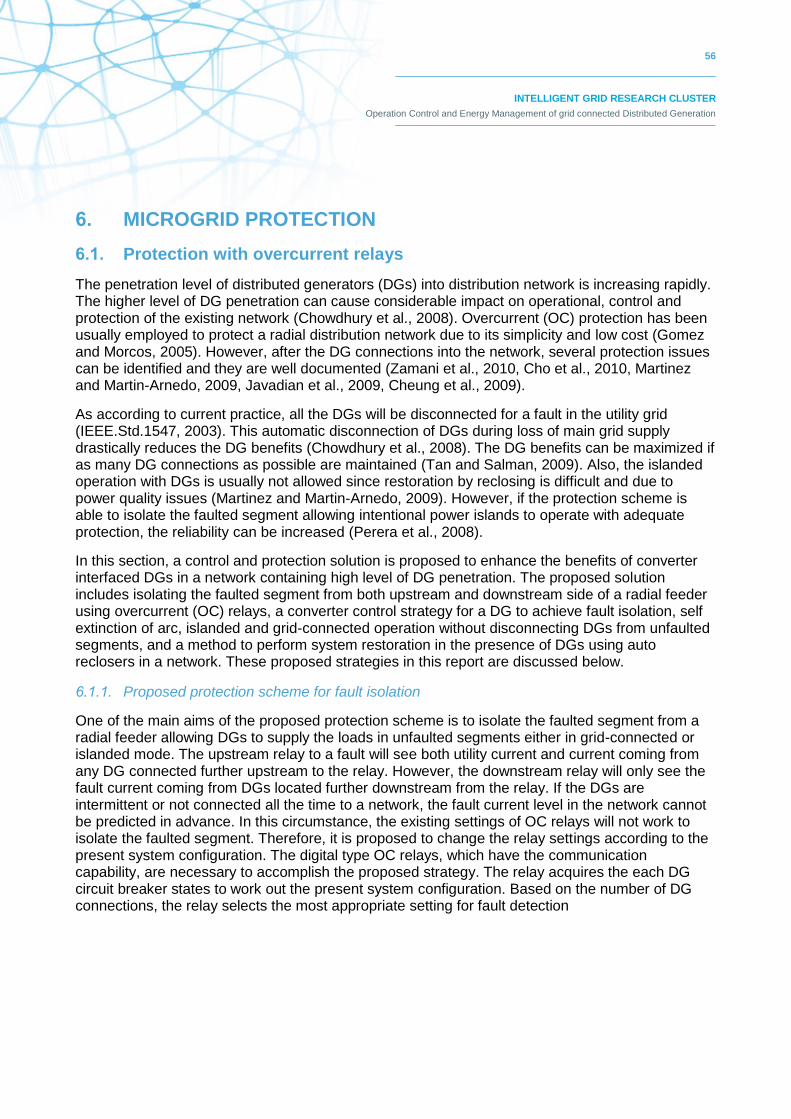
56
INTELLIGENT GRID RESEARCH CLUSTER
Operation Control and Energy Management of grid connected Distributed Generation
6. MICROGRID PROTECTION
6.1. Protection with overcurrent relays
The penetration level of distributed generators (DGs) into distribution network is increasing rapidly. The higher level of DG penetration can cause considerable impact on operational, control and protection of the existing network (Chowdhury et al., 2008). Overcurrent (OC) protection has been usually employed to protect a radial distribution network due to its simplicity and low cost (Gomez and Morcos, 2005). However, after the DG connections into the network, several protection issues can be identified and they are well documented (Zamani et al., 2010, Cho et al., 2010, Martinez and Martin-Arnedo, 2009, Javadian et al., 2009, Cheung et al., 2009).
As according to current practice, all the DGs will be disconnected for a fault in the utility grid (IEEE.Std.1547, 2003). This automatic disconnection of DGs during loss of main grid supply drastically reduces the DG benefits (Chowdhury et al., 2008). The DG benefits can be maximized if as many DG connections as possible are maintained (Tan and Salman, 2009). Also, the islanded operation with DGs is usually not allowed since restoration by reclosing is difficult and due to power quality issues (Martinez and Martin-Arnedo, 2009). However, if the protection scheme is able to isolate the faulted segment allowing intentional power islands to operate with adequate protection, the reliability can be increased (Perera et al., 2008).
In this section, a control and protection solution is proposed to enhance the benefits of converter interfaced DGs in a network containing high level of DG penetration. The proposed solution includes isolating the faulted segment from both upstream and downstream side of a radial feeder using overcurrent (OC) relays, a converter control strategy for a DG to achieve fault isolation, self extinction of arc, islanded and grid-connected operation without disconnecting DGs from unfaulted segments, and a method to perform system restoration in the presence of DGs using auto reclosers in a network. These proposed strategies in this report are discussed below.
6.1.1. Proposed protection scheme for fault isolation
One of the main aims of the proposed protection scheme is to isolate the faulted segment from a radial feeder allowing DGs to supply the loads in unfaulted segments either in grid-connected or islanded mode. The upstream relay to a fault will see both utility current and current coming from any DG connected further upstream to the relay. However, the downstream relay will only see the fault current coming from DGs located further downstream from the relay. If the DGs are intermittent or not connected all the time to a network, the fault current level in the network cannot be predicted in advance. In this circumstance, the existing settings of OC relays will not work to isolate the faulted segment. Therefore, it is proposed to change the relay settings according to the present system configuration. The digital type OC relays, which have the communication capability, are necessary to accomplish the proposed strategy. The relay acquires the each DG circuit breaker states to work out the present system configuration. Based on the number of DG connections, the relay selects the most appropriate setting for fault detection
57
INTELLIGENT GRID RESEARCH CLUSTER
Operation Control and Energy Management of grid connected Distributed Generation
6.1.2. Proposed converter control strategy for a DG
A control strategy for a voltage source converter (VSC) is proposed based on the fold back current control characteristic to help in successful fault isolation and fast system restoration with converter interfaced DGs. During a fault in the network, the VSC control maintains a sufficient fault current level for a defined time period. This results in effective fault detection by OC relays which are located downstream from the fault point. Also, the VSC control helps to self extinction of an arc fault without disconnecting the DG from a network. Moreover, the system restoration and coordination between network reclosers and DGs are achieved with the aid of proposed VSC control strategy. The VSC operates either in current control or voltage control mode. The proposed VSC control for a converter interfaced DG is explained below.
6.1.3. A. During grid connected and islanded operation
In grid connected mode, the VSC operates in current control mode injecting rated power. The converter injects current in phase with the point of connection (PC) voltage to supply only real power to the utility grid. On the other hand, in islanded mode, the VSC operates in voltage control mode maintaining the standard voltage and frequency in the islanded section while sharing both real and reactive power requirements of the loads.
6.1.4. B. During a fault
A fault can occur when the DGs are operating either in grid connected or islanded mode. In both cases, each VSC limits its output current to twice the rated current and operates in current control mode. The VSC identifies a faulted condition by monitoring the PC voltage. The PC voltage reduces during a fault and this change of voltage triggers to apply the limit to the output current. The VSC maintains the current limiting for a defined time period (tcc), if the fault exists. The time period (tcc) allows OC relays which are located downstream from the fault to detect and isolate the fault. This time period (tcc) can be adjusted depending on the relay characteristics selected. Also, the maximum allowable time given in IEEE 1547 (IEEE.Std.1547, 2003) to disconnect a DG during a low voltage condition can be considered when selecting the tcc. The VSC can recover if the fault is cleared before tcc elapses depending on the system configuration exists after the fault isolation.
If the DG is still connected to the faulted segment after the time period tcc, the VSC folds back the output current to a very small value for another defined time period tsm. The operating mode of VSC in current control mode during this time is called as sleep mode. During the sleep mode, the DG injects a small current without disconnecting from the network. The sleep mode operation of VSC results in self extinction of any temporary arc fault which is not cleared by relays successfully during the time tcc. Therefore the sleep mode operation enables the arc extinction without DG disconnection. The sleep mode time duration can be set based on the arc deionization time which can be calculated using the equation given in (Kaur and Vaziri, 2006).
The behaviour of a VSC during a fault is shown in Figure 33 assuming the fault is not cleared by protective relays. The VSC injects the current (Io) in pre-fault mode. The fault occurs at point A. The VSC limits the output current to twice the rated current for the time period of tcc as shown in the figure. The VSC then rapidly reduces its output current to a very small value given by nIr where n is a small number and remains in the sleep mode for the time period of tsm. The restoration process starts after this period and it is explained in the next sub-section.
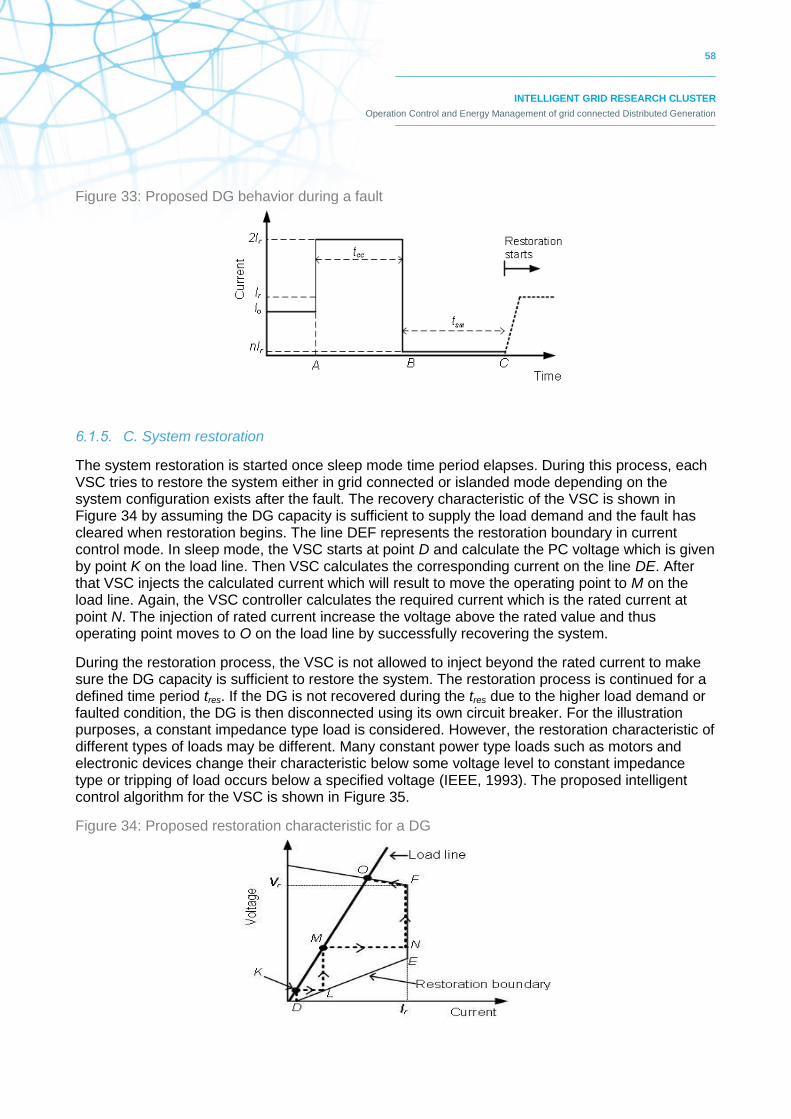
58
INTELLIGENT GRID RESEARCH CLUSTER
Operation Control and Energy Management of grid connected Distributed Generation
Figure 33: Proposed DG behavior during a fault
6.1.5. C. System restoration
The system restoration is started once sleep mode time period elapses. During this process, each VSC tries to restore the system either in grid connected or islanded mode depending on the system configuration exists after the fault. The recovery characteristic of the VSC is shown in Figure 34 by assuming the DG capacity is sufficient to supply the load demand and the fault has cleared when restoration begins. The line DEF represents the restoration boundary in current control mode. In sleep mode, the VSC starts at point D and calculate the PC voltage which is given by point K on the load line. Then VSC calculates the corresponding current on the line DE. After that VSC injects the calculated current which will result to move the operating point to M on the load line. Again, the VSC controller calculates the required current which is the rated current at point N. The injection of rated current increase the voltage above the rated value and thus operating point moves to O on the load line by successfully recovering the system.
During the restoration process, the VSC is not allowed to inject beyond the rated current to make sure the DG capacity is sufficient to restore the system. The restoration process is continued for a defined time period tres. If the DG is not recovered during the tres due to the higher load demand or faulted condition, the DG is then disconnected using its own circuit breaker. For the illustration purposes, a constant impedance type load is considered. However, the restoration characteristic of different types of loads may be different. Many constant power type loads such as motors and electronic devices change their characteristic below some voltage level to constant impedance type or tripping of load occurs below a specified voltage (IEEE, 1993). The proposed intelligent control algorithm for the VSC is shown in Figure 35.
Figure 34: Proposed restoration characteristic for a DG
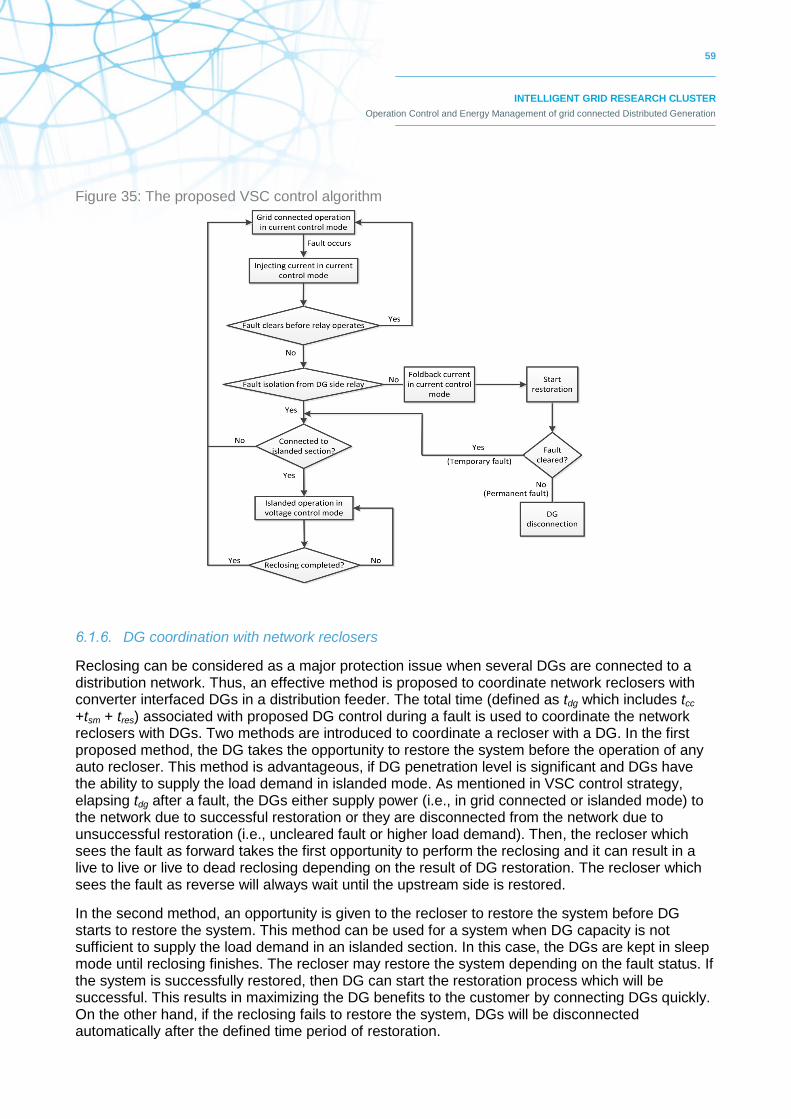
59
INTELLIGENT GRID RESEARCH CLUSTER
Operation Control and Energy Management of grid connected Distributed Generation
Figure 35: The proposed VSC control algorithm
6.1.6. DG coordination with network reclosers
Reclosing can be considered as a major protection issue when several DGs are connected to a distribution network. Thus, an effective method is proposed to coordinate network reclosers with converter interfaced DGs in a distribution feeder. The total time (defined as tdg which includes tcc +tsm + tres) associated with proposed DG control during a fault is used to coordinate the network reclosers with DGs. Two methods are introduced to coordinate a recloser with a DG. In the first proposed method, the DG takes the opportunity to restore the system before the operation of any auto recloser. This method is advantageous, if DG penetration level is significant and DGs have the ability to supply the load demand in islanded mode. As mentioned in VSC control strategy, elapsing tdg after a fault, the DGs either supply power (i.e., in grid connected or islanded mode) to the network due to successful restoration or they are disconnected from the network due to unsuccessful restoration (i.e., uncleared fault or higher load demand). Then, the recloser which sees the fault as forward takes the first opportunity to perform the reclosing and it can result in a live to live or live to dead reclosing depending on the result of DG restoration. The recloser which sees the fault as reverse will always wait until the upstream side is restored.
In the second method, an opportunity is given to the recloser to restore the system before DG starts to restore the system. This method can be used for a system when DG capacity is not sufficient to supply the load demand in an islanded section. In this case, the DGs are kept in sleep mode until reclosing finishes. The recloser may restore the system depending on the fault status. If the system is successfully restored, then DG can start the restoration process which will be successful. This results in maximizing the DG benefits to the customer by connecting DGs quickly. On the other hand, if the reclosing fails to restore the system, DGs will be disconnected automatically after the defined time period of restoration.
60
INTELLIGENT GRID RESEARCH CLUSTER
Operation Control and Energy Management of grid connected Distributed Generation
A synchronism check element is used in each recloser to make sure whether two sides of a breaker is in exact synchronism when performing the live to live reclosing. The DGs maintained the original phases since they are not disconnected during a fault. Also, they maintain the standard voltage and frequency during the operation in islanded mode. However, there may be a slight phase angle mismatch due to frequency deviations in grid side. In that case, the recloser waits until phase angle on the both side becomes closer to join the two systems. However, the DG itself has the protection to withstand for contingency conditions and it is discussed in next section.
6.1.7. DG protection
It is important to consider the consequences of out of phase reclosing when DGs are not disconnected during the auto recloser open time. The risk of DG damage due to the out of phase reclosing is lower, if DG is connected through a converter (Kumpulainen and Kauhaniemi, 2004a). In the proposed reclosing scheme, the recloser is capable of checking the synchronization which ensures there is no phase mismatch when it performs live to live reclosing.
From the point of DG protection, the DG should be protected itself. To achieve basic DG protection requirements, in the proposed method, a DG is employed with several protective elements: fold back current control, reverse power flow, over voltage and synchronism check. The proposed current limiting and fold back current control protect the DG from excessive current injection and unsuccessful system restoration. The reverse power flow protection is activated to trip the DG when current flows towards the DG. The over voltage element responds, when the terminal voltage of the DG rises above a predefined limit. However, under voltage protection is incorporated with the proposed fold back current control since DG is allowed to operate under the rated voltage in current control mode for a defined time interval. The synchronism check element ensures a trouble free connection to the feeder when it is being reconnected after any disconnection. These protection schemes will minimise the DG safety risks associated with reclosing.
6.1.8. The need of communication for the protection
To achieve the proposed protection and control strategies, communication between relays and each DG controller is required. The each DG operates in voltage control mode in grid connected operation while current control mode is selected in islanded operation. Each relay-breaker status is available for all the DGs to determine the mode of operations (i.e. either grid connected or islanded).
Also, each DG circuit breaker status is available for all the relays in the feeder. The proposed protection scheme is employed to isolate the faulted segment from both the upstream and downstream side of a fault. In this study, the converter interfaced DGs are only considered and they are intermittent and limiting output currents during a fault. Therefore the fault current level changes depending on the DG connections and the fault current seen by downstream relay is low. Under this circumstance, isolating the faulted segment using the existing OC relays will be difficult. Thus the OC relay settings are changed with the aid of communication according to the number of DG connections.
In the case of communication failure, each relay selects its default setting which has been set during the initial relay settings. Also, the DGs switch into current control mode assuming they are connected to grid connected mode. However, if they are not connected to grid, they can sense that the standard voltage and frequency are not within the defined limits which will lead to disconnect all the DGs from the network.
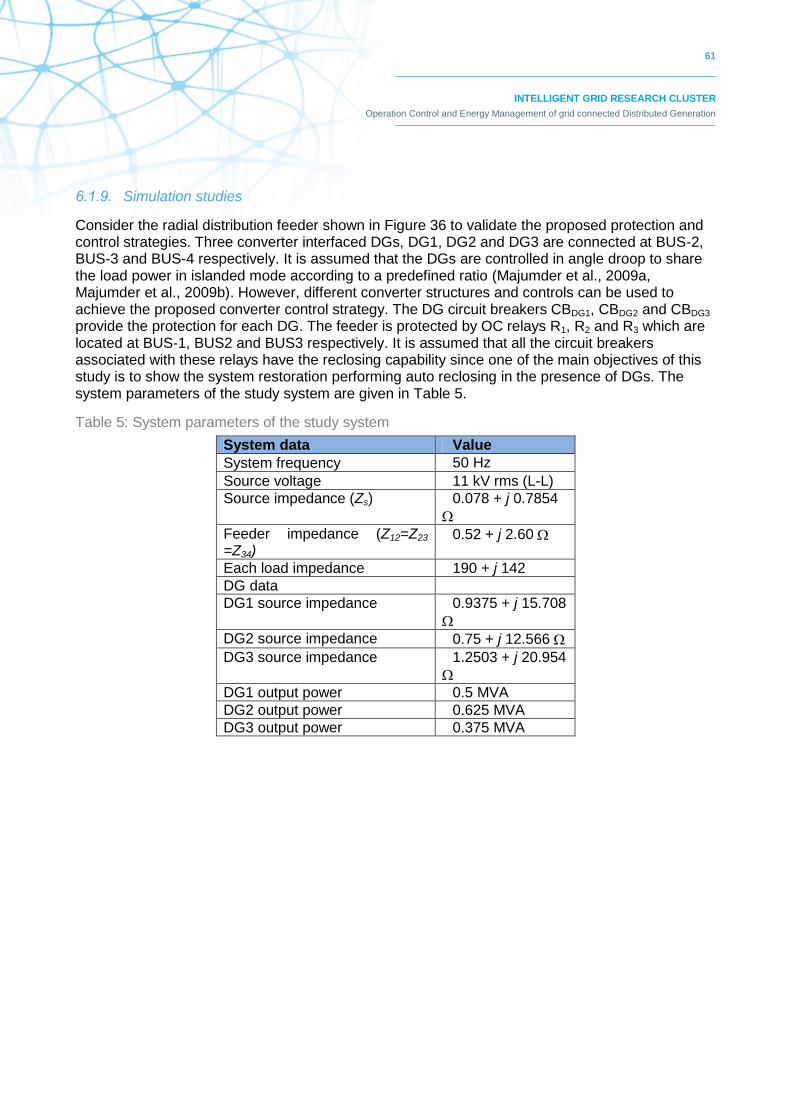
61
INTELLIGENT GRID RESEARCH CLUSTER
Operation Control and Energy Management of grid connected Distributed Generation
6.1.9. Simulation studies
Consider the radial distribution feeder shown in Figure 36 to validate the proposed protection and control strategies. Three converter interfaced DGs, DG1, DG2 and DG3 are connected at BUS-2, BUS-3 and BUS-4 respectively. It is assumed that the DGs are controlled in angle droop to share the load power in islanded mode according to a predefined ratio (Majumder et al., 2009a, Majumder et al., 2009b). However, different converter structures and controls can be used to achieve the proposed converter control strategy. The DG circuit breakers CBDG1, CBDG2 and CBDG3 provide the protection for each DG. The feeder is protected by OC relays R1, R2 and R3 which are located at BUS-1, BUS2 and BUS3 respectively. It is assumed that all the circuit breakers associated with these relays have the reclosing capability since one of the main objectives of this study is to show the system restoration performing auto reclosing in the presence of DGs. The system parameters of the study system are given in Table 5.
Table 5: System parameters of the study system
System data Value
System frequency 50 Hz
Source voltage 11 kV rms (L-L)
Source impedance (Zs) 0.078 + j 0.7854
Feeder impedance (Z12=Z23 =Z34)
0.52 + j 2.60
Each load impedance 190 + j 142
DG data
DG1 source impedance 0.9375 + j 15.708
DG2 source impedance 0.75 + j 12.566
DG3 source impedance 1.2503 + j 20.954
DG1 output power 0.5 MVA
DG2 output power 0.625 MVA
DG3 output power 0.375 MVA
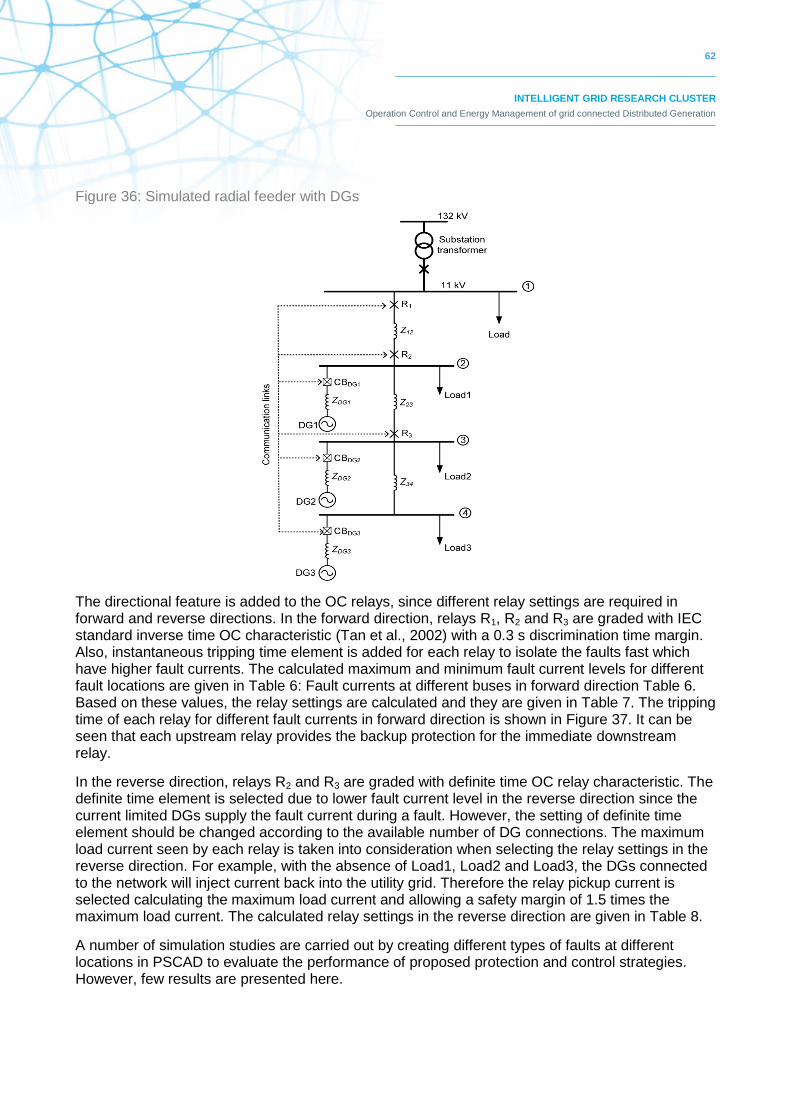
62
INTELLIGENT GRID RESEARCH CLUSTER
Operation Control and Energy Management of grid connected Distributed Generation
Figure 36: Simulated radial feeder with DGs
The directional feature is added to the OC relays, since different relay settings are required in forward and reverse directions. In the forward direction, relays R1, R2 and R3 are graded with IEC standard inverse time OC characteristic (Tan et al., 2002) with a 0.3 s discrimination time margin. Also, instantaneous tripping time element is added for each relay to isolate the faults fast which have higher fault currents. The calculated maximum and minimum fault current levels for different fault locations are given in Table 6: Fault currents at different buses in forward direction Table 6. Based on these values, the relay settings are calculated and they are given in Table 7. The tripping time of each relay for different fault currents in forward direction is shown in Figure 37. It can be seen that each upstream relay provides the backup protection for the immediate downstream relay.
In the reverse direction, relays R2 and R3 are graded with definite time OC relay characteristic. The definite time element is selected due to lower fault current level in the reverse direction since the current limited DGs supply the fault current during a fault. However, the setting of definite time element should be changed according to the available number of DG connections. The maximum load current seen by each relay is taken into consideration when selecting the relay settings in the reverse direction. For example, with the absence of Load1, Load2 and Load3, the DGs connected to the network will inject current back into the utility grid. Therefore the relay pickup current is selected calculating the maximum load current and allowing a safety margin of 1.5 times the maximum load current. The calculated relay settings in the reverse direction are given in Table 8.
A number of simulation studies are carried out by creating different types of faults at different locations in PSCAD to evaluate the performance of proposed protection and control strategies. However, few results are presented here.
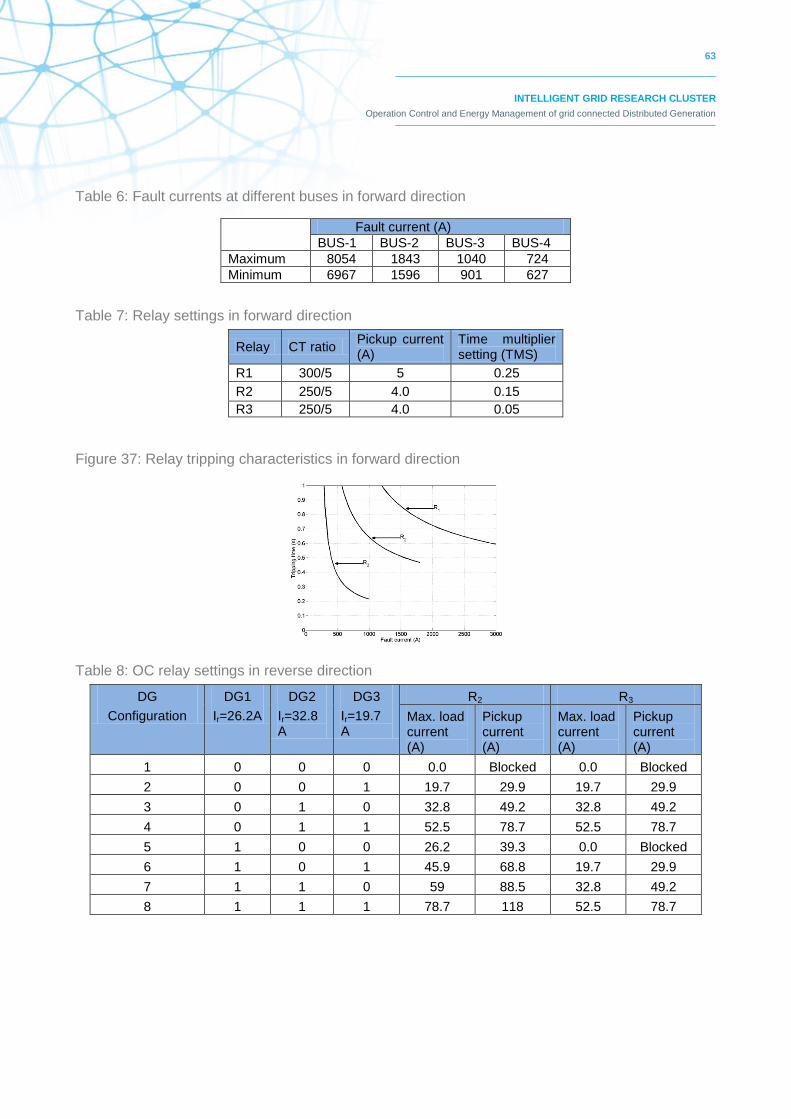
63
INTELLIGENT GRID RESEARCH CLUSTER
Operation Control and Energy Management of grid connected Distributed Generation
Table 6: Fault currents at different buses in forward direction
Table 7: Relay settings in forward direction
Relay CT ratio Pickup current (A)
Time multiplier setting (TMS)
R1 300/5 5 0.25
R2 250/5 4.0 0.15
R3 250/5 4.0 0.05
Figure 37: Relay tripping characteristics in forward direction
Table 8: OC relay settings in reverse direction
DG
Configuration
DG1
Ir=26.2A
DG2
Ir=32.8A
DG3
Ir=19.7 A
R2 R3
Max. load current (A)
Pickup current (A)
Max. load current (A)
Pickup current (A)
1 0 0 0 0.0 Blocked 0.0 Blocked
2 0 0 1 19.7 29.9 19.7 29.9
3 0 1 0 32.8 49.2 32.8 49.2
4 0 1 1 52.5 78.7 52.5 78.7
5 1 0 0 26.2 39.3 0.0 Blocked
6 1 0 1 45.9 68.8 19.7 29.9
7 1 1 0 59 88.5 32.8 49.2
8 1 1 1 78.7 118 52.5 78.7
Fault current (A)
BUS-1 BUS-2 BUS-3 BUS-4
Maximum 8054 1843 1040 724
Minimum 6967 1596 901 627
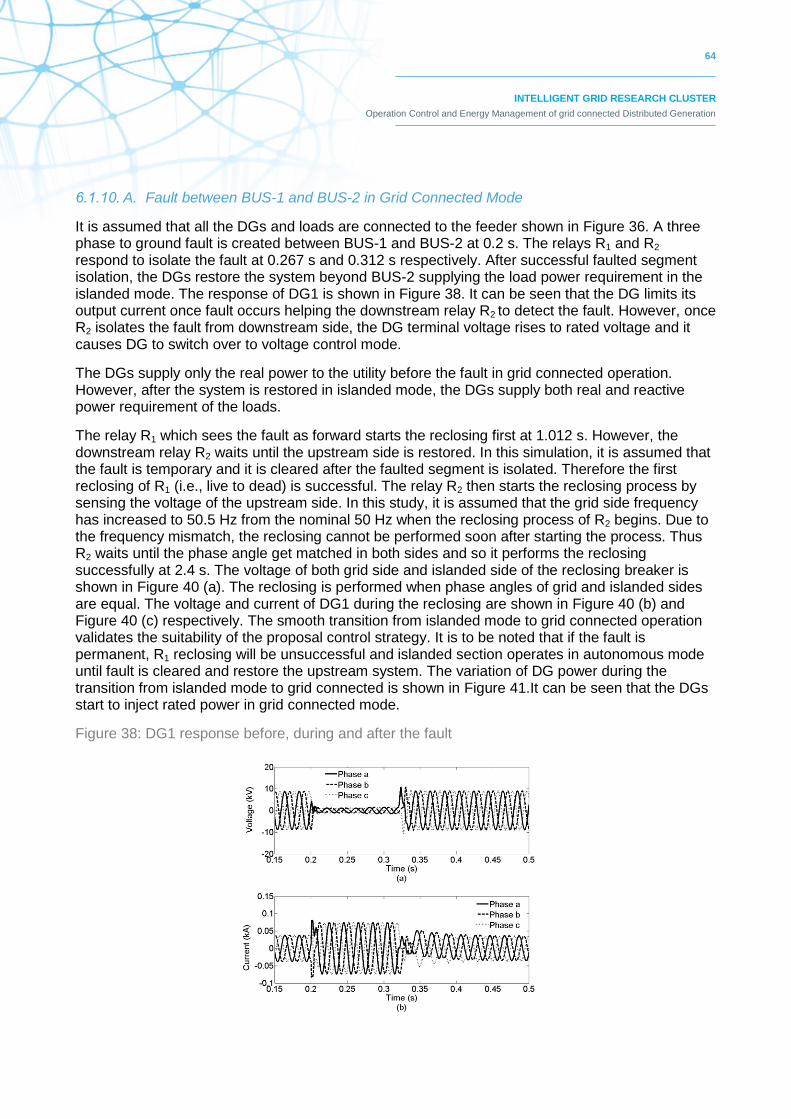
64
INTELLIGENT GRID RESEARCH CLUSTER
Operation Control and Energy Management of grid connected Distributed Generation
6.1.10. A. Fault between BUS-1 and BUS-2 in Grid Connected Mode
It is assumed that all the DGs and loads are connected to the feeder shown in Figure 36. A three phase to ground fault is created between BUS-1 and BUS-2 at 0.2 s. The relays R1 and R2 respond to isolate the fault at 0.267 s and 0.312 s respectively. After successful faulted segment isolation, the DGs restore the system beyond BUS-2 supplying the load power requirement in the islanded mode. The response of DG1 is shown in Figure 38. It can be seen that the DG limits its output current once fault occurs helping the downstream relay R2 to detect the fault. However, once R2 isolates the fault from downstream side, the DG terminal voltage rises to rated voltage and it causes DG to switch over to voltage control mode.
The DGs supply only the real power to the utility before the fault in grid connected operation. However, after the system is restored in islanded mode, the DGs supply both real and reactive power requirement of the loads.
The relay R1 which sees the fault as forward starts the reclosing first at 1.012 s. However, the downstream relay R2 waits until the upstream side is restored. In this simulation, it is assumed that the fault is temporary and it is cleared after the faulted segment is isolated. Therefore the first reclosing of R1 (i.e., live to dead) is successful. The relay R2 then starts the reclosing process by sensing the voltage of the upstream side. In this study, it is assumed that the grid side frequency has increased to 50.5 Hz from the nominal 50 Hz when the reclosing process of R2 begins. Due to the frequency mismatch, the reclosing cannot be performed soon after starting the process. Thus R2 waits until the phase angle get matched in both sides and so it performs the reclosing successfully at 2.4 s. The voltage of both grid side and islanded side of the reclosing breaker is shown in Figure 40 (a). The reclosing is performed when phase angles of grid and islanded sides are equal. The voltage and current of DG1 during the reclosing are shown in Figure 40 (b) and Figure 40 (c) respectively. The smooth transition from islanded mode to grid connected operation validates the suitability of the proposal control strategy. It is to be noted that if the fault is permanent, R1 reclosing will be unsuccessful and islanded section operates in autonomous mode until fault is cleared and restore the upstream system. The variation of DG power during the transition from islanded mode to grid connected is shown in Figure 41.It can be seen that the DGs start to inject rated power in grid connected mode.
Figure 38: DG1 response before, during and after the fault
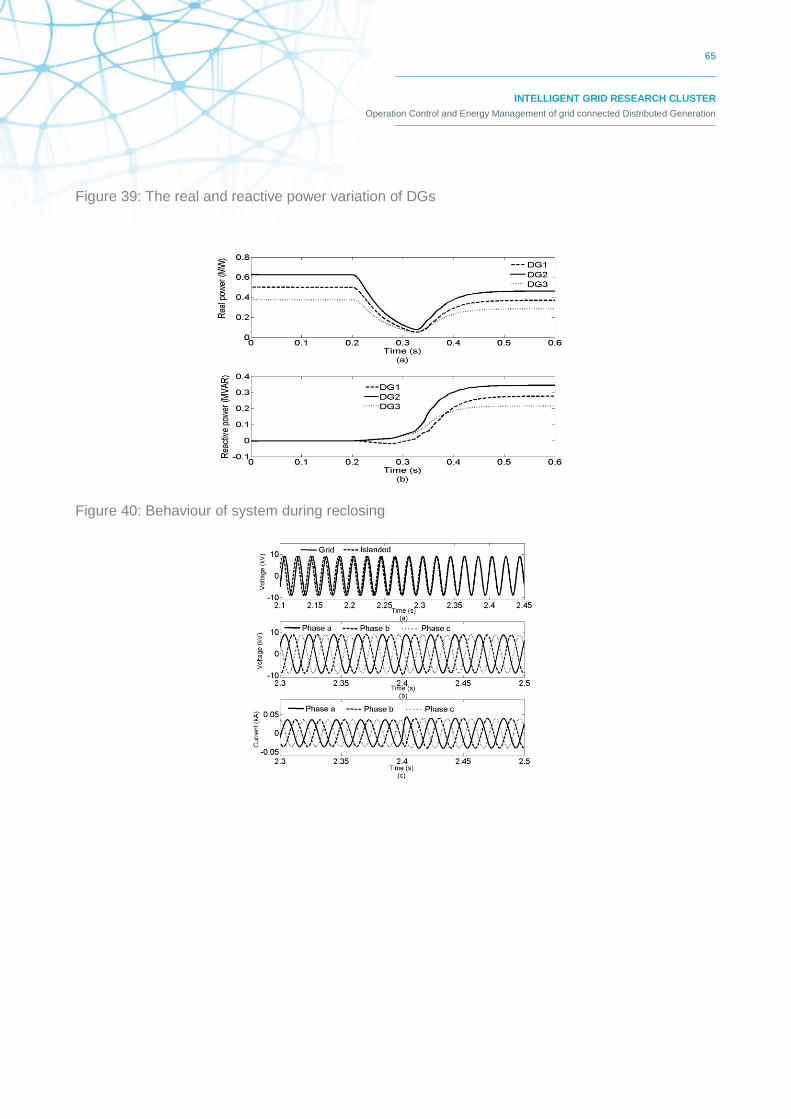
65
INTELLIGENT GRID RESEARCH CLUSTER
Operation Control and Energy Management of grid connected Distributed Generation
Figure 39: The real and reactive power variation of DGs
Figure 40: Behaviour of system during reclosing
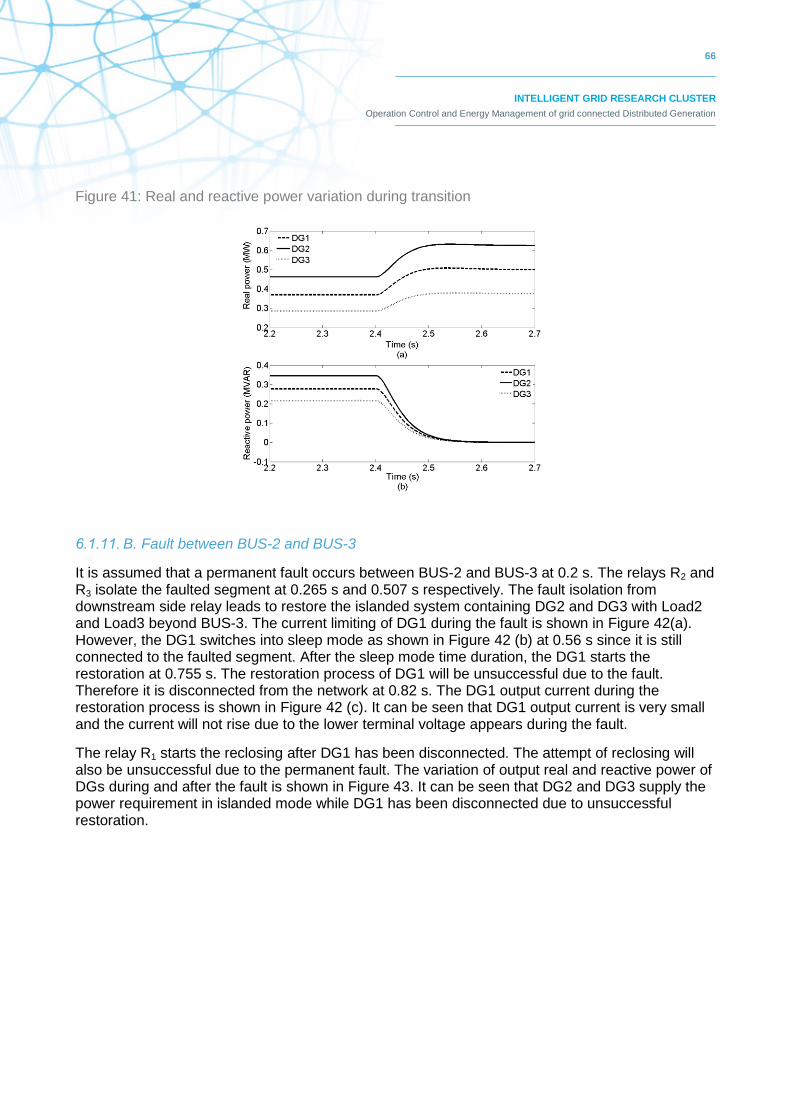
66
INTELLIGENT GRID RESEARCH CLUSTER
Operation Control and Energy Management of grid connected Distributed Generation
Figure 41: Real and reactive power variation during transition
6.1.11. B. Fault between BUS-2 and BUS-3
It is assumed that a permanent fault occurs between BUS-2 and BUS-3 at 0.2 s. The relays R2 and R3 isolate the faulted segment at 0.265 s and 0.507 s respectively. The fault isolation from downstream side relay leads to restore the islanded system containing DG2 and DG3 with Load2 and Load3 beyond BUS-3. The current limiting of DG1 during the fault is shown in Figure 42(a). However, the DG1 switches into sleep mode as shown in Figure 42 (b) at 0.56 s since it is still connected to the faulted segment. After the sleep mode time duration, the DG1 starts the restoration at 0.755 s. The restoration process of DG1 will be unsuccessful due to the fault. Therefore it is disconnected from the network at 0.82 s. The DG1 output current during the restoration process is shown in Figure 42 (c). It can be seen that DG1 output current is very small and the current will not rise due to the lower terminal voltage appears during the fault.
The relay R1 starts the reclosing after DG1 has been disconnected. The attempt of reclosing will also be unsuccessful due to the permanent fault. The variation of output real and reactive power of DGs during and after the fault is shown in Figure 43. It can be seen that DG2 and DG3 supply the power requirement in islanded mode while DG1 has been disconnected due to unsuccessful restoration.
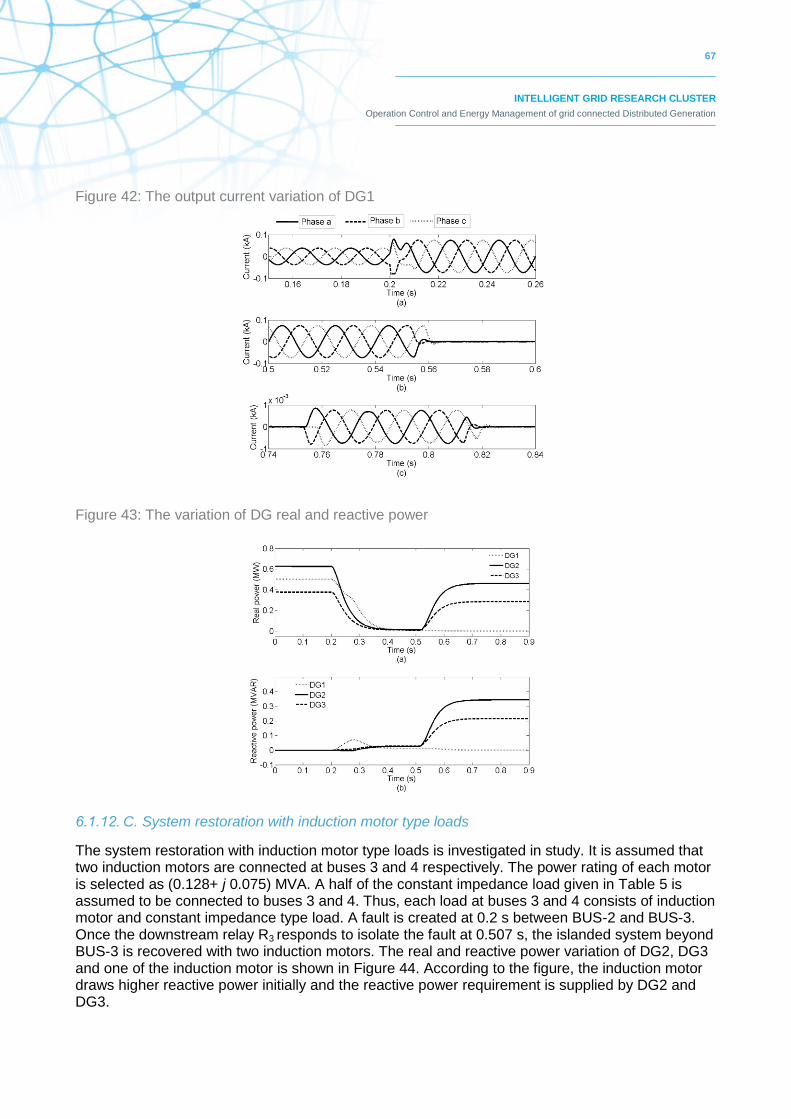
67
INTELLIGENT GRID RESEARCH CLUSTER
Operation Control and Energy Management of grid connected Distributed Generation
Figure 42: The output current variation of DG1
Figure 43: The variation of DG real and reactive power
6.1.12. C. System restoration with induction motor type loads
The system restoration with induction motor type loads is investigated in study. It is assumed that two induction motors are connected at buses 3 and 4 respectively. The power rating of each motor is selected as (0.128+ j 0.075) MVA. A half of the constant impedance load given in Table 5 is assumed to be connected to buses 3 and 4. Thus, each load at buses 3 and 4 consists of induction motor and constant impedance type load. A fault is created at 0.2 s between BUS-2 and BUS-3. Once the downstream relay R3 responds to isolate the fault at 0.507 s, the islanded system beyond BUS-3 is recovered with two induction motors. The real and reactive power variation of DG2, DG3 and one of the induction motor is shown in Figure 44. According to the figure, the induction motor draws higher reactive power initially and the reactive power requirement is supplied by DG2 and DG3.
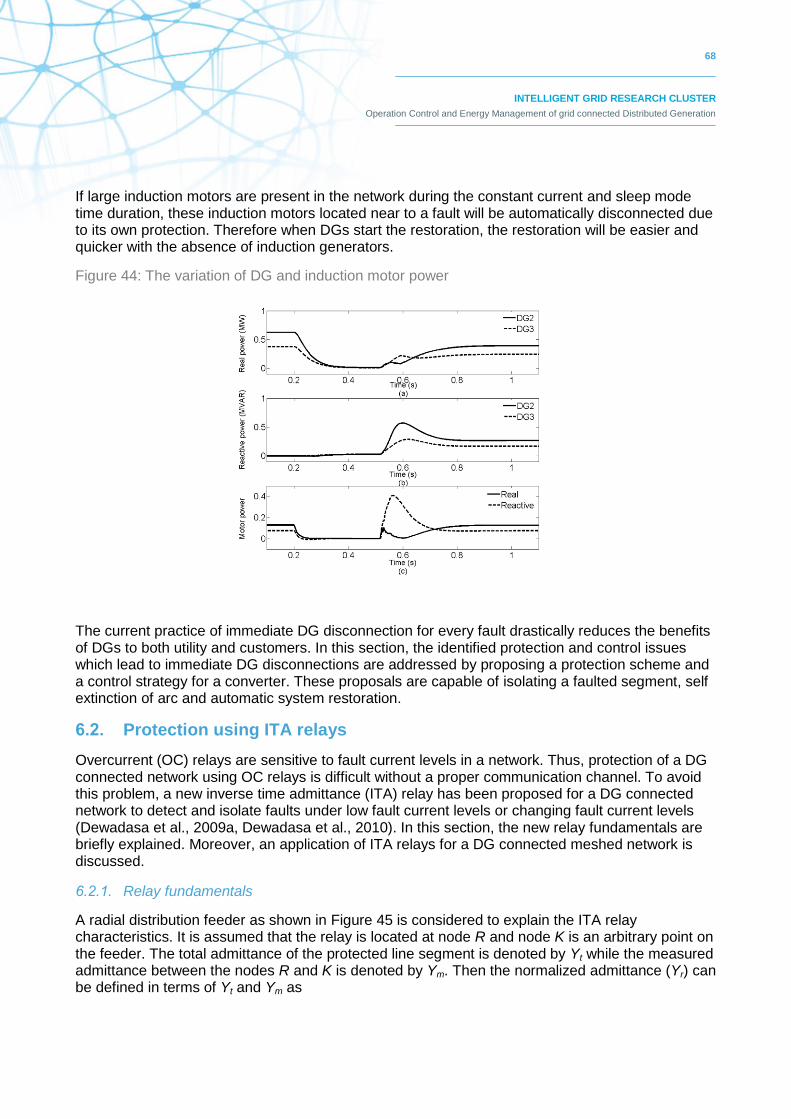
68
INTELLIGENT GRID RESEARCH CLUSTER
Operation Control and Energy Management of grid connected Distributed Generation
If large induction motors are present in the network during the constant current and sleep mode time duration, these induction motors located near to a fault will be automatically disconnected due to its own protection. Therefore when DGs start the restoration, the restoration will be easier and quicker with the absence of induction generators.
Figure 44: The variation of DG and induction motor power
The current practice of immediate DG disconnection for every fault drastically reduces the benefits of DGs to both utility and customers. In this section, the identified protection and control issues which lead to immediate DG disconnections are addressed by proposing a protection scheme and a control strategy for a converter. These proposals are capable of isolating a faulted segment, self extinction of arc and automatic system restoration.
6.2. Protection using ITA relays
Overcurrent (OC) relays are sensitive to fault current levels in a network. Thus, protection of a DG connected network using OC relays is difficult without a proper communication channel. To avoid this problem, a new inverse time admittance (ITA) relay has been proposed for a DG connected network to detect and isolate faults under low fault current levels or changing fault current levels (Dewadasa et al., 2009a, Dewadasa et al., 2010). In this section, the new relay fundamentals are briefly explained. Moreover, an application of ITA relays for a DG connected meshed network is discussed.
6.2.1. Relay fundamentals
A radial distribution feeder as shown in Figure 45 is considered to explain the ITA relay characteristics. It is assumed that the relay is located at node R and node K is an arbitrary point on the feeder. The total admittance of the protected line segment is denoted by Yt while the measured admittance between the nodes R and K is denoted by Ym. Then the normalized admittance (Yr) can be defined in terms of Yt and Ym as
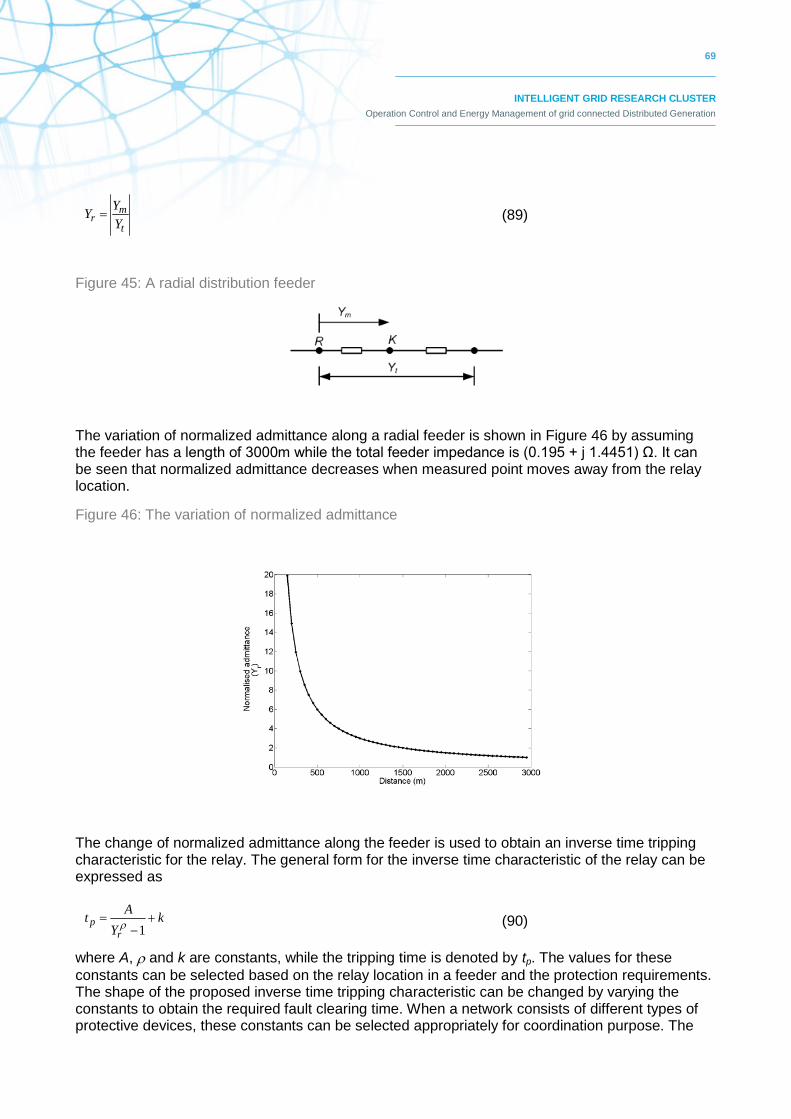
69
INTELLIGENT GRID RESEARCH CLUSTER
Operation Control and Energy Management of grid connected Distributed Generation
t
mr
Y
YY
(89)
Figure 45: A radial distribution feeder
The variation of normalized admittance along a radial feeder is shown in Figure 46 by assuming the feeder has a length of 3000m while the total feeder impedance is (0.195 + j 1.4451) Ω. It can be seen that normalized admittance decreases when measured point moves away from the relay location.
Figure 46: The variation of normalized admittance
The change of normalized admittance along the feeder is used to obtain an inverse time tripping characteristic for the relay. The general form for the inverse time characteristic of the relay can be expressed as
kY
At
r
p
1
(90)
where A, and k are constants, while the tripping time is denoted by tp. The values for these
constants can be selected based on the relay location in a feeder and the protection requirements. The shape of the proposed inverse time tripping characteristic can be changed by varying the constants to obtain the required fault clearing time. When a network consists of different types of protective devices, these constants can be selected appropriately for coordination purpose. The
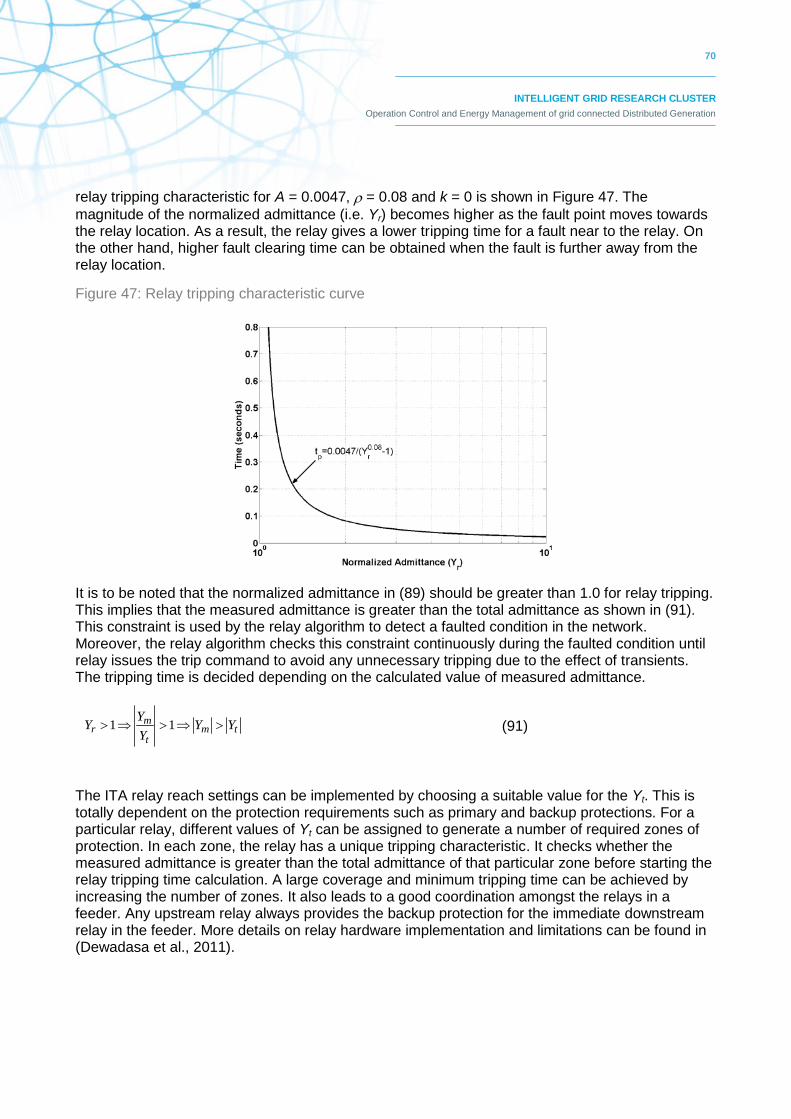
70
INTELLIGENT GRID RESEARCH CLUSTER
Operation Control and Energy Management of grid connected Distributed Generation
relay tripping characteristic for A = 0.0047, = 0.08 and k = 0 is shown in Figure 47. The
magnitude of the normalized admittance (i.e. Yr) becomes higher as the fault point moves towards the relay location. As a result, the relay gives a lower tripping time for a fault near to the relay. On the other hand, higher fault clearing time can be obtained when the fault is further away from the relay location.
Figure 47: Relay tripping characteristic curve
It is to be noted that the normalized admittance in (89) should be greater than 1.0 for relay tripping. This implies that the measured admittance is greater than the total admittance as shown in (91). This constraint is used by the relay algorithm to detect a faulted condition in the network. Moreover, the relay algorithm checks this constraint continuously during the faulted condition until relay issues the trip command to avoid any unnecessary tripping due to the effect of transients. The tripping time is decided depending on the calculated value of measured admittance.
tmt
mr YY
Y
YY 11
(91)
The ITA relay reach settings can be implemented by choosing a suitable value for the Yt. This is totally dependent on the protection requirements such as primary and backup protections. For a particular relay, different values of Yt can be assigned to generate a number of required zones of protection. In each zone, the relay has a unique tripping characteristic. It checks whether the measured admittance is greater than the total admittance of that particular zone before starting the relay tripping time calculation. A large coverage and minimum tripping time can be achieved by increasing the number of zones. It also leads to a good coordination amongst the relays in a feeder. Any upstream relay always provides the backup protection for the immediate downstream relay in the feeder. More details on relay hardware implementation and limitations can be found in (Dewadasa et al., 2011).
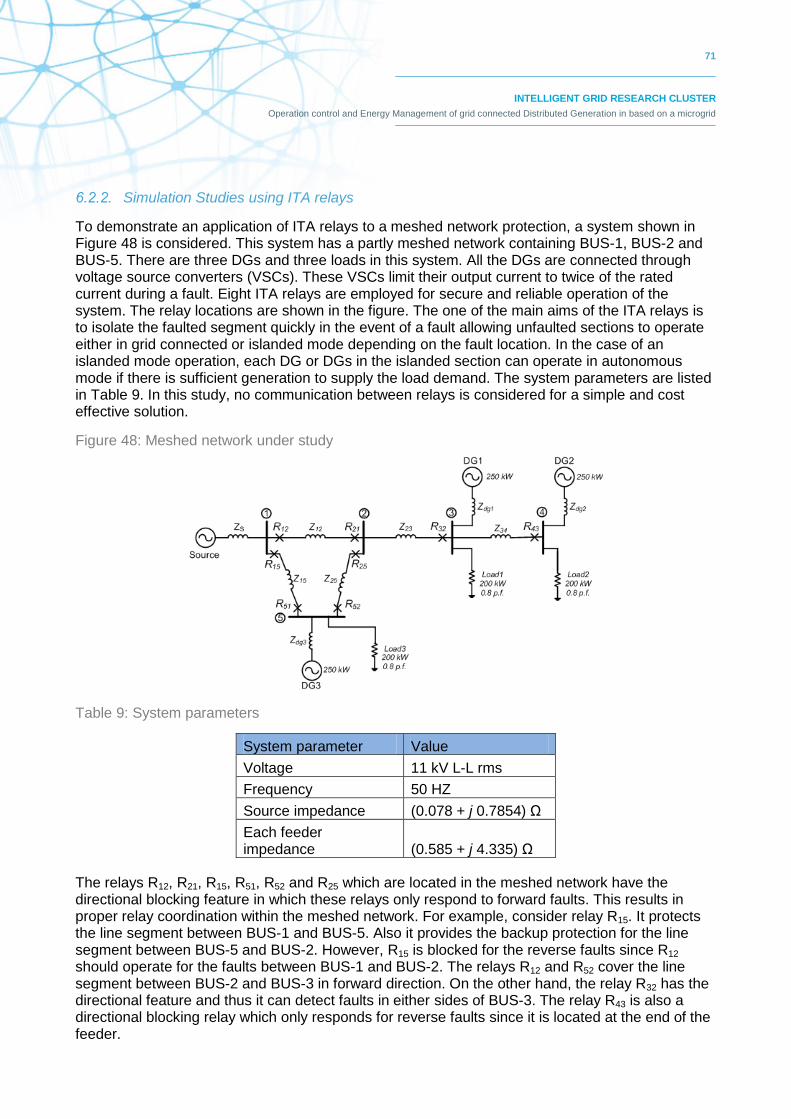
71
INTELLIGENT GRID RESEARCH CLUSTER
Operation control and Energy Management of grid connected Distributed Generation in based on a microgrid
6.2.2. Simulation Studies using ITA relays
To demonstrate an application of ITA relays to a meshed network protection, a system shown in Figure 48 is considered. This system has a partly meshed network containing BUS-1, BUS-2 and BUS-5. There are three DGs and three loads in this system. All the DGs are connected through voltage source converters (VSCs). These VSCs limit their output current to twice of the rated current during a fault. Eight ITA relays are employed for secure and reliable operation of the system. The relay locations are shown in the figure. The one of the main aims of the ITA relays is to isolate the faulted segment quickly in the event of a fault allowing unfaulted sections to operate either in grid connected or islanded mode depending on the fault location. In the case of an islanded mode operation, each DG or DGs in the islanded section can operate in autonomous mode if there is sufficient generation to supply the load demand. The system parameters are listed in Table 9. In this study, no communication between relays is considered for a simple and cost effective solution.
Figure 48: Meshed network under study
Table 9: System parameters
System parameter Value
Voltage 11 kV L-L rms
Frequency 50 HZ
Source impedance (0.078 + j 0.7854) Ω
Each feeder impedance (0.585 + j 4.335) Ω
The relays R12, R21, R15, R51, R52 and R25 which are located in the meshed network have the directional blocking feature in which these relays only respond to forward faults. This results in proper relay coordination within the meshed network. For example, consider relay R15. It protects the line segment between BUS-1 and BUS-5. Also it provides the backup protection for the line segment between BUS-5 and BUS-2. However, R15 is blocked for the reverse faults since R12 should operate for the faults between BUS-1 and BUS-2. The relays R12 and R52 cover the line segment between BUS-2 and BUS-3 in forward direction. On the other hand, the relay R32 has the directional feature and thus it can detect faults in either sides of BUS-3. The relay R43 is also a directional blocking relay which only responds for reverse faults since it is located at the end of the feeder.
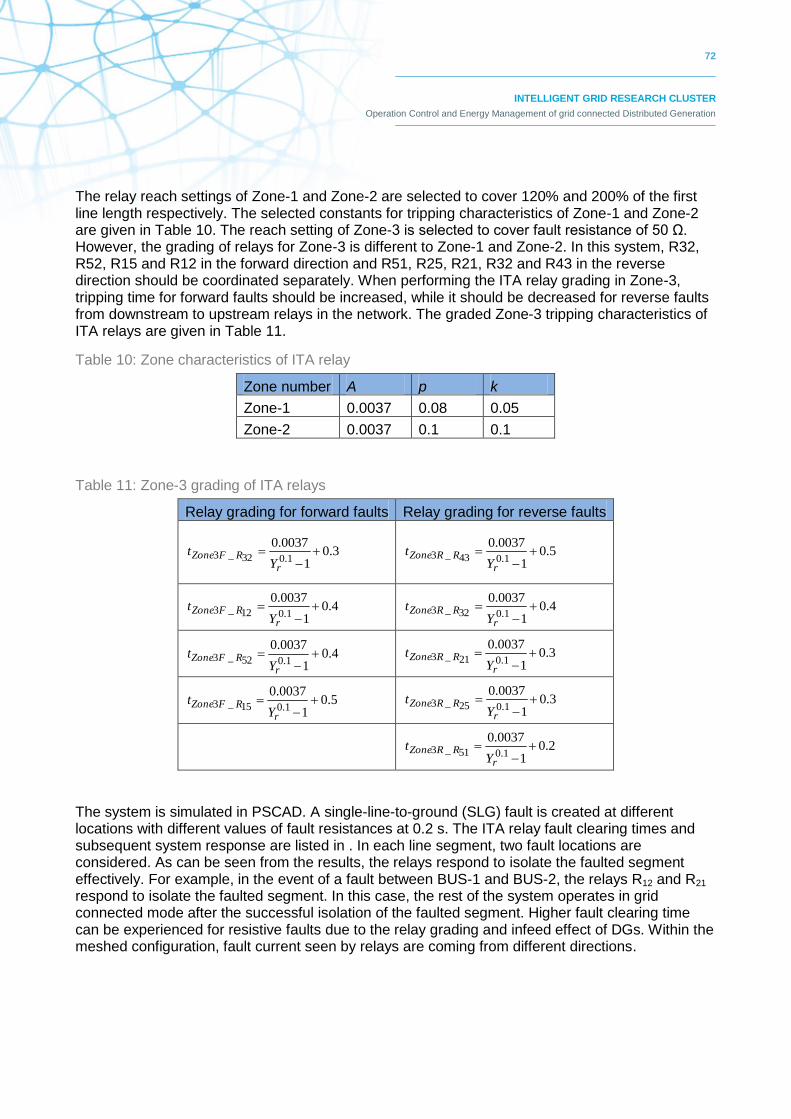
72
INTELLIGENT GRID RESEARCH CLUSTER
Operation Control and Energy Management of grid connected Distributed Generation
The relay reach settings of Zone-1 and Zone-2 are selected to cover 120% and 200% of the first line length respectively. The selected constants for tripping characteristics of Zone-1 and Zone-2 are given in Table 10. The reach setting of Zone-3 is selected to cover fault resistance of 50 Ω. However, the grading of relays for Zone-3 is different to Zone-1 and Zone-2. In this system, R32, R52, R15 and R12 in the forward direction and R51, R25, R21, R32 and R43 in the reverse direction should be coordinated separately. When performing the ITA relay grading in Zone-3, tripping time for forward faults should be increased, while it should be decreased for reverse faults from downstream to upstream relays in the network. The graded Zone-3 tripping characteristics of ITA relays are given in Table 11.
Table 10: Zone characteristics of ITA relay
Zone number A p k
Zone-1 0.0037 0.08 0.05
Zone-2 0.0037 0.1 0.1
Table 11: Zone-3 grading of ITA relays
Relay grading for forward faults Relay grading for reverse faults
3.01
0037.0
1.032_3
r
RFZoneY
t
5.0
1
0037.0
1.043_3
r
RRZoneY
t
4.01
0037.0
1.012_3
r
RFZoneY
t
4.0
1
0037.0
1.032_3
r
RRZoneY
t
4.01
0037.01.052_3
r
RFZoneY
t
3.0
1
0037.0
1.021_3
r
RRZoneY
t
5.01
0037.01.015_3
r
RFZoneY
t
3.0
1
0037.0
1.025_3
r
RRZoneY
t
2.01
0037.0
1.051_3
r
RRZoneY
t
The system is simulated in PSCAD. A single-line-to-ground (SLG) fault is created at different locations with different values of fault resistances at 0.2 s. The ITA relay fault clearing times and subsequent system response are listed in . In each line segment, two fault locations are considered. As can be seen from the results, the relays respond to isolate the faulted segment effectively. For example, in the event of a fault between BUS-1 and BUS-2, the relays R12 and R21 respond to isolate the faulted segment. In this case, the rest of the system operates in grid connected mode after the successful isolation of the faulted segment. Higher fault clearing time can be experienced for resistive faults due to the relay grading and infeed effect of DGs. Within the meshed configuration, fault current seen by relays are coming from different directions.
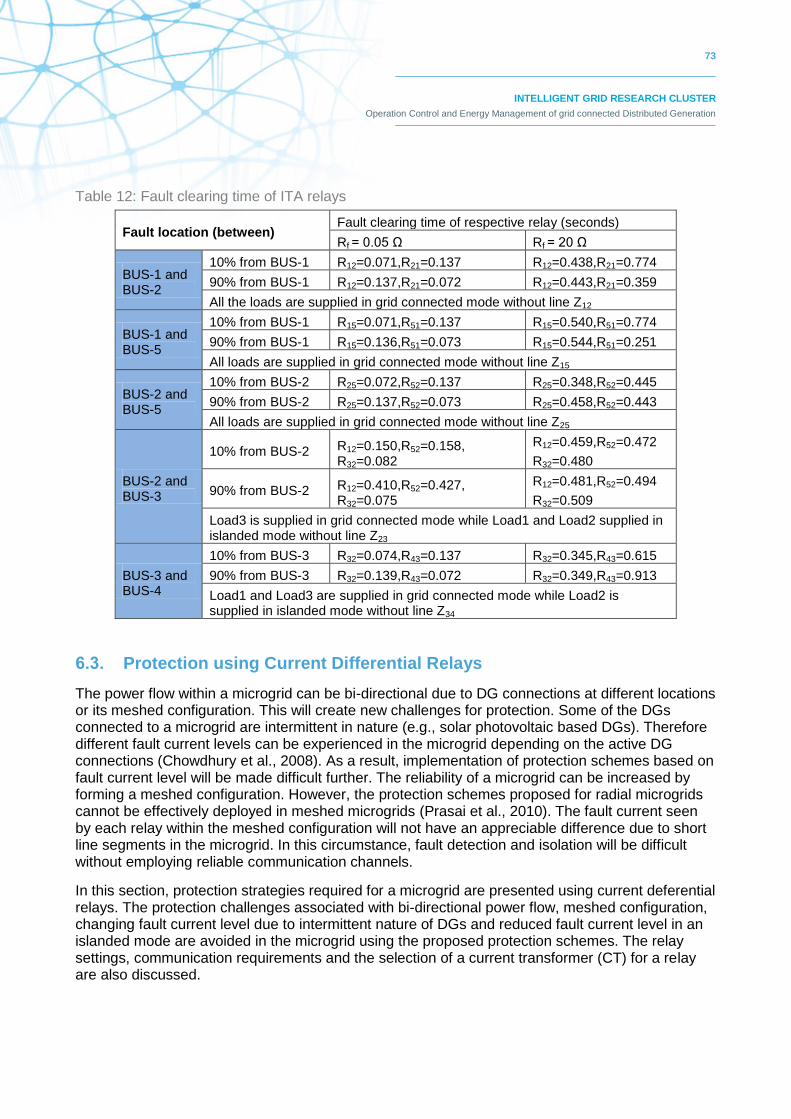
73
INTELLIGENT GRID RESEARCH CLUSTER
Operation Control and Energy Management of grid connected Distributed Generation
Table 12: Fault clearing time of ITA relays
Fault location (between) Fault clearing time of respective relay (seconds)
Rf = 0.05 Ω Rf = 20 Ω
BUS-1 and BUS-2
10% from BUS-1 R12=0.071,R21=0.137 R12=0.438,R21=0.774
90% from BUS-1 R12=0.137,R21=0.072 R12=0.443,R21=0.359
All the loads are supplied in grid connected mode without line Z12
BUS-1 and BUS-5
10% from BUS-1 R15=0.071,R51=0.137 R15=0.540,R51=0.774
90% from BUS-1 R15=0.136,R51=0.073 R15=0.544,R51=0.251
All loads are supplied in grid connected mode without line Z15
BUS-2 and BUS-5
10% from BUS-2 R25=0.072,R52=0.137 R25=0.348,R52=0.445
90% from BUS-2 R25=0.137,R52=0.073 R25=0.458,R52=0.443
All loads are supplied in grid connected mode without line Z25
BUS-2 and BUS-3
10% from BUS-2 R12=0.150,R52=0.158, R32=0.082
R12=0.459,R52=0.472
R32=0.480
90% from BUS-2 R12=0.410,R52=0.427, R32=0.075
R12=0.481,R52=0.494
R32=0.509
Load3 is supplied in grid connected mode while Load1 and Load2 supplied in islanded mode without line Z23
BUS-3 and BUS-4
10% from BUS-3 R32=0.074,R43=0.137 R32=0.345,R43=0.615
90% from BUS-3 R32=0.139,R43=0.072 R32=0.349,R43=0.913
Load1 and Load3 are supplied in grid connected mode while Load2 is supplied in islanded mode without line Z34
6.3. Protection using Current Differential Relays
The power flow within a microgrid can be bi-directional due to DG connections at different locations or its meshed configuration. This will create new challenges for protection. Some of the DGs connected to a microgrid are intermittent in nature (e.g., solar photovoltaic based DGs). Therefore different fault current levels can be experienced in the microgrid depending on the active DG connections (Chowdhury et al., 2008). As a result, implementation of protection schemes based on fault current level will be made difficult further. The reliability of a microgrid can be increased by forming a meshed configuration. However, the protection schemes proposed for radial microgrids cannot be effectively deployed in meshed microgrids (Prasai et al., 2010). The fault current seen by each relay within the meshed configuration will not have an appreciable difference due to short line segments in the microgrid. In this circumstance, fault detection and isolation will be difficult without employing reliable communication channels.
In this section, protection strategies required for a microgrid are presented using current deferential relays. The protection challenges associated with bi-directional power flow, meshed configuration, changing fault current level due to intermittent nature of DGs and reduced fault current level in an islanded mode are avoided in the microgrid using the proposed protection schemes. The relay settings, communication requirements and the selection of a current transformer (CT) for a relay are also discussed.
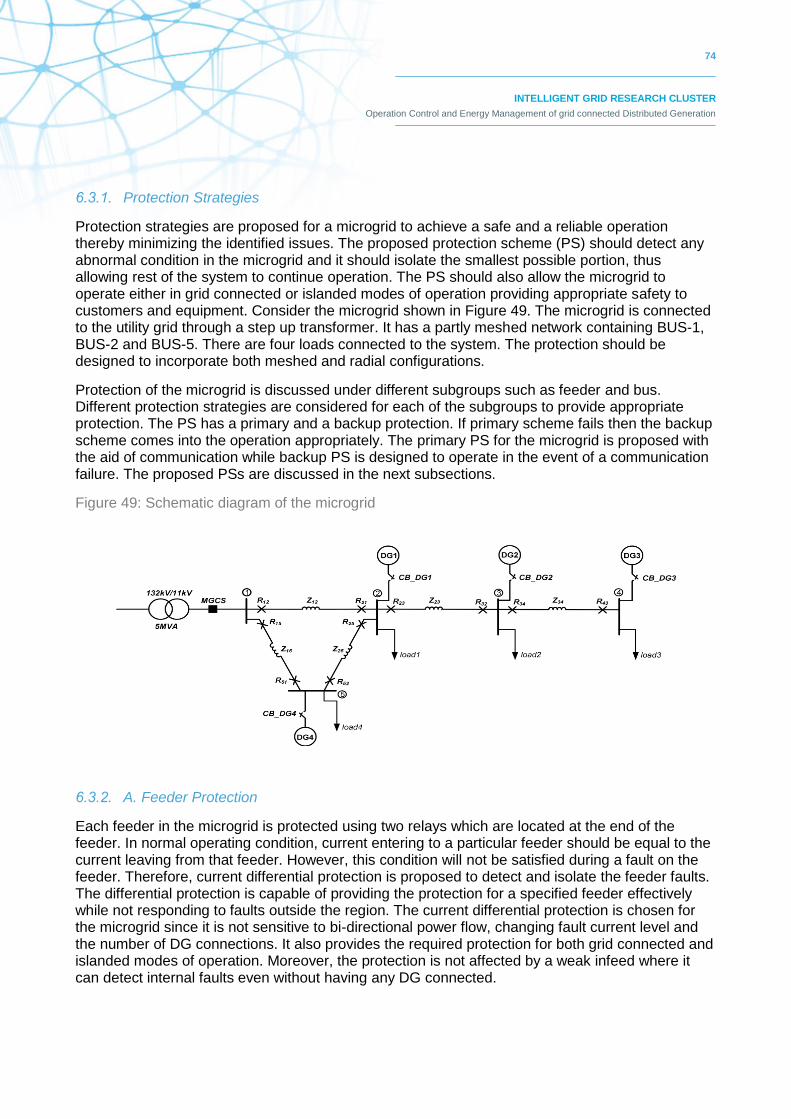
74
INTELLIGENT GRID RESEARCH CLUSTER
Operation Control and Energy Management of grid connected Distributed Generation
6.3.1. Protection Strategies
Protection strategies are proposed for a microgrid to achieve a safe and a reliable operation thereby minimizing the identified issues. The proposed protection scheme (PS) should detect any abnormal condition in the microgrid and it should isolate the smallest possible portion, thus allowing rest of the system to continue operation. The PS should also allow the microgrid to operate either in grid connected or islanded modes of operation providing appropriate safety to customers and equipment. Consider the microgrid shown in Figure 49. The microgrid is connected to the utility grid through a step up transformer. It has a partly meshed network containing BUS-1, BUS-2 and BUS-5. There are four loads connected to the system. The protection should be designed to incorporate both meshed and radial configurations.
Protection of the microgrid is discussed under different subgroups such as feeder and bus. Different protection strategies are considered for each of the subgroups to provide appropriate protection. The PS has a primary and a backup protection. If primary scheme fails then the backup scheme comes into the operation appropriately. The primary PS for the microgrid is proposed with the aid of communication while backup PS is designed to operate in the event of a communication failure. The proposed PSs are discussed in the next subsections.
Figure 49: Schematic diagram of the microgrid
6.3.2. A. Feeder Protection
Each feeder in the microgrid is protected using two relays which are located at the end of the feeder. In normal operating condition, current entering to a particular feeder should be equal to the current leaving from that feeder. However, this condition will not be satisfied during a fault on the feeder. Therefore, current differential protection is proposed to detect and isolate the feeder faults. The differential protection is capable of providing the protection for a specified feeder effectively while not responding to faults outside the region. The current differential protection is chosen for the microgrid since it is not sensitive to bi-directional power flow, changing fault current level and the number of DG connections. It also provides the required protection for both grid connected and islanded modes of operation. Moreover, the protection is not affected by a weak infeed where it can detect internal faults even without having any DG connected.
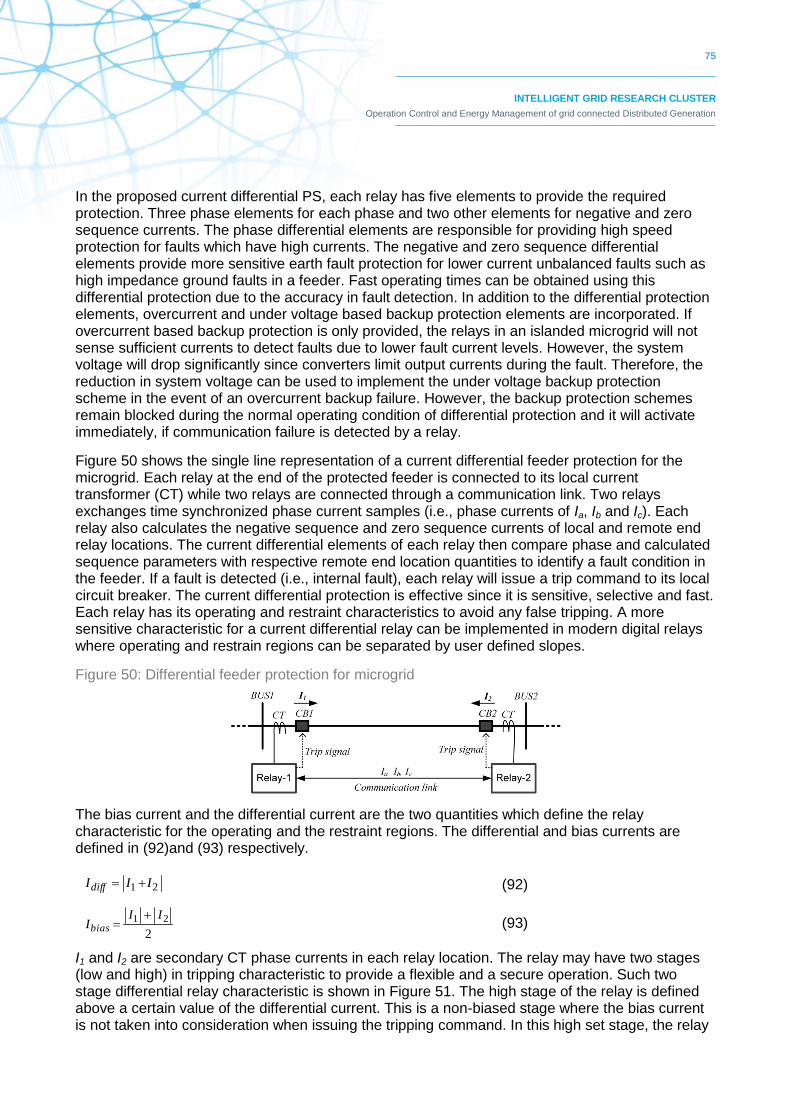
75
INTELLIGENT GRID RESEARCH CLUSTER
Operation Control and Energy Management of grid connected Distributed Generation
In the proposed current differential PS, each relay has five elements to provide the required protection. Three phase elements for each phase and two other elements for negative and zero sequence currents. The phase differential elements are responsible for providing high speed protection for faults which have high currents. The negative and zero sequence differential elements provide more sensitive earth fault protection for lower current unbalanced faults such as high impedance ground faults in a feeder. Fast operating times can be obtained using this differential protection due to the accuracy in fault detection. In addition to the differential protection elements, overcurrent and under voltage based backup protection elements are incorporated. If overcurrent based backup protection is only provided, the relays in an islanded microgrid will not sense sufficient currents to detect faults due to lower fault current levels. However, the system voltage will drop significantly since converters limit output currents during the fault. Therefore, the reduction in system voltage can be used to implement the under voltage backup protection scheme in the event of an overcurrent backup failure. However, the backup protection schemes remain blocked during the normal operating condition of differential protection and it will activate immediately, if communication failure is detected by a relay.
Figure 50 shows the single line representation of a current differential feeder protection for the microgrid. Each relay at the end of the protected feeder is connected to its local current transformer (CT) while two relays are connected through a communication link. Two relays exchanges time synchronized phase current samples (i.e., phase currents of Ia, Ib and Ic). Each relay also calculates the negative sequence and zero sequence currents of local and remote end relay locations. The current differential elements of each relay then compare phase and calculated sequence parameters with respective remote end location quantities to identify a fault condition in the feeder. If a fault is detected (i.e., internal fault), each relay will issue a trip command to its local circuit breaker. The current differential protection is effective since it is sensitive, selective and fast. Each relay has its operating and restraint characteristics to avoid any false tripping. A more sensitive characteristic for a current differential relay can be implemented in modern digital relays where operating and restrain regions can be separated by user defined slopes.
Figure 50: Differential feeder protection for microgrid
The bias current and the differential current are the two quantities which define the relay characteristic for the operating and the restraint regions. The differential and bias currents are defined in (92)and (93) respectively.
21 IIIdiff
(92)
2
21 IIIbias
(93)
I1 and I2 are secondary CT phase currents in each relay location. The relay may have two stages (low and high) in tripping characteristic to provide a flexible and a secure operation. Such two stage differential relay characteristic is shown in Figure 51. The high stage of the relay is defined above a certain value of the differential current. This is a non-biased stage where the bias current is not taken into consideration when issuing the tripping command. In this high set stage, the relay
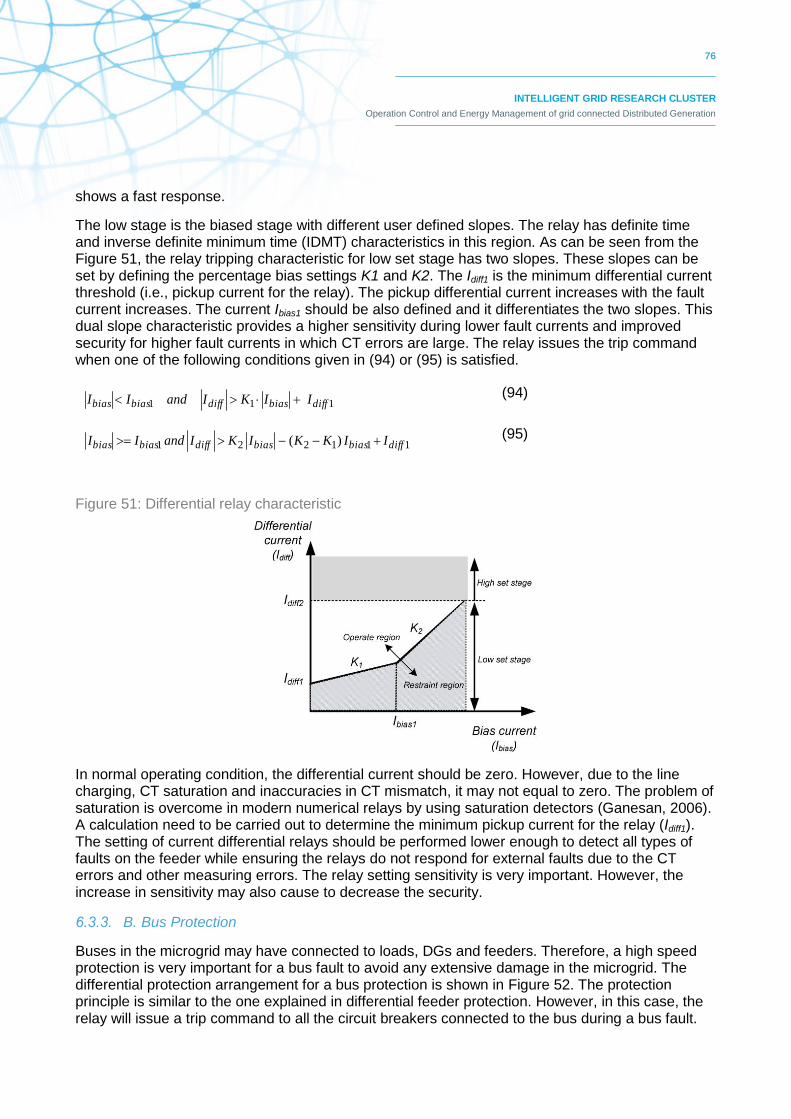
76
INTELLIGENT GRID RESEARCH CLUSTER
Operation Control and Energy Management of grid connected Distributed Generation
shows a fast response.
The low stage is the biased stage with different user defined slopes. The relay has definite time and inverse definite minimum time (IDMT) characteristics in this region. As can be seen from the Figure 51, the relay tripping characteristic for low set stage has two slopes. These slopes can be set by defining the percentage bias settings K1 and K2. The Idiff1 is the minimum differential current threshold (i.e., pickup current for the relay). The pickup differential current increases with the fault current increases. The current Ibias1 should be also defined and it differentiates the two slopes. This dual slope characteristic provides a higher sensitivity during lower fault currents and improved security for higher fault currents in which CT errors are large. The relay issues the trip command when one of the following conditions given in (94) or (95) is satisfied.
111 diffbiasdiffbiasbias IIKIandII (94)
111221 )( diffbiasbiasdiffbiasbias IIKKIKIandII (95)
Figure 51: Differential relay characteristic
In normal operating condition, the differential current should be zero. However, due to the line charging, CT saturation and inaccuracies in CT mismatch, it may not equal to zero. The problem of saturation is overcome in modern numerical relays by using saturation detectors (Ganesan, 2006). A calculation need to be carried out to determine the minimum pickup current for the relay (Idiff1). The setting of current differential relays should be performed lower enough to detect all types of faults on the feeder while ensuring the relays do not respond for external faults due to the CT errors and other measuring errors. The relay setting sensitivity is very important. However, the increase in sensitivity may also cause to decrease the security.
6.3.3. B. Bus Protection
Buses in the microgrid may have connected to loads, DGs and feeders. Therefore, a high speed protection is very important for a bus fault to avoid any extensive damage in the microgrid. The differential protection arrangement for a bus protection is shown in Figure 52. The protection principle is similar to the one explained in differential feeder protection. However, in this case, the relay will issue a trip command to all the circuit breakers connected to the bus during a bus fault.
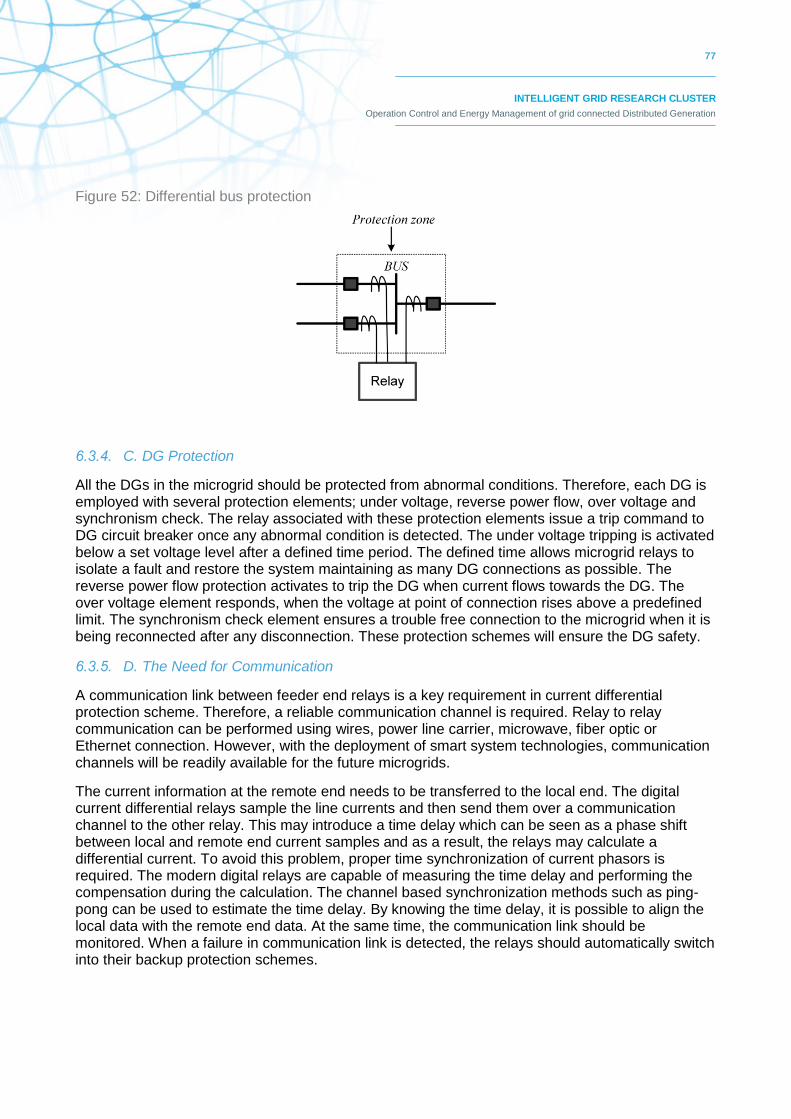
77
INTELLIGENT GRID RESEARCH CLUSTER
Operation Control and Energy Management of grid connected Distributed Generation
Figure 52: Differential bus protection
6.3.4. C. DG Protection
All the DGs in the microgrid should be protected from abnormal conditions. Therefore, each DG is employed with several protection elements; under voltage, reverse power flow, over voltage and synchronism check. The relay associated with these protection elements issue a trip command to DG circuit breaker once any abnormal condition is detected. The under voltage tripping is activated below a set voltage level after a defined time period. The defined time allows microgrid relays to isolate a fault and restore the system maintaining as many DG connections as possible. The reverse power flow protection activates to trip the DG when current flows towards the DG. The over voltage element responds, when the voltage at point of connection rises above a predefined limit. The synchronism check element ensures a trouble free connection to the microgrid when it is being reconnected after any disconnection. These protection schemes will ensure the DG safety.
6.3.5. D. The Need for Communication
A communication link between feeder end relays is a key requirement in current differential protection scheme. Therefore, a reliable communication channel is required. Relay to relay communication can be performed using wires, power line carrier, microwave, fiber optic or Ethernet connection. However, with the deployment of smart system technologies, communication channels will be readily available for the future microgrids.
The current information at the remote end needs to be transferred to the local end. The digital current differential relays sample the line currents and then send them over a communication channel to the other relay. This may introduce a time delay which can be seen as a phase shift between local and remote end current samples and as a result, the relays may calculate a differential current. To avoid this problem, proper time synchronization of current phasors is required. The modern digital relays are capable of measuring the time delay and performing the compensation during the calculation. The channel based synchronization methods such as ping-pong can be used to estimate the time delay. By knowing the time delay, it is possible to align the local data with the remote end data. At the same time, the communication link should be monitored. When a failure in communication link is detected, the relays should automatically switch into their backup protection schemes.
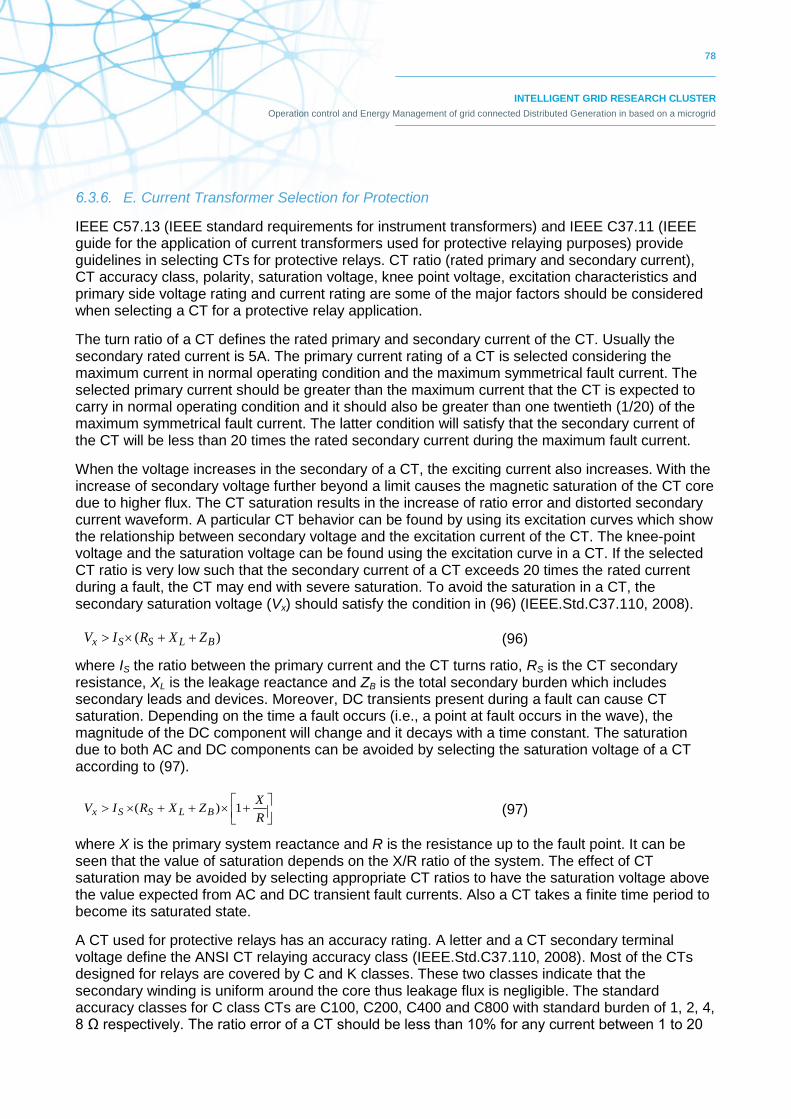
78
INTELLIGENT GRID RESEARCH CLUSTER
Operation control and Energy Management of grid connected Distributed Generation in based on a microgrid
6.3.6. E. Current Transformer Selection for Protection
IEEE C57.13 (IEEE standard requirements for instrument transformers) and IEEE C37.11 (IEEE guide for the application of current transformers used for protective relaying purposes) provide guidelines in selecting CTs for protective relays. CT ratio (rated primary and secondary current), CT accuracy class, polarity, saturation voltage, knee point voltage, excitation characteristics and primary side voltage rating and current rating are some of the major factors should be considered when selecting a CT for a protective relay application.
The turn ratio of a CT defines the rated primary and secondary current of the CT. Usually the secondary rated current is 5A. The primary current rating of a CT is selected considering the maximum current in normal operating condition and the maximum symmetrical fault current. The selected primary current should be greater than the maximum current that the CT is expected to carry in normal operating condition and it should also be greater than one twentieth (1/20) of the maximum symmetrical fault current. The latter condition will satisfy that the secondary current of the CT will be less than 20 times the rated secondary current during the maximum fault current.
When the voltage increases in the secondary of a CT, the exciting current also increases. With the increase of secondary voltage further beyond a limit causes the magnetic saturation of the CT core due to higher flux. The CT saturation results in the increase of ratio error and distorted secondary current waveform. A particular CT behavior can be found by using its excitation curves which show the relationship between secondary voltage and the excitation current of the CT. The knee-point voltage and the saturation voltage can be found using the excitation curve in a CT. If the selected CT ratio is very low such that the secondary current of a CT exceeds 20 times the rated current during a fault, the CT may end with severe saturation. To avoid the saturation in a CT, the secondary saturation voltage (Vx) should satisfy the condition in (96) (IEEE.Std.C37.110, 2008).
)( BLSSx ZXRIV (96)
where IS the ratio between the primary current and the CT turns ratio, RS is the CT secondary resistance, XL is the leakage reactance and ZB is the total secondary burden which includes secondary leads and devices. Moreover, DC transients present during a fault can cause CT saturation. Depending on the time a fault occurs (i.e., a point at fault occurs in the wave), the magnitude of the DC component will change and it decays with a time constant. The saturation due to both AC and DC components can be avoided by selecting the saturation voltage of a CT according to (97).
R
XZXRIV BLSSx 1)(
(97)
where X is the primary system reactance and R is the resistance up to the fault point. It can be seen that the value of saturation depends on the X/R ratio of the system. The effect of CT saturation may be avoided by selecting appropriate CT ratios to have the saturation voltage above the value expected from AC and DC transient fault currents. Also a CT takes a finite time period to become its saturated state.
A CT used for protective relays has an accuracy rating. A letter and a CT secondary terminal voltage define the ANSI CT relaying accuracy class (IEEE.Std.C37.110, 2008). Most of the CTs designed for relays are covered by C and K classes. These two classes indicate that the secondary winding is uniform around the core thus leakage flux is negligible. The standard accuracy classes for C class CTs are C100, C200, C400 and C800 with standard burden of 1, 2, 4, 8 Ω respectively. The ratio error of a CT should be less than 10% for any current between 1 to 20

79
INTELLIGENT GRID RESEARCH CLUSTER
Operation Control and Energy Management of grid connected Distributed Generation
times secondary rated current at the standard burden or any lower standard burden (IEEE.Std.C37.110, 2008). For example, if a CT with C100 class is selected, the ratio current error will not exceed 10% at any current from 1 to 20 times rated secondary current (i.e., 5A) with a standard 1 Ω burden. However, if the saturation of a CT occurs then the error ratio will exceed 10%.
6.3.7. Microgrid Protection Studies
Consider the microgrid system shown in Figure 49. The parameters of the microgrid are given in Table 13. The microgrid connection/disconnection is controlled by the microgrid control switch (MGCS). It is assumed that all the DGs are converter interfaced and the DG control is designed to enable the microgrid islanded operation during a grid disturbance. Moreover, these DGs limit their output currents to twice the rated current during a fault in the microgrid to protect their power switches.
The CT ratio for a particular CT is selected based on the maximum load current and the maximum fault current seen by the relay. To calculate the maximum load current seen by a relay, different system configurations are considered. For example, the relay R12 senses the maximum load current when all the DGs inject current into utility grid without any load is connected to microgrid and the feeder section between BUS-1 and BUS-5 is not in service. The maximum possible fault current seen by each relay also calculated. The CT ratio for a relay is then selected based on the criteria that the CT can deliver 20 times rated secondary current without exceeding 10% ratio error and the rated primary current to be above the maximum possible load current. The accuracy class for CTs is selected as C200. The selected CT ratio for each relay is given in Table 14.
Table 13: System Parameters
System parameter Value
Voltage 11 kV L-L rms
Frequency 50 HZ
Transformer power rating 5MVA
Transformer impedance (0.05 + j 2.1677) Ω
Each feeder impedance (0.94 + j 2.5447) Ω
Each load impedance (100 + j 75) Ω
DG1 power rating 0.8 MVA
DG2 power rating 1.2 MVA
DG3 power rating 1.5 MVA
DG4 power rating 1.0 MVA
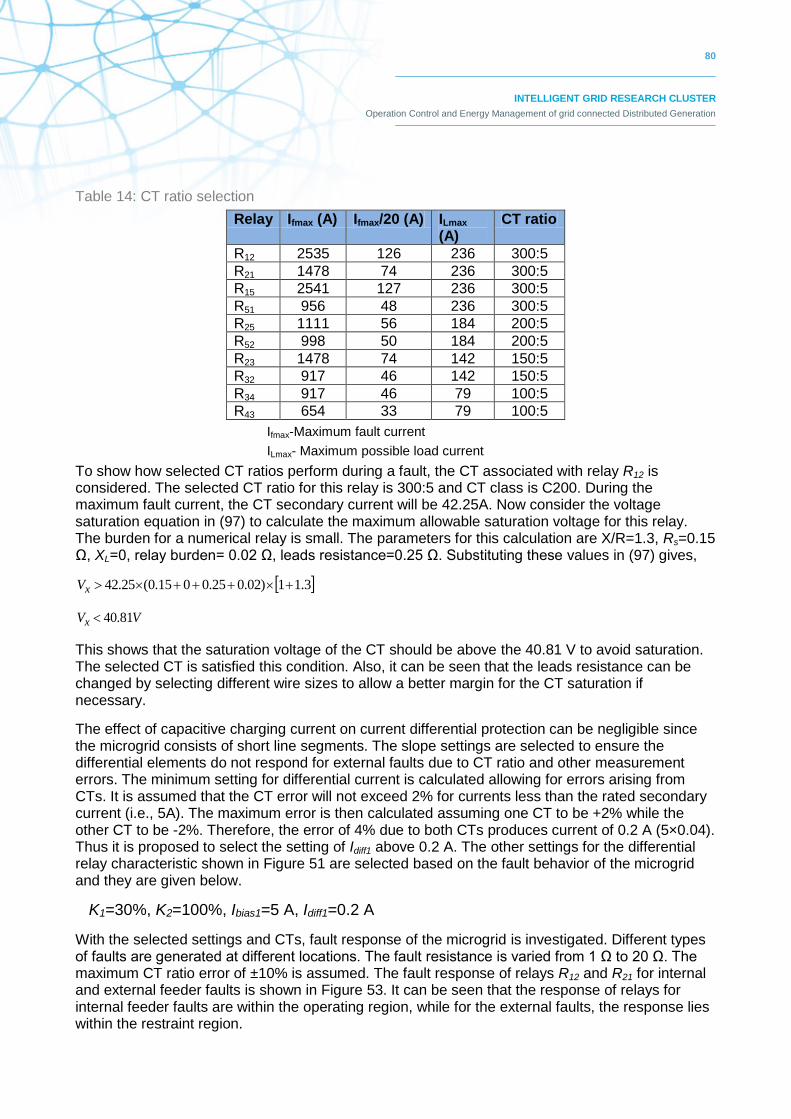
80
INTELLIGENT GRID RESEARCH CLUSTER
Operation Control and Energy Management of grid connected Distributed Generation
Table 14: CT ratio selection
Relay Ifmax (A) Ifmax/20 (A) ILmax (A)
CT ratio
R12 2535 126 236 300:5
R21 1478 74 236 300:5
R15 2541 127 236 300:5
R51 956 48 236 300:5
R25 1111 56 184 200:5
R52 998 50 184 200:5
R23 1478 74 142 150:5
R32 917 46 142 150:5
R34 917 46 79 100:5
R43 654 33 79 100:5
Ifmax-Maximum fault current
ILmax- Maximum possible load current
To show how selected CT ratios perform during a fault, the CT associated with relay R12 is considered. The selected CT ratio for this relay is 300:5 and CT class is C200. During the maximum fault current, the CT secondary current will be 42.25A. Now consider the voltage saturation equation in (97) to calculate the maximum allowable saturation voltage for this relay. The burden for a numerical relay is small. The parameters for this calculation are X/R=1.3, Rs=0.15 Ω, XL=0, relay burden= 0.02 Ω, leads resistance=0.25 Ω. Substituting these values in (97) gives,
3.11)02.025.0015.0(25.42 xV
VVx 81.40
This shows that the saturation voltage of the CT should be above the 40.81 V to avoid saturation. The selected CT is satisfied this condition. Also, it can be seen that the leads resistance can be changed by selecting different wire sizes to allow a better margin for the CT saturation if necessary.
The effect of capacitive charging current on current differential protection can be negligible since the microgrid consists of short line segments. The slope settings are selected to ensure the differential elements do not respond for external faults due to CT ratio and other measurement errors. The minimum setting for differential current is calculated allowing for errors arising from CTs. It is assumed that the CT error will not exceed 2% for currents less than the rated secondary current (i.e., 5A). The maximum error is then calculated assuming one CT to be +2% while the other CT to be -2%. Therefore, the error of 4% due to both CTs produces current of 0.2 A (5×0.04). Thus it is proposed to select the setting of Idiff1 above 0.2 A. The other settings for the differential relay characteristic shown in Figure 51 are selected based on the fault behavior of the microgrid and they are given below.
K1=30%, K2=100%, Ibias1=5 A, Idiff1=0.2 A
With the selected settings and CTs, fault response of the microgrid is investigated. Different types of faults are generated at different locations. The fault resistance is varied from 1 Ω to 20 Ω. The maximum CT ratio error of ±10% is assumed. The fault response of relays R12 and R21 for internal and external feeder faults is shown in Figure 53. It can be seen that the response of relays for internal feeder faults are within the operating region, while for the external faults, the response lies within the restraint region.
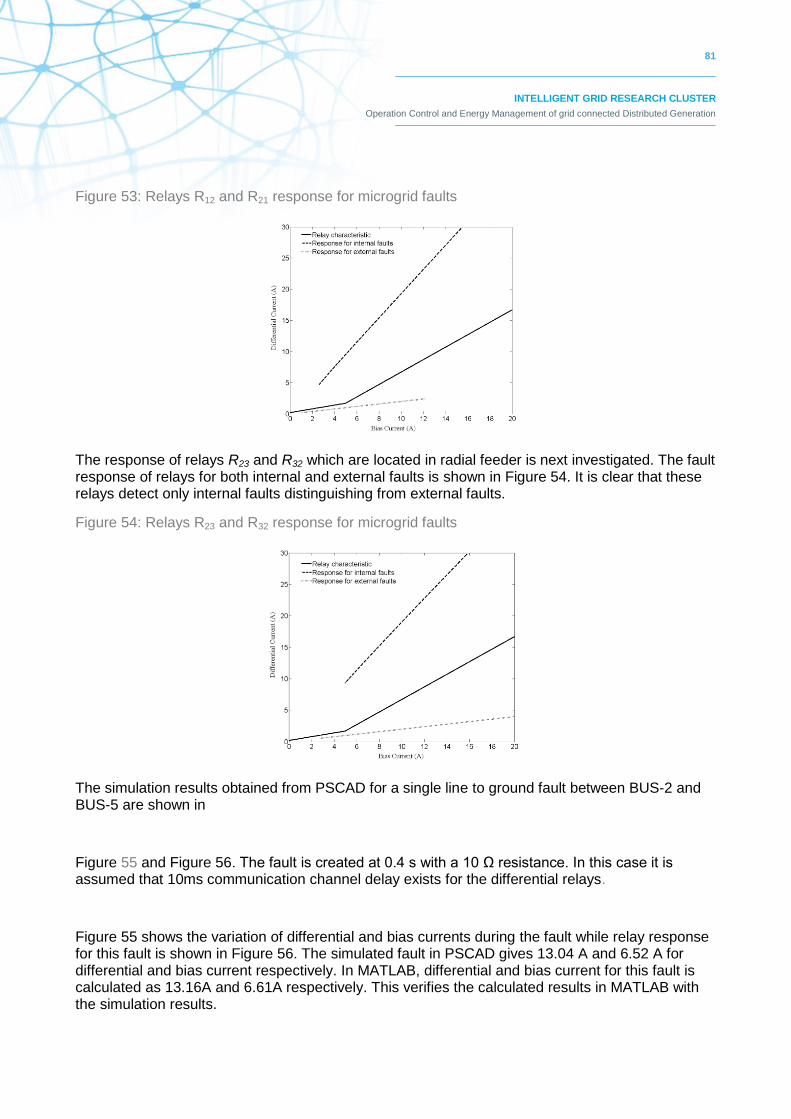
81
INTELLIGENT GRID RESEARCH CLUSTER
Operation Control and Energy Management of grid connected Distributed Generation
Figure 53: Relays R12 and R21 response for microgrid faults
The response of relays R23 and R32 which are located in radial feeder is next investigated. The fault response of relays for both internal and external faults is shown in Figure 54. It is clear that these relays detect only internal faults distinguishing from external faults.
Figure 54: Relays R23 and R32 response for microgrid faults
The simulation results obtained from PSCAD for a single line to ground fault between BUS-2 and BUS-5 are shown in
Figure 55 and Figure 56. The fault is created at 0.4 s with a 10 Ω resistance. In this case it is assumed that 10ms communication channel delay exists for the differential relays.
Figure 55 shows the variation of differential and bias currents during the fault while relay response for this fault is shown in Figure 56. The simulated fault in PSCAD gives 13.04 A and 6.52 A for differential and bias current respectively. In MATLAB, differential and bias current for this fault is calculated as 13.16A and 6.61A respectively. This verifies the calculated results in MATLAB with the simulation results.

82
INTELLIGENT GRID RESEARCH CLUSTER
Operation Control and Energy Management of grid connected Distributed Generation
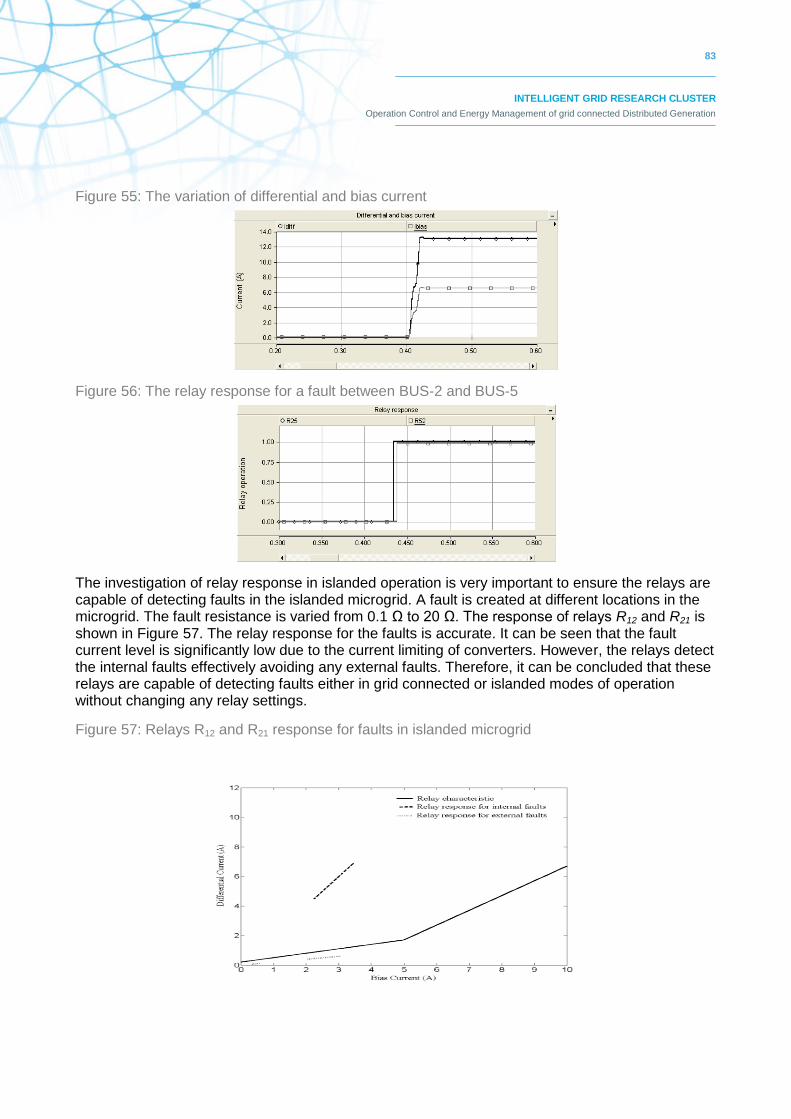
83
INTELLIGENT GRID RESEARCH CLUSTER
Operation Control and Energy Management of grid connected Distributed Generation
Figure 55: The variation of differential and bias current
Figure 56: The relay response for a fault between BUS-2 and BUS-5
The investigation of relay response in islanded operation is very important to ensure the relays are capable of detecting faults in the islanded microgrid. A fault is created at different locations in the microgrid. The fault resistance is varied from 0.1 Ω to 20 Ω. The response of relays R12 and R21 is shown in Figure 57. The relay response for the faults is accurate. It can be seen that the fault current level is significantly low due to the current limiting of converters. However, the relays detect the internal faults effectively avoiding any external faults. Therefore, it can be concluded that these relays are capable of detecting faults either in grid connected or islanded modes of operation without changing any relay settings.
Figure 57: Relays R12 and R21 response for faults in islanded microgrid
84
INTELLIGENT GRID RESEARCH CLUSTER
Operation Control and Energy Management of grid connected Distributed Generation
In this section, a primary protection scheme for a microgrid is presented using current differential relays with the aid of a communication channel. The protection issues associated with meshed structure, microgrid islanded operation, fault detection under low fault current levels are avoided with the use of modern differential relays. Relay settings and CT selection requirements are also discussed. Results show that the proposed protection strategies can provide selectivity and high level of sensitivity for internal faults in both grid-connected and islanded modes of operation thereby allowing a safe and a reliable operation for a microgrid.
6.4. Summary
In this section, protection strategies were proposed to overcome the protection issues associated with radial and meshed microgrids. Protection schemes were designed to detect and isolate the smallest portion of a faulted section allowing unfaulted sections to operate either in grid-connected or islanded mode operation. Firstly, a protection scheme for a DG connected radial network was proposed using overcurrent and communication channels. Secondly, a new inverse time admittance relay characteristic was presented. Finally, the protection of a meshed microgrid using current differential relays was presented. The proposed techniques can be effectively used to minimise protection issues of microgrids thereby assuring a safe and a reliable operation.

85
INTELLIGENT GRID RESEARCH CLUSTER
Operation Control and Energy Management of grid connected Distributed Generation
7. CONCLUSIONS
The concept of microgrid facilitates the integration of distributed energy resources into a distribution network in a more intelligent way. Renewable based energy sources can be effectively connected and managed to increase reliability to customers in a microgrid. The microgrid can operate either in grid connected or islanded (i.e., autonomous) mode. The available power of all DG units should meet the total load demand for autonomous operation; otherwise load shedding need to be implemented. The frequency and voltage in an islanded microgrid should be maintained within the predefined limits to ensure a safe operation.
DGs in a microgrid are different from one another. They have different transient characteristics. The inertial based DGs show a slower response while non-inertial DGs can respond very quickly during transient events. This mismatch of response rate in different DGs creates transient oscillations in an islanded microgrid where no strong source is present to control the system frequency and voltage. Also, output power of intermittent DGs such as wind and solar is not dispatchable to control the microgrid frequency and voltage. Moreover, intelligent control strategies are required for energy storage devices. Therefore, power management strategies are vital when non-dispatchable DGs and energy storage devices are present in the microgrid.
In this report, improved control and power management strategies for a microgrid are proposed. The efficacy of angle based droop over conventional frequency based droop in a converter interfaced autonomous microgrid is presented in this report. The angle droop and the frequency droop controllers are designed to provide the same stability margin. The results reveal that the frequency variation with the frequency droop controller is significantly higher than that with the angle droop controller. Thus, the angle based droop improves the transient stability of the microgrid minimizing the frequency and power oscillations.
Furthermore, improved droop control strategy called integral to system droop line is proposed for a microgrid containing both inertial and non-inertial DGs. This proposal alleviates the problem associated with different response rates of DGs thereby minimizing the oscillations. It also ensures the proper load power sharing amongst the DGs. Moreover, power management strategies are presented to incorporate dispatchable, non-dispatchable and energy storage devices. The Non-dispatchable DGs are controlled in MPPT. An intelligent controller for battery storage (BS) is proposed to manage the charging and discharging while maintaining the operating reserve in the BS to achieve the system stability. To enhance a flexible operation in the microgrid maximizing the benefits of renewable energy, an adaptive droop line is proposed for the BS. During the charging and discharging, the slope of the droop is selected appropriately by the BS intelligent controller.
Control strategies for a DG converter are imperative since most of the sources in a microgrid are interfaced through converters. Therefore, control design for converters is presented in this report. A voltage source converter can either be controlled by PWM or by hysteresis control.
Since the droop gains can cause instability in the microgrid system, proper study must be performed for the selection of droop gains in a microgrid containing several DGs. Two eigenvalue analysis techniques that can be applied when more than one converter operate in decentralized droop control are presented. One of the techniques assumes that the converters are ideal voltage sources that track the desired reference voltages accurately. The filter dynamics are not considered for this purpose. This eigenvalue analysis technique can be used as a screening tool for droop gain selection. This simple technique is independent of converter control strategy and will provide desired result irrespective of the converter structure and its control.

86
INTELLIGENT GRID RESEARCH CLUSTER
Operation Control and Energy Management of grid connected Distributed Generation
The second eigenvalue analysis technique presents a method for linear analysis of hysteretic controlled state feedback converters. One of the features of the proposed analysis is that state order is lower than those required for PWM converters. The process of analysis is illustrated using two VSCs that are connected at a bus. There is risk of oscillations of filter states the converters when they are connected at close proximity (e.g. in a microgrid). The robustness of the LQR based hysteretic design is able to be clearly shown using the Eigen-analysis tool developed in this report. The analysis process can be easily extended to include multiple converters, both hysteric and PWM controlled, that are connected to multiple buses of a power system.
In this report, protection issues associated with both radial and meshed microgrids are addressed. Protection schemes are proposed to detect and isolate the smallest portion of a faulted section allowing unfaulted sections to operate either in grid-connected or islanded mode thereby maintaining as many DG connections as possible in a microgrid.
Disconnection of DGs for every fault in a network drastically reduces the reliability and DG benefits to customers when DG penetration level is high. A control strategy for a converter and a protection scheme using digital OC relays are proposed, for a radial network containing high level of DG penetration, to achieve fault isolation, self extinction of arc, islanded and grid-connected operation without disconnecting DGs from unfaulted segments, and a method to perform system restoration in the presence of DGs using auto reclosers. One way communication is used between DGs and relays to change the relay reach settings appropriately.
Inverse time admittance (ITA) relay is presented to isolate a faulted section in a meshed microgrid avoiding the limitations of the existing overcurrent relays. It is shown that ITA relays are capable of detecting faults under lower fault current levels and changing fault current levels in the microgrid containing converter interfaced DGs. Moreover, a primary protection scheme for a meshed microgrid is presented using current differential relays with the aid of a communication channel. The protection issues associated with meshed structure, microgrid islanded operation, fault detection under low fault current levels are avoided with the use of modern differential relays. Results show that the proposed protection strategies can provide selectivity and high level of sensitivity for internal faults in both grid-connected and islanded modes of operation thereby allowing a safe and a reliable operation for a microgrid.
The control, power management and protection strategies presented in this report addressed the issues and challenges associated with a successful microgrid operation. The results of this study show that the incorporating proposed methods will lead to a stable, reliable and a safe microgrid operation in both grid connected and islanded modes of operation. The alleviation of potential barriers for the implementation of future microgrids is the major outcome of this study conducted.

87
INTELLIGENT GRID RESEARCH CLUSTER
Operation Control and Energy Management of grid connected Distributed Generation
8. REFERENCE LIST
AHN, S. J., PARK, J. W., CHUNG, I. Y., MOON, S. I., KANG, S. H. & NAM, S. R. 2010. Power-Sharing Method of Multiple Distributed Generators Considering Control Modes and Configurations of a Microgrid. IEEE Transactions on Power Delivery, 25, 2007-2016.
AL-NASSERI, H., REDFERN, M. A. & LI, F. 2006. A Voltage Based Protection for Micro-grids Containing Power Electronic Converters. IEEE Power Engineering Society General Meeting.
ANDERSON, B. D. O. & MOORE, J. B. 1971. Linear Optimal Control, Prentice-Hall, Englewood Cliffs, N.J.
AREDES, M., HAFNER, J. & HEUMANN, K. 1997. Three-phase four-wire shunt active filter control strategies. Power Electronics, IEEE Transactions on, 12, 311-318.
BRABANDERE, K. D., BOLSENS, B., KEYBUS, J. V. D., WOYTE, A., DRIESEN, J. & BELMANS, R. 2007. A Voltage and Frequency Droop Control Method for Parallel Inverters. IEEE Transactions on Power Electronics, 22, 1107 - 1115.
BRUCOLI, M., GREEN, T. C. & MCDONALD, J. D. F. 2007. Modelling and Analysis of Fault Behaviour of Inverter Microgrids to Aid Future Fault Detection. IEEE International Conference on System of Systems Engineering 1-6.
CHANDORKAR, M. C., DIVAN, D. M. & ADAPA, R. 1993. Control of parallel connected inverters in standalone AC supply systems. IEEE Transactions on Industry Applications, 29, 136 - 143
CHEUNG, H., HAMLYN, A., WANG, L., YANG, C. & CHEUNG, R. 2009. Investigations of Impacts of Distributed Generations on Feeder Protections. IEEE Power & Energy Society General Meeting.
CHO, S.-M., SHIN, H.-S. & KIM, J.-C. 2010. Impact of Distribution System Quality on DG Interconnection Protection. IEEE Power & Energy Society General Meeting.
CHOWDHURY, S. P., CHOWDHURY, S., TEN, C. F. & CROSSLEY, P. A. 2008. Islanding Protection of Distribution Systems with Distributed Generators — A Comprehensive Survey Report IEEE Power and Energy Society General Meeting.
COELHO, E. A. A., CORTIZO, P. C. & GARCIA, P. F. D. 2002. Small-signal stability for parallel-connected inverters in stand-alone AC supply systems. Industry Applications, IEEE Transactions on, 38, 533-542.
DEWADASA, M., GHOSH, A. & LEDWICH, G. 2009a. An inverse time admittance relay for fault detection in distribution networks containing DGs. IEEE Region 10 Conference (TENCON). Singapore.
DEWADASA, M., GHOSH, A. & LEDWICH, G. 2010. Fold back current control and admittance protection scheme for a distribution network containing distributed generators. IET Generation Transmission & Distribution, 4, 952-962.
DEWADASA, M., GHOSH, A., LEDWICH, G. & WISHART, M. 2011. Fault isolation in distributed generation connected distribution networks. IET Generation, Transmission & Distribution.
DEWADASA, M., MAJUMDER, R., GHOSH, A. & LEDWICH, G. Year. Control and protection of a microgrid with converter interfaced micro sources. In: Power Systems, 2009. ICPS '09. International Conference on, 27-29 Dec. 2009 2009b. 1-6.
DRIESEN, J., VERMEYEN, P. & BELMANS, R. 2007. Protection Issues in Microgrids with Multiple Distributed Generation Units. Power Conversion Conference - Nagoya, 646-653.
GANESAN, S. Year. Selection of current transformers and wire sizing in substations. In:
88
INTELLIGENT GRID RESEARCH CLUSTER
Operation Control and Energy Management of grid connected Distributed Generation
Protective Relay Engineers, 2006. 59th Annual Conference for, 0-0 0 2006. 10 pp.
GHOSH, A. & JOSHI, A. 2000. A new approach to load balancing and power factor correction in power distribution system. Power Delivery, IEEE Transactions on, 15, 417-422.
GHOSH, A. & LEDWICH, G. 2003. Load compensating DSTATCOM in weak AC systems. Power Delivery, IEEE Transactions on, 18, 1302-1309.
GHOSH, A., LEDWICH, G., ZARE, F. & MAJUMDER, R. 2011. Stability analysis of multiple voltage source converters connected at a bus. Int. Conf. on Smart Grids, Green Communications and IT Energy-aware Technologies. Venice, Italy.
GOMEZ, J. C. & MORCOS, M. M. 2005. Coordination of Voltage Sag and Overcurrent Protection in DG Systems. IEEE Transactions on Power Delivery, 20, 214-218.
GREEN, T. C. & PRODANOVIĆ, M. 2007. Control of Inverter-based Micro-grids. Electric Power Systems Research, ScienceDirect, 77, 1204-1213.
GUERRERO, J. M., BERBEL, N., DE VICUNA, L. G., MATAS, J., MIRET, J. & CASTILLA, M. Year. Droop control method for the parallel operation of online uninterruptible power systems using resistive output impedance. In: Applied Power Electronics Conference and Exposition, 2006. APEC '06. Twenty-First Annual IEEE, 19-23 March 2006 2006. 7 pp.
GUERRERO, J. M., DE VICUNA, L. G., MATAS, J., CASTILLA, M. & MIRET, J. 2004. A wireless controller to enhance dynamic performance of parallel inverters in distributed generation systems. Power Electronics, IEEE Transactions on, 19, 1205-1213.
GUERRERO, J. M., VICUNA, L. G. D., MATAS, J. & MIRET, J. 2002. Steady-state invariant-frequency control of parallel redundant uninterruptible power supplies. IECON 02 [Industrial Electronics Society, IEEE 2002 28th Annual Conference of the]
IEEE 1993. Load Representation for Dynamic Performance Analysis IEEE Transactions on Power Systems, 8, 472 - 482
IEEE.STD.1547 2003. IEEE Standard for Interconnecting Distributed Resources with Electric Power Systems.
IEEE.STD.C37.110 2008. IEEE Guide for the Application of Current Transformers Used for Protective Relaying Purposes. IEEE Std C37.110-2007 (Revision of Std C37.110-1996).
J. A. P. LOPES, C. L. MOREIRA & A. G. MADUREIRA 2006. Defining Control Strategies for MicroGrids Islanded Operation. IEEE Transactions on Power Systems, 21, 916-924.
J. DRIESEN, P. VERMEYEN & R. BELMANS 2007. Protection Issues in Microgrids with Multiple Distributed Generation Units. Power Conversion Conference - Nagoya, 646-653.
JAVADIAN, S. A. M., HAGHIFAM, M. R. & REZAEI, N. 2009. A Fault Location and Protection Scheme for Distribution Systems in Presence of DG Using MLP Neural Networks IEEE Power & Energy Society General Meeting.
JIANG, Z. H. & YU, X. W. 2009. Active Power - Voltage Control Scheme for Islanding Operation of Inverter-Interfaced Microgrids. IEEE Power & Energy Society General Meeting, 1738-1744.
KARIMI, H., NIKKHAJOEI, H. & IRAVANI, R. 2007. A Linear Quadratic Gaussian Controller for a Stand-alone Distributed Resource Unit-Simulation Case Studies IEEE Power Engineering Society General Meeting.
KATIRAEI, F. & IRAVANI, M. R. 2006. Power management strategies for a microgrid with multiple distributed generation units. IEEE Transactions on Power Systems, 21, 1821-1831.
KATIRAEI, F., IRAVANI, R., HATZIARGYRIOU, N. & DIMEAS, A. 2008. Microgrids management. IEEE Power & Energy Magazine, 6, 54-65.
KAUR, G. & VAZIRI, M. 2006. Effect of Distributed Generation (DG) Interconnection on Protection of Distribution Feeders. IEEE Power Engineering Society General Meeting
89
INTELLIGENT GRID RESEARCH CLUSTER
Operation Control and Energy Management of grid connected Distributed Generation
KHALIL, H. K. 2002. Nonlinear Systems, Prentice-Hall, Upper Saddle River, N.J.
KRISHNAMURTHY, S., JAHNS, T. M. & LASSETER, R. H. 2008. The Operation of Diesel Gensets in a CERTS Microgrid. IEEE Power & Energy Society General Meeting.
KUMPULAINEN, L. & KAUHANIEMI, K. 2004a. Distributed Generation and Reclosing Coordination. Nordic Distribution and Asset Management Conference.
KUMPULAINEN, L. K. & KAUHANIEMI, K. T. 2004b. Analysis of the Impact of Distributed Generation on Automatic Reclosing. Power Systems Conference and Exposition, 1, 603-608.
KUO, B. C. 1980. Digital Control Systems, Holt-Saunders, Tokyo,.
LAAKSONEN, H. J. 2010. Protection Principles for Future Microgrids. IEEE Transactions on Power Electronics, 25, 2910-2918.
LOIX, T., WIJNHOVEN, T. & DECONINCK, G. Year. Protection of microgrids with a high penetration of inverter-coupled energy sources. In: CIGRE/IEEE PES Joint Symposium on Integration of Wide-Scale Renewable Resources Into the Power Delivery System 29-31 July 2009 2009. 1-6.
LOPES, J. A. P., MOREIRA, C. L. & MADUREIRA, A. G. 2006. Defining control strategies for microgrids islanded operation. IEEE Transactions on Power Systems, 21, 916-924.
MAJUMDER, R., CHAUDHURI, B., GHOSH, A., LEDWICH, G. & ZARE, F. 2010. Improvement of Stability and Load Sharing in an Autonomous Microgrid Using Supplementary Droop Control Loop. IEEE Transactions on Power Systems, 25, 796-808.
MAJUMDER, R., GHOSH, A., LEDWICH, G. & ZARE, F. 2008. Control of parallel converters for load sharing with seamless transfer between grid connected and islanded modes
IEEE Power and Energy Society General Meeting.
MAJUMDER, R., GHOSH, A., LEDWICH, G. & ZARE, F. 2009a. Angle Droop Versus Frequency Droop in a Voltage Source Converter Based Autonomous Microgrid IEEE Power & Energy Society General Meeting.
MAJUMDER, R., GHOSH, A., LEDWICH, G. & ZARE, F. 2009b. Load Sharing and Power Quality Enhanced Operation of a Distributed Microgrid. IET Renewable Power Generation, 3, 109-
119.
MAJUMDER, R., SHAHNIA, F., GHOSH, A., LEDWICH, G., WISHART, M. & ZARE, F. 2009c. Operation and Control of a Microgrid Containing Inertial and Non-Inertial Micro Sources. IEEE Region 10 Conference (Tencon). Singapore: IEEE.
MARTINEZ, J. A. & MARTIN-ARNEDO, J. 2009. Impact of Distributed Generation on Distribution Protection and Power Quality IEEE Power & Energy Society General Meeting.
MOHAN, N., UNDELAND, T. M. & ROBBINS, W. P. 2003. Power Electronics: Converters, Applications and Design, John Wiley, New York.
NIKKHAJOEI, H. & LASSETER, R. H. 2007. Microgrid Protection. IEEE Power Engineering Society General Meeting, 1-6.
PERERA, N., RAJAPAKSE, A. D. & BUCHHOLZER, T. E. 2008. Isolation of Faults in Distribution Networks with Distributed Generators. IEEE Trans. on Power Delivery, 23, 2347-2355.
POGAKU, N., PRODANOVIC, M. & GREEN, T. C. 2007. Modeling, Analysis and Testing of Autonomous Operation of an Inverter-Based Microgrid. Power Electronics, IEEE Transactions on, 22, 613-625.
PRASAI, A., YI, D., PAQUETTE, A., BUCK, E., HARLEY, R. & DIVAN, D. Year. Protection of meshed microgrids with communication overlay. In: IEEE Energy Conversion Congress and Exposition, 12-16 Sept. 2010 2010. 64-71.
90
INTELLIGENT GRID RESEARCH CLUSTER
Operation Control and Energy Management of grid connected Distributed Generation
REZA, M., SUDARMADI, D., VIAWAN, F. A., KLING, W. L. & VAN DER SLUIS, L. Year. Dynamic Stability of Power Systems with Power Electronic Interfaced DG. In: Power Systems Conference and Exposition, 2006. PSCE '06. 2006 IEEE PES, Oct. 29 2006-Nov. 1 2006 2006. 1423-1428.
SHAHABI, M., HAGHIFAM, M. R., MOHAMADIAN, M. & NABAVI-NIAKI, S. A. 2009. Dynamic Behavior Improvement in a Microgrid with Multiple DG Units Using a Power Sharing Approach. In: TOMA, L. & OTOMEGA, B. (eds.) IEEE Bucharest Power Tech Conference.
SLOTINE, J. J. E. & LI, W. 1991. Applied Nonlinear Control, Prentice-hall, Englewood Cliffs, N.J.
SVENSSON, J. 2001. Synchronisation methods for grid-connected voltage source converters. IEE Generation, Transmission and Distribution 148, 229 - 235.
TAN, J. C., MCLAREN, P. G., JAYASINGHE, R. P. & WILSON, P. L. 2002. Software Model for Inverse Time Overcurrent Relays Incorporating IEC and IEEE Standard Curves. IEEE Canadian Conference on Electrical and Computer Engineering
TAN, S. F. & SALMAN, S. K. 2009. Application of Single Pole Auto Reclosing in Distributaion Networks with High Pentration of DGS Universities Power Engineering Conference (UPEC)
VASQUEZ, J. C., GUERRERO, J. M., MIRET, J., CASTILLA, M. & DE VICUNA, L. G. 2010. Hierarchical Control of Intelligent Microgrids. Industrial Electronics Magazine, IEEE, 4, 23-29.
ZAMANI, A., SIDHU, T. & YAZDANI, A. 2010. A Strategy for Protection Coordination in Radial Distribution Networks with Distributed Generators. IEEE Power & Energy Society General Meeting.
ZAMANI, M. A., SIDHU, T. S. & YAZDANI, A. 2011. A Protection Strategy and Microprocessor-Based Relay for Low-Voltage Microgrids. IEEE Transactions on Power Delivery, PP, 1-1.
ZEINELDIN, H. H., EL-SAADANY, E. F. & SALAMA, M. M. A. 2006. Distributed Generation Micro-Grid Operation: Control and Protection. IEEE Power Systems Conference: Advanced Metering, Protection, Control, Communication, and Distributed Resources.
ZHANG, L., HARNEFORS, L. & NEE, H.-P. 2010. Power-Synchronization Control of Grid-Connected Voltage-Source Converters. IEEE Transactions on Power Systems, 25, 809 -
820.

91
INTELLIGENT GRID RESEARCH CLUSTER
Operation Control and Energy Management of grid connected Distributed Generation


![Intelligent Grid Research Cluster- Project 3 A benefit ...igrid.net.au/resources/downloads/project3/P3 M4 A... · Mathure, 2010], the application of active power sensitivities to](https://img.pdfslide.us/doc/110x75/5f8205dceb66b04919032582/intelligent-grid-research-cluster-project-3-a-benefit-igridnetauresourcesdownloadsproject3p3.jpg)


![Policy Recommendations From Black Falls Project7[1]](https://img.pdfslide.us/doc/110x75/55810cd9d8b42a05558b4cee/policy-recommendations-from-black-falls-project71.jpg)