Embed Size (px)
Citation preview

© 2016 Electric Power Research Institute, Inc. All rights reserved.
Nadav Enbar, Steven Coley, Jeff Roark
EPRI
PDU Fall Advisory Meeting
September 20, 2016
Integration of DER Program:
Utility Economics & Practices
P174D Tech Transfer
2© 2016 Electric Power Research Institute, Inc. All rights reserved.
Agenda / Objectives
P174D research activities
– Meter-based Connecters for DER
– Assessing the Costs and Benefits of Locational PV Deployment
– Time and Locational Value of DER: Methods & Applications
– Examining Utility Fixed and Variable Cost Pathways with Increasing DER
A Look Ahead: Proposed 2017 Portfolio
Member Exchange & Discussion
3© 2016 Electric Power Research Institute, Inc. All rights reserved.
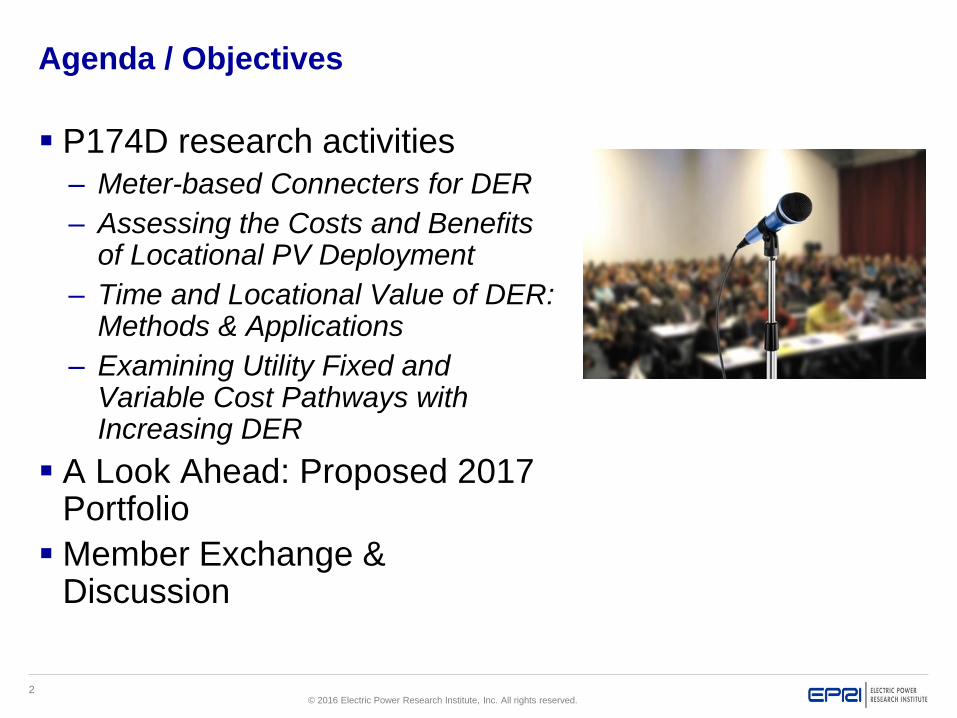
PS174D: Business Impacts and Practices
Objective
Examine economic and business
implications of PV adoption; Explore
utility strategies, use cases,
applications, that support DER.
Value
• Better understand DER markets in the context of utility distribution
• Access lessons learned and analysis of innovative solar business models
• Acquire case study results on PV technical and economic performance
• Discern high penetration PV contexts and mitigation techniques from multiple stakeholder perspectives
$0.50
$1.00
$1.50
$2.00
$2.50
$3.00
$3.50
$4.00
$4.50
$5.00
Tota
l In
itia
l Co
sts
($/W
)
Energy Value ($/kWh)
10 years
5 years
15 years
20 yearsPaybackPeriod
Less Economic
More Econmic
2045
Leverage & Coordination
• Energy Storage (P94), Technology
Assessment/Integrated Portfolio Planning
(P178), Renewable Generation (P193); NREL,
SEPA and RMI; EPRI Integrated Grid initiative

4© 2016 Electric Power Research Institute, Inc. All rights reserved.
2016 PS174D Deliverables
174.008 - Utility Practices, Markets, and Use Cases
Deliverable Title Report Type / Delivery Product ID
Utility DER Business Practices
- Meter-based Connecters for DER
- Structures that Maximize the Potential of Microgrids1
White Paper x 2
Delivery: Q3, Q4
3002008203
3002008205
Solar PV Market Update – Volumes 17 & 182
- Frontline Solar Industry Analyses
Newsletter / Email Alerts
Delivery: Q2, Q4
3002008460
3002008210
Understanding PV Market Potential for Distribution Planning3 White Paper
Delivery: Q43002008202
174.009 - Economic Analysis of Business Impacts and Opportunities
Comparing the Cost-Benefit of Guided vs. Unguided PV
Deployment on Distribution4
Tech Update
Delivery: Q33002008213
Examining the Effects of Customer-Sited Solar + Storage on
Distribution5
Tech Update (PPT+Webcast)
Delivery: Q43002008212
Examining Utility Fixed and Variable Cost Pathways with
Increasing DER Growth
White paper
Delivery: Q33002008211
Jointly-published with:1 SEPA2 P193
3 P174A + P178B4 P174A5 P174A + P94
© 2016 Electric Power Research Institute, Inc. All rights reserved.
Nadav Enbar
Principal Project Manager
Meter-based
Connecters for DER

6© 2016 Electric Power Research Institute, Inc. All rights reserved.
Meter-based Connecters for DER
Behind-the-meter PV challenges the traditional utility business model
• Revenue erosion, cross-subsidization/equity issues, customer satisfaction
• Increased complexity and cost of utility planning and grid balancing efforts
o Inability to “see” variable production of distributed PV presents grid reliability concerns
Meter collars for PV as a contributing solution
• Provide a standardized method for interconnecting DER at reduced cost by
eliminating BOS components and wiring upgrades
• Offer visibility into PV system performance across a distributed fleet
• With “smarts” (and regulatory approval), enable remote command/control
Potentially facilitate development of a utility solar services model that supports
more economic PV deployment and enhanced grid reliability
Objective: Examine meter adapters as utility strategy for safely/cost effectively
interconnecting DER systems while laying groundwork for future opportunities.

7© 2016 Electric Power Research Institute, Inc. All rights reserved.
What Is a Meter Collar for DER?
• A device inserted between residential
utility electrical meter and the meter
socket that creates a new interface
between the meter and socket
• Additional space created by extending the
meter connection further away from the
socket can be used to install other
devices for the utility benefit
• Remote disconnect
• Receive power line carrier signals
• Facilitate distributed generation
Example Meter Adapter Installations
Sources: Global Power Products and ConnectDER
• Appropriate for
1. New construction
2. Upgrade from 100/150a to 200a panel

8© 2016 Electric Power Research Institute, Inc. All rights reserved.
Upfront Cost Savings
Meter collars bypass a home’s
distribution panel, reduce
wiring/materials of service panel
upgrade, eliminate AC disconnect
o Lowers overall cost of residential PV
system install by ~5-10%
Only commercially available “smart”
adapter also eliminates need for
production meter, transfer switches,
communications boxesTypical Residential Solar PV Installation
Source: ConnectDER
Conventional Meter Collar
Panel Upgrade ~$2,500$400-1,300, plus ITC rebate
Underground Service Upgrade ~$10,000
Labor Multiple people Single person
Install Time 4-6 weeks 1 week
Avg. Customer Outage 6 hours 10 minutes
9© 2016 Electric Power Research Institute, Inc. All rights reserved.
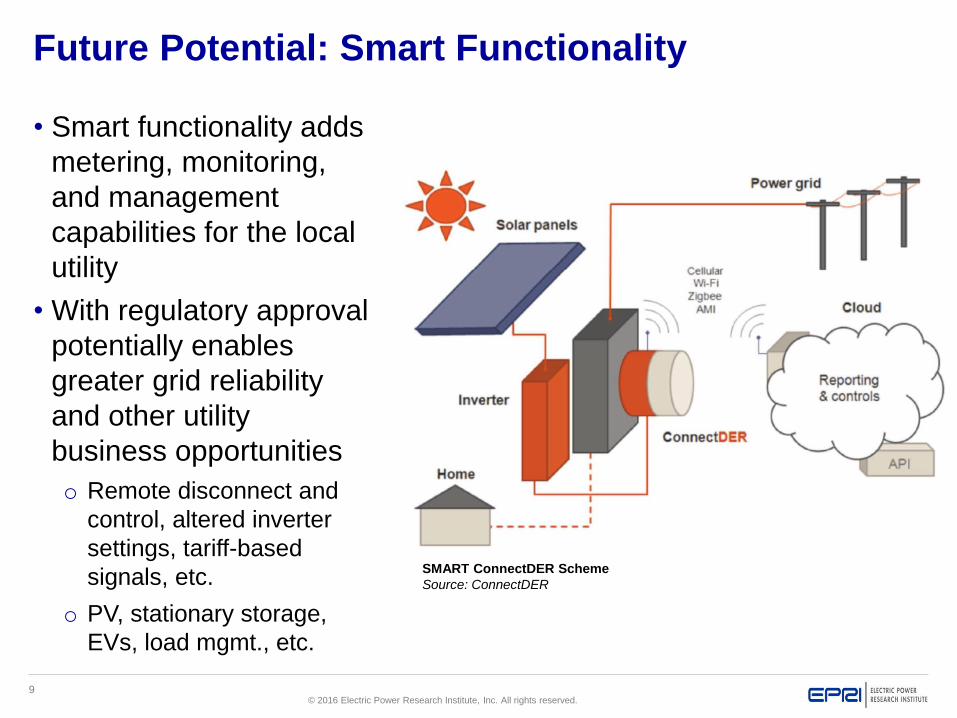
Future Potential: Smart Functionality
• Smart functionality adds
metering, monitoring,
and management
capabilities for the local
utility
• With regulatory approval
potentially enables
greater grid reliability
and other utility
business opportunities
o Remote disconnect and
control, altered inverter
settings, tariff-based
signals, etc.
o PV, stationary storage,
EVs, load mgmt., etc.
SMART ConnectDER Scheme
Source: ConnectDER
10© 2016 Electric Power Research Institute, Inc. All rights reserved.
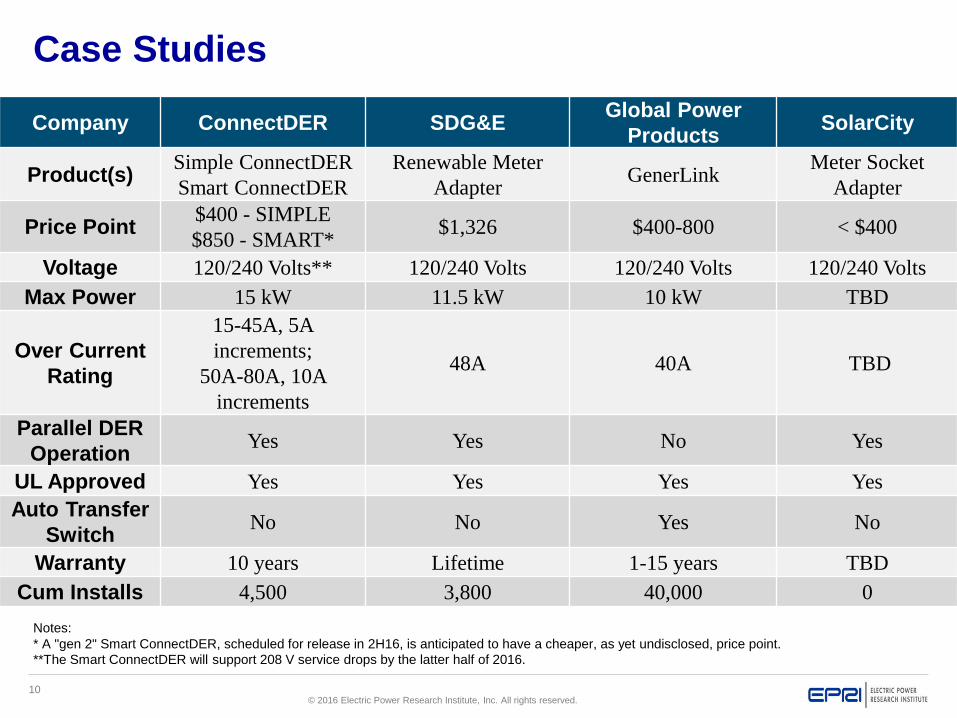
Case Studies
Company ConnectDER SDG&EGlobal Power
ProductsSolarCity
Product(s)Simple ConnectDER
Smart ConnectDER
Renewable Meter
AdapterGenerLink
Meter Socket
Adapter
Price Point$400 - SIMPLE
$850 - SMART*$1,326 $400-800 < $400
Voltage 120/240 Volts** 120/240 Volts 120/240 Volts 120/240 Volts
Max Power 15 kW 11.5 kW 10 kW TBD
Over Current
Rating
15-45A, 5A
increments;
50A-80A, 10A
increments
48A 40A TBD
Parallel DER
OperationYes Yes No Yes
UL Approved Yes Yes Yes Yes
Auto Transfer
SwitchNo No Yes No
Warranty 10 years Lifetime 1-15 years TBD
Cum Installs 4,500 3,800 40,000 0
Notes:
* A "gen 2" Smart ConnectDER, scheduled for release in 2H16, is anticipated to have a cheaper, as yet undisclosed, price point.
**The Smart ConnectDER will support 208 V service drops by the latter half of 2016.

11© 2016 Electric Power Research Institute, Inc. All rights reserved.
Utility Business Model Examples / Options
• Developed to help manage PV customers
• Sells to developers/customers as contractual
option during application process
• Provides lifetime warranty (SDG&E owns
device)
• Benefits
• Improved customer relations
• Streamlined interconnection
• Supported CA enviro goals
• Enhanced grid safety
• Avoided costs
• May seek CPUC approval to license/sell device
• May add “smarts”; RMA a proof-of-concept
SDG&E’s Renewable Meter Adapter (RMA)
RMA Installation
Source: SDG&E
12© 2016 Electric Power Research Institute, Inc. All rights reserved.
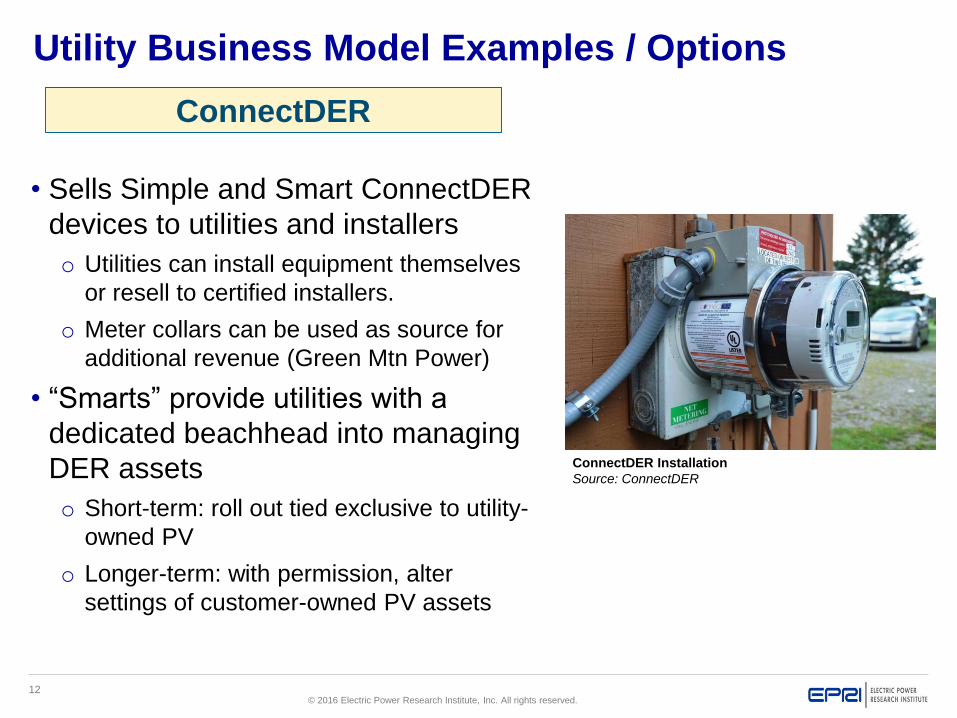
Utility Business Model Examples / Options
• Sells Simple and Smart ConnectDER
devices to utilities and installers
o Utilities can install equipment themselves
or resell to certified installers.
o Meter collars can be used as source for
additional revenue (Green Mtn Power)
• “Smarts” provide utilities with a
dedicated beachhead into managing
DER assets
o Short-term: roll out tied exclusive to utility-
owned PV
o Longer-term: with permission, alter
settings of customer-owned PV assets
ConnectDER Installation
Source: ConnectDER
ConnectDER

13© 2016 Electric Power Research Institute, Inc. All rights reserved.
A Look Ahead: Potential Utility Meter Adapter
Deployment Models
Model Definition
AuthorizeAllow 3rd parties to sell direct to customers or installers; coordinate
installations required. Optionally retain rights to data access.
ResellPurchase direct from manufacturer, resell to customers as service or
asset. Optionally retain ownership of asset, rights to data access.
Hybrid
Offer for service fee; with regulatory approval, rate-base the
balance. Retain ownership and data, optionally provide 3rd party
data access.
Rate Base
With regulatory approval, mandate deployment and rate-base full
cost. Retain ownership and data, optionally provide 3rd party data
access.
Sources: ConnectDER, EPRI
14© 2016 Electric Power Research Institute, Inc. All rights reserved.
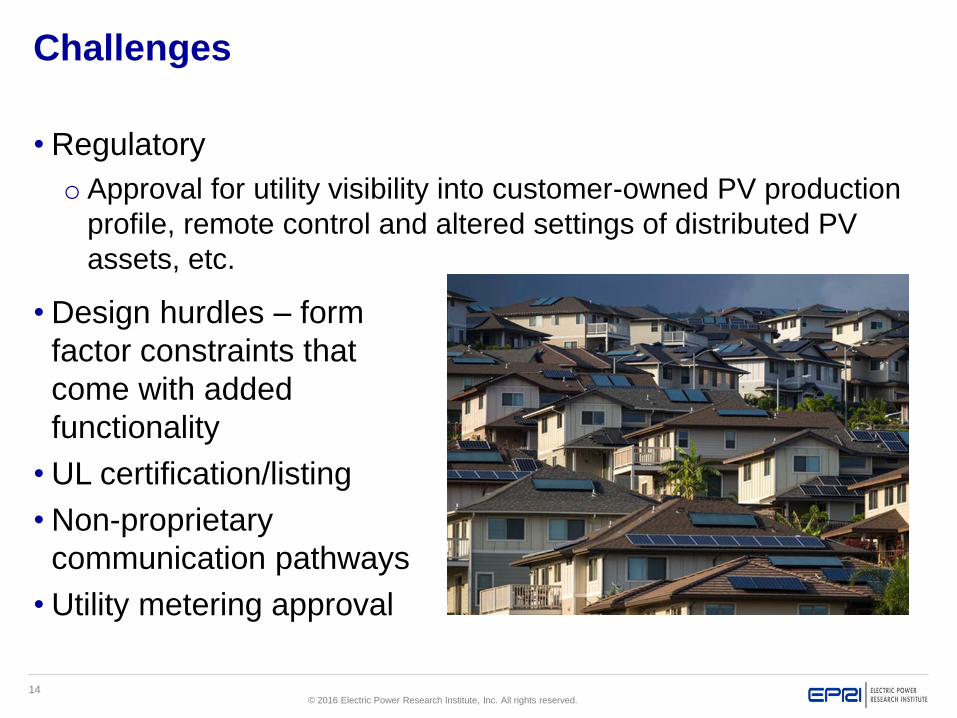
Challenges
• Regulatory
o Approval for utility visibility into customer-owned PV production
profile, remote control and altered settings of distributed PV
assets, etc.
• Design hurdles – form
factor constraints that
come with added
functionality
• UL certification/listing
• Non-proprietary
communication pathways
• Utility metering approval

15© 2016 Electric Power Research Institute, Inc. All rights reserved.
Questions, Comments, Feedback?
© 2016 Electric Power Research Institute, Inc. All rights reserved.
Steven ColeySenior Project Engineer
Assessing the Costs and
Benefits of Guided vs.
Unguided Solar
Deployment on
Distribution Feeders
17© 2016 Electric Power Research Institute, Inc. All rights reserved.
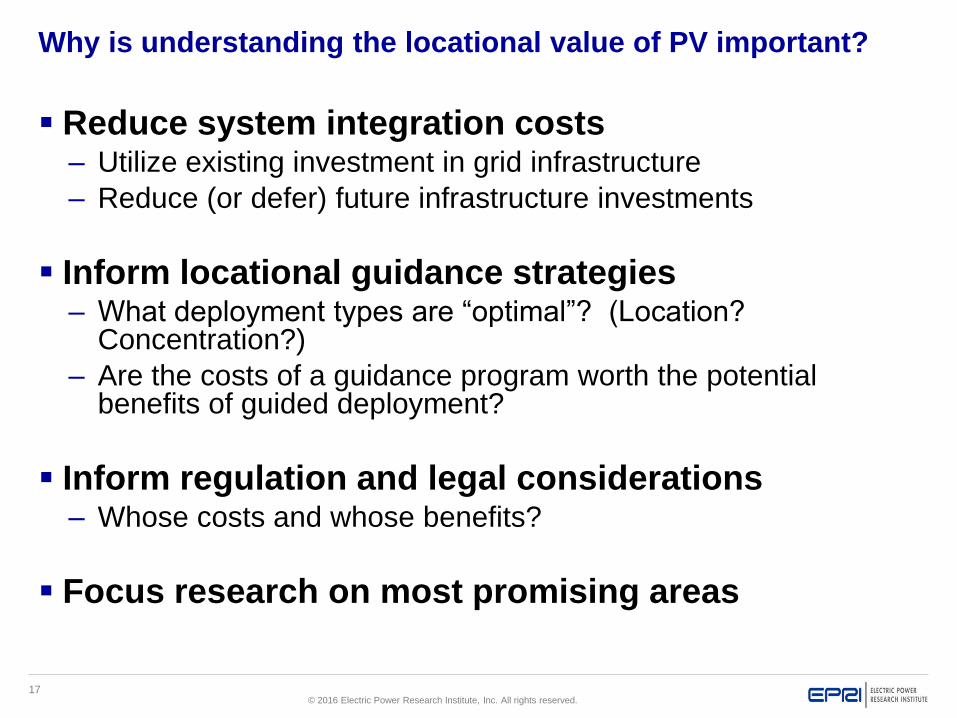
Why is understanding the locational value of PV important?
Reduce system integration costs– Utilize existing investment in grid infrastructure
– Reduce (or defer) future infrastructure investments
Inform locational guidance strategies– What deployment types are “optimal”? (Location?
Concentration?)
– Are the costs of a guidance program worth the potential benefits of guided deployment?
Inform regulation and legal considerations– Whose costs and whose benefits?
Focus research on most promising areas
18© 2016 Electric Power Research Institute, Inc. All rights reserved.
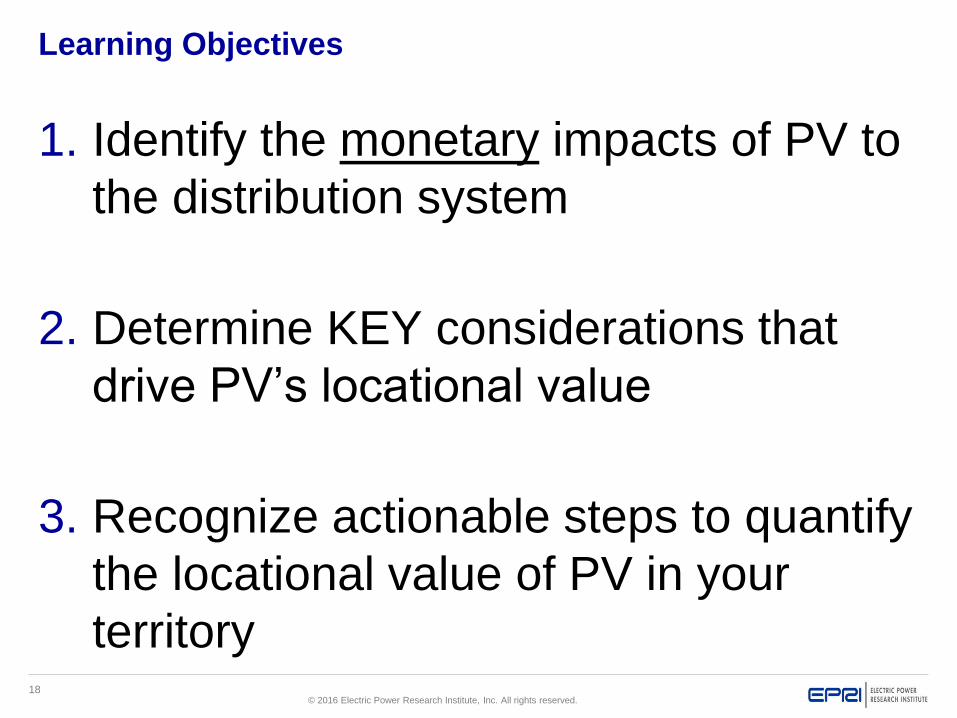
Learning Objectives
1. Identify the monetary impacts of PV to
the distribution system
2. Determine KEY considerations that
drive PV’s locational value
3. Recognize actionable steps to quantify
the locational value of PV in your
territory
19© 2016 Electric Power Research Institute, Inc. All rights reserved.
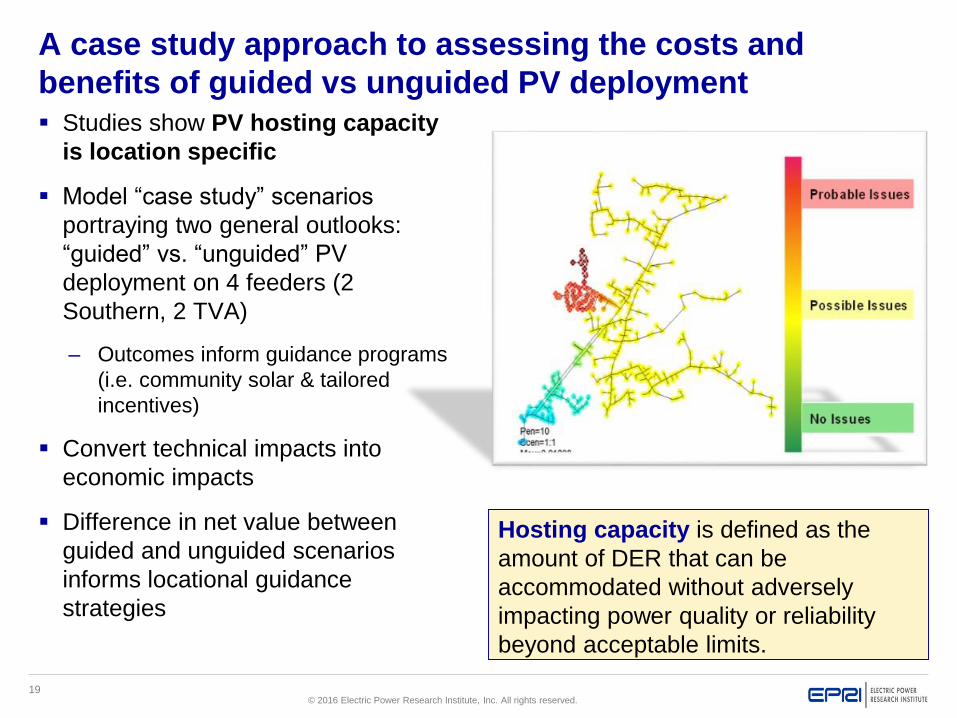
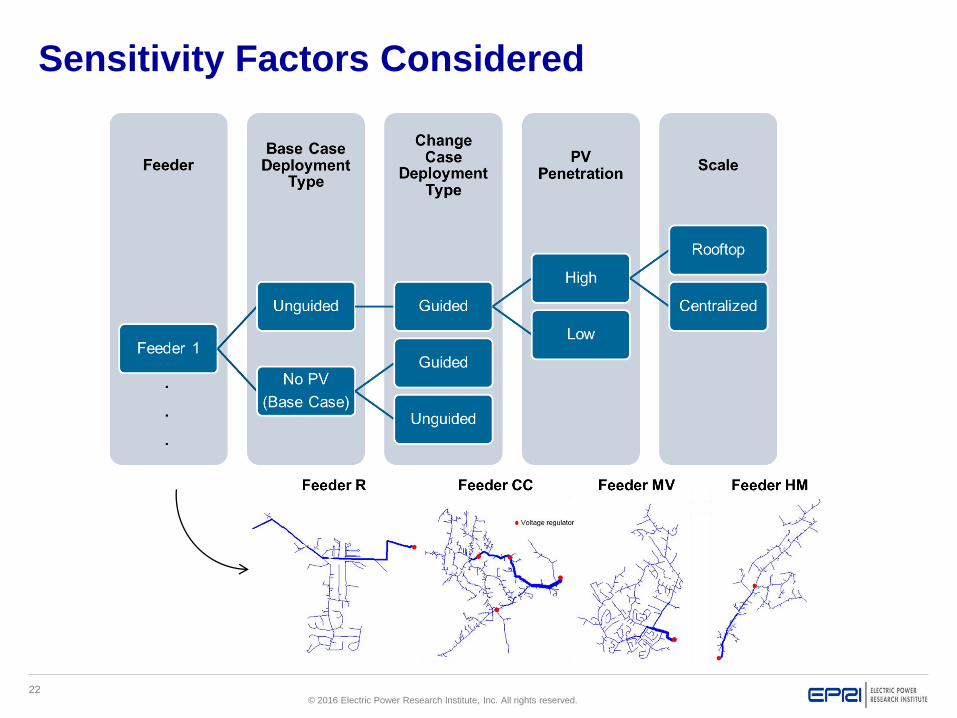
A case study approach to assessing the costs and
benefits of guided vs unguided PV deployment
Studies show PV hosting capacity
is location specific
Model “case study” scenarios
portraying two general outlooks:
“guided” vs. “unguided” PV
deployment on 4 feeders (2
Southern, 2 TVA)
– Outcomes inform guidance programs
(i.e. community solar & tailored
incentives)
Convert technical impacts into
economic impacts
Difference in net value between
guided and unguided scenarios
informs locational guidance
strategies
Hosting capacity is defined as the
amount of DER that can be
accommodated without adversely
impacting power quality or reliability
beyond acceptable limits.
20© 2016 Electric Power Research Institute, Inc. All rights reserved.
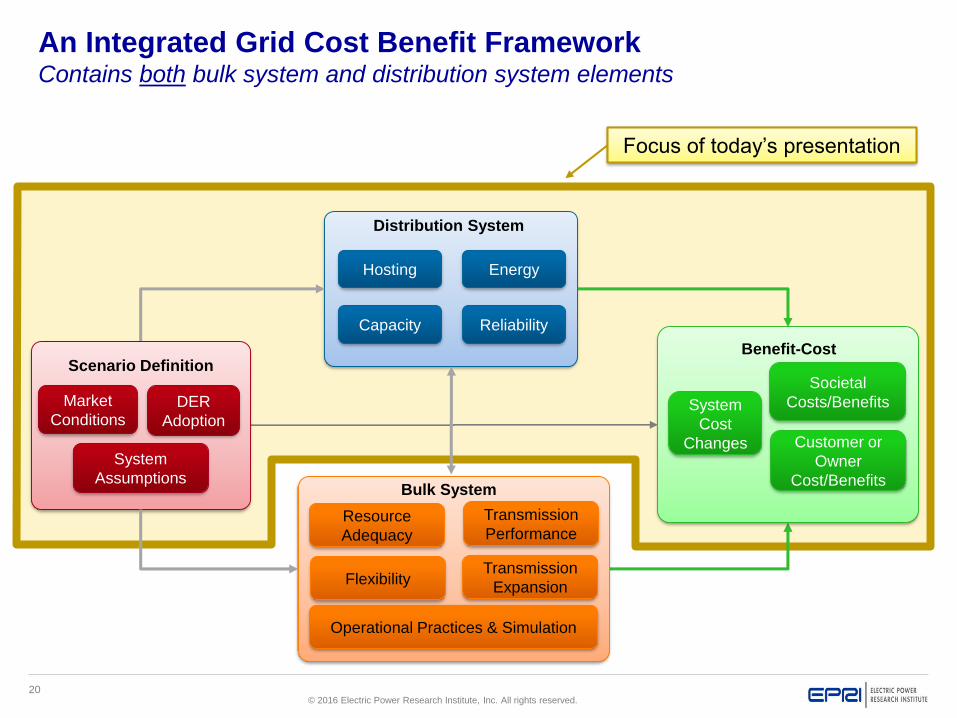
Focus of today’s presentation
An Integrated Grid Cost Benefit FrameworkContains both bulk system and distribution system elements
Hosting Energy
Capacity
Distribution System
Bulk System
Customer or
Owner
Cost/Benefits
Societal
Costs/Benefits
Benefit-CostScenario Definition
DER
Adoption
Market
Conditions
Resource
Adequacy
Flexibility
Operational Practices & Simulation
Transmission
Performance
Transmission
Expansion
System
Cost
Changes
Reliability
System
Assumptions
21© 2016 Electric Power Research Institute, Inc. All rights reserved.
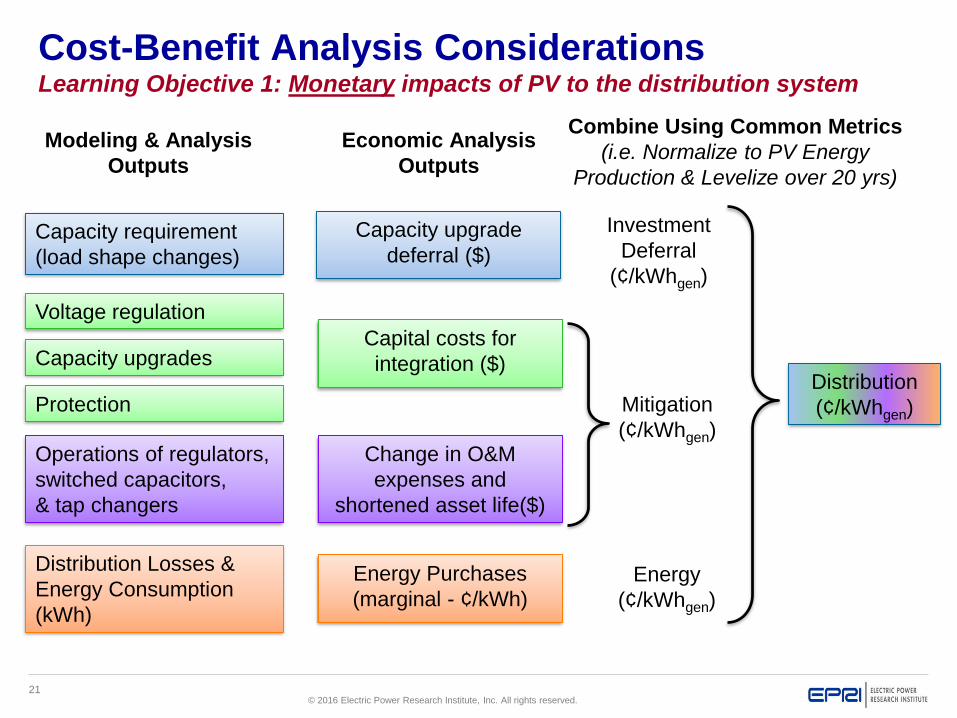
Modeling & Analysis
Outputs
Economic Analysis
Outputs
Capacity upgrade
deferral ($)
Capital costs for
integration ($)
Change in O&M
expenses and
shortened asset life($)
Distribution Losses &
Energy Consumption
(kWh)
Distribution
(¢/kWhgen)
Energy Purchases
(marginal - ¢/kWh)
Capacity requirement
(load shape changes)
Voltage regulation
Operations of regulators,
switched capacitors,
& tap changers
Protection
Capacity upgrades
Investment
Deferral
(¢/kWhgen)
Energy
(¢/kWhgen)
Combine Using Common Metrics
(i.e. Normalize to PV Energy
Production & Levelize over 20 yrs)
Mitigation
(¢/kWhgen)
Cost-Benefit Analysis ConsiderationsLearning Objective 1: Monetary impacts of PV to the distribution system
22© 2016 Electric Power Research Institute, Inc. All rights reserved.
Sensitivity Factors Considered

23© 2016 Electric Power Research Institute, Inc. All rights reserved.
Group Discussion (2 or 3 people)Take 2 minutes to discuss the following questions
In this study, which factor do you think will have the most significant impact on distribution system value?
– Feeder Characteristic (Feeder CC, R, MV, or HM)
– Location (Guided vs. Unguided Deployment)
– PV Penetration (High vs. Low)
– Scale (Rooftop vs. Centralized)
– I don’t know (It depends is the real answer and I just don’t like to pick…)
What other factors/considerations would have a significant impact on the distribution system value?

24© 2016 Electric Power Research Institute, Inc. All rights reserved.
Example Total Net Distribution ValueFeeder HM: Moderate PV, Unguided, Rooftop vs. Base Case (no PV)
Note: The full distribution cost would also include an assessment
of the value of transformer deferral due to peak demand reduction.

25© 2016 Electric Power Research Institute, Inc. All rights reserved.
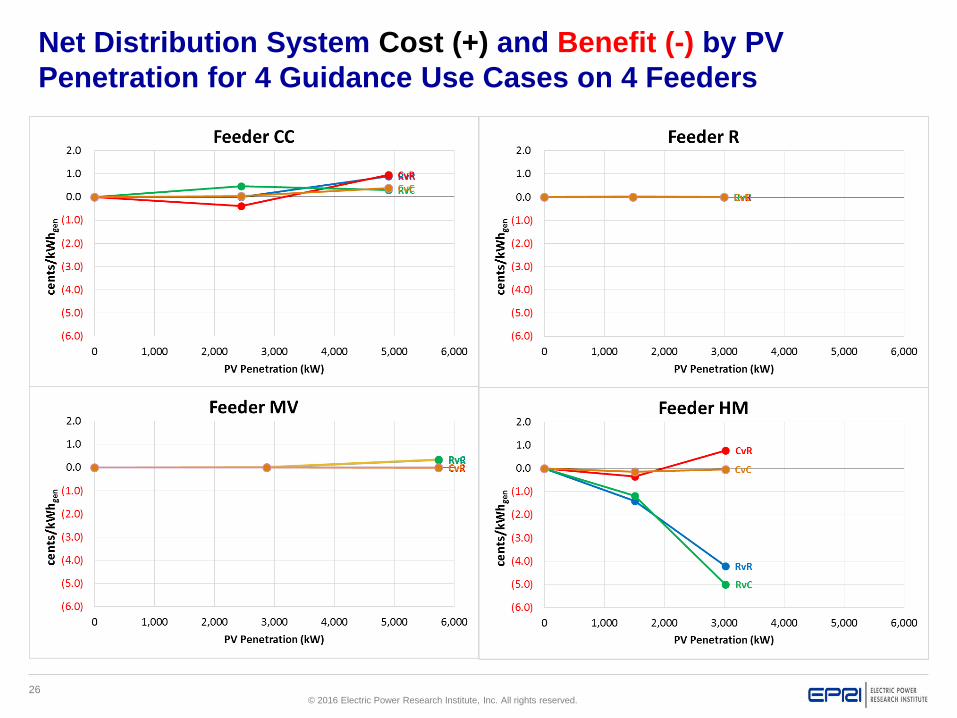
Comparison Between Guided and Unguided Cases
Use Case Description Comparison
Roof vs. Roof
(RvR)
Simulated use case in which guides distributed
rooftop PV deployment to optimal areas on a
distribution feeder, compared to unguided
deployment of distributed rooftop PV.
Unguided rooftop
vs.
Guided rooftop
Centralized vs.
Roof
(CvR)
Simulated use case in which distributed PV is
directed to optimal rooftop locations on a distribution
feeder, compared to unguided deployment of
centralized PV systems.
Unguided
centralized
vs.
Guided rooftop
Roof vs.
Centralized
(RvC)
Simulated use case in which the deployment of
centralized PV system(s) is directed in optimal areas
of a distribution feeder, compared to deployment of
randomly distributed rooftop PV.
Unguided rooftop
Vs.
Guided centralized
Centralized vs.
Centralized
(CvC)
Simulated use case in which the deployment of
centralized PV system(s) is directed in optimal
areas, rather than compared to the deployment of
randomly located centralized PV systems.
Unguided
centralized
Vs.
Guided centralized
26© 2016 Electric Power Research Institute, Inc. All rights reserved.
Net Distribution System Cost (+) and Benefit (-) by PV
Penetration for 4 Guidance Use Cases on 4 Feeders
27© 2016 Electric Power Research Institute, Inc. All rights reserved.
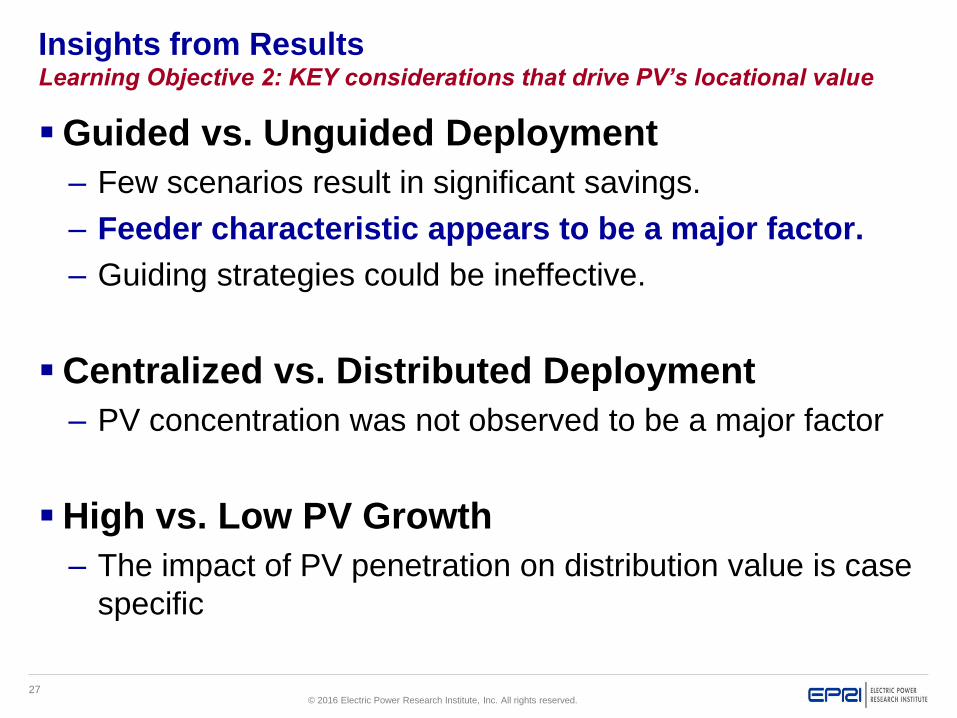
Insights from ResultsLearning Objective 2: KEY considerations that drive PV’s locational value
Guided vs. Unguided Deployment
– Few scenarios result in significant savings.
– Feeder characteristic appears to be a major factor.
– Guiding strategies could be ineffective.
Centralized vs. Distributed Deployment
– PV concentration was not observed to be a major factor
High vs. Low PV Growth
– The impact of PV penetration on distribution value is case
specific
28© 2016 Electric Power Research Institute, Inc. All rights reserved.
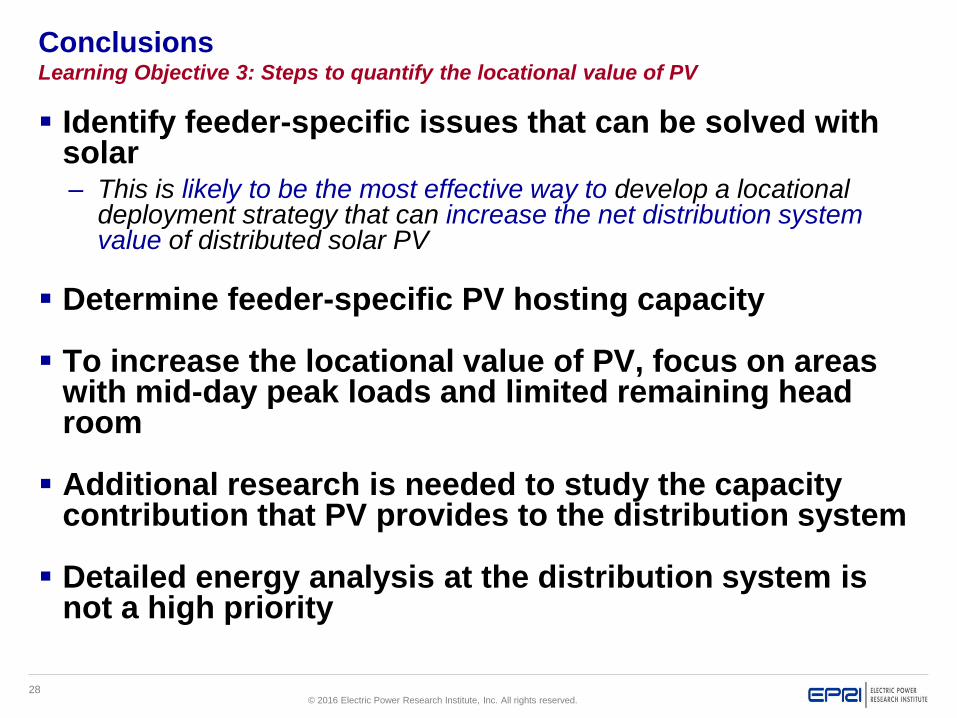
ConclusionsLearning Objective 3: Steps to quantify the locational value of PV
Identify feeder-specific issues that can be solved with solar– This is likely to be the most effective way to develop a locational
deployment strategy that can increase the net distribution system value of distributed solar PV
Determine feeder-specific PV hosting capacity
To increase the locational value of PV, focus on areas with mid-day peak loads and limited remaining head room
Additional research is needed to study the capacity contribution that PV provides to the distribution system
Detailed energy analysis at the distribution system is not a high priority

29© 2016 Electric Power Research Institute, Inc. All rights reserved.
Questions, Comments, Feedback?

© 2016 Electric Power Research Institute, Inc. All rights reserved.
Jeffrey D. Roark
Technical Executive
Time and Locational
Value of Distributed
Energy Resources:
Methods & Applications
31© 2016 Electric Power Research Institute, Inc. All rights reserved.
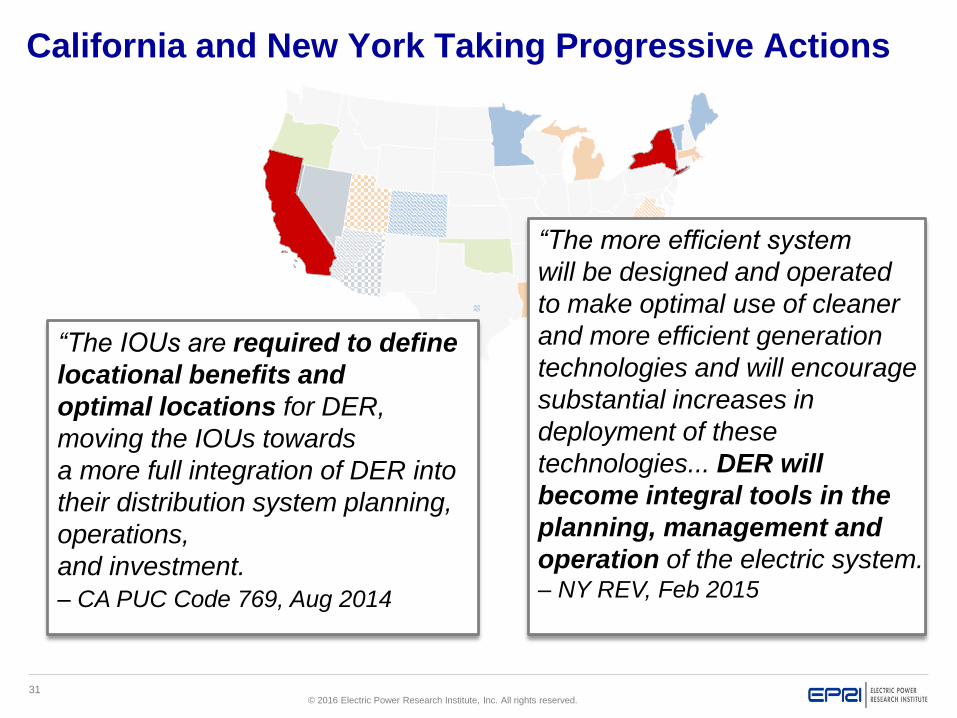
California and New York Taking Progressive Actions
“The IOUs are required to define
locational benefits and
optimal locations for DER,
moving the IOUs towards
a more full integration of DER into
their distribution system planning,
operations,
and investment.
– CA PUC Code 769, Aug 2014
“The more efficient system
will be designed and operated
to make optimal use of cleaner
and more efficient generation
technologies and will encourage
substantial increases in
deployment of these
technologies... DER will
become integral tools in the
planning, management and
operation of the electric system. – NY REV, Feb 2015

32© 2016 Electric Power Research Institute, Inc. All rights reserved.
EPRI’s Study: “Time and Locational Value of DER:
Methods and Applications”
Used the EPRI Benefit-Cost Framework
– Objective, reproducible
– Assesses impacts of interconnected DER
– Estimates value/cost to society
Two DER Interconnection Scenarios
– DER only to meet all load growth
– DER at customer discretion
Actual Systems
– Studied 10-year period to align
with distribution planning timeframe
– Actual performance data for baseline
Asks whether DER can economically replace or avoid
investments otherwise needed to accommodate growth.
Note: Companion study conducted by Sue Tierney, The Analysis Group. “The Value of “DER” to “D”:
The Role of Distributed Energy Resources in Supporting Local Electric Distribution Reliability.”
33© 2016 Electric Power Research Institute, Inc. All rights reserved.
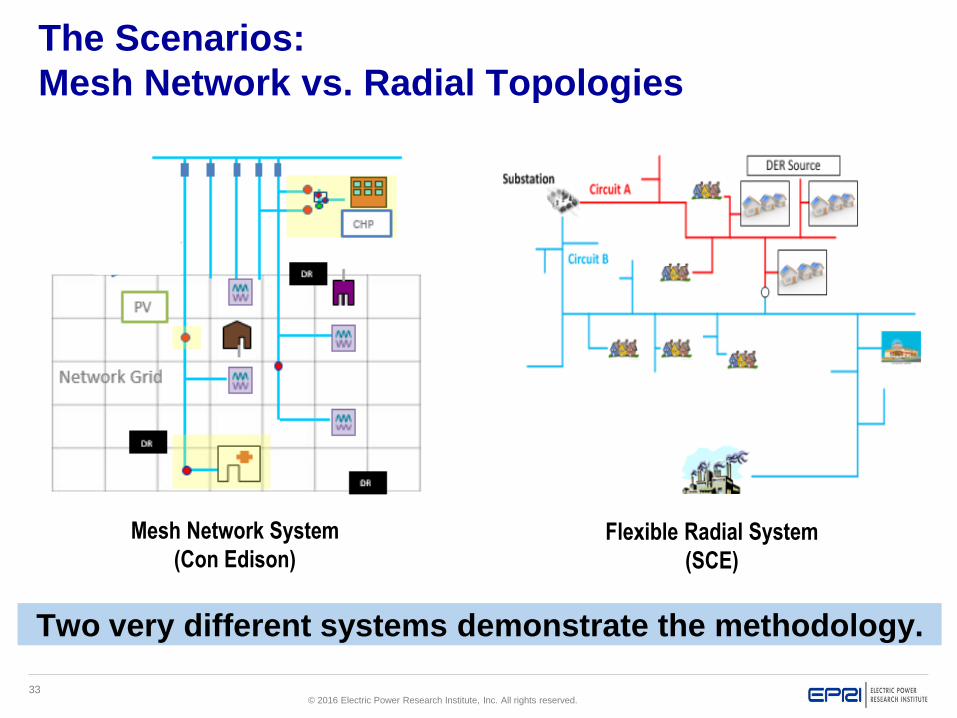
Mesh Network System
(Con Edison)Flexible Radial System
(SCE)
The Scenarios:
Mesh Network vs. Radial Topologies
Two very different systems demonstrate the methodology.

34© 2016 Electric Power Research Institute, Inc. All rights reserved.
Time and Locational Value
of Distributed Energy Resources
Thanks to Con Edison
for the use of the following materials.
35© 2016 Electric Power Research Institute, Inc. All rights reserved.
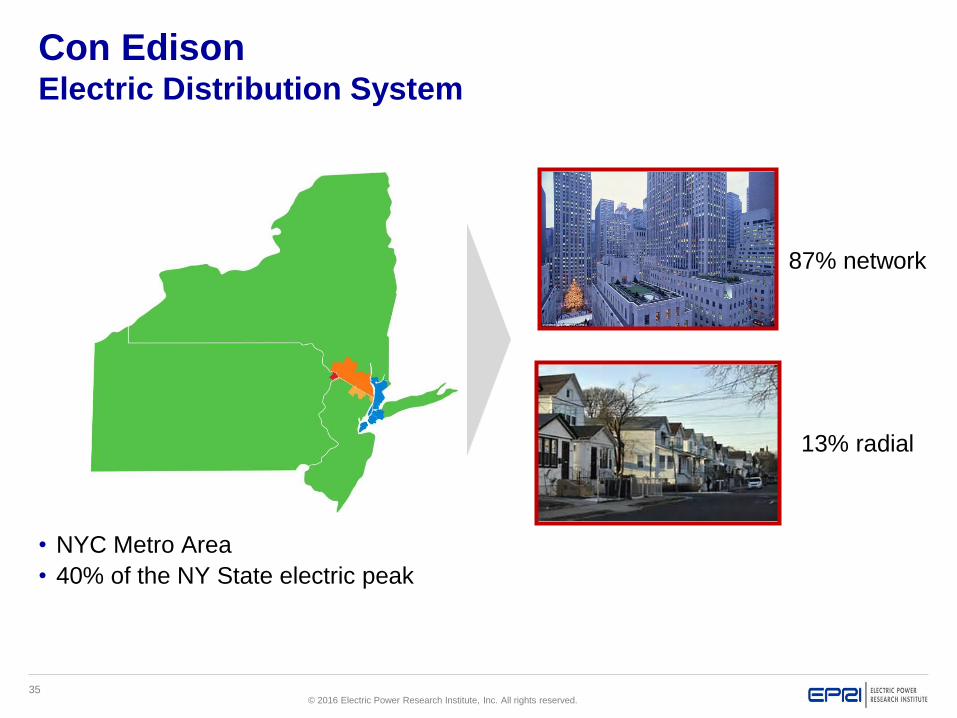
Con EdisonElectric Distribution System
• NYC Metro Area
• 40% of the NY State electric peak
87% network
13% radial
36© 2016 Electric Power Research Institute, Inc. All rights reserved.
121 24 Hours
kW
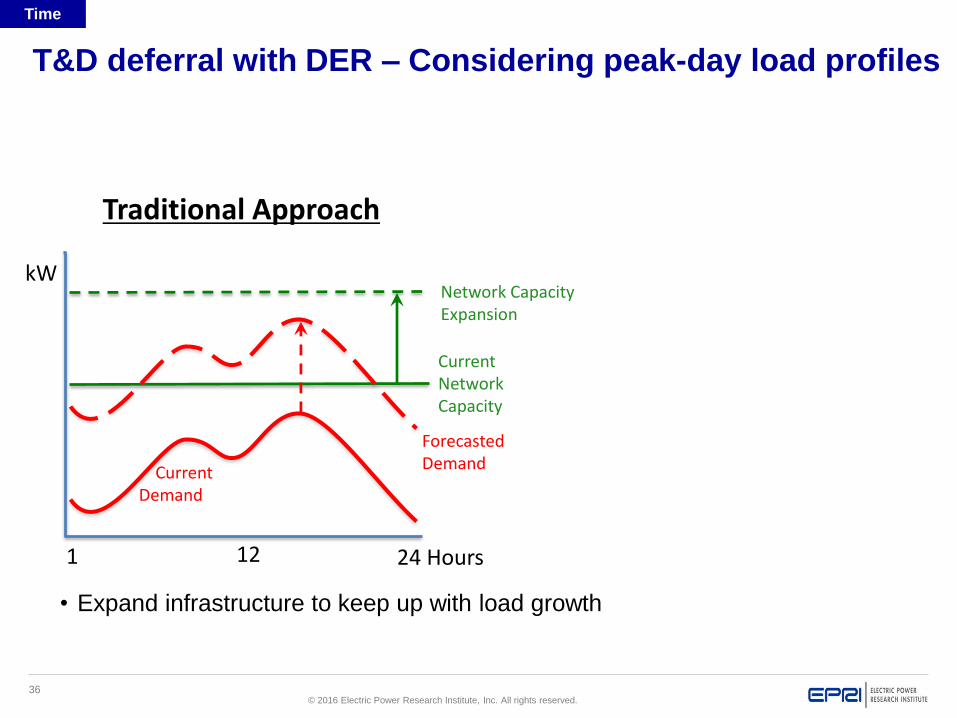
T&D deferral with DER – Considering peak-day load profiles
Current Demand
Forecasted Demand
Network Capacity Expansion
Current Network Capacity
Traditional Approach
• Expand infrastructure to keep up with load growth
Time

37© 2016 Electric Power Research Institute, Inc. All rights reserved.
Thousands of customer-sited
solutions
T&D deferral with DER – Considering peak day load profiles
• Assemble a portfolio of DER technologies to shave peak.
• Peak load duration matters.
The Brooklyn-Queens Demand Management Program (BQDM) is securing
41 MW of customer-sited DER to defer T&D investment beyond 2025.
Brooklyn
Queens
BQDM Area
Current Network Capacity
DER Portfolio Approach
121 24 Hours
kW
Current Demand
Forecasted Demand
Time
38© 2016 Electric Power Research Institute, Inc. All rights reserved.
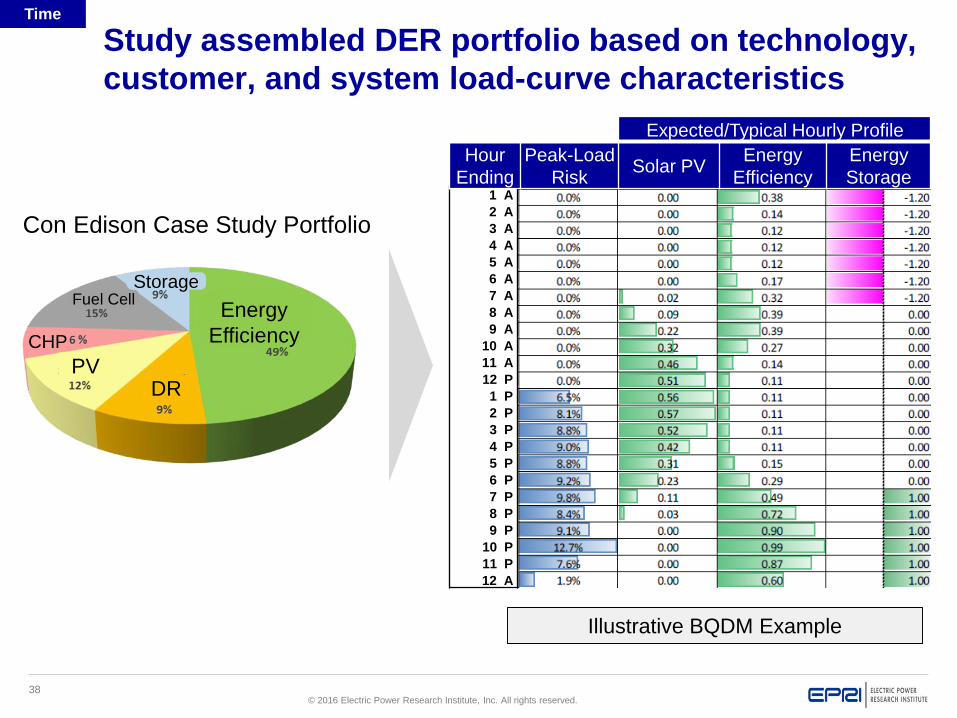
Study assembled DER portfolio based on technology,
customer, and system load-curve characteristics
Illustrative BQDM Example
1 A
2 A
3 A
4 A
5 A
6 A
7 A
8 A
9 A
10 A
11 A
12 P
1 P
2 P
3 P
4 P
5 P
6 P
7 P
8 P
9 P
10 P
11 P
12 A
Expected/Typical Hourly Profile
Hour
Ending
Peak-Load
RiskSolar PV
Energy
Efficiency
Energy
Storage
Energy
Efficiency
DRPV
CHP
Fuel CellStorage
Con Edison Case Study Portfolio
Time
39© 2016 Electric Power Research Institute, Inc. All rights reserved.
Neighboring
transformer
Neighboring
transformer
Overloaded
Transformer
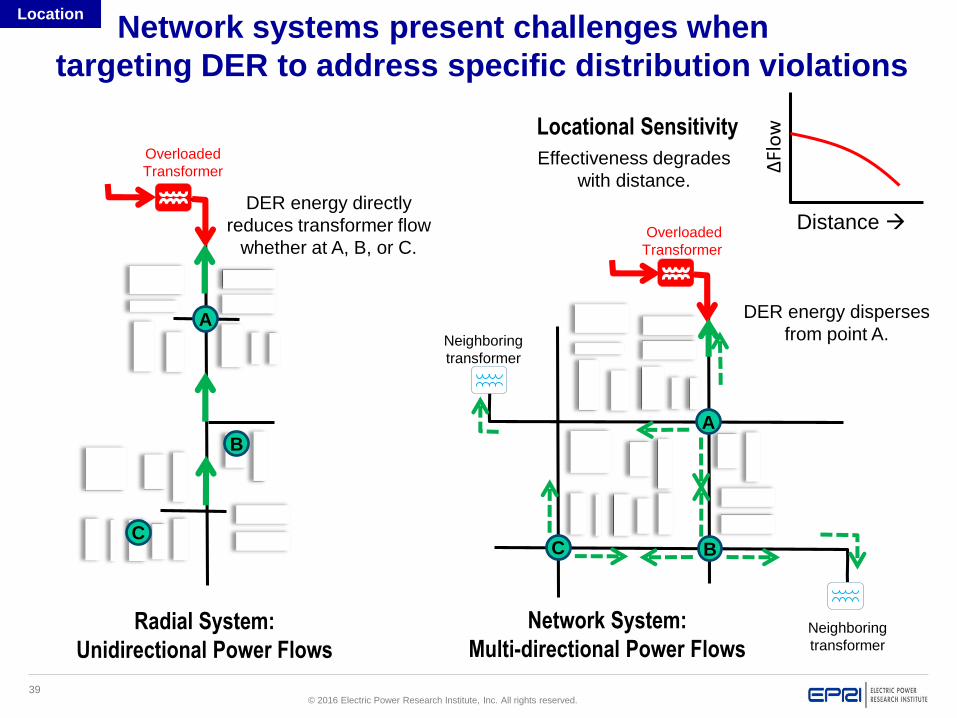
Network systems present challenges when
targeting DER to address specific distribution violations
Network System:
Multi-directional Power Flows
Locational SensitivityOverloaded
Transformer
A DER energy disperses
from point A.
Radial System:
Unidirectional Power Flows
B
C
A
BC
DER energy directly
reduces transformer flow
whether at A, B, or C.
Effectiveness degrades
with distance.
Distance
∆Flow
Location
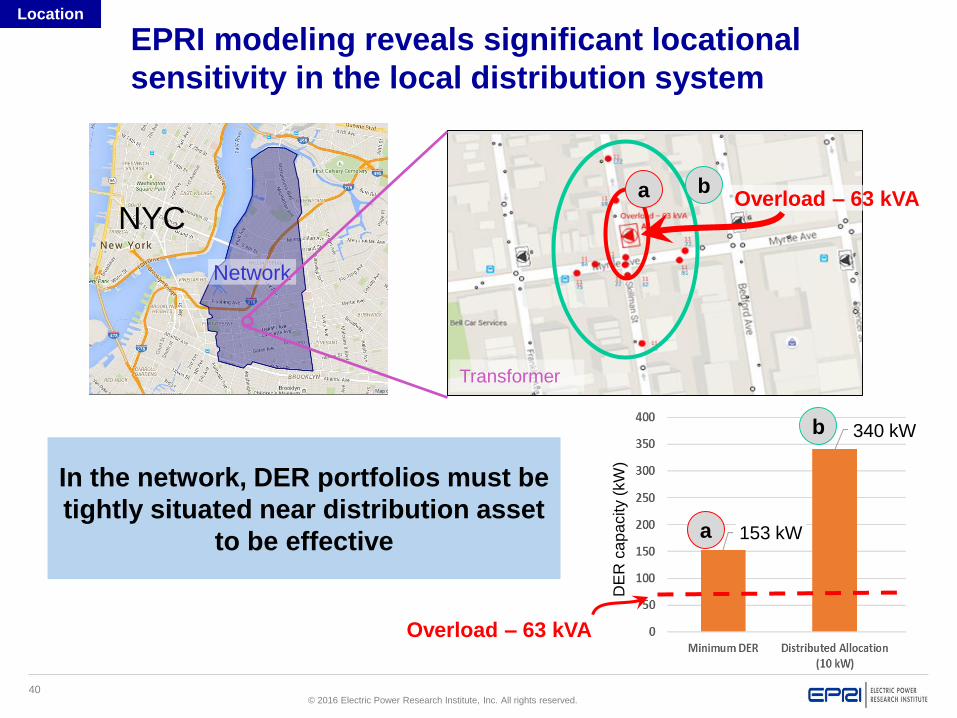
40© 2016 Electric Power Research Institute, Inc. All rights reserved.
EPRI modeling reveals significant locational
sensitivity in the local distribution system
340 kW
Network
Transformer
a
b
a b
DE
R c
ap
acity (
kW
)
NYCOverload – 63 kVA
In the network, DER portfolios must be
tightly situated near distribution asset
to be effective
Overload – 63 kVA
153 kW
Location

41© 2016 Electric Power Research Institute, Inc. All rights reserved.
Modeling and
Analysis Outputs
Economic
Analysis Outputs
Capacity upgrade
deferral ($)
Capital costs for
integration ($)
Change in O&M
expenses ($) and
shortened asset life
Distribution energy
losses (kW, kWh)
Distribution
($/kWhgen)
Distribution losses
(marginal – $/kWh)
Capacity requirement
(load shape changes)
Voltage regulation
Switched capacitor, tap
changer and regulator
operations
Protection
Capacity upgrades
Capacity
Deferral
($/kWhgen)
System
Losses
($/kWhgen)
Cost Normalized to
DER Energy Production
Mitigation
($/kWhgen)
Benefit/Cost Analysis Considerations: Normalizing
Earlier studies of the cost of DER accommodation
normalized cost over DER Energy Production.
42© 2016 Electric Power Research Institute, Inc. All rights reserved.
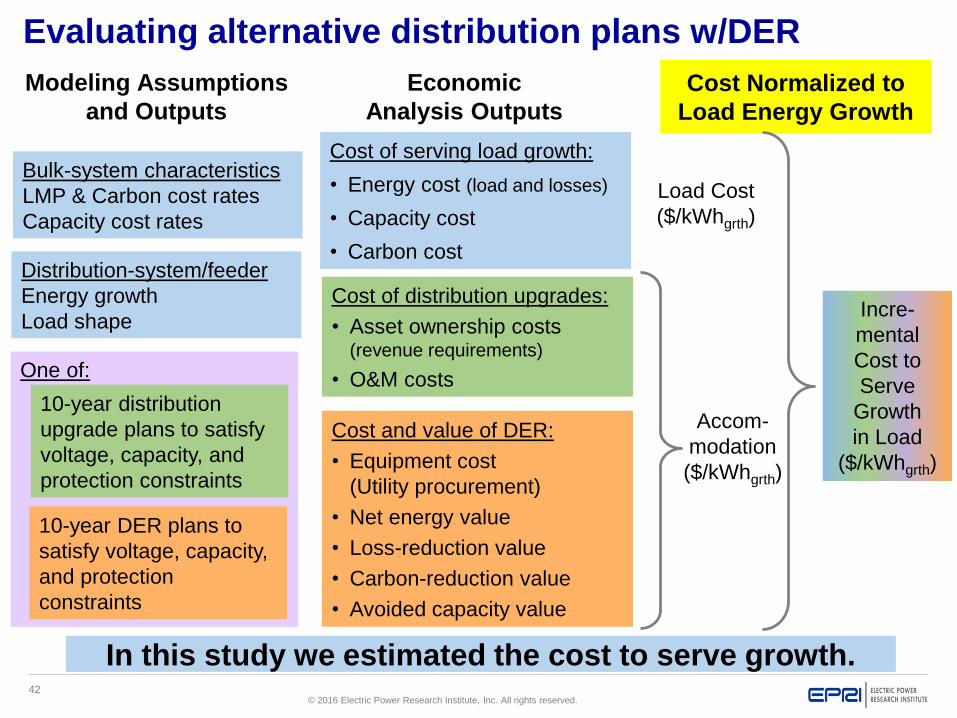
Evaluating alternative distribution plans w/DER
Modeling Assumptions
and Outputs
Economic
Analysis Outputs
Distribution-system/feeder
Energy growth
Load shape
One of:
10-year distribution
upgrade plans to satisfy
voltage, capacity, and
protection constraints
Load Cost
($/kWhgrth)
Incre-
mental
Cost to
Serve
Growth
in Load
($/kWhgrth)
Cost Normalized to
Load Energy Growth
Accom-
modation
($/kWhgrth)
Cost of serving load growth:
• Energy cost (load and losses)
• Capacity cost
• Carbon cost
Cost of distribution upgrades:
• Asset ownership costs(revenue requirements)
• O&M costs
Cost and value of DER:
• Equipment cost
(Utility procurement)
• Net energy value
• Loss-reduction value
• Carbon-reduction value
• Avoided capacity value
10-year DER plans to
satisfy voltage, capacity,
and protection
constraints
Bulk-system characteristics
LMP & Carbon cost rates
Capacity cost rates
In this study we estimated the cost to serve growth.
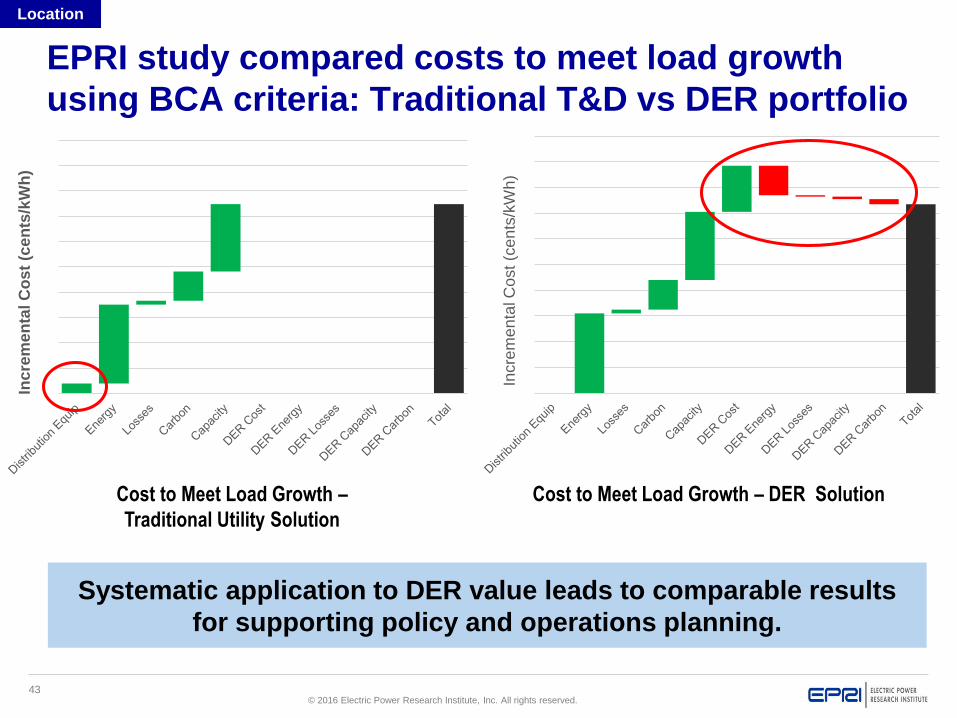
43© 2016 Electric Power Research Institute, Inc. All rights reserved.
EPRI study compared costs to meet load growth
using BCA criteria: Traditional T&D vs DER portfolio
Cost to Meet Load Growth –
Traditional Utility Solution
Cost to Meet Load Growth – DER SolutionIn
cre
me
nta
l C
ost
(ce
nts
/kW
h)
Inc
rem
en
tal C
os
t (c
en
ts/k
Wh
)
Systematic application to DER value leads to comparable results
for supporting policy and operations planning.
Location
44© 2016 Electric Power Research Institute, Inc. All rights reserved.
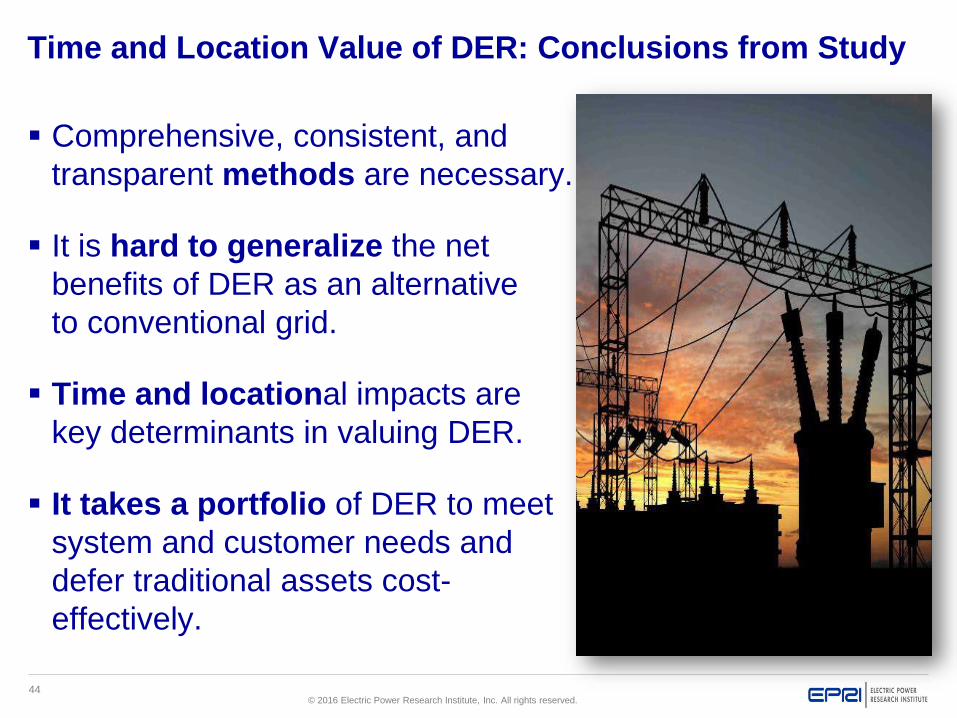
Time and Location Value of DER: Conclusions from Study
Comprehensive, consistent, and
transparent methods are necessary.
It is hard to generalize the net
benefits of DER as an alternative
to conventional grid.
Time and locational impacts are
key determinants in valuing DER.
It takes a portfolio of DER to meet
system and customer needs and
defer traditional assets cost-
effectively.

© 2016 Electric Power Research Institute, Inc. All rights reserved.
Jeff Roark
Technical Executive
Steven Coley
Sr. Project Engineer
Examining Utility Fixed
and Variable Cost
Pathways with
Increasing DER Growth

46© 2016 Electric Power Research Institute, Inc. All rights reserved.
Examining Utility Fixed and Variable Cost Pathways
with Increasing DER Growth
Assessment of utility fixed and variable costs, the factors which affect those costs,
changes in utility costs over time, and observations about avoidable cost differences
among different types of utilities.
Scope
• Illustrate the range in fixed and variable
cost components for a variety of U.S.
utilities using publicly available data.
• Discuss impacts of market structures
on cost characteristics that affect
DER benefit-cost studies.
Value
• Perspective on the economics of
DER adoption that can inform
grid integration benefit-cost studies.
Delivery Type / Date
• White paper, Q3
Source: FERC Form 1 filings
Dist
Xmsn
A&G
Fixed Gen Variable Cost
0 5 10 15 20 25
Utility 1
Utility 2
Utility 3
Utility 4
Utility 5
Utility 6
Utility 7
Utility 8
Utility 9
Utility 10
Utility 11
Utility 12
Utility 13
Utility 14
Utility 15
Utility 16
Utility 17
Utility 18
Utility 19
Utility 20
Utility 21
Utility 22
Utility 23
Utility 24
Components of Fixed and Variable Cost, ȼ/kWh
Distribution Transmission A&G Fixed Generation Variable Production Cost
Illustrative
Results
Variable CostsFixed Costs
47© 2016 Electric Power Research Institute, Inc. All rights reserved.
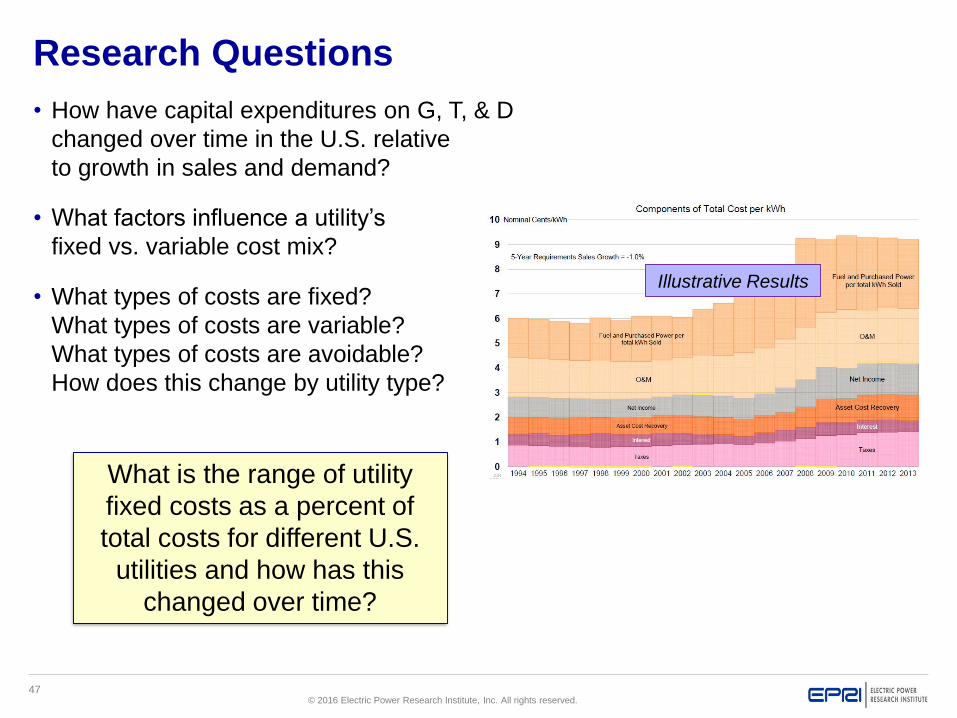
Research Questions
• How have capital expenditures on G, T, & D
changed over time in the U.S. relative
to growth in sales and demand?
• What factors influence a utility’s
fixed vs. variable cost mix?
• What types of costs are fixed?
What types of costs are variable?
What types of costs are avoidable?
How does this change by utility type?
What is the range of utility
fixed costs as a percent of
total costs for different U.S.
utilities and how has this
changed over time?
Illustrative Results
48© 2016 Electric Power Research Institute, Inc. All rights reserved.
Factors Affecting a Utility’s Fixed vs. Variable Cost Mix
Definition: Variable cost = varies with “output”
Under this cost-accounting definition,
– Variable cost for a utility is almost totally fuel cost or purchased power.
This is not “opex” versus “capex.”*
– Generation/supply decisions directly tradeoff fixed and variable costs;
other decisions don’t.
By this definition, everything that is not variable is fixed cost.
Utilities had different paths through history:
Planning alternatives and economics varied from region to region:
Fuel Costs (affected by availability, transportation)
Load shape: Peak Demand and Load Factor
Terrain, environmental sensitivity/constraints
– In reality, economic landscapes shift: optimal mix is a moving target.
Each utility’s composition of cost is a legacy of decisions past
and world/industry events, such as market restructuring.* capex = capital expenditures, opex = operating cost, or O&M
49© 2016 Electric Power Research Institute, Inc. All rights reserved.
How fixed is fixed cost?
Revenue requirements for existing assets are fixed,
but decline in time by depreciation.
– Other utility costs are subject to change in time.
Revenue requirements for planned assets can be altered
by changing plans.
– Avoidable Cost: Cost that a utility or its customers can avoid paying
– Deferrable Cost: Cost that can be temporary avoided
In benefit/cost analysis, avoided and deferred costs
are often important sources of value.
Avoided energy costs are often a valuable component,
but what “energy cost” includes depends on the kind of utility
and the market structure under study.
50© 2016 Electric Power Research Institute, Inc. All rights reserved.
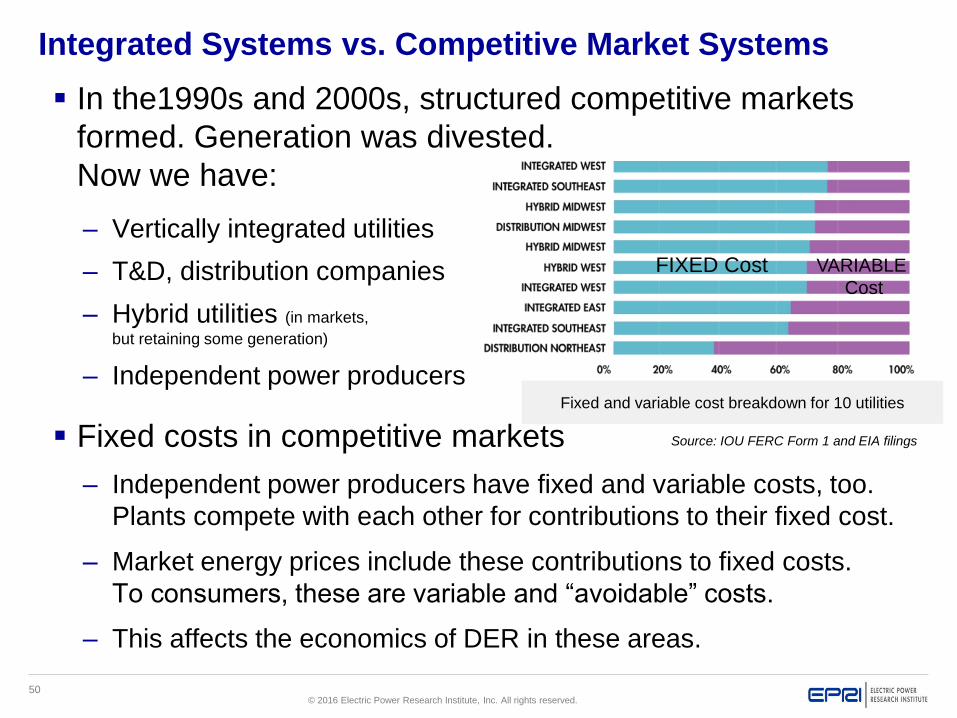
In the1990s and 2000s, structured competitive markets
formed. Generation was divested.
Now we have:
– Vertically integrated utilities
– T&D, distribution companies
– Hybrid utilities (in markets,
but retaining some generation)
– Independent power producers
Fixed costs in competitive markets
– Independent power producers have fixed and variable costs, too.
Plants compete with each other for contributions to their fixed cost.
– Market energy prices include these contributions to fixed costs.
To consumers, these are variable and “avoidable” costs.
– This affects the economics of DER in these areas.
Fixed and variable cost breakdown for 10 utilities
FIXED Cost VARIABLE
Cost
Integrated Systems vs. Competitive Market Systems
Source: IOU FERC Form 1 and EIA filings
51© 2016 Electric Power Research Institute, Inc. All rights reserved.
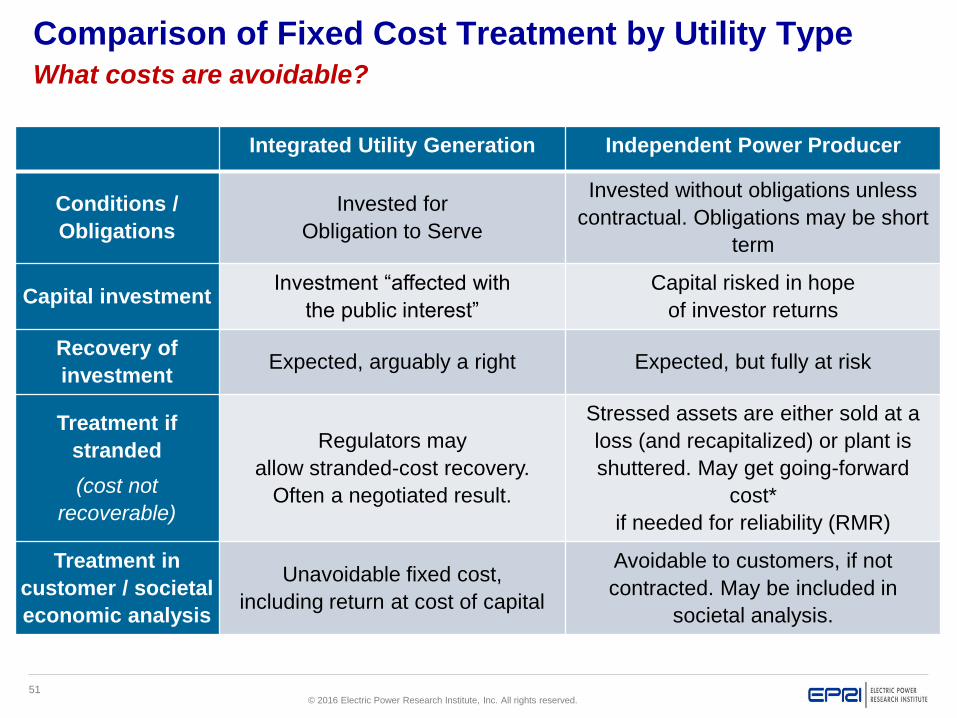
Comparison of Fixed Cost Treatment by Utility Type
What costs are avoidable?
Integrated Utility Generation Independent Power Producer
Conditions /
Obligations
Invested for
Obligation to Serve
Invested without obligations unless
contractual. Obligations may be short
term
Capital investmentInvestment “affected with
the public interest”
Capital risked in hope
of investor returns
Recovery of
investmentExpected, arguably a right Expected, but fully at risk
Treatment if
stranded
(cost not
recoverable)
Regulators may
allow stranded-cost recovery.
Often a negotiated result.
Stressed assets are either sold at a
loss (and recapitalized) or plant is
shuttered. May get going-forward
cost*
if needed for reliability (RMR)
Treatment in
customer / societal
economic analysis
Unavoidable fixed cost,
including return at cost of capital
Avoidable to customers, if not
contracted. May be included in
societal analysis.
52© 2016 Electric Power Research Institute, Inc. All rights reserved.
Questions?
© 2016 Electric Power Research Institute, Inc. All rights reserved.
Nadav Enbar
Principal Project Manager
A Look Ahead:
Proposed 2017
Portfolio

54© 2016 Electric Power Research Institute, Inc. All rights reserved.
A Look Back: Research Roadmap
2011
2015
Utility Solar Business Models
PV Market Trends / Analysis
PV Grid Integration
PV Plant Performance
PV O&M
White paper
strategies
Case studies
PVROM
PV Plant Monitoring &
Analysis
Variability & performance
• 1-10MW
• 10-20MW
• 20MW+
Economics of PV
variability
To P193
To P193
Hi Pen PV
Definition & framework
Case studies
Integrated Grid CBA
• Feeder
• System-wide
Market Adoption
Econ adoption
tool
Adoption primer
PV price parity
USBM
Framework
Case studies
Utility-TPO partnership
PV ownership
NEM reform
Smart inverter roll out & readiness
PV Mkt Update
PV CAPEX / OPEX
Policy / Regulatory
analysis
Standards
Q&A
Tech spotlight

55© 2016 Electric Power Research Institute, Inc. All rights reserved.
The Way Forward
2016 Beyond
Utility DER Business Models
PV Market Trends / Analysis
DER Grid Integration
Value
Conceptual, Predominately Qualitative, Case Studies
Impact Analyses (CBA), Forecasting, Strategic Planning
Data Driven, Qual/Quant Analyses, Perspectives
56© 2016 Electric Power Research Institute, Inc. All rights reserved.
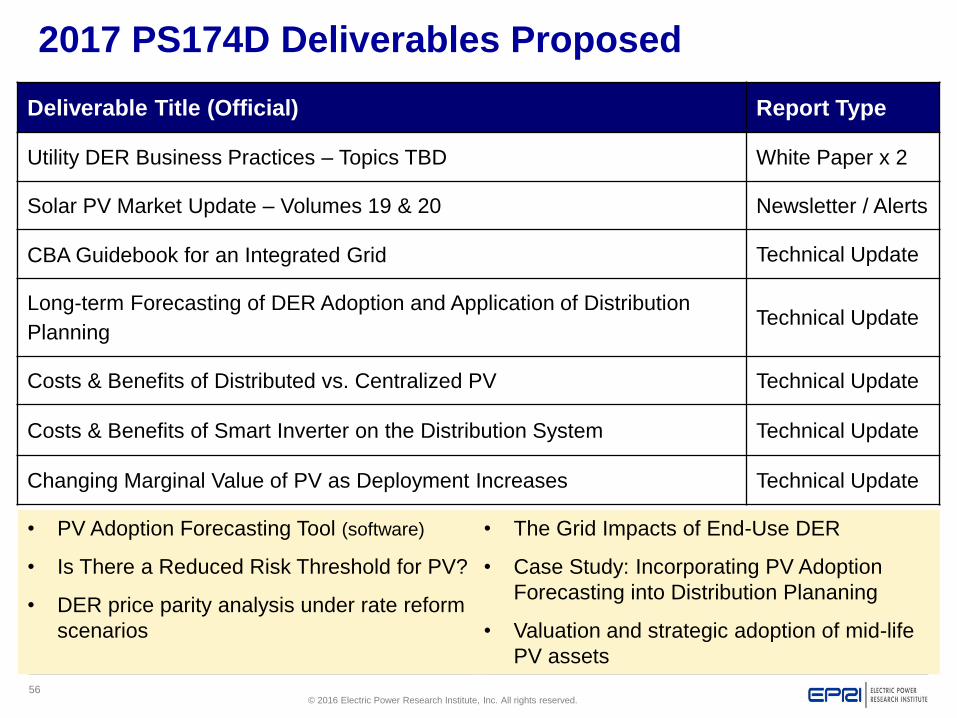
2017 PS174D Deliverables Proposed
Deliverable Title (Official) Report Type
Utility DER Business Practices – Topics TBD White Paper x 2
Solar PV Market Update – Volumes 19 & 20 Newsletter / Alerts
CBA Guidebook for an Integrated Grid Technical Update
Long-term Forecasting of DER Adoption and Application of Distribution
PlanningTechnical Update
Costs & Benefits of Distributed vs. Centralized PV Technical Update
Costs & Benefits of Smart Inverter on the Distribution System Technical Update
Changing Marginal Value of PV as Deployment Increases Technical Update
• PV Adoption Forecasting Tool (software)
• Is There a Reduced Risk Threshold for PV?
• DER price parity analysis under rate reform
scenarios
• The Grid Impacts of End-Use DER
• Case Study: Incorporating PV Adoption
Forecasting into Distribution Plananing
• Valuation and strategic adoption of mid-life
PV assets
57© 2016 Electric Power Research Institute, Inc. All rights reserved.
Together…Shaping the Future of Electricity
Nadav Enbar
Principal Project Manager
303.551.5208
Thank You
Steven Coley
Sr. Project Engineer
615.542.2882
Jeff Roark
Principal Technical Leader
650.855.8783

58© 2016 Electric Power Research Institute, Inc. All rights reserved.
Appendix

59© 2016 Electric Power Research Institute, Inc. All rights reserved.
DER Proceedings are Proliferating in More Than
20 States
60© 2016 Electric Power Research Institute, Inc. All rights reserved.
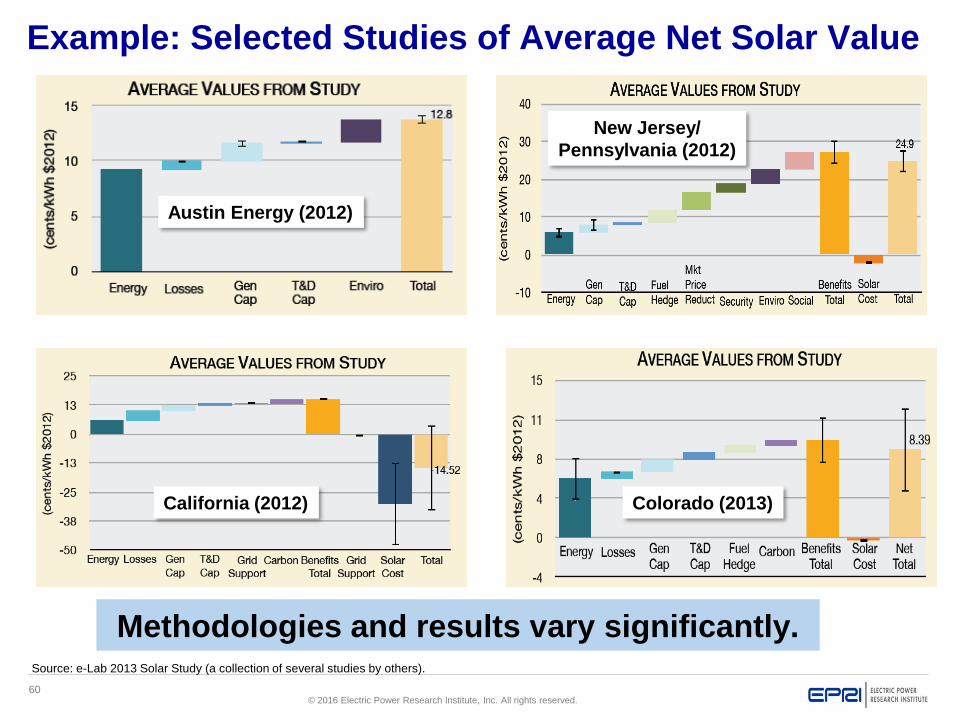
Example: Selected Studies of Average Net Solar Value
Colorado (2013)
Source: e-Lab 2013 Solar Study (a collection of several studies by others).
Methodologies and results vary significantly.
Austin Energy (2012)
New Jersey/
Pennsylvania (2012)
California (2012)

61© 2016 Electric Power Research Institute, Inc. All rights reserved.
Overview of Distribution Planning Process
Develop Forecast
Determine Capacity
Requirements
Evaluate Alternatives
Establish baseline assumptions:
Future load growth and loading profiles
DER growth
Distribution deployment plans
Assess distribution requirements:
Meet projected load and DER growth
Maintain safety and reliability for end users
Address grid needs:
Traditional utility solutions
DER solutions
Process identifies projected distribution capacity
deficiencies and plans to address projected deficiencies.
62© 2016 Electric Power Research Institute, Inc. All rights reserved.
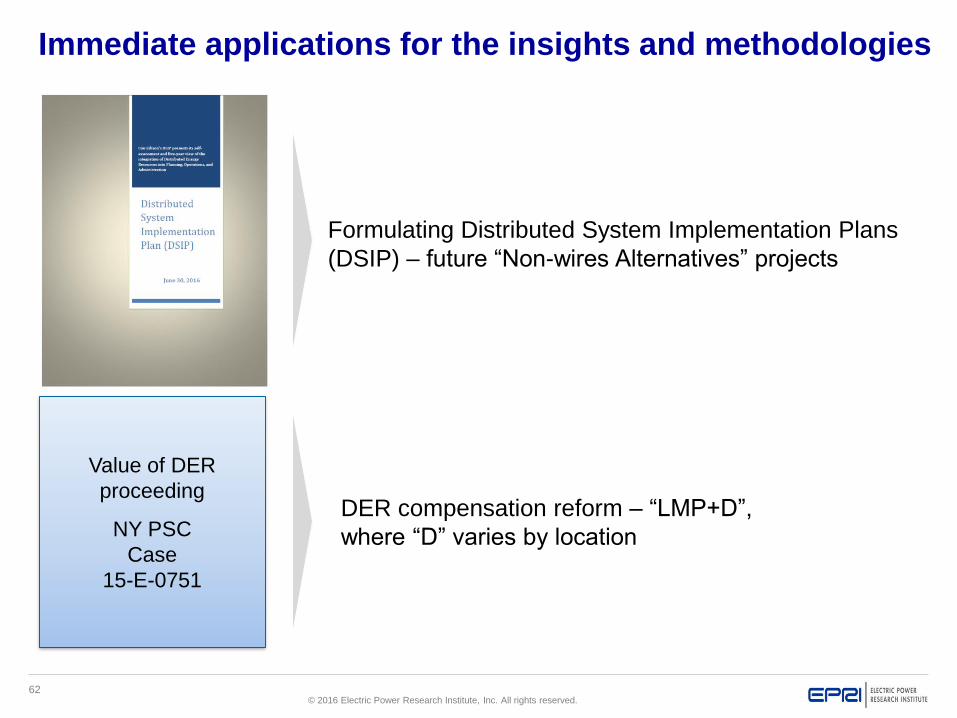
Immediate applications for the insights and methodologies
Value of DER
proceeding
NY PSC
Case
15-E-0751
Formulating Distributed System Implementation Plans
(DSIP) – future “Non-wires Alternatives” projects
DER compensation reform – “LMP+D”,
where “D” varies by location


![WELCOME [] DER Webinar V3 plain.pdfb) Better Balancing Authority and Regulator and interaction c) Better incorporation of DER technologies such as storage, microgrids, waste to energy,](https://img.pdfslide.us/doc/110x75/5f267bb1f00b4405bc4440aa/welcome-der-webinar-v3-plainpdf-b-better-balancing-authority-and-regulator.jpg)