Embed Size (px)
Citation preview
Integrating electricity balancing markets in
Europe: opportunities and
constraints
Utility Week, Amsterdam 4th November 2014
Gianluigi Migliavacca
Contents
• Why is reserve needed
• Different kinds of reserve
• Balancing and reserve procurement within the “target model”
• Advantages and criticalities of trans-national balancing
• Regulatory context
• Presentation eBADGE simulator
• Presentation of some scenario simulation results
Why is reserve needed?
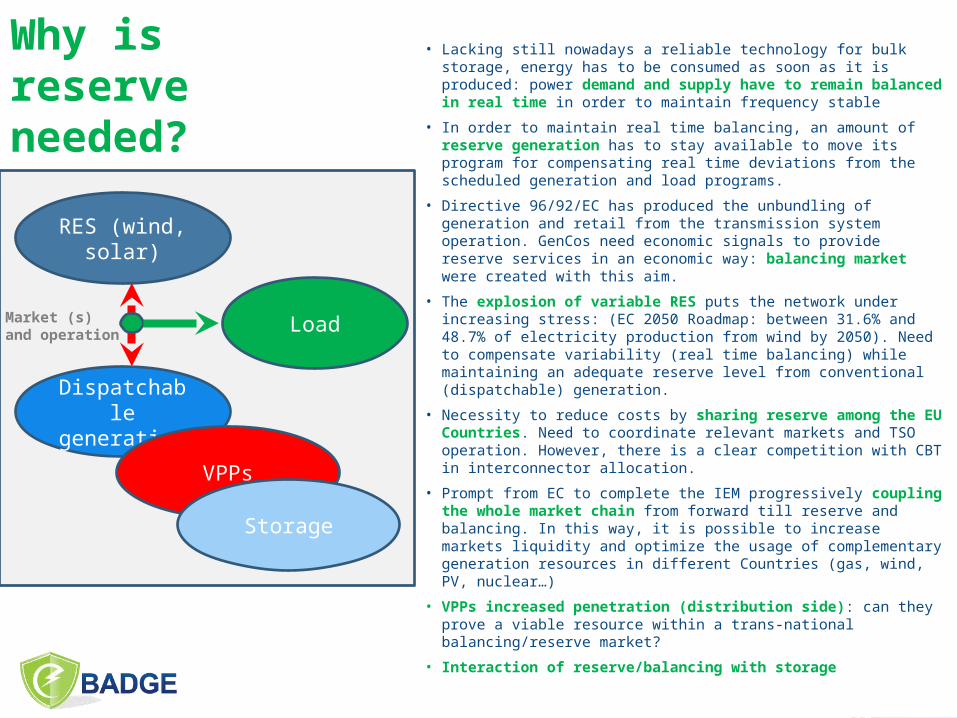
• Lacking still nowadays a reliable technology for bulk storage, energy has to be consumed as soon as it is produced: power demand and supply have to remain balanced in real time in order to maintain frequency stable
• In order to maintain real time balancing, an amount of reserve generation has to stay available to move its program for compensating real time deviations from the scheduled generation and load programs.
• Directive 96/92/EC has produced the unbundling of generation and retail from the transmission system operation. GenCos need economic signals to provide reserve services in an economic way: balancing market were created with this aim.
• The explosion of variable RES puts the network under increasing stress: (EC 2050 Roadmap: between 31.6% and 48.7% of electricity production from wind by 2050). Need to compensate variability (real time balancing) while maintaining an adequate reserve level from conventional (dispatchable) generation.
• Necessity to reduce costs by sharing reserve among the EU Countries. Need to coordinate relevant markets and TSO operation. However, there is a clear competition with CBT in interconnector allocation.
• Prompt from EC to complete the IEM progressively coupling the whole market chain from forward till reserve and balancing. In this way, it is possible to increase markets liquidity and optimize the usage of complementary generation resources in different Countries (gas, wind, PV, nuclear…)
• VPPs increased penetration (distribution side): can they prove a viable resource within a trans-national balancing/reserve market?
• Interaction of reserve/balancing with storage
RES (wind, solar)
Dispatchable generation
Load
VPPs
Storage
Market (s) and operation
Different kinds of reserve
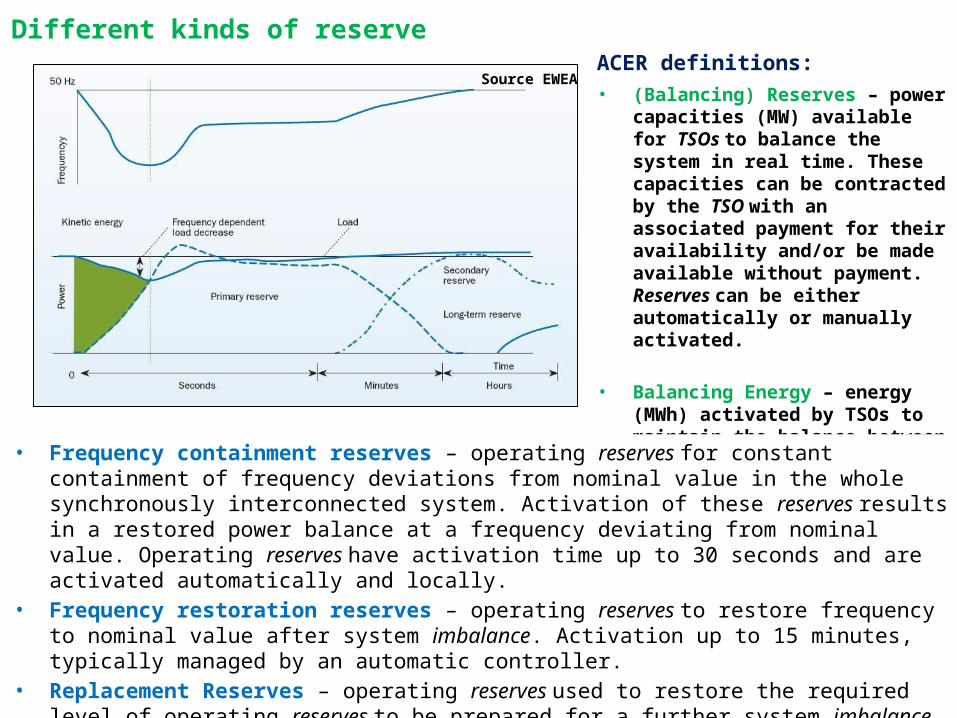
Source EWEAACER definitions:
• (Balancing) Reserves – power capacities (MW) available for TSOs to balance the system in real time. These capacities can be contracted by the TSO with an associated payment for their availability and/or be made available without payment. Reserves can be either automatically or manually activated.
• Balancing Energy – energy (MWh) activated by TSOs to maintain the balance between injections and withdrawals.
• Frequency containment reserves – operating reserves for constant containment of frequency deviations from nominal value in the whole synchronously interconnected system. Activation of these reserves results in a restored power balance at a frequency deviating from nominal value. Operating reserves have activation time up to 30 seconds and are activated automatically and locally.
• Frequency restoration reserves – operating reserves to restore frequency to nominal value after system imbalance. Activation up to 15 minutes, typically managed by an automatic controller.
• Replacement Reserves – operating reserves used to restore the required level of operating reserves to be prepared for a further system imbalance. This category includes operating reserves with activation time from 15 minutes up to hours. They may be contracted or subject to market.
A “target model” for the EU market design
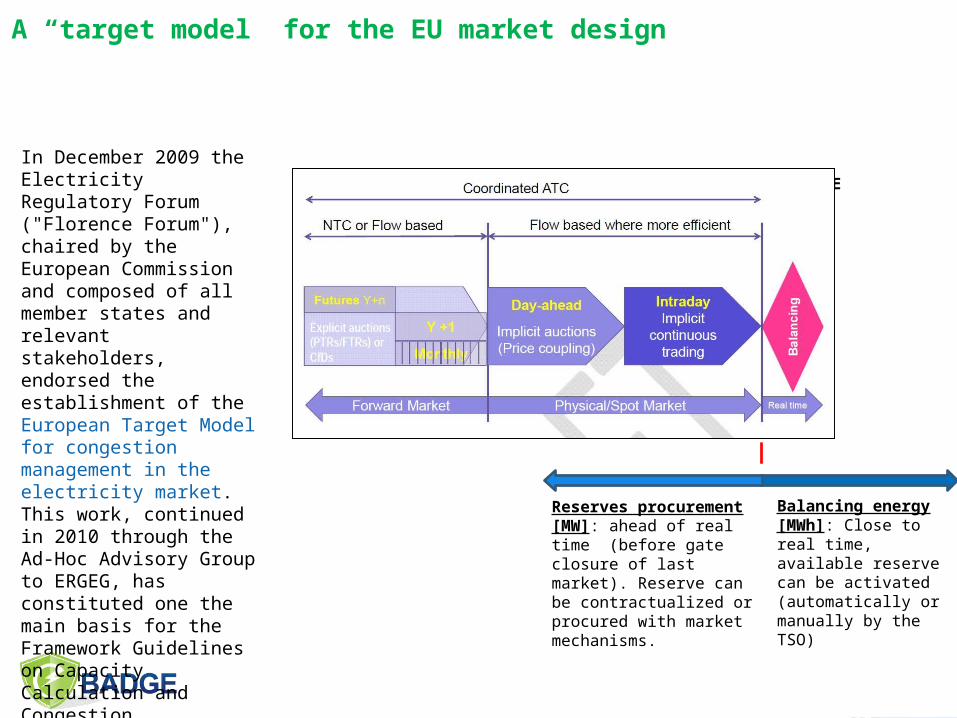
In December 2009 the Electricity Regulatory Forum ("Florence Forum"), chaired by the European Commission and composed of all member states and relevant stakeholders, endorsed the establishment of the European Target Model for congestion management in the electricity market. This work, continued in 2010 through the Ad-Hoc Advisory Group to ERGEG, has constituted one the main basis for the Framework Guidelines on Capacity Calculation and Congestion Management.
Source ENTSO-E
Reserves procurement [MW]: ahead of real time (before gate closure of last market). Reserve can be contractualized or procured with market mechanisms.
Balancing energy [MWh]: Close to real time, available reserve can be activated (automatically or manually by the TSO)
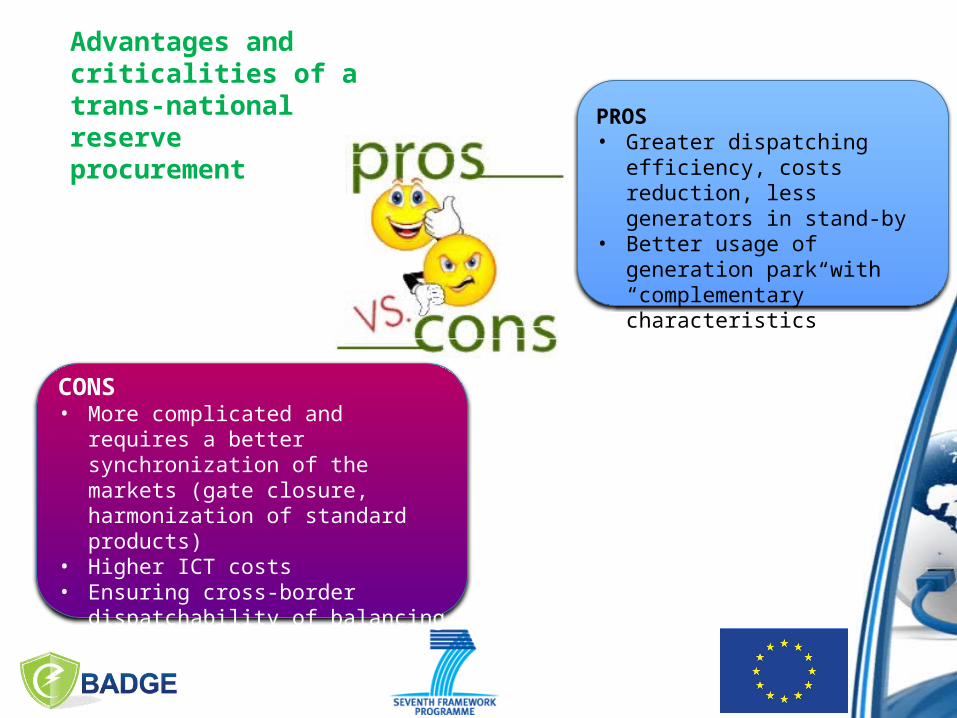
Advantages and criticalities of a trans-national reserve procurement
CONS• More complicated and requires a better
synchronization of the markets (gate closure, harmonization of standard products)
• Higher ICT costs• Ensuring cross-border dispatchability
of balancing orders can be non-obvious
PROS• Greater dispatching efficiency,
costs reduction, less generators in stand-by
• Better usage of generation park with “complementary” characteristics
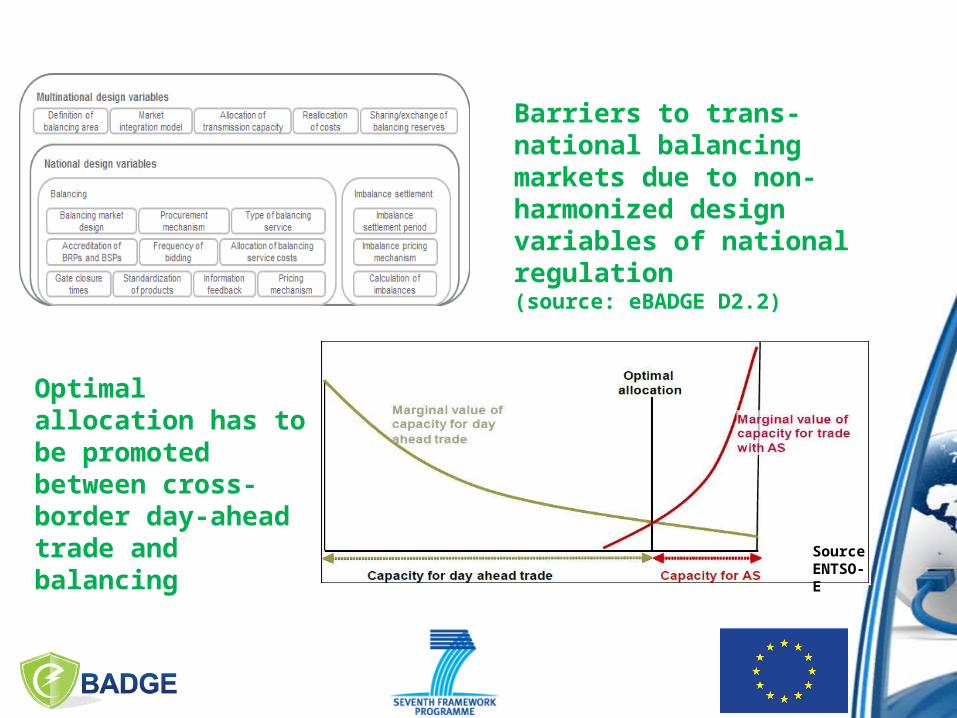
Barriers to trans-national balancing markets due to non-harmonized design variables of national regulation (source: eBADGE D2.2)
Source ENTSO-E
Optimal allocation has to be promotedbetween cross-border day-ahead trade and balancing
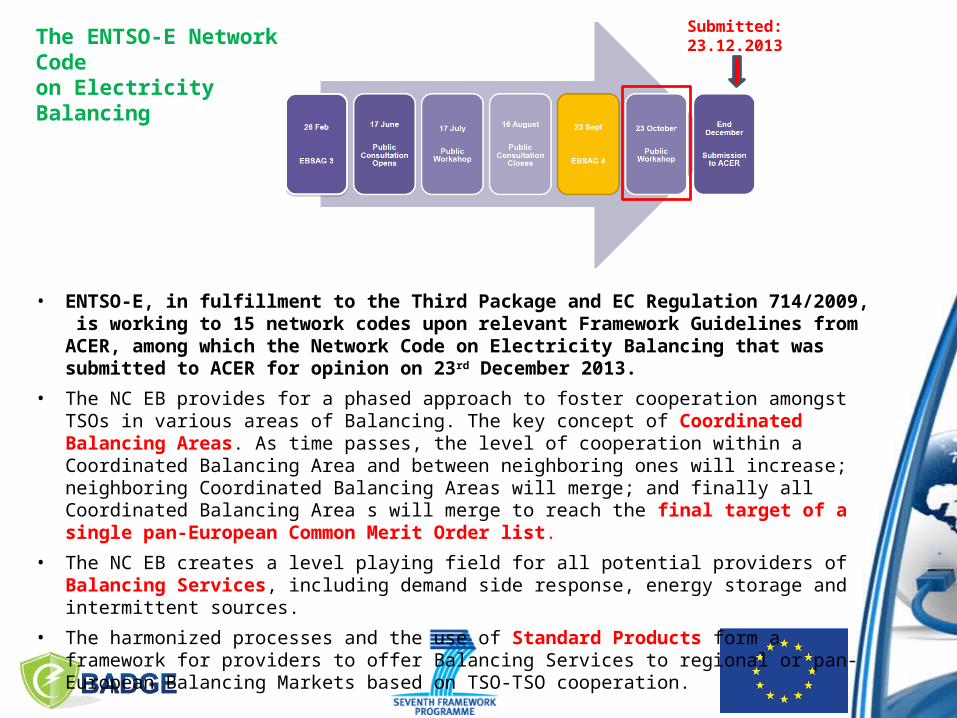
Submitted: 23.12.2013
• ENTSO-E, in fulfillment to the Third Package and EC Regulation 714/2009, is working to 15 network codes upon relevant Framework Guidelines from ACER, among which the Network Code on Electricity Balancing that was submitted to ACER for opinion on 23rd December 2013.
• The NC EB provides for a phased approach to foster cooperation amongst TSOs in various areas of Balancing. The key concept of Coordinated Balancing Areas. As time passes, the level of cooperation within a Coordinated Balancing Area and between neighboring ones will increase; neighboring Coordinated Balancing Areas will merge; and finally all Coordinated Balancing Area s will merge to reach the final target of a single pan-European Common Merit Order list.
• The NC EB creates a level playing field for all potential providers of Balancing Services, including demand side response, energy storage and intermittent sources.
• The harmonized processes and the use of Standard Products form a framework for providers to offer Balancing Services to regional or pan-European Balancing Markets based on TSO-TSO cooperation.
The ENTSO-E Network Code on Electricity Balancing
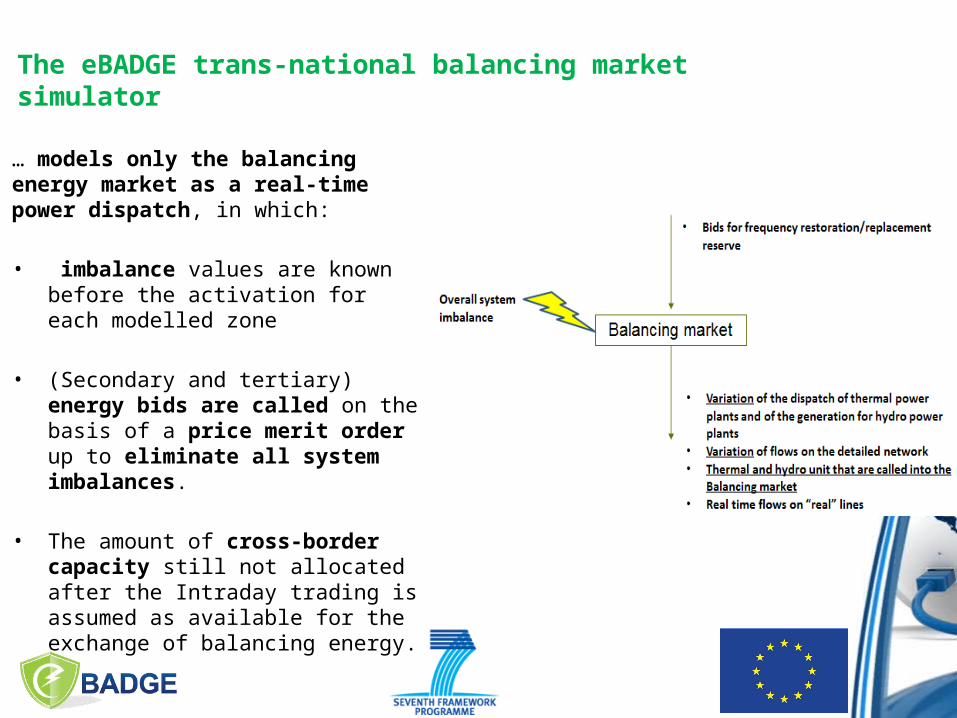
The eBADGE trans-national balancing market simulator
… models only the balancing energy market as a real-time power dispatch, in which:
• imbalance values are known before the activation for each modelled zone
• (Secondary and tertiary) energy bids are called on the basis of a price merit order up to eliminate all system imbalances.
• The amount of cross-border capacity still not allocated after the Intraday trading is assumed as available for the exchange of balancing energy.
Features of the simulator: (1) based on historical bids
After an in-depth analysis, it was decided to assume both historical balancing bids and historical imbalance figures as known data to be used as an input for the simulation.
Pros: historical data naturally incorporate real system characteristics.
Cons: difficulty of finding all data and national market characteristics. The presence in our consortium of TSO helped in solving a lot of problems (data incongruences, etc.).
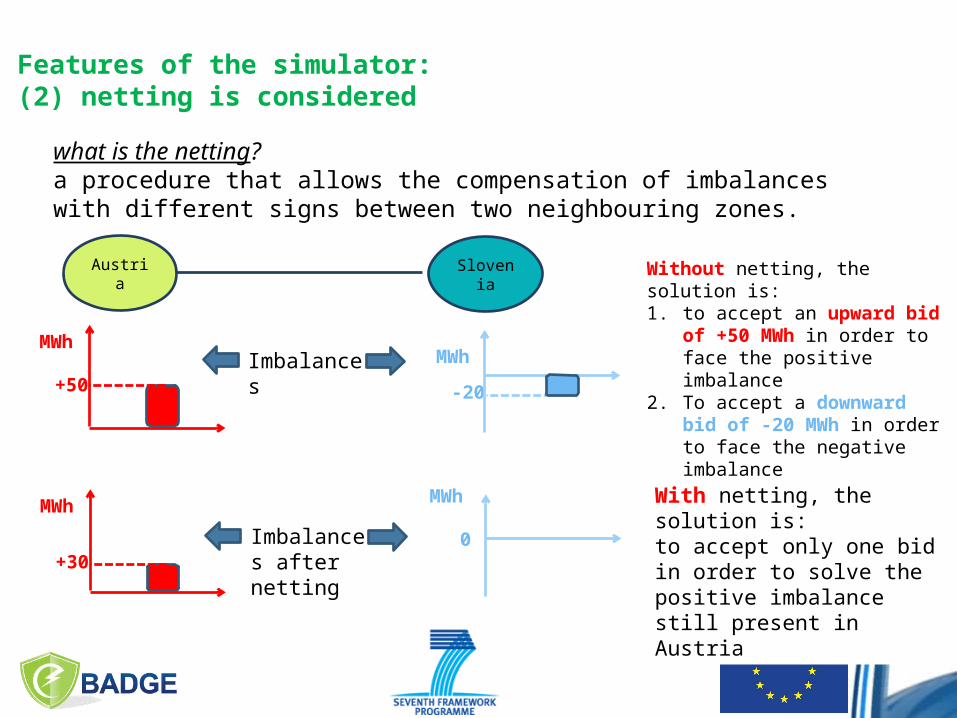
Features of the simulator: (2) netting is considered
what is the netting?a procedure that allows the compensation of imbalances with different signs between two neighbouring zones.
SloveniaAustria
ImbalancesMWh
+50MWh
-20
Without netting, the solution is:1. to accept an upward bid of
+50 MWh in order to face the positive imbalance
2. To accept a downward bid of -20 MWh in order to face the negative imbalance
Imbalances after netting
MWh
0
MWh
+30
With netting, the solution is:to accept only one bid in order to solve the positive imbalance still present in Austria
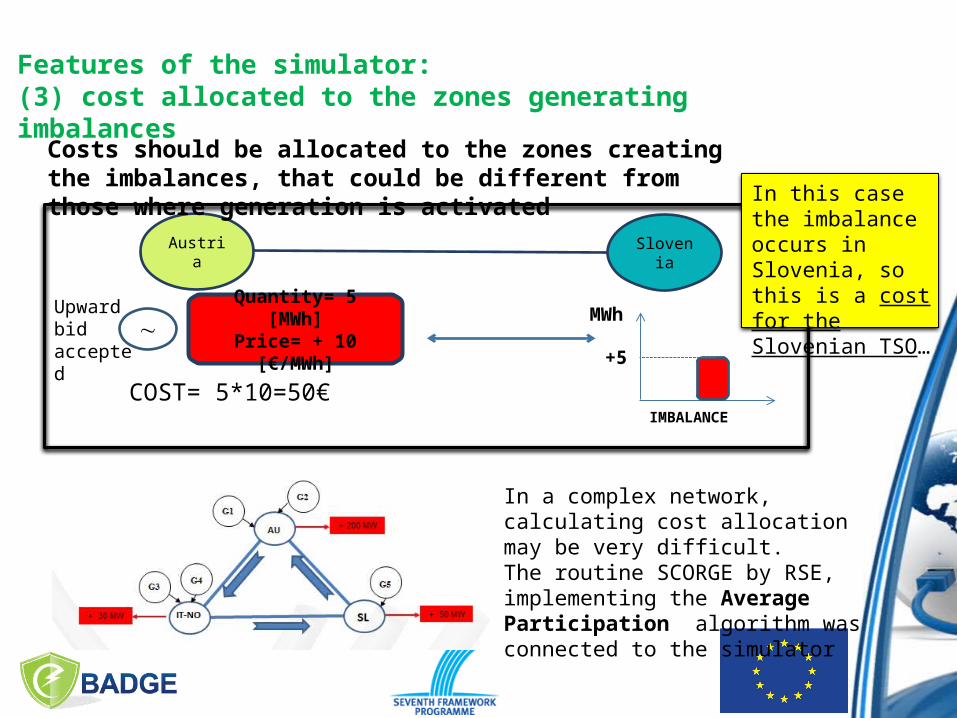
Features of the simulator: (3) cost allocated to the zones generating imbalances
SloveniaAustria
Quantity= 5 [MWh]Price= + 10 [€/MWh]
COST= 5*10=50€
Upward bid accepted
MWh
+5
IMBALANCE
Costs should be allocated to the zones creating the imbalances, that could be different from those where generation is activated
In this case the imbalance occurs in Slovenia, so this is a cost for the Slovenian TSO…
In a complex network, calculating cost allocation may be very difficult.The routine SCORGE by RSE, implementing the Average Participation algorithm was connected to the simulator
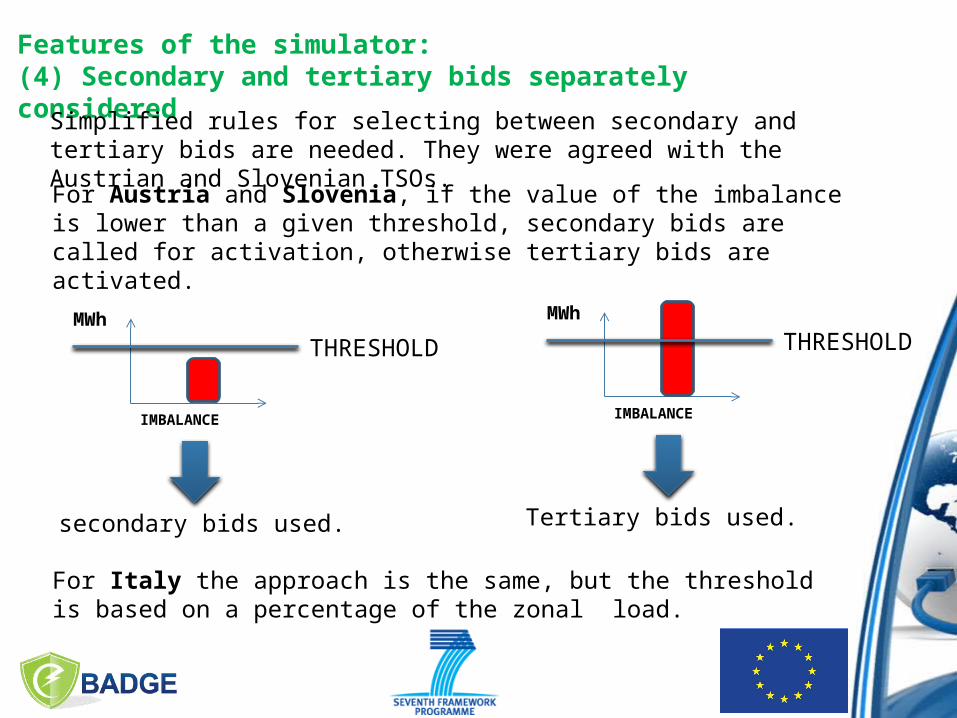
Features of the simulator: (4) Secondary and tertiary bids separately consideredSimplified rules for selecting between secondary and tertiary bids are needed.
They were agreed with the Austrian and Slovenian TSOs.
For Austria and Slovenia, if the value of the imbalance is lower than a given threshold, secondary bids are called for activation, otherwise tertiary bids are activated.
MWh
IMBALANCE
THRESHOLD
secondary bids used.
MWh
IMBALANCE
THRESHOLD
Tertiary bids used.
For Italy the approach is the same, but the threshold is based on a percentage of the zonal load.
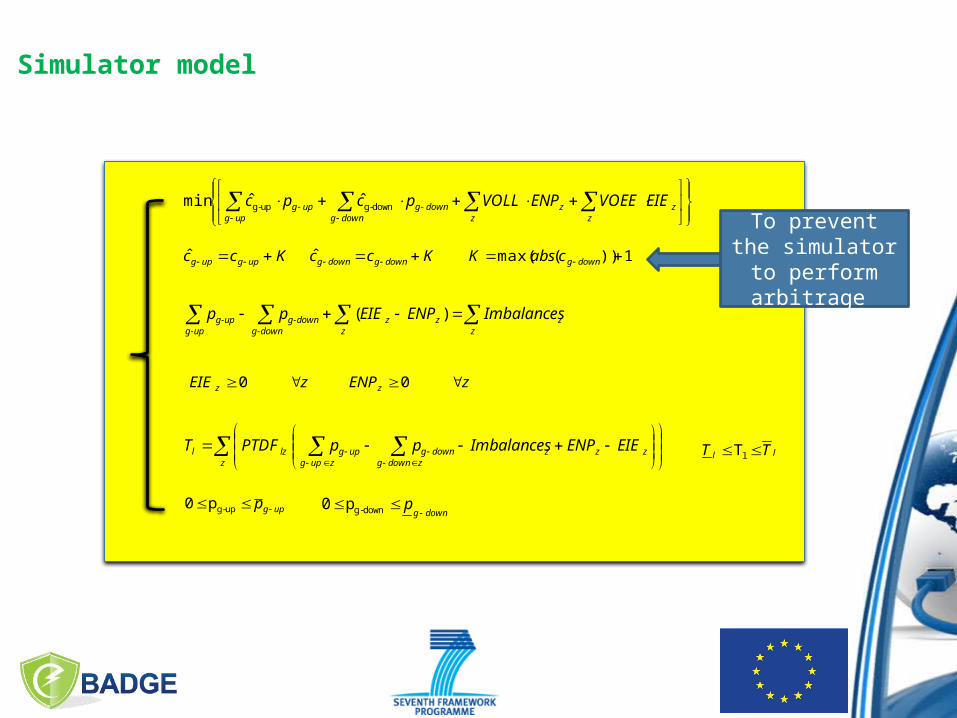
Simulator model
ˆ ˆmin down-gup-g
z
zzz
downgdowng
upgupg EIEVOEEENPVOLLpcpc
Kcc upgupg ˆ Kcc downgdowng ˆ 1))(max( downgcabsK
z
zz
zzdown-g
down-gup-g
up-g ImbalancesENPEIEpp )(
zEIE z 0 zENPz 0
zzzz
z downgdowng
z upgupglzl EIEENPImbalancespp PTDFT
ll TT lT
upgp up-gp0downg
p
down-gp0
To prevent the simulator to
perform arbitrage
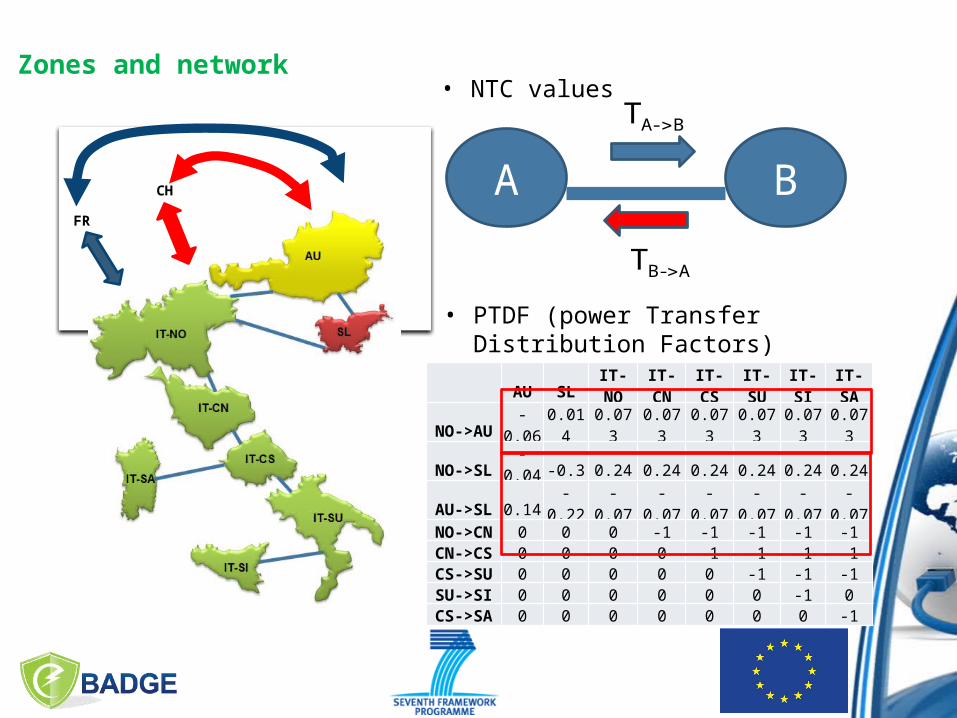
Zones and network
CH
FR
AU SL IT-NO IT-CN IT-CS IT-SU IT-SI IT-SANO->AU -0.06 0.014 0.073 0.073 0.073 0.073 0.073 0.073NO->SL -0.04 -0.3 0.24 0.24 0.24 0.24 0.24 0.24AU->SL 0.14 -0.22 -0.07 -0.07 -0.07 -0.07 -0.07 -0.07NO->CN 0 0 0 -1 -1 -1 -1 -1CN->CS 0 0 0 0 -1 -1 -1 -1CS->SU 0 0 0 0 0 -1 -1 -1SU->SI 0 0 0 0 0 0 -1 0CS->SA 0 0 0 0 0 0 0 -1
• NTC values
A B
BA-T
AB-T
• PTDF (power Transfer Distribution Factors)
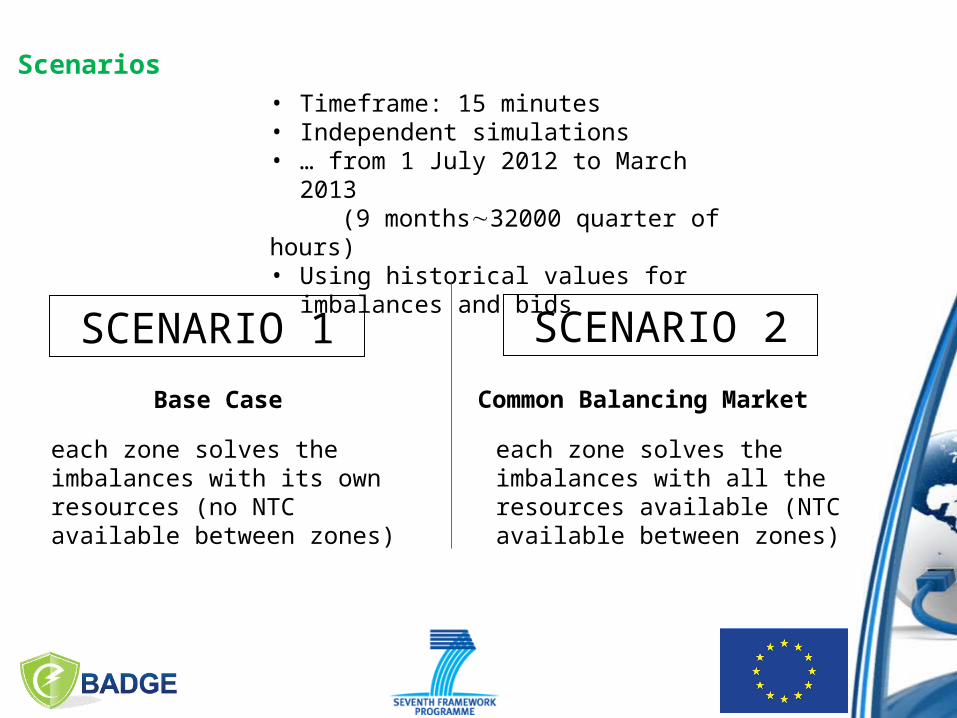
Scenarios• Timeframe: 15 minutes• Independent simulations• … from 1 July 2012 to March 2013 (9 months32000 quarter of hours)• Using historical values for imbalances
and bids
Base Case Common Balancing Market
each zone solves the imbalances with its own resources (no NTC available between zones)
each zone solves the imbalances with all the resources available (NTC available between zones)
SCENARIO 1 SCENARIO 2

RESULTS: Transits (GWh)
IT-SA
IT-CN
IT-NO
IT-CS
IT-SUIT-SI
AU
SL
Base Case Common Balancing Market
316
145264
101101
681611
687607
491460
182202
22699
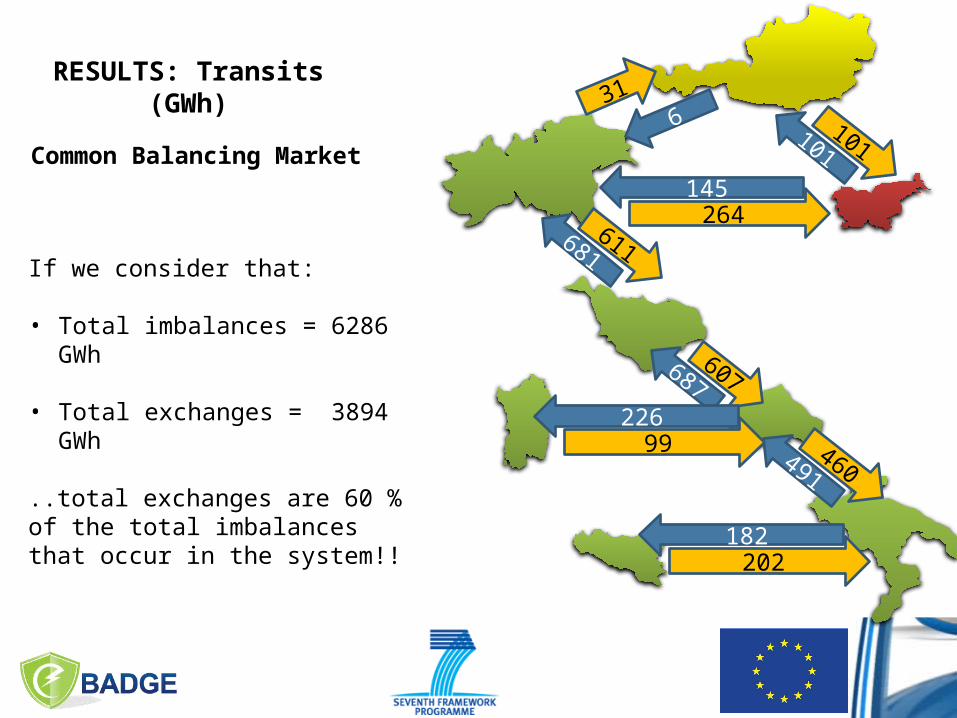
RESULTS: Transits (GWh)
Common Balancing Market
316
145264
101101
681611
687607
491460
182202
22699
If we consider that:
• Total imbalances = 6286 GWh
• Total exchanges = 3894 GWh
..total exchanges are 60 % of the total imbalances that occur in the system!!
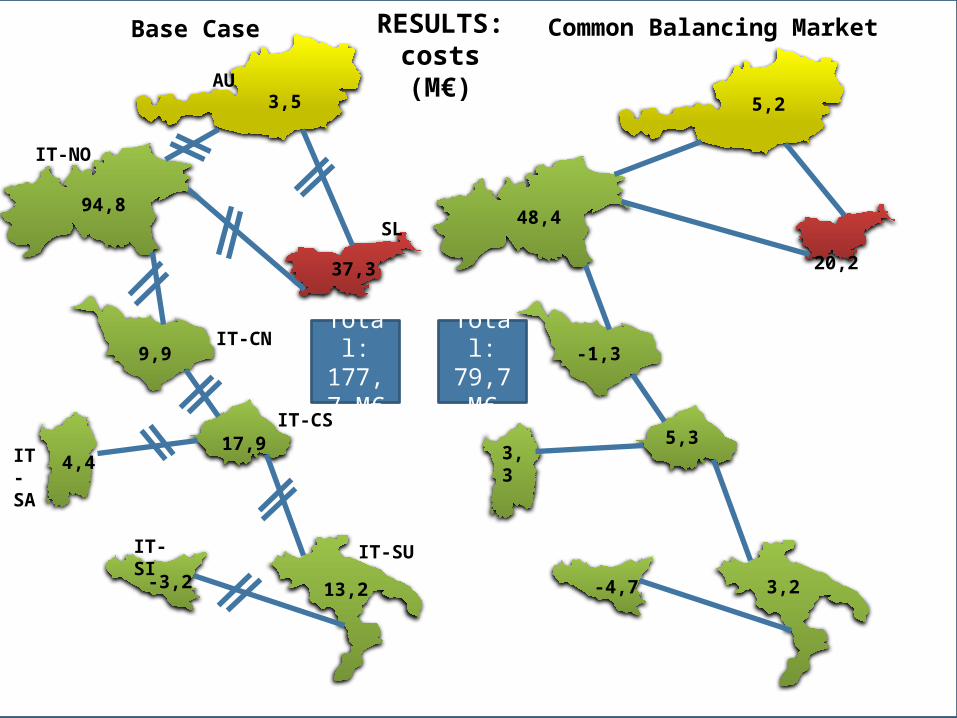
RESULTS: costs (M€)
IT-SA
IT-CN
IT-NO
IT-CS
IT-SUIT-SI
AU
SL
Base Case Common Balancing Market
3,3
-1,3
48,4
5,3
3,2-4,7
5,2
20,2
3,5
94,8
37,3
9,9
17,9
13,2 -3,2
4,4
Total:177,7 M€
Total:79,7M€
Conclusions
• Simulation results highlight great benefits for the integrated system of a common management of the balancing energy market
• The system cost is more that halved (55%), passing from 177,7 M€ (no balancing market) to 79,7 M€ in case a transnational balancing market is implemented; for Italy the cost reduction is of the 60%.
• A greater and better usage of interconnections: with this approach an implicit auction is implemented, and this allow an optimal usage of available interconnection capacity.
Gianluigi MigliavaccaHead of Transmission Planning Research Group
RSE S.p.A.via Rubattino,5420134 Milano
E-mail: [email protected]
Thank you for your attention…


![Gianluigi De Dea 1 [Compatibility Mode]](https://img.pdfslide.us/doc/110x75/589e62471a28ab1a548b4bd3/gianluigi-de-dea-1-compatibility-mode.jpg)